Abstract
With the wide application of power electronic devices and nonlinear loads, the resulting inter-harmonic pollution is becoming more and more serious in the power system. As important equipment in power systems, transformers have always been the focus of research. However, there are few studies on the abnormal increase in vibration and noise caused by inter-harmonic excitation. In this work, a transformer core vibration and noise measurement platform that can generate arbitrary inter-harmonic excitations was built. The real-time vibration displacement waveforms of the core model under normal and inter-harmonic conditions were experimentally measured as well as the surrounding noise level amplitude and spectrum analysis result. The influence law of excitation of intermediate harmonic content and frequency on core vibration displacement and surrounding sound pressure level was summarized. The work of this paper lays a theoretical foundation for studying the vibration and noise of power transformers and other equipment under inter-harmonics.
1. Introduction
Power inter-harmonic refers to any harmonic whose frequency is not an integer multiple of the fundamental frequency, and the inter-harmonic whose frequency is less than the fundamental frequency is usually called sub-harmonic [1]. Common main sources are nonlinear loads, inverter speed governors, and sub-synchronous oscillation of wind turbines [2,3], etc. Among them, the inter-harmonic frequency generated by common nonlinear loads is 0~50 Hz; the inter-harmonic frequency generated by the frequency conversion device is a discrete value related to the sum or difference of the input and output side frequencies, the inter-harmonic generated by the sub-synchronous oscillation of the wind turbine. The frequency is generally less than the synchronization frequency of 50 Hz. As the main equipment of the power system, the transformer is bound to be affected by inter-harmonics. The existence of inter-harmonics will cause many problems, such as premature saturation of the transformer core, severe distortion of the excitation current, increased vibration, and an abnormal increase in noise.
At present, many scholars have carried out a lot of research on transformer vibration and noise. Through experimental research, literature [4,5] concludes that the main reason for transformer vibration and noise is iron core magnetostriction; literature [6,7] studied the vibration and noise of transformer core under power frequency sinusoidal excitation; literature [8,9,10,11] studied the magnetostriction of the material and the magnetization state and vibration of the iron core under DC bias; literature [12,13,14] studied the vibration noise of the transformer core under harmonic and DC bias excitation. Many scholars have simulated the vibration and noise values of transformers and reactors through multiphysics coupling software [15,16,17]; literature [18,19] analyzed the influence on the electromagnetic vibration characteristics of equipment by simulating the condition of each harmonic by superimposing harmonics of fundamental wave excitation; literature [20] systematically studied the magnetization characteristics and loss characteristics of electrical steel materials under excitation with inter-harmonics. However, research on the influence of inter-harmonics on power transformers is still rare, so it is very important to measure the vibration and noise characteristics of transformer cores under the action of inter-harmonics.
In this paper, the inter-harmonic influences on transformer core vibration and noise are studied through experiments. A core model laminated by oriented silicon steel sheets was made, and core vibration and noise experiments were carried out. The effects of inter-harmonic frequency and content on transformer core vibration and noise were analyzed. At present, there is little research on transformer core vibration and noise under inter-harmonic excitation. The experimental platform and experimental methods in this paper can provide a reference on transformer core vibration and noise under inter-harmonic excitation.
2. Experimental Methods
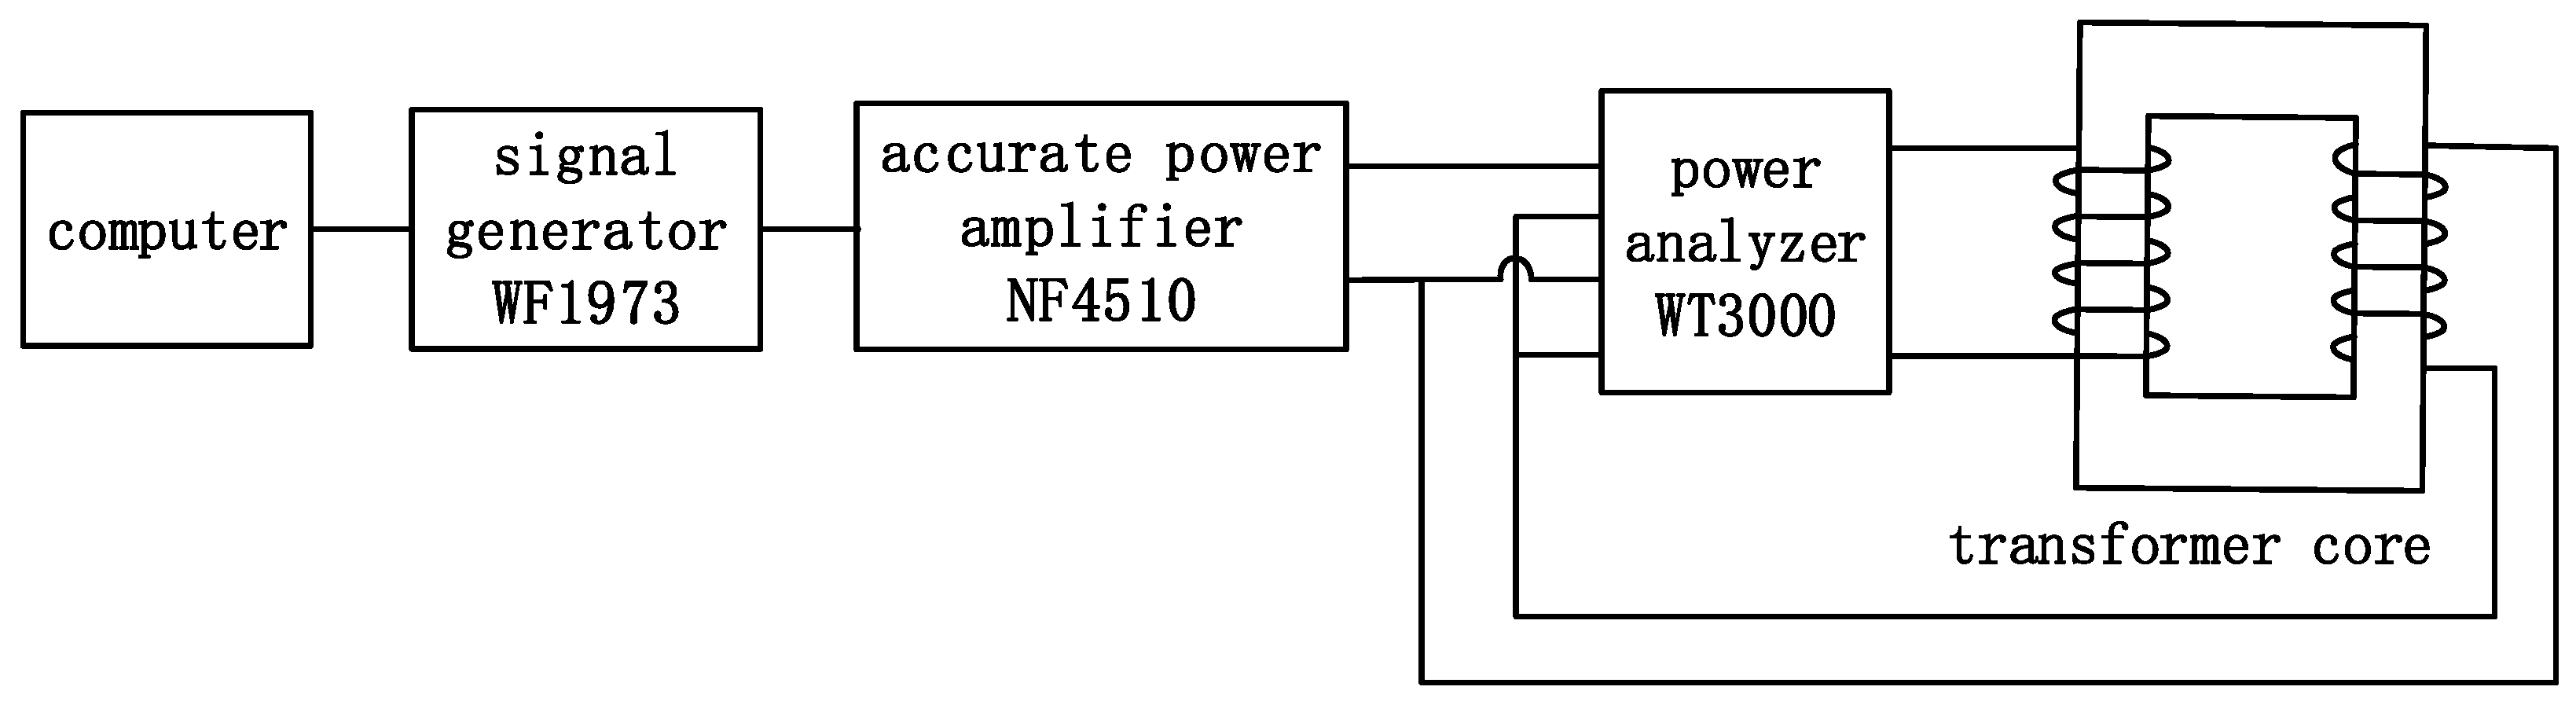
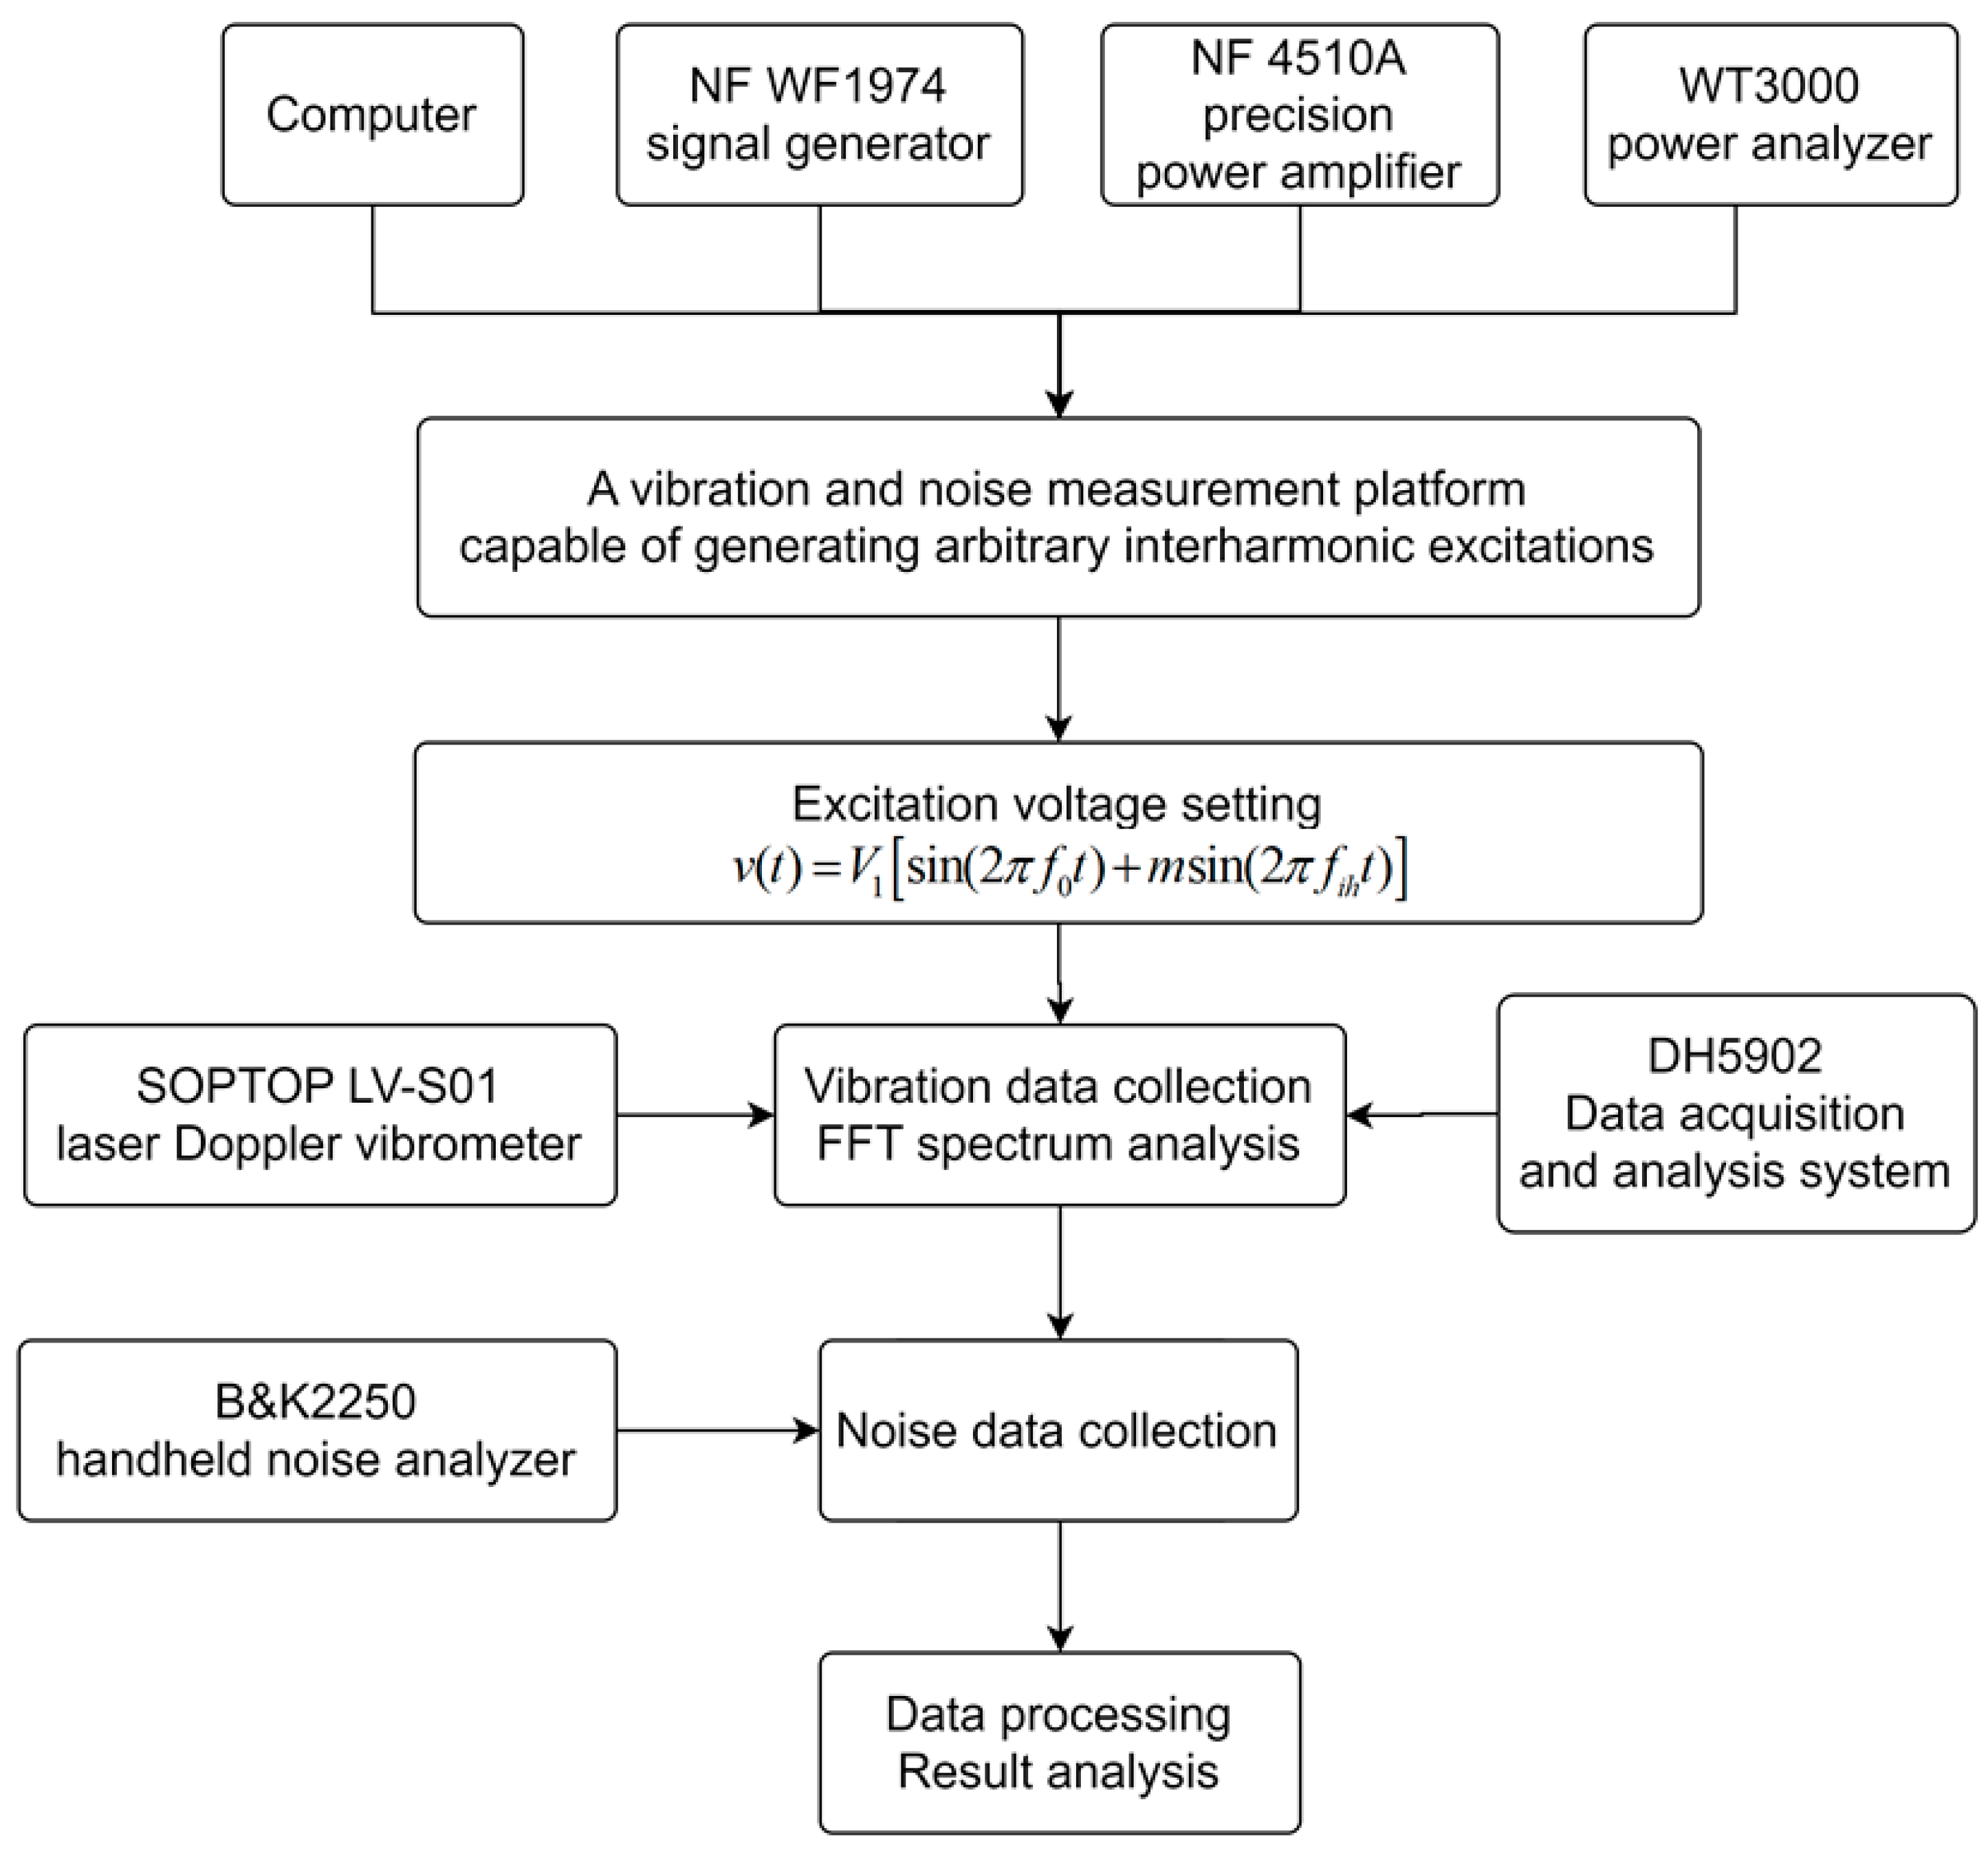
2.1. Experimental Scheme
This paper has built a vibration measurement platform that can generate arbitrary inter-harmonic excitation. Inter-harmonics with different contents and frequencies are set, and vibration and noise measurement experiments are carried out under this excitation. The experimental flow chart is shown in Figure 1.
Figure 1.
Experimental flow chart.
The experimental circuit is shown in Figure 2, and the equipment parameters are shown in Table 1. The transformer core model is made of B27R085 silicon steel sheet, which is commonly used in distribution transformers. The winding turns on both core legs are 30 turns. The model size is shown in Figure 3.
Figure 2.
Experimental circuit.
Table 1.
Parameters of instruments.
Figure 3.
Dimensions of transformer core model.
In Figure 3, pure iron stack thickness is 66 mm; window height (A) is 130 mm; window width (B) is 70 mm; silicon steel sheet width (C) is 65 mm; core model stack thickness (D) is 68 mm; core overall width (E) is 200 mm; core overall height (F) is 260 mm.
The excitation voltage is given by
In Equation (1), V1 is the voltage amplitude, f0 is the fundamental voltage frequency of 50 Hz, fih is the inter-harmonic voltage frequency, and m is the inter-harmonic content. The experiment studied the influence of the frequency and content of inter-harmonics on the vibration characteristics of the transformer core by changing the parameters fih and m.
The main sources of common inter-harmonics are nonlinear loads, frequency converter speed control devices, and sub-synchronous oscillations of wind turbines. According to the above main sources of inter-harmonics, this part of the experiment sets the inter-harmonic content to 3%, that is, m = 0.03 unchanged. Take fih as: 2, 5, 7, 10, 15, 17, 20, 25, 30, 40, 45, and 53 Hz. Under the condition of introducing different inter-harmonic frequencies, the voltage amplitude is gradually increased from 0 to 50 V. During debugging, the vibration displacement of different measuring points is recorded, and the vibration displacement is analyzed by frequency spectrum.
In order to further analyze the influence of the inter-harmonic content on the vibration characteristics of the iron core, experiments were carried out under the conditions of inter-harmonic frequencies of 5, 20, and 40 Hz. Keep the inter-harmonic frequency constant, set the inter-harmonic content to 1%, 3%, and 5%, respectively, and compare and study the peak-to-peak variation of the core vibration under the same voltage amplitude.
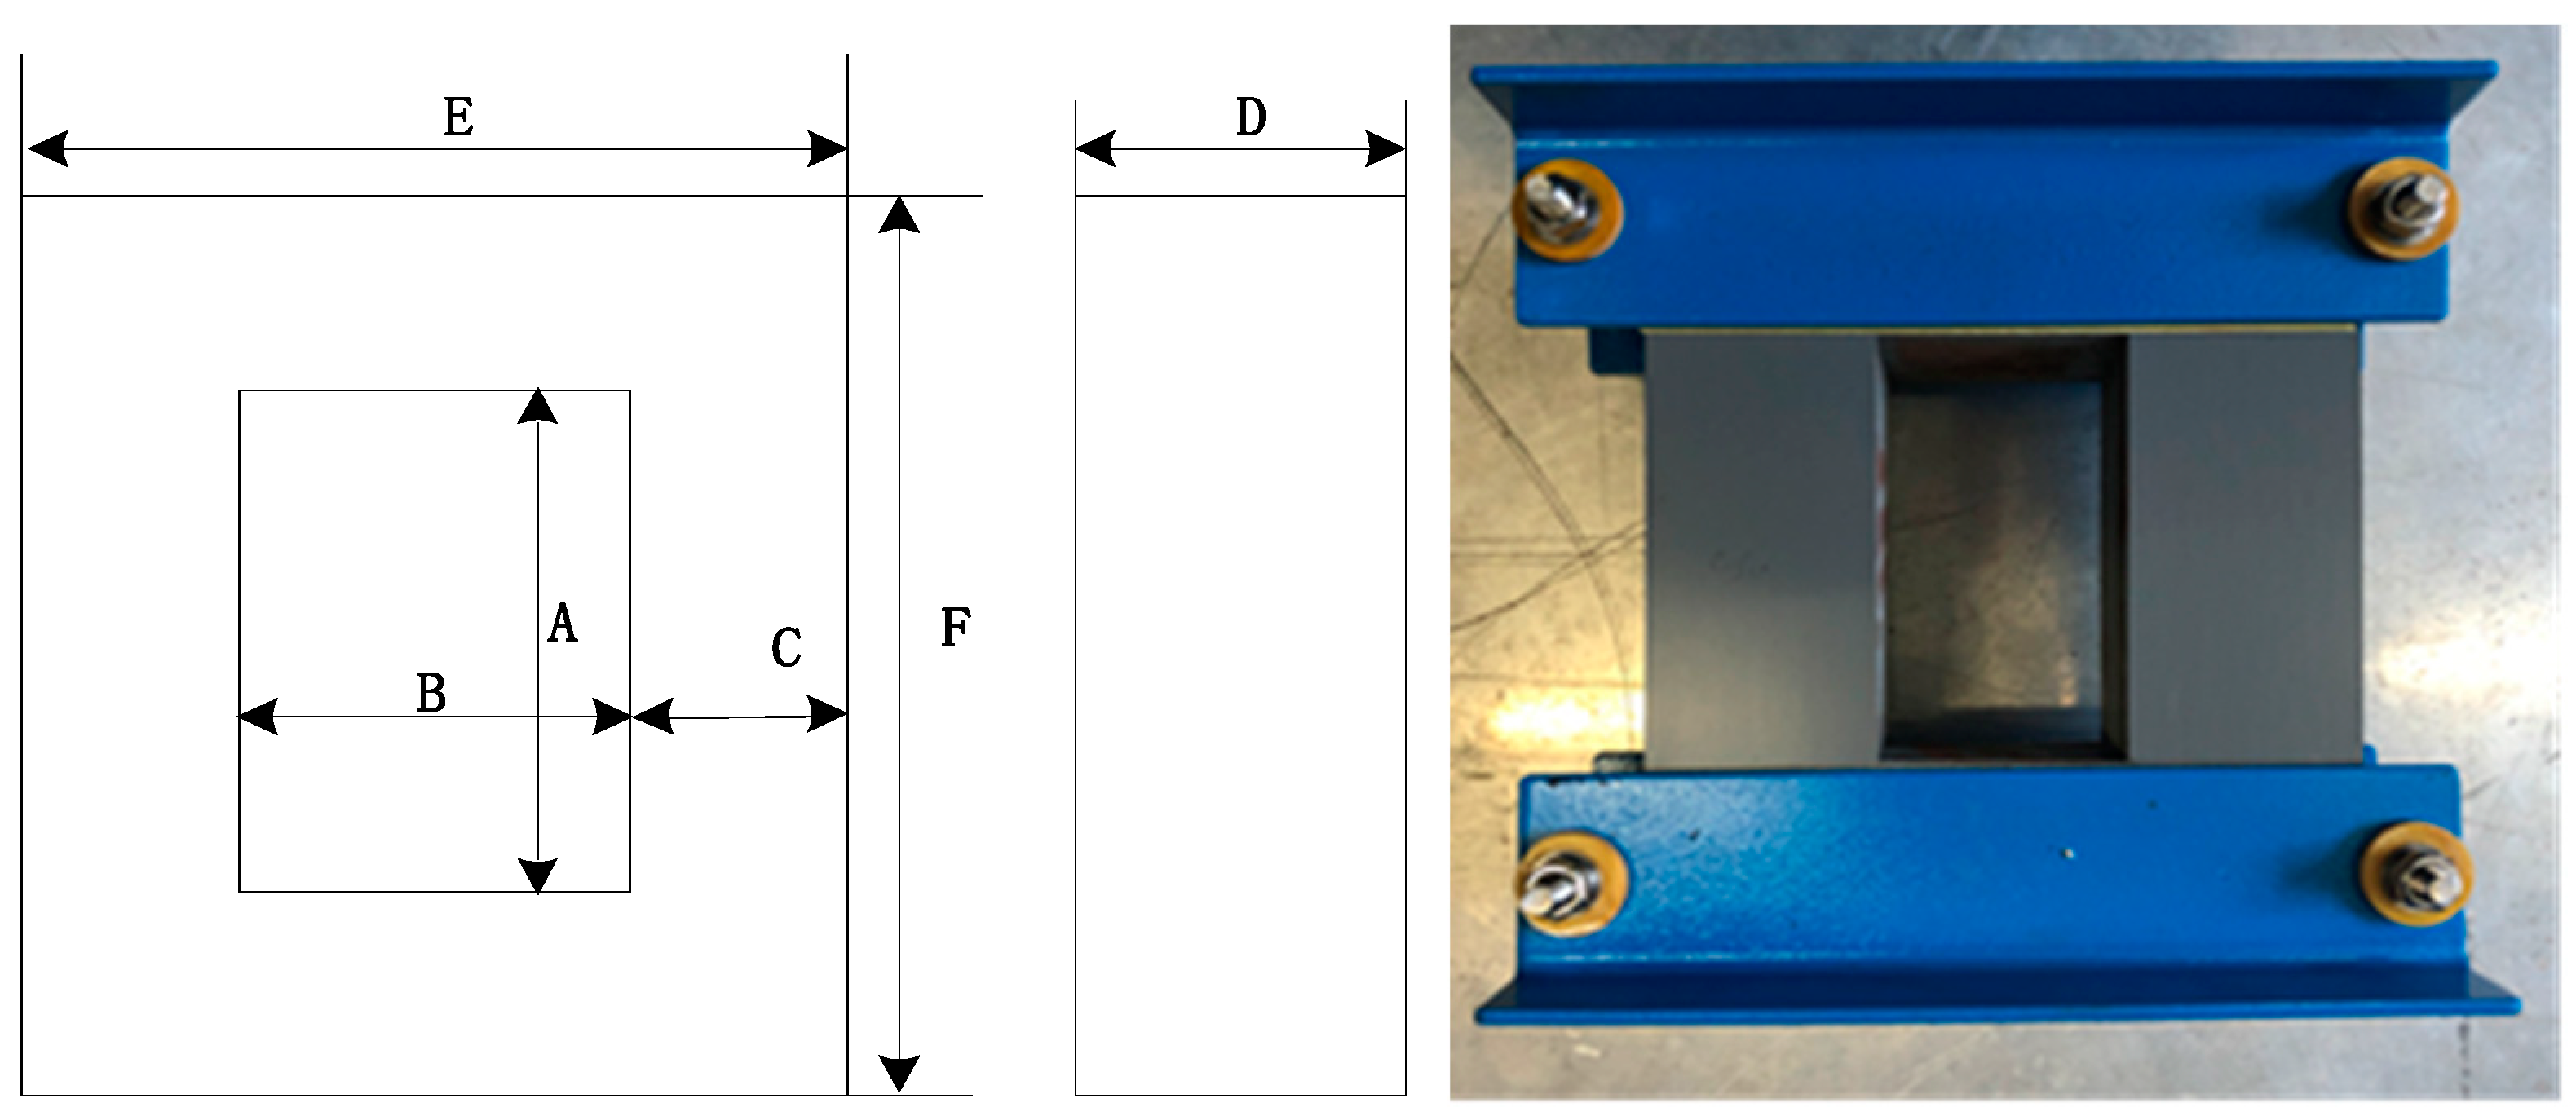
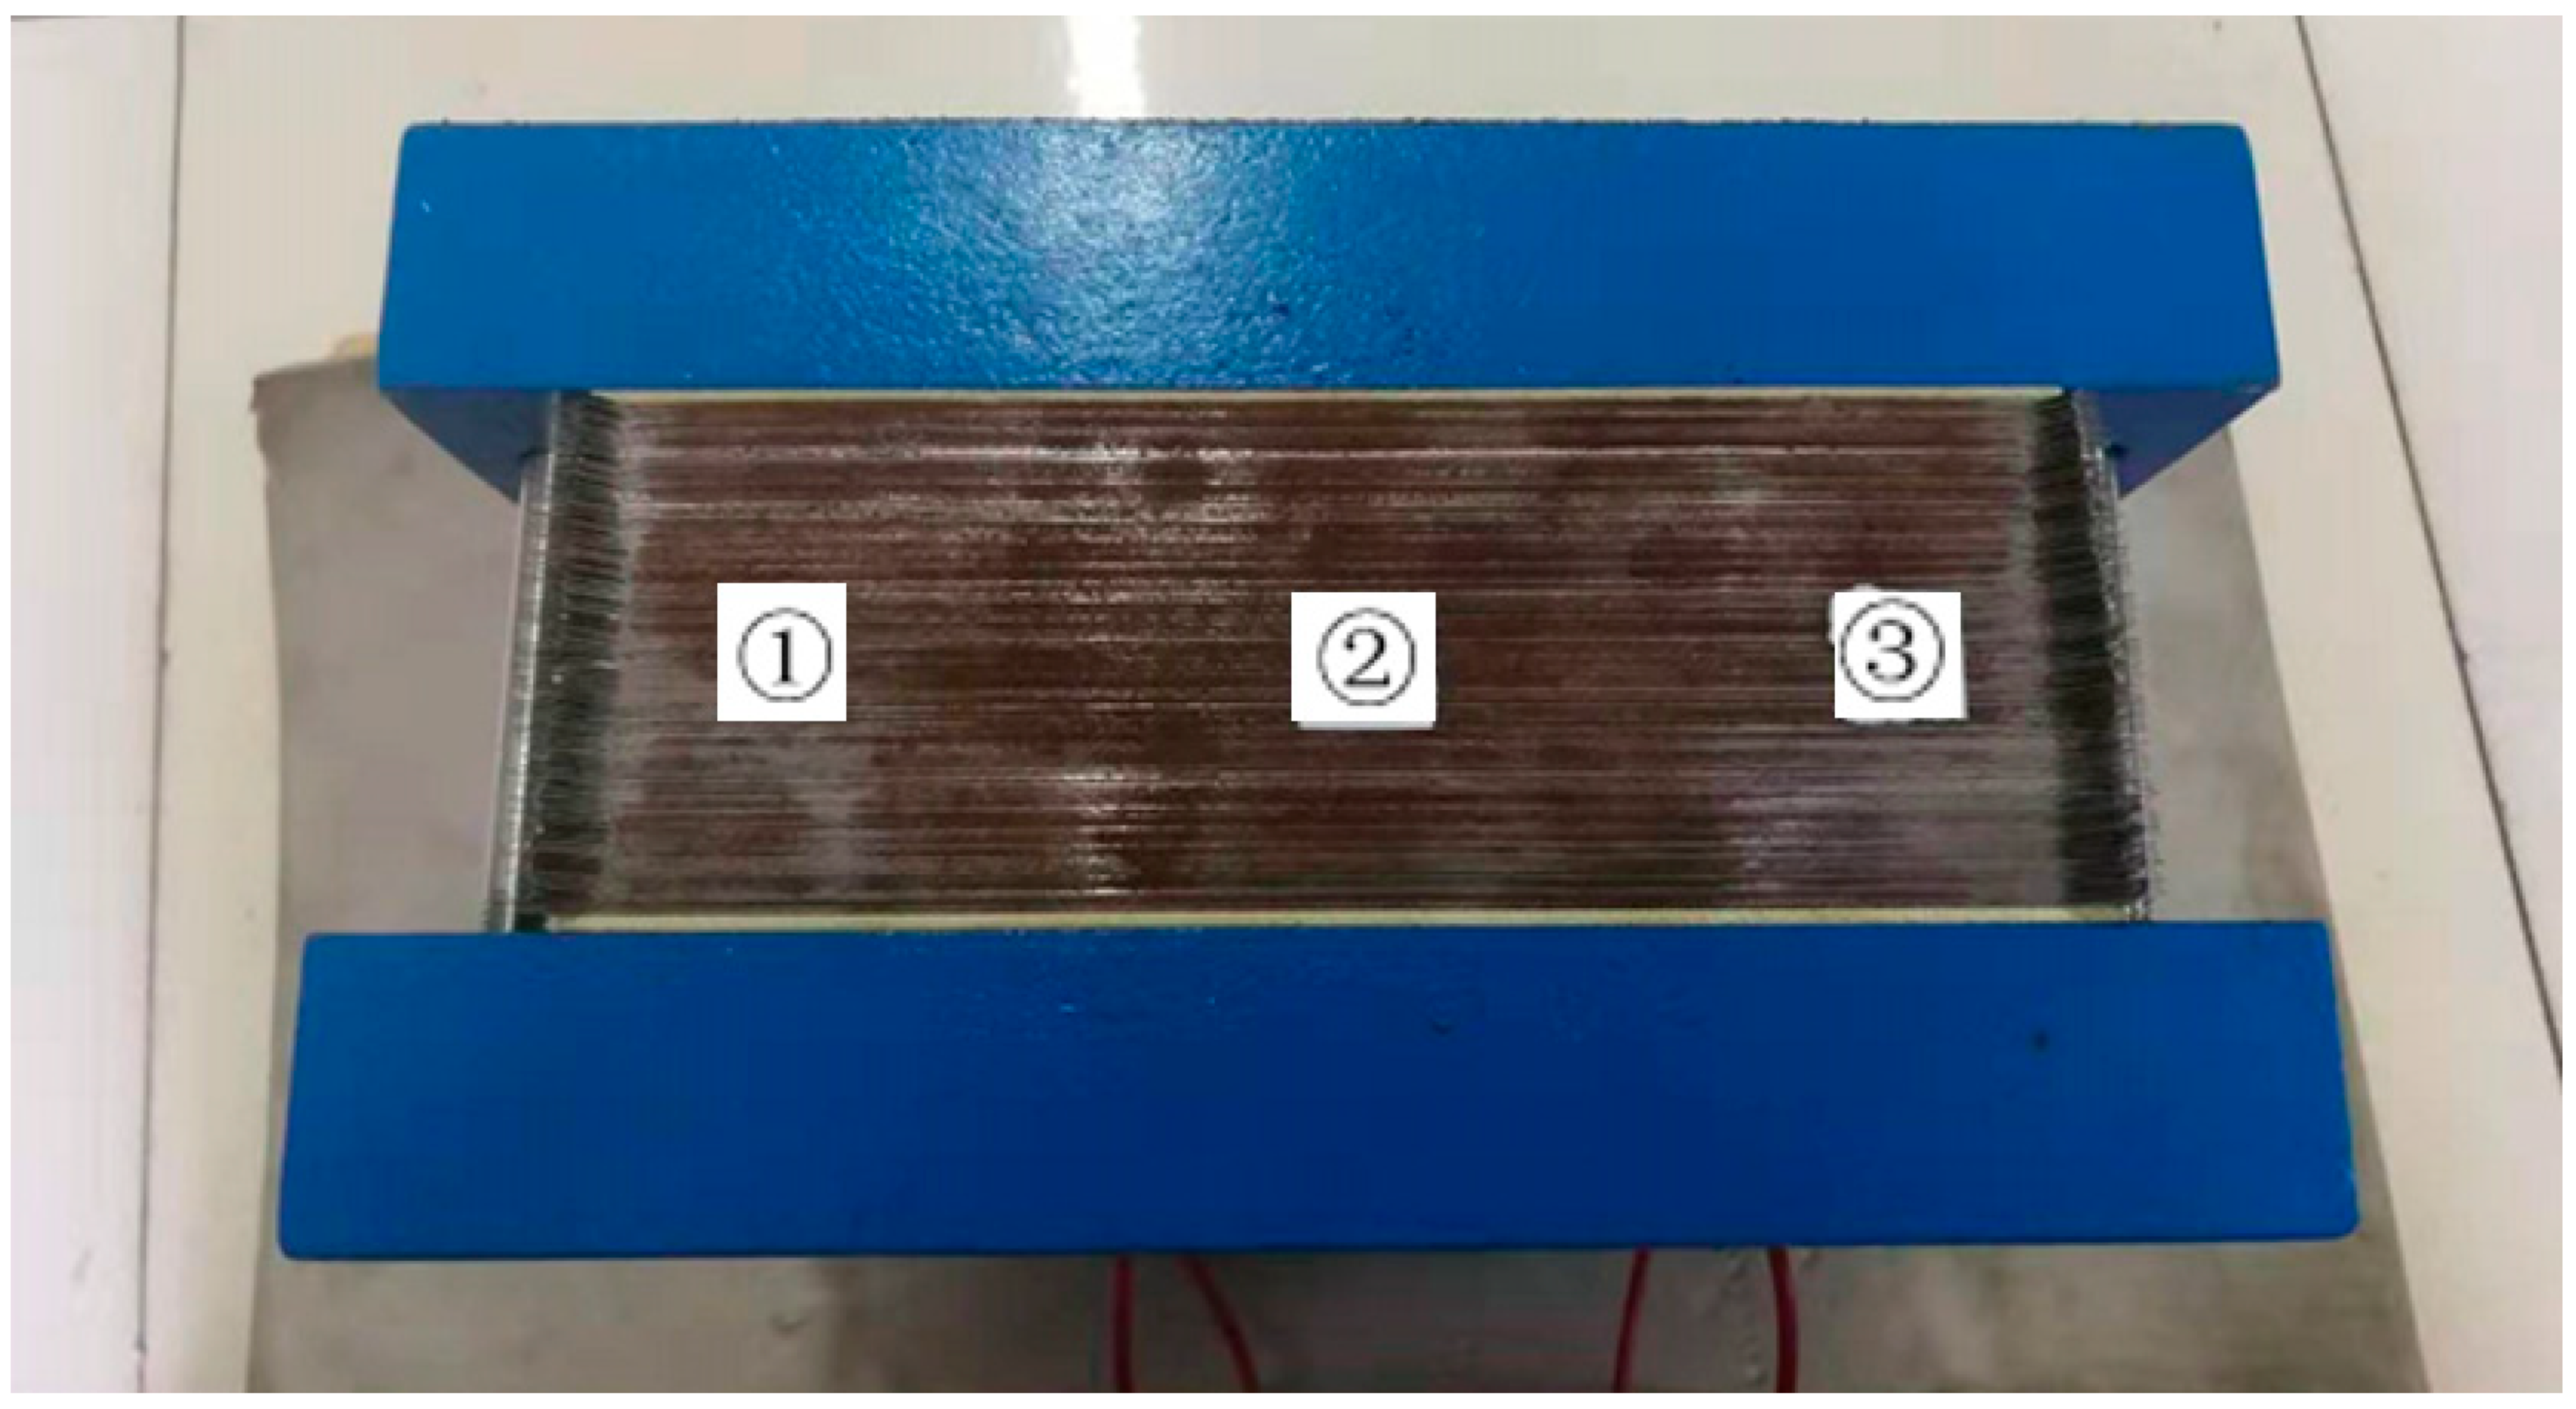
2.2. Transformer Core Vibration Experiment
The experiment uses SOPTOP LV-S01 laser Doppler vibrometer and DH5902 data acquisition and analysis system for vibration data acquisition and FFT spectrum analysis. Before the experiment, the laser reflection acceptance rate was adjusted and stabilized above 70%, the secondary side of the transformer core was set to a no-load state, and the voltage amplitude was gradually increased. When the real-time vibration signal is observed to be stable through the external supporting software, the vibration waveform of the measuring point is collected, and the measured velocity signal is integrated to obtain the displacement waveform.
Due to the rotating magnetic flux at the corner of the iron core, the direction of part of the magnetic flux is perpendicular to the rolling direction, and the vibration displacement is more obvious than other parts. In order to study the overall vibration characteristics of the iron core, three different measuring points located in the middle and both sides of the iron yoke were selected in the iron yoke. The distribution of the measuring points is shown in Figure 4.
Figure 4.
Distribution of vibration displacement measuring points.
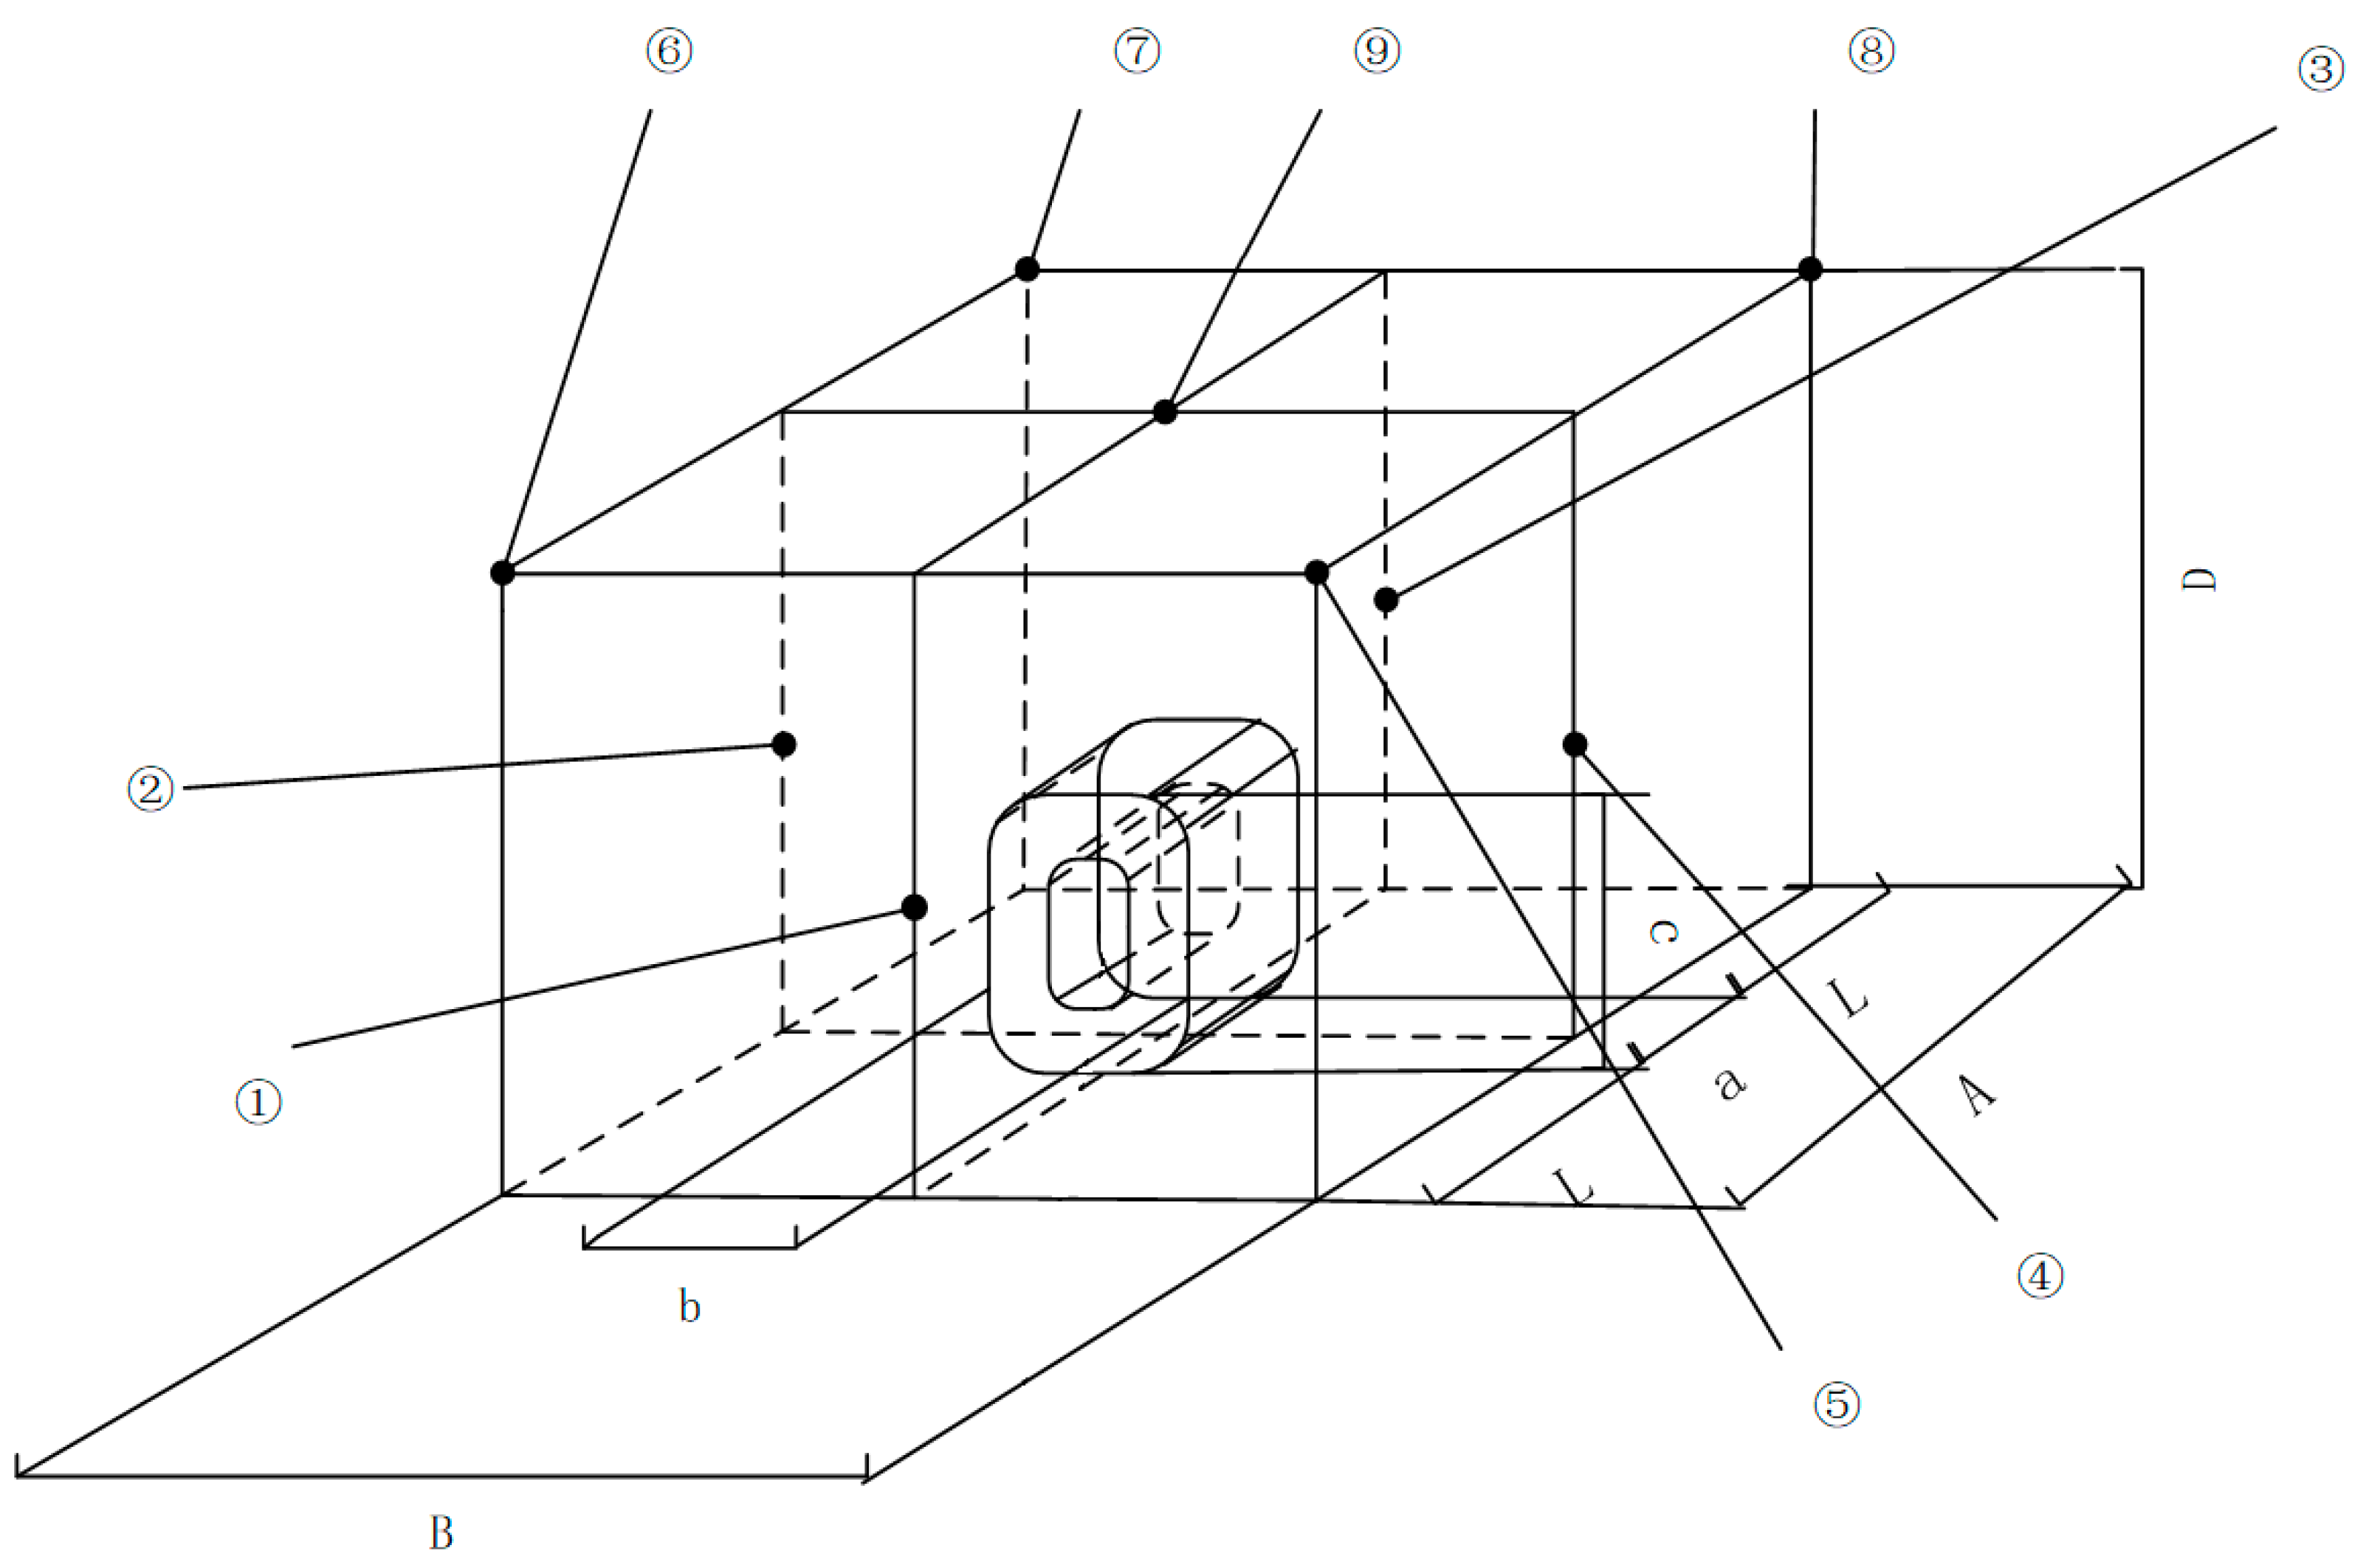
2.3. Transformer Core Noise Experiment
According to the national standard “GB/T1094.10-2003” [21], the B&K2250 handheld noise analyzer was used to measure 9 measuring points around the transformer in the noise measurement scheme. The distribution of the measuring points is shown in Figure 5. The probe of the sound level meter is measured at a distance of 0.3 m from the measuring surface of the transformer, and the axis direction is perpendicular to the measuring surface.
Figure 5.
Distribution of noise measuring points. In the picture, a = 142 mm, b = 200 mm, c = 260 mm, L = 300 mm, A = 142 + 300 + 300 = 742 mm, B = 200 + 300 + 300 = 800 mm, D = 260 × 2 = 520 mm.
The test time for each measuring point is continuous 60 s. After all the measurements are completed, the average value of the noise of the 9 measuring points is the A-weighted noise sound pressure value of the transformer core. In order to avoid interference from the operation noise of other equipment, the iron core is placed in another laboratory with a better sound insulation effect. The background noise of the measurement result is about 17 dB. The environment in which the noise experiment was carried out had some background noise interference, so the background noise of 9 points was measured and the measurement results were corrected. Correct the influence of the background noise on the measured transformer noise according to Table 2, and record the noise spectrum of each measuring point.
Table 2.
Correction of background noise.
3. Results and Discussion
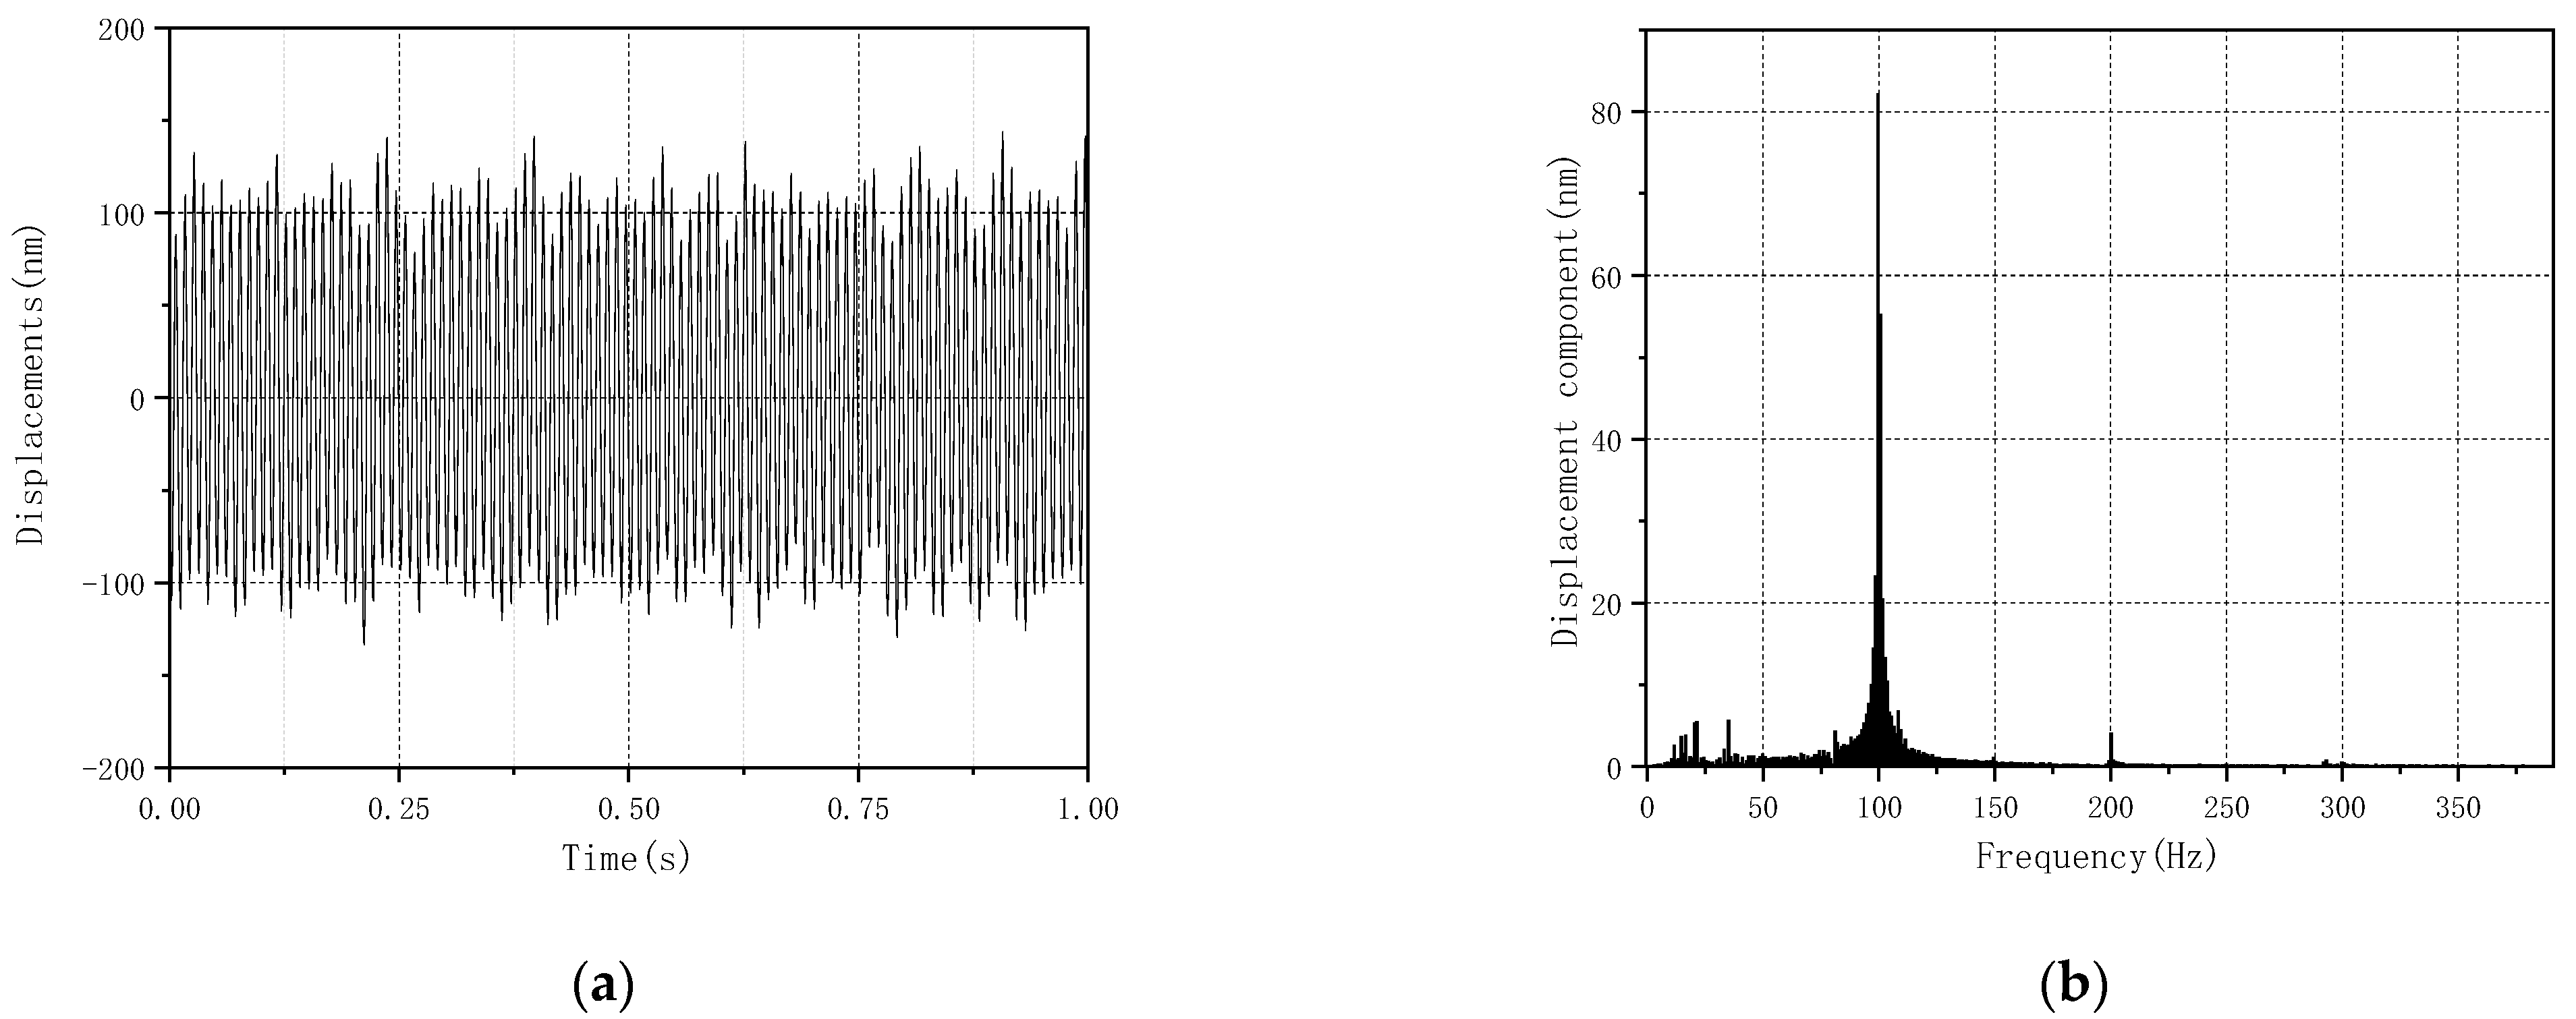
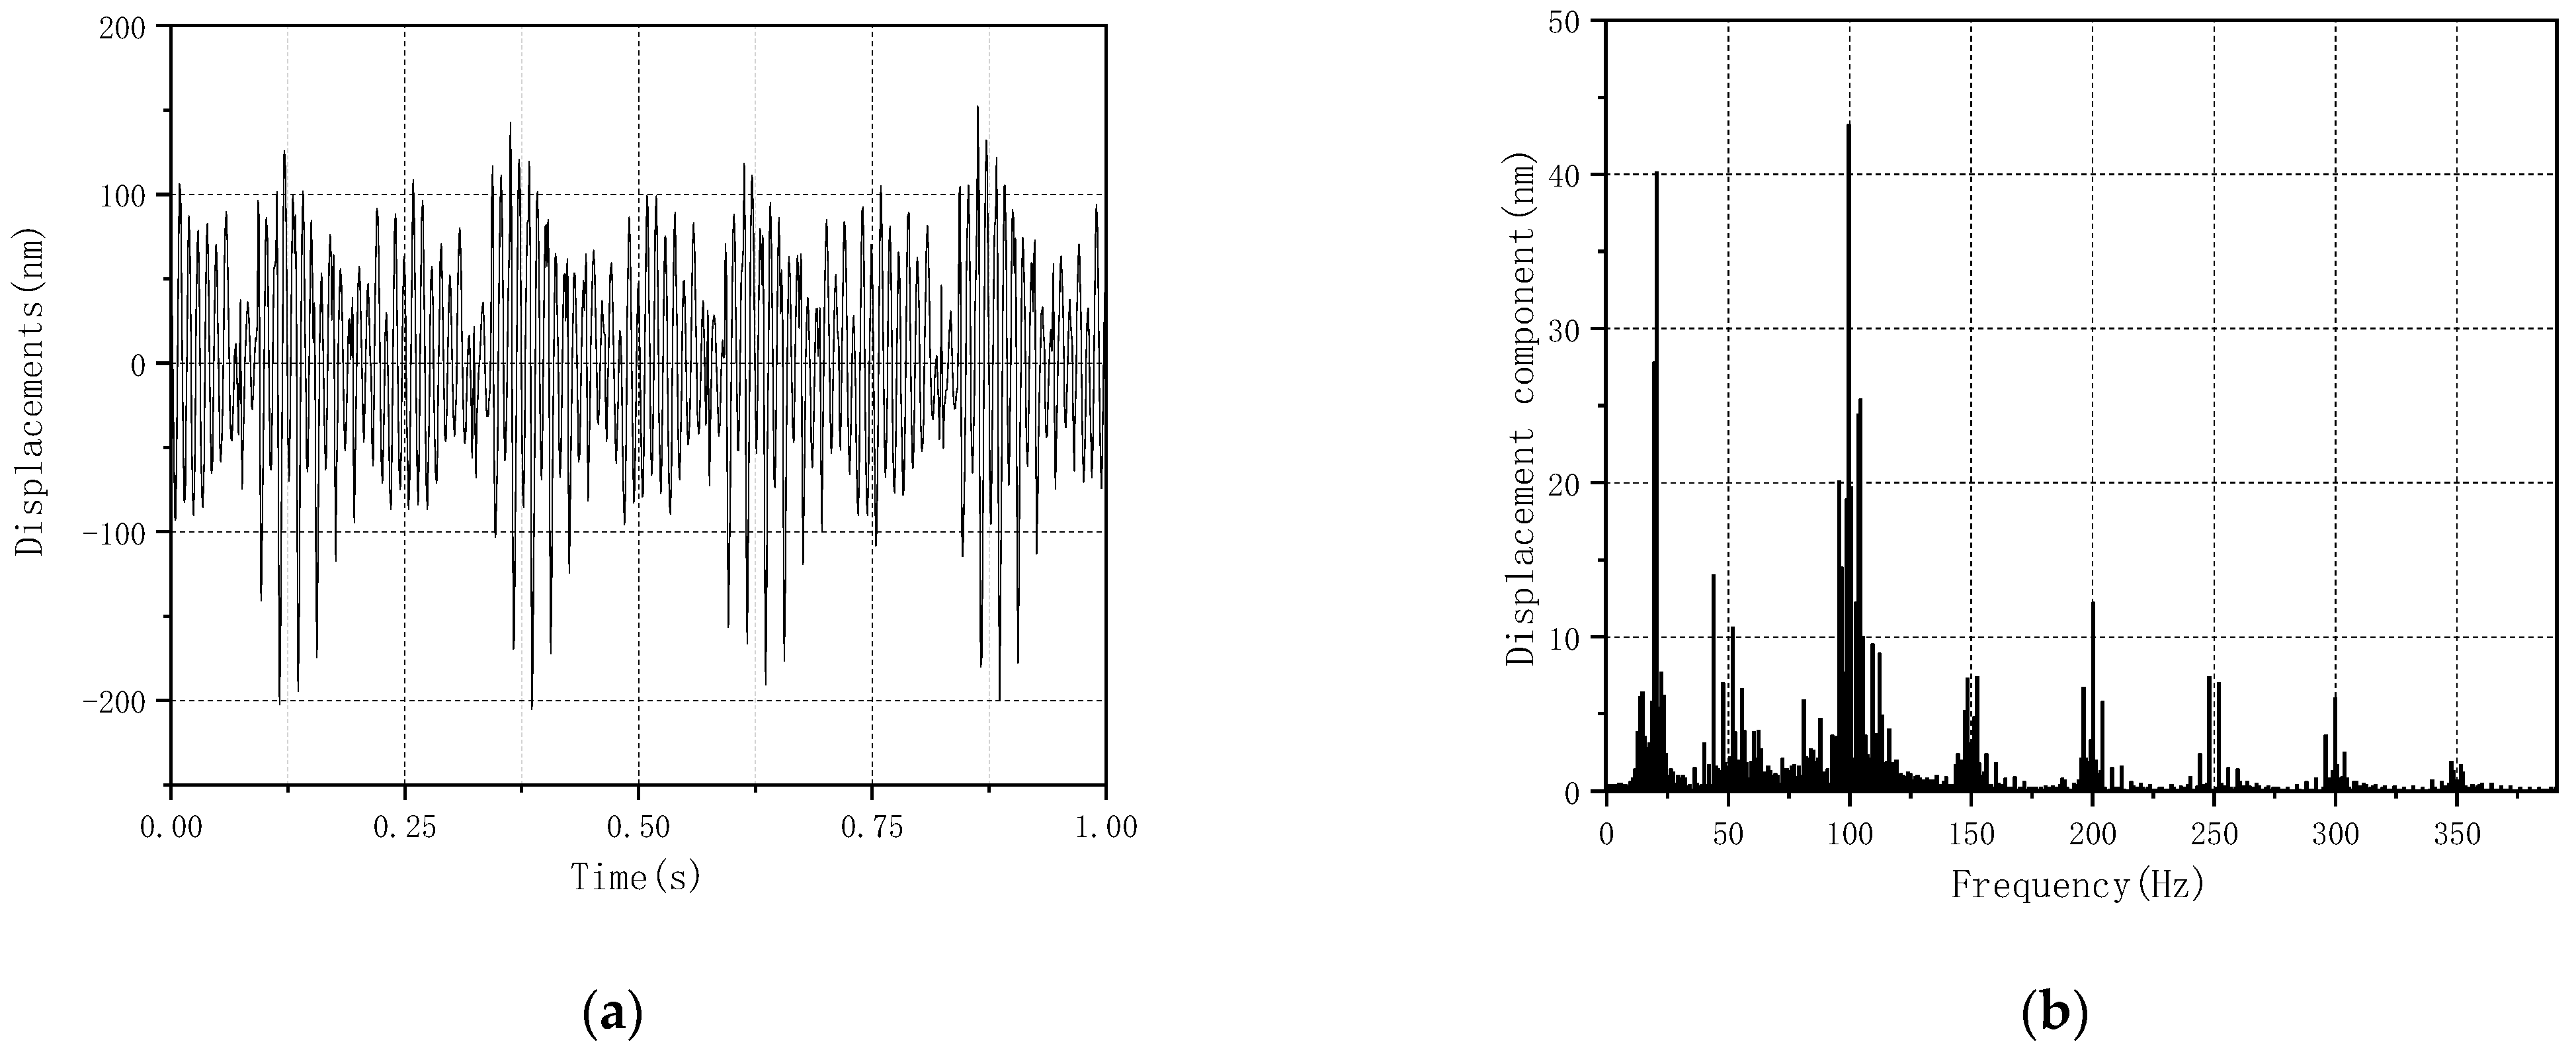
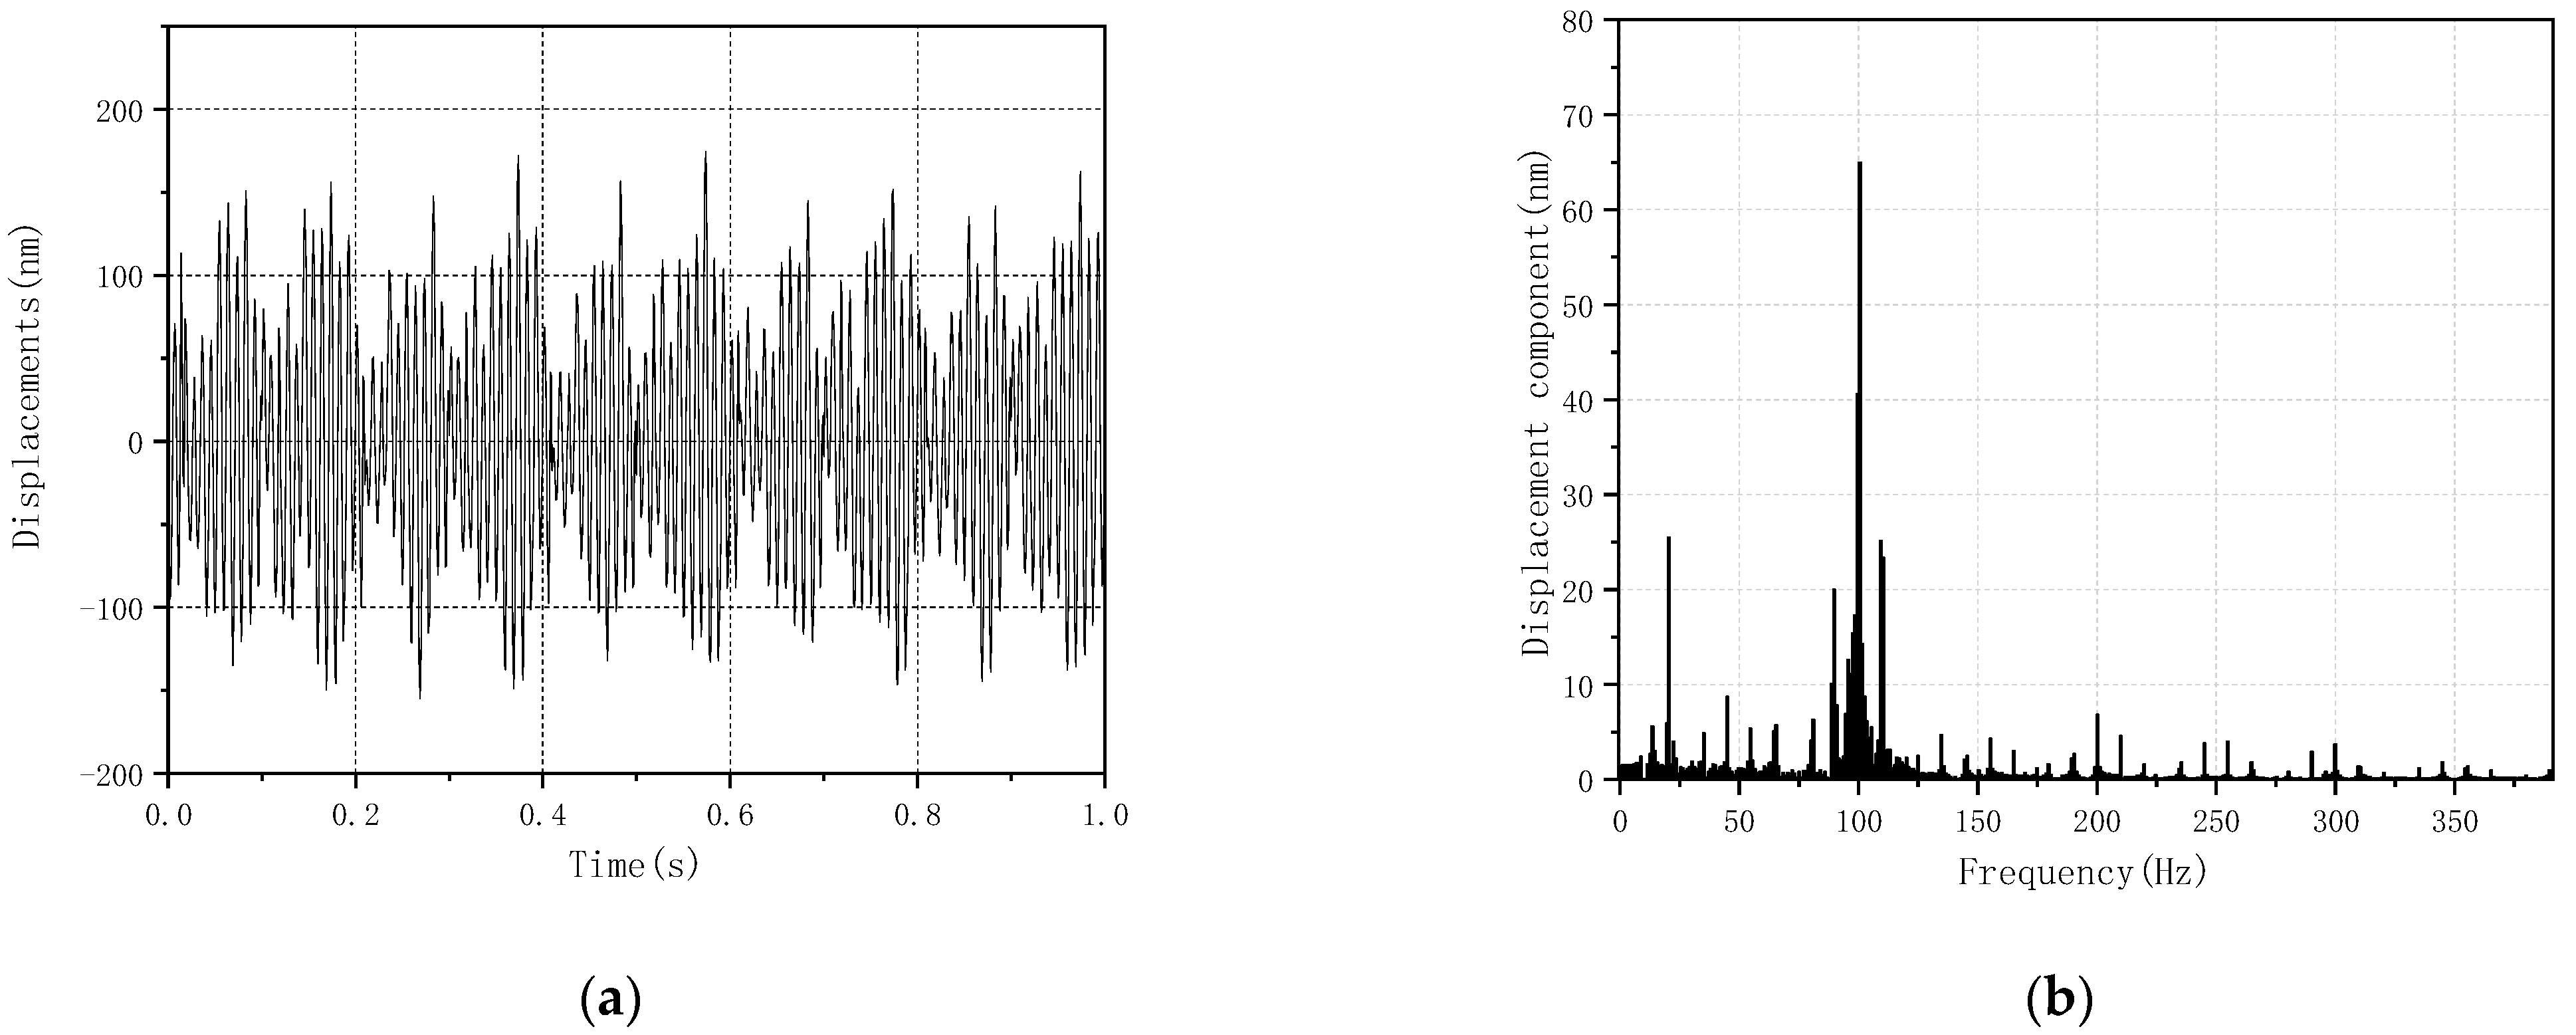
3.1. Inter-Harmonic Frequency Influence on Core Vibration
As the voltage gradually increases, the inter-harmonic content reaches 3%. The relationship between the peak-to-peak value of the vibration displacement of measuring point 1 and the inter-harmonic frequency contained in the excitation is shown in Figure 6.
Figure 6.
The peak-to-peak value of core vibration displacement.
From the overall trend analysis in the figure, it is found that the lower the inter-harmonic frequency, the greater the peak-to-peak value of the core vibration displacement, but in different frequency ranges, the increase in amplitude varies greatly. When the frequency of inter-harmonics is less than 20 Hz, the amplitude of vibration increase is much greater than when the frequency is greater than 20 Hz. For example, when the fundamental voltage amplitude is 50 V, the peak-to-peak displacement under excitation with 2 Hz inter-harmonic component is 450.3 nm, which is 1.8 times that of excitation without an inter-harmonic component. The excitation with 20 Hz inter-harmonics is only 1.05 times the peak-to-peak value of vibration without inter-harmonic excitation.
Figure 7 shows the time-domain waveform of the vibration displacement of measuring point 1 without inter-harmonic excitation. It can be seen from Figure 7b that when the transformer core is in normal working conditions, the frequency spectrum is mainly concentrated on even-numbered components such as 100 Hz and 200 Hz. It also contains a small number of odd harmonics, and they are basically concentrated below 500 Hz. Due to the experimental environment and core resonance, there are some interference signals in the range of less than 20 Hz. The existence of interference signals may be caused by problems such as experimental equipment and the iron core manufacturing process. When the excitation does not contain inter-harmonics, there will be some interference signals in the spectrogram, and the difference between the interference signal and the main signal is about ten times, so it is considered that the interference signal will not affect the experimental results.
Figure 7.
Vibration displacement of iron core without inter-harmonics; (a) time-domain waveform; (b) spectrum analysis.
Since the inter-harmonics below 20 Hz have a greater impact on vibration, the experimental results containing low-frequency inter-harmonics are mainly analyzed. Figure 8 and Figure 9 show the time-domain waveform diagram and spectrum analysis diagram of the core vibration displacement within 1 s when the excitation contains 2 Hz and 5 Hz inter-harmonics.
Figure 8.
Vibration displacement of iron core with 2 Hz inter-harmonics in excitation; (a) time-domain waveform; (b) spectrum analysis.
Figure 9.
Vibration displacement of iron core with 5 Hz inter-harmonics in excitation; (a) time-domain waveform; (b) spectrum analysis.
It can be seen from the time-domain diagram that when the excitation voltage contains single-frequency inter-harmonics, the vibration displacement forms a periodic image with 2f0 as the single vibration frequency and 2fih as the overall vibration frequency in the time-domain. It is found from spectrum analysis that a single frequency inter-harmonic voltage will cause a large number of inter-harmonic components in the transformer core vibration. Considering that the resonant frequency of the transformer core itself is around 20 Hz and that some interference signals are brought by the experimental environment, the lower frequency components are mainly concentrated around 20 Hz. In the frequency range greater than 30 Hz, the relationship between the excitation intermediate harmonic and the vibration intermediate harmonic frequency is shown in Table 3.
Table 3.
Inter-harmonic frequency in vibration.
According to the results obtained by the FFT decomposition of the vibration displacement data, it can be seen that the inter-harmonic frequency components in the vibration exist in pairs on both sides of an integer multiple of the fundamental frequency. Summarize the relationship between the excitation intermediate harmonic frequency and the inter-harmonic frequency components existing in the vibration displacement as:
Among them, fv represents the inter-harmonic frequency components existing in the core vibration spectrum, f0 represents the fundamental voltage frequency with a frequency of 50 Hz, and fih represents the inter-harmonic voltage frequency.
Therefore, the vibration displacement waveform and frequency spectrum of the transformer core can be used to determine whether the transformer excitation contains inter-harmonic components.
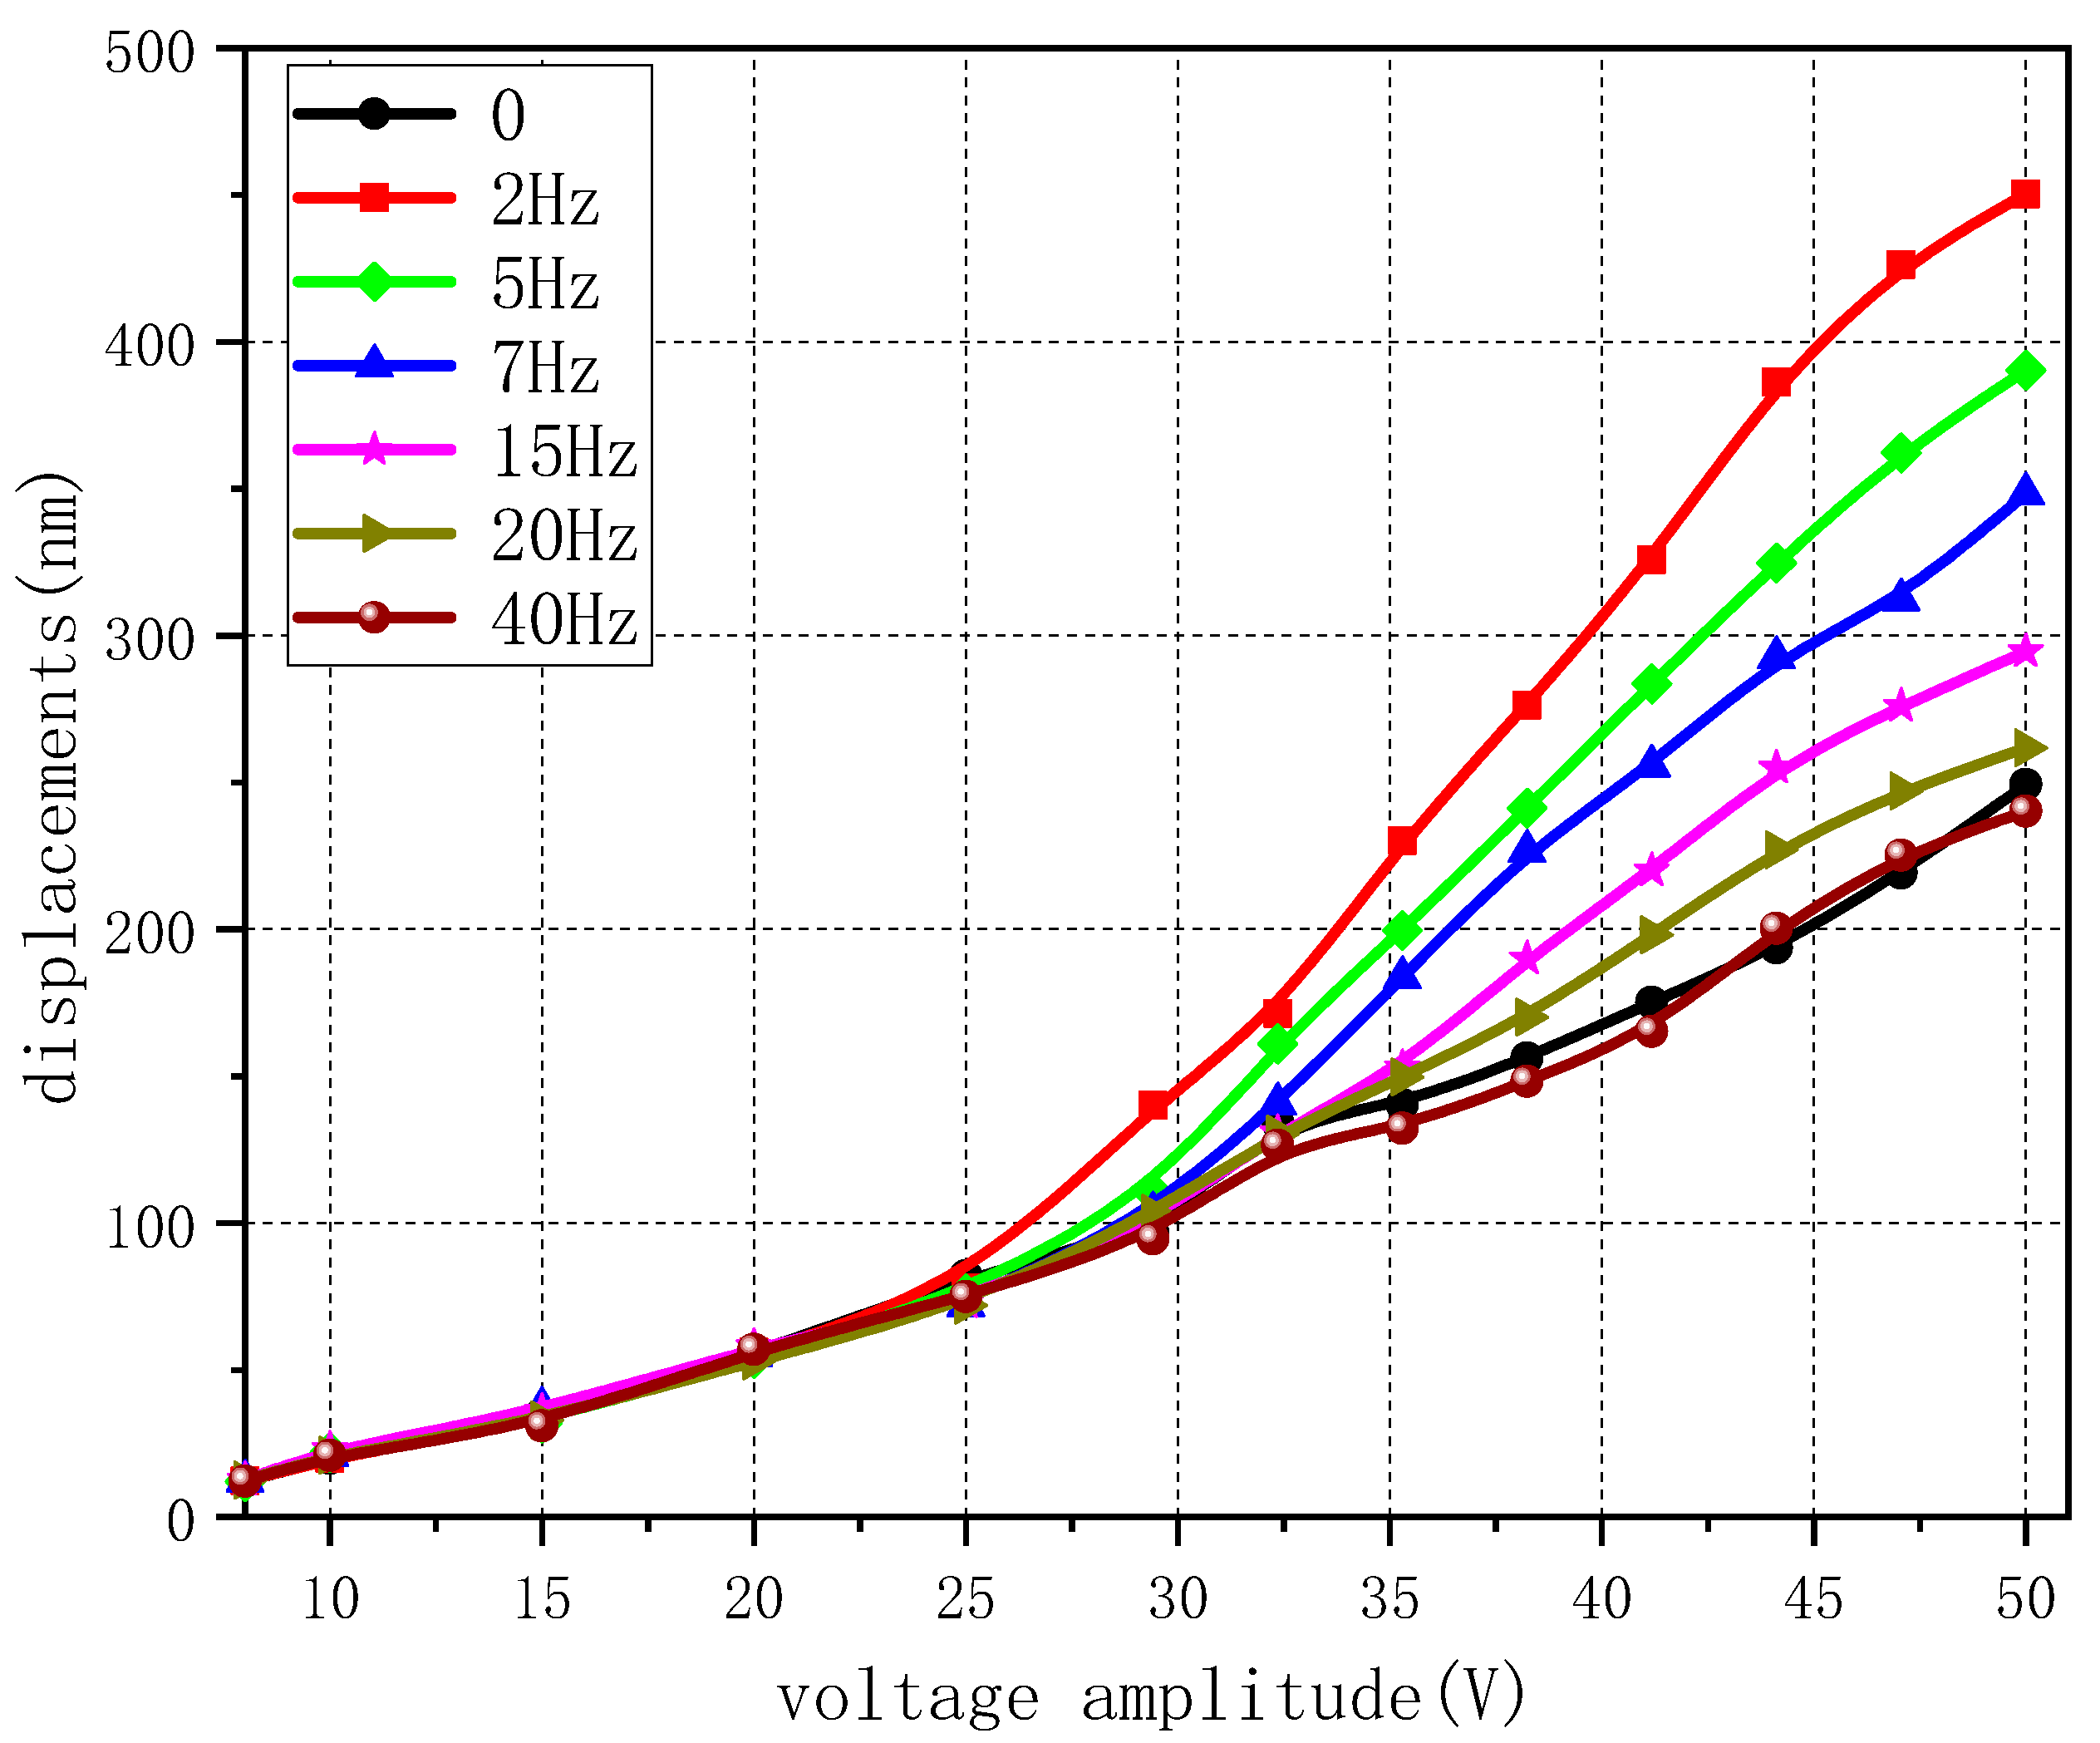
3.2. Inter-Harmonic Content Influence on Core Vibration
In the excitation, the inter-harmonics with the same frequency and different content are added respectively. The comparison results of the peak-to-peak displacement of the transformer core under the same voltage amplitude are shown in Table 4 and Table 5.
Table 4.
Peak-to-peak vibration displacement with voltage amplitude of 41.18 V.
Table 5.
Peak-to-peak vibration displacement with voltage amplitude of 44.12 V.
It can be seen that the vibration of measuring point 1 and measuring point 3 is more severe than measuring point 2, but from the general trend of the three measuring points, the same conclusion is obtained: when the inter-harmonic content increases, the vibration displacement gradually increases, especially when the frequency is less than 20 Hz inter-harmonic excitation, and the increasing speed will be more obvious when the voltage amplitude is large. For example, when the voltage amplitude is 41.18 V, when the excitation contains 5 Hz inter-harmonics, the peak-to-peak vibration displacement of 5% of the harmonic content is 1.8 times that of the content of 1%. In contrast, the 20 Hz inter-harmonics reaches 1.34 times. The 40 Hz inter-harmonic is only 1.17 times. When the voltage amplitude is 44.12 V, the above-mentioned ratio reaches 2.17 times, 1.49 times, and 1.35 times.
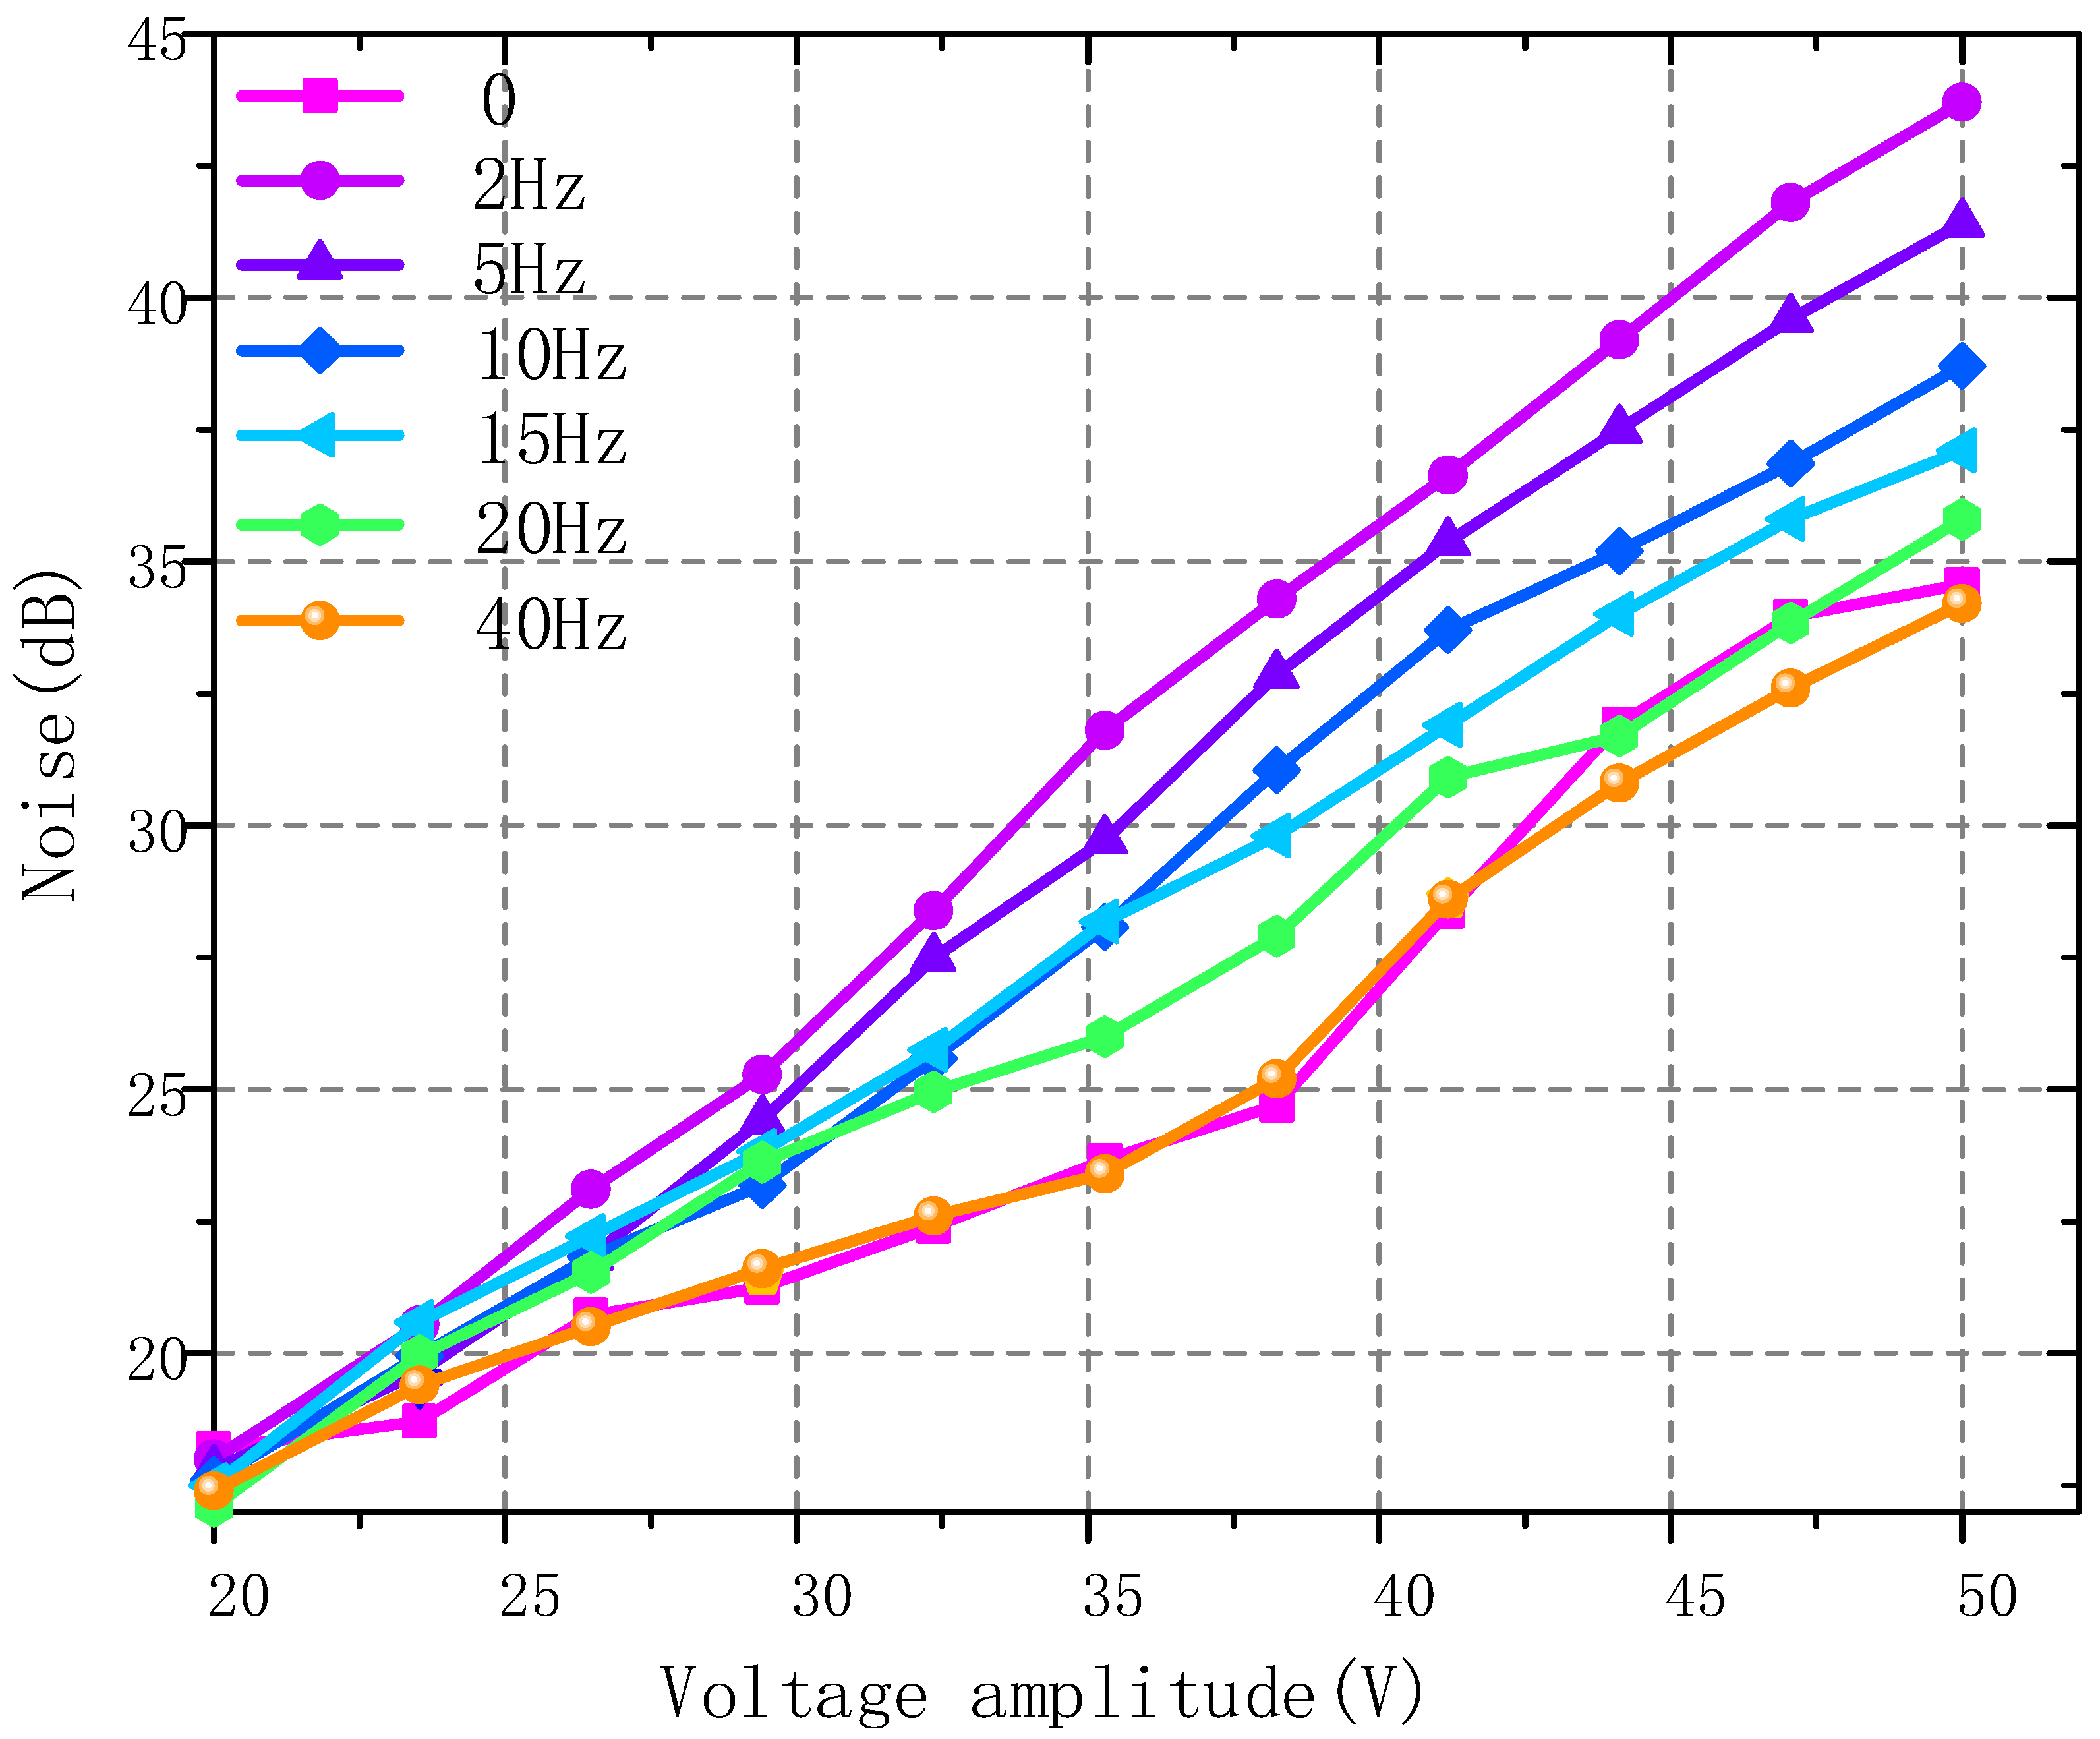
3.3. Inter-Harmonic Frequency Influence on Core Noise
In the noise characteristic research, similar to the vibration characteristic experimental scheme, the inter-harmonic content in the excitation is 5% of the fundamental wave, that is, m = 0.05. The inter-harmonic frequencies contained in the excitation are respectively taken as: 2, 5, 10, 15, 20, and 40 Hz. Under different inter-harmonic frequency conditions, gradually increase the voltage amplitude from 0 to 50 V, use a sound level meter to record at different measurement points, and use supporting software to perform spectrum analysis on the measured values. The change of the transformer noise level with the increase of the excitation fundamental wave amplitude is shown in Figure 10 when the inter-harmonic content is 5%.
Figure 10.
Noise level of iron core.
The overall change trend of the noise sound pressure level of the transformer core model is similar to the conclusion obtained from the vibration experiment. When the voltage amplitude is less than 25 V, the noise is basically environmental noise, and the influence of inter-harmonics is small. However, as the voltage amplitude increases, the influence of inter-harmonics on the noise of the transformer becomes more serious. The lower the inter-harmonic frequency, the greater the amplitude of the core noise level and the faster its growth rate. Especially for inter-harmonics with a frequency less than 20 Hz, the noise increases by 2 dB to 3 dB for every 3 V increase in voltage, and the growth rate is significantly greater than the inter-harmonics with a frequency greater than 20 Hz. When the voltage amplitude is 50 V, the noise level with 2 Hz inter-harmonic excitation is 9 dB higher than that without inter-harmonic excitation.
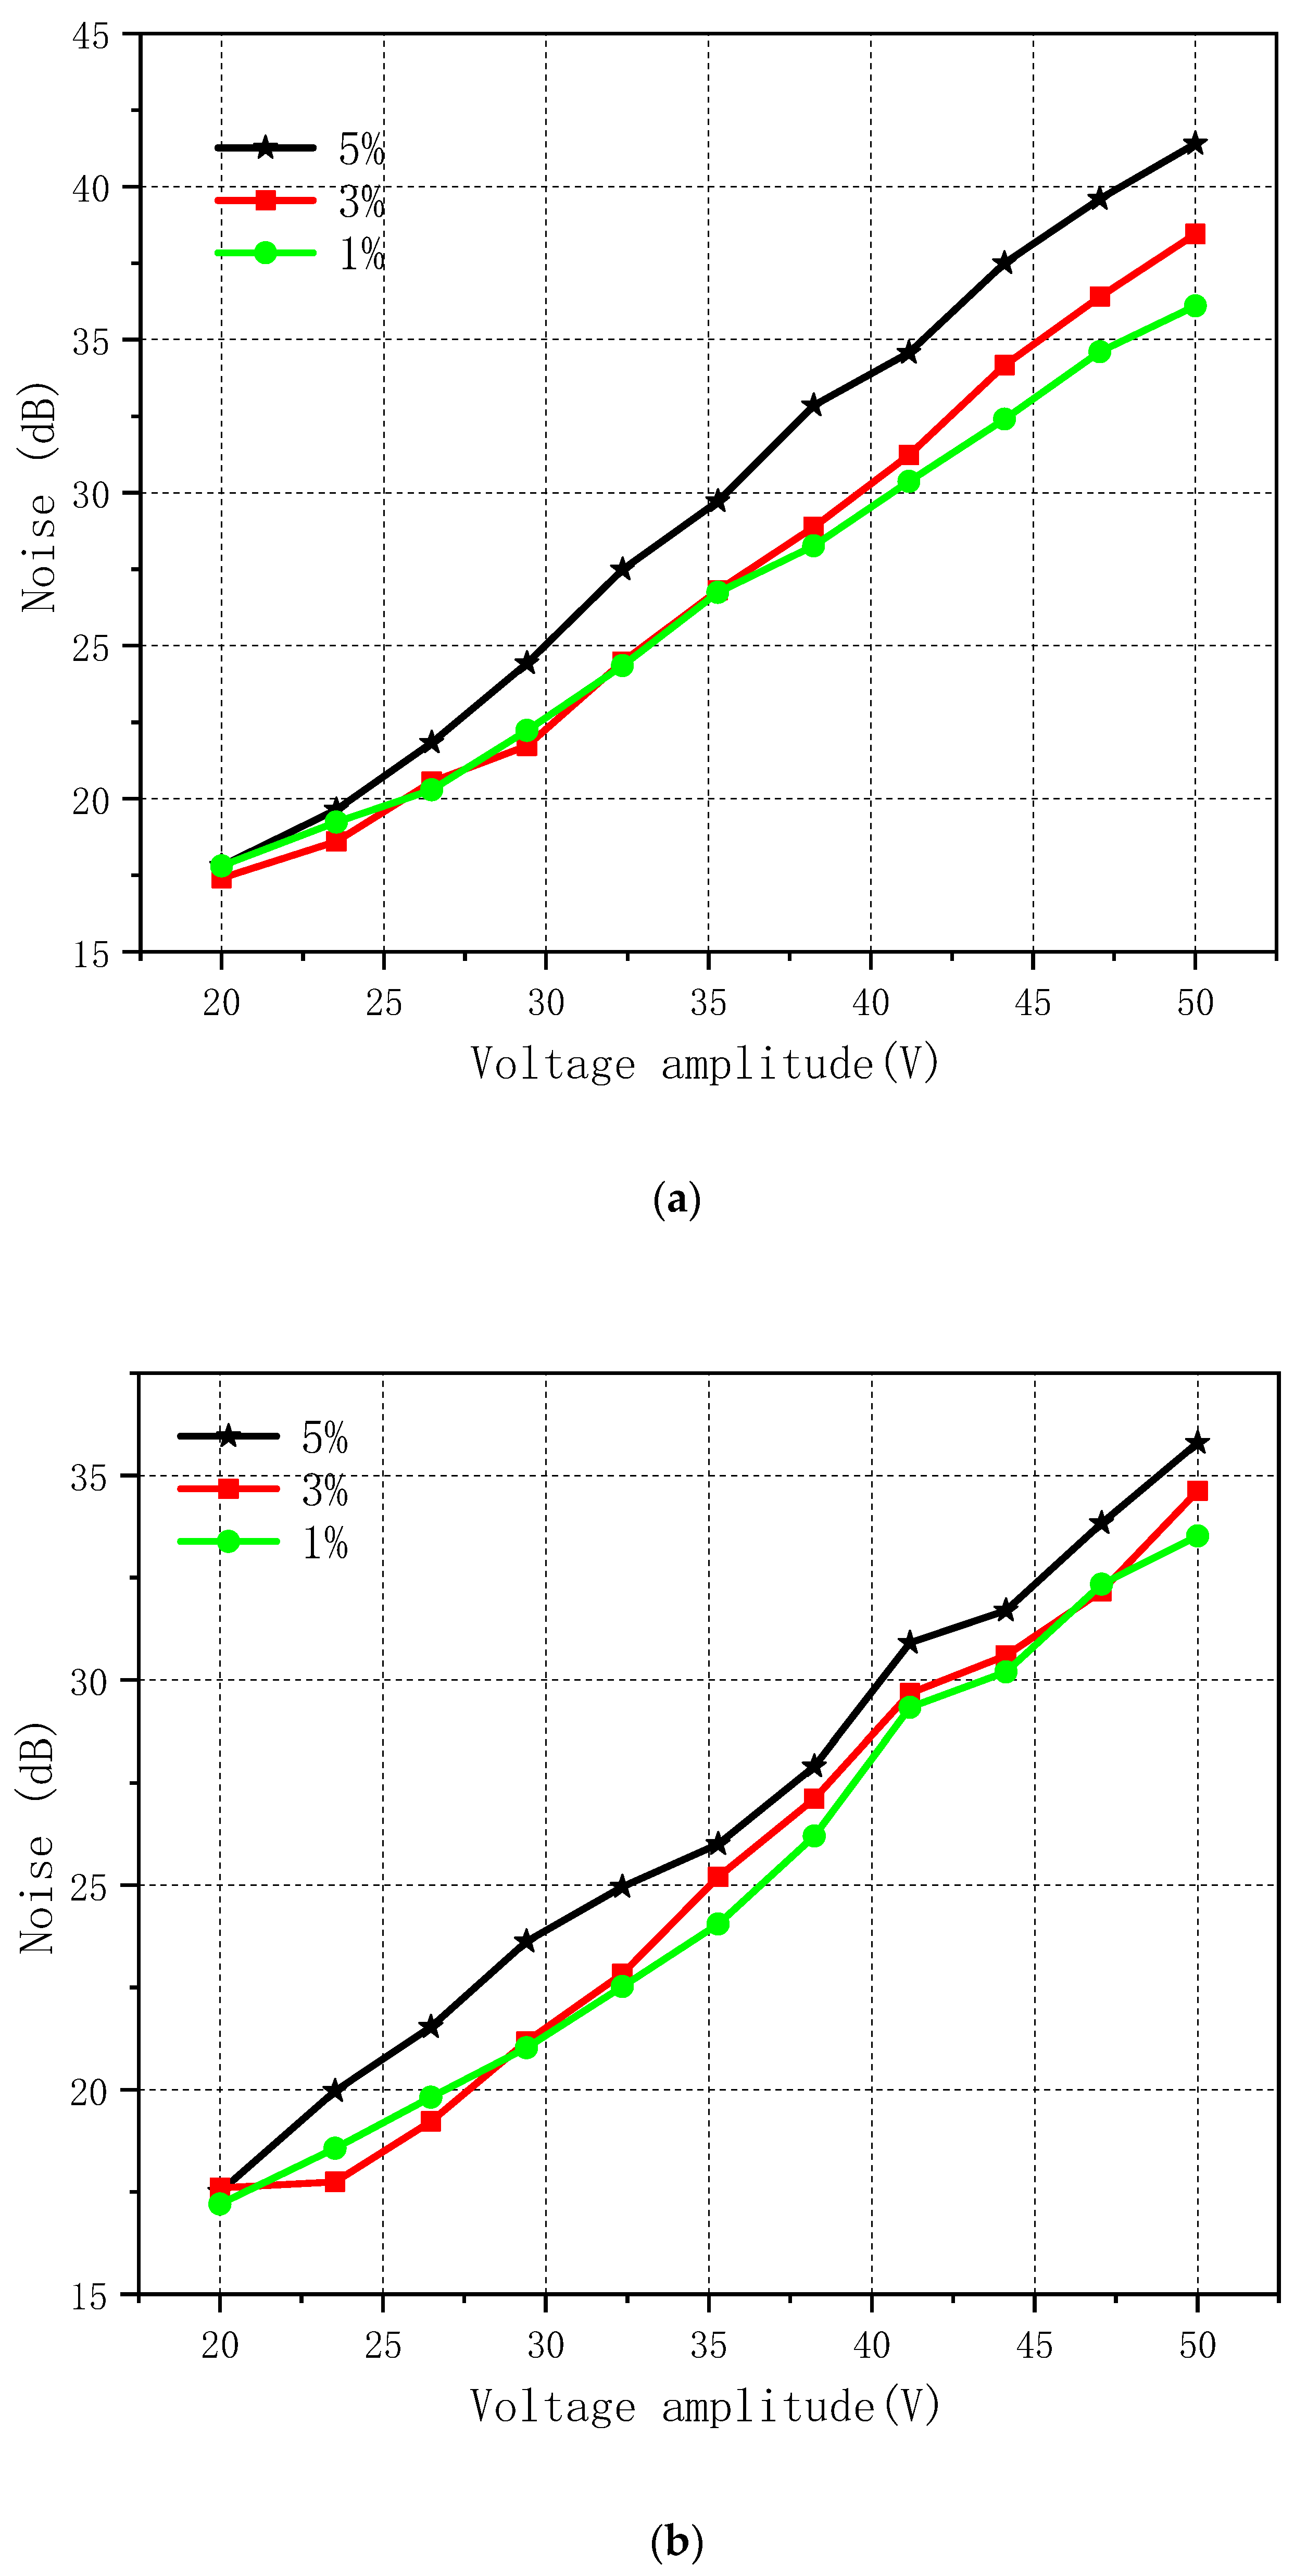
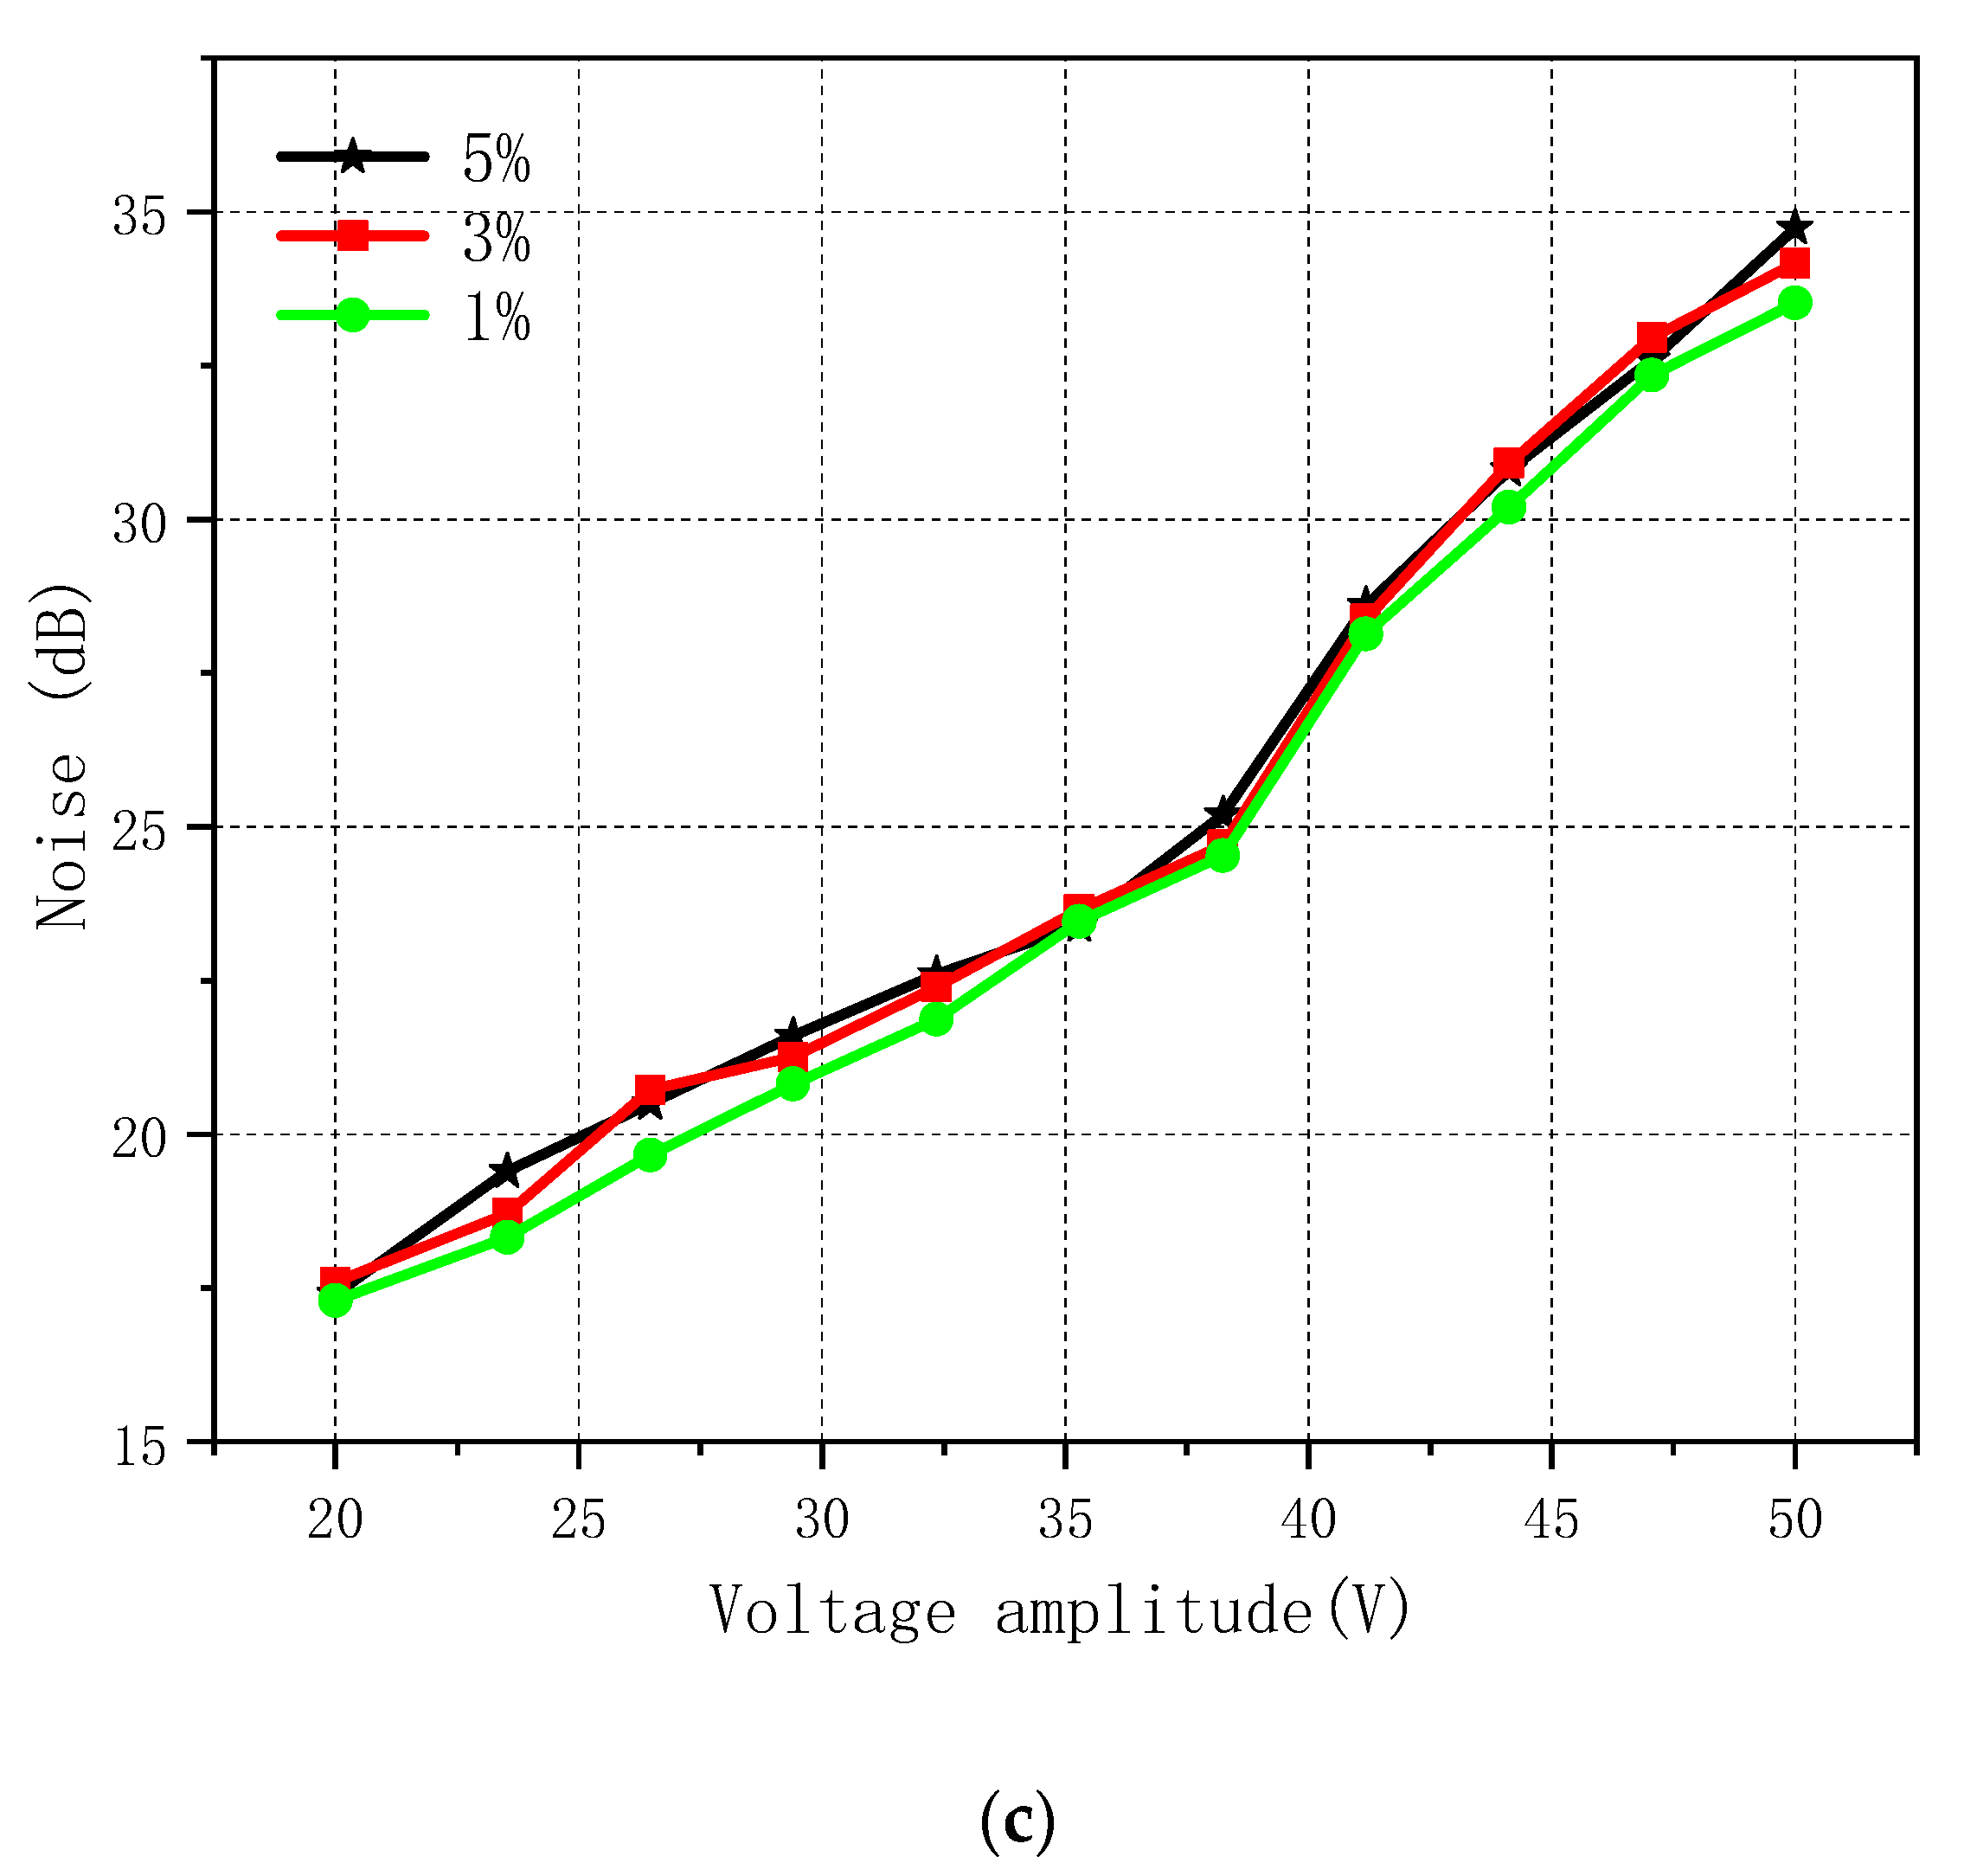
3.4. Inter-Harmonic Content Influence on Core Noise
When inter-harmonics with the same frequency and different content are added to the excitation, the noise level of the transformer core changes as shown in Figure 11.

Figure 11.
Noise level under excitation with different inter-harmonic content; (a) With 5 Hz inter-harmonics; (b) With 20 Hz inter-harmonics; (c) With 40 Hz inter-harmonics.
It can be seen from the figure that when the fundamental wave amplitude is 50 V, the inter-harmonic frequency is 5 Hz, and the content of 5% is 5 dB greater than the content of 1%. In the case of frequency 20 Hz and above, the change of inter-harmonic content has no obvious effect on noise. Similar to the results of the vibration displacement experiment, the addition of inter-harmonics with a frequency lower than 20 Hz has a serious impact on noise. As the voltage amplitude increases, the effect of inter-harmonics gradually increases, which proves the rationality of the experiment.
4. Conclusions
As important equipment in the power system, the transformer contains the problem of abnormal increase in vibration and noise caused by inter-harmonic excitation, which needs to be studied urgently. In this work, an experimental circuit that can generate arbitrary inter-harmonic excitations is first built according to the experimental requirements. Then, vibration measurement equipment and a noise sound level meter were used to test the vibration and noise of transformer core under conditions of different inter-harmonic frequencies and amplitudes. The following conclusions are drawn through the experimental results:
- (1)
- When the excitation voltage contains inter-harmonics of a single frequency (the inter-harmonic frequency is fih), the transformer core contains components with frequencies that are integer multiples of the fundamental frequency as well as inter-harmonic components of other frequencies. Inter-harmonic frequencies exist at ±2fih of even harmonics of the fundamental frequency and ±fih of odd harmonics of the fundamental frequency.
- (2)
- Inter-harmonics have a serious impact on the vibration and noise of the transformer core (especially the inter-harmonics with a frequency lower than 20 Hz). Vibration and noise increase with the decrease of the inter-harmonic frequency and the increase of the amplitude, and the effect of inter-harmonics is more obvious with the voltage amplitude increase.
The test platform and experimental conclusions of transformer core vibration and noise characteristics under inter-harmonic excitation in this paper provide effective reference and data support for such experiments.
Author Contributions
Conceptualization, Q.H.; methodology, C.F.; validation, G.Y.; writing—original draft preparation, G.Y. and J.L.; writing—review and editing, G.Y. and H.L.; project administration, Q.H. and X.C. All authors have read and agreed to the published version of the manuscript.
Funding
This research was funded by the Scientific and Technological Project of Global Energy Interconnection Research Institute Co., Ltd. (Grant No.525500200050).
Institutional Review Board Statement
Not applicable.
Informed Consent Statement
Not applicable.
Conflicts of Interest
The authors declare no conflict of interest.
References
- Lin, H. Interharmonics in power system. Distrib. Util. 2001, 18, 6–9. [Google Scholar]
- Bi, T.; Kong, Y.; Xiao, S.W.; Zhang, P.; Zhang, T. Review of sub-synchronous oscillation with large-scale wind power transmission. J. Electr. Power Sci. Technol. 2012, 7, 10–15. [Google Scholar]
- Lin, F.; Lin, Y.; Huang, D.; Lin, C.; Zhang, Y. Ultra-High-Power Arc Furnace Model for Low Frequency Non-Stationary Inter-harmonics. In Proceedings of the 2020 5th Asia Conference on Power and Electrical Engineering (ACPEE), Chengdu, China, 4–7 June 2020; pp. 2049–2053. [Google Scholar]
- Weiser, B.; Pfützner, H. Relevance of magnetostrictionand forces for the generation of audible noise oftransformer cores. IEEE Trans. Magn. 2000, 36, 3759–3777. [Google Scholar] [CrossRef]
- Tang, Z.; Wang, Z. Study on Statistical Characteristics of Audible Noise and Vibration Signals of UHV Transformers and Reactors. In Proceedings of the 2020 IEEE International Conference on High Voltage Engineering and Application (ICHVE), Beijing, China, 6–10 September 2020; pp. 1–4. [Google Scholar]
- Zhu, L.; Yang, Q.; Yan, R.; Zhan, X. Researchon vibration and noise of power transformers conside-ring magnetostrictive effect. Trans. China Electrotech. Soc. 2013, 28, 19. [Google Scholar]
- Zhu, L. Study on the Influence of Laminated Magnet Core Magnetostrictive Effect on the Vibration and Noise of Transformer and AC Motor; Hebei University of Technology: Tianjin, China, 2013. [Google Scholar]
- Zhang, Y.; Wang, J.; Bai, B. Analysis of the influence of DC bias magnetic field on the magnetostrictive properties of silicon steel sheet. Proc. CSEE 2016, 36, 4299–4307. [Google Scholar]
- Wang, J.; Bai, B.; Liu, H.; Ma, C. Influence of DC Bias on Transformer Vibration and Noise. J. Electr. Eng. Technol. 2015, 30, 59–61. [Google Scholar]
- He, J.; Yu, Z.; Zeng, R.; Zhang, B. Vibration and Audible Noise Characteristics of AC Transformer Caused by HVDC System under Monopole Operation. IEEE Trans. Power Deliv. 2012, 27, 1835–1842. [Google Scholar] [CrossRef]
- Xu, Y.; Dai, M.; Wang, W. An Analysis of Transformer Core Vibration and Noise under DC Bias Condition. In Proceedings of the 2017 International Conference on Computer Systems, Electronics and Control (ICCSEC), Dalian, China, 25–27 December 2017; pp. 1612–1615. [Google Scholar]
- Duan, X. Research on Vibration Mechanism and Signal Analysis of Transformer under DC Bias; Chongqing University: Chongqing, China, 2013. [Google Scholar]
- Bai, B.; Liu, C.; Wang, J. Simulation and Experimental Study of Transformer Vibration under DC Bias. J. Electr. Eng. Technol. 2013, 28, 427–433. [Google Scholar]
- Liu, H. Research on Multiphysics Coupling Problem of Transformer Core Vibration and Noise; Shenyang University of Technology: Shenyang, China, 2014. [Google Scholar]
- Wei, Y.; Zang, C.; Dun, L. Multiphysics study of vibration and noise of three-phase power transformers. Sci. Technol. Eng. 2013, 13, 5632–5635. [Google Scholar]
- Liu, W.; Li, J.; Zhang, Y.; Zhu, J. Research on vibration and noise control of dry series iron core reactors. Mach. Des. Manuf. 2010, 8, 141–143. [Google Scholar] [CrossRef]
- Yang, F.; Ren, Z.; Zhang, D.; Li, L.; Fan, X.; Zhou, Y. Simulation Analysis and Experiment Validation of Vibration and Noise of Oil-immersed Transformer. In Proceedings of the 2019 22nd International Conference on Electrical Machines and Systems (ICEMS), Harbin, China, 11–14 August 2019; pp. 1–5. [Google Scholar]
- Tian, C.; Li, L.; Song, Y.; Zhang, P.; Wang, X.; Cheng, Z.; Liu, L.; Nie, J.; Fan, C. Model experiment and simulation of core vibration for shunt reactor. Adv. Technol. Electr. Eng. Energy 2018, 37, 64–70. [Google Scholar]
- Yan, R.; Gao, X.; Zhu, L.; Yang, Q.; Ben, T.; Li, Y.; Yang, W. Research on three-dimensional stress distribution of reactor core. IEEE Trans. Appl. Supercond. 2016, 26, 1–4. [Google Scholar] [CrossRef]
- Jia, Y. Measurement and Calculation of Magnetization Properties of Electrical Steel under Interharmonics Excitation; North China Electric Power University: Baoding, China, 2018. [Google Scholar]
- China National Standardization Commission. GB/T 1094.10-2003, Power Transformers, Part 10: Determination of Sound Level; China Standard Press: Beijing, China, 2003. [Google Scholar]
Publisher’s Note: MDPI stays neutral with regard to jurisdictional claims in published maps and institutional affiliations. |
© 2022 by the authors. Licensee MDPI, Basel, Switzerland. This article is an open access article distributed under the terms and conditions of the Creative Commons Attribution (CC BY) license (https://creativecommons.org/licenses/by/4.0/).