Article

A Rough Discrete Fracture Network Model for Geometrical Modeling of Jointed Rock Masses and the Anisotropic Behaviour

1
Key Laboratory of Ministry of Education for Efficient Mining and Safety of Metal Mine, University of Science and Technology Beijing, Beijing 100083, China
2
Water Resource Protection and Utilization in Coal Mining, Beijing 100011, China
3
Beijing Key Laboratory of Urban Underground Space Engineering, University of Science and Technology Beijing, Beijing 100083, China
4
School of Civil and Resources Engineering, University of Science and Technology Beijing, Beijing 100083, China
*
Author to whom correspondence should be addressed.
Appl. Sci. 2022, 12(3), 1720; https://doi.org/10.3390/app12031720
Submission received: 9 January 2022 / Revised: 30 January 2022 / Accepted: 31 January 2022 / Published: 7 February 2022
(This article belongs to the Special Issue Structural Mechanics of Rocks and Rock Masses)

Abstract

:
The geometry of the joint determines the mechanical properties of the rock mass and is one of the key factors affecting the failure mode of surrounding rock masses. In this paper, a new rough discrete fractures network (RDFN) characterization method based on the Fourier transform method was proposed. The unified characterization of the complex geometric fracture network was achieved by changing the different Fourier series values, which further improved the characterization method of the RDFN model. A discrete element numerical calculation model of the complex RDFN model was established by combining MATLAB with PFC code. Numerical simulation of the anisotropic mechanical properties was performed for the RDFN model with a complex joint network. Based on the results, the geometry of the joint network has a significant influence on the strength and failure patterns of jointed rock masses. The failure modes of the opening are highly affected by the orientation of the fracture sets. The existence of the rough fracture sets could influence the failure area of different excavation situations. The study findings provide a new characterization method for the RDFN model and a new characterization approach for stability analysis of complex jointed rock masses.

1. Introduction

The structural planes, which are randomly distributed in nature, are important factors dominating the mechanical properties of jointed rock masses. However, multiple structural planes intersect each other and cut the complete rock mass into multiple parts, ultimately affecting the mechanical properties and inducing significant anisotropy in the rock mass [1,2,3,4,5,6,7,8]. To analyse the rock mechanics problems with different geometric forms of complex joints and the spatial distribution of complex joints, related simulation studies on the complex joint network model of jointed rock masses have been gradually carried out. Among them, the widely used joint representation model was the discrete fracture network (DFN) model, which provides research ideas and characterization models for the study of the mechanical properties of jointed rock masses.
Many scholars have carried out several studies on mechanical behaviours using the DFN model. Wang et al. [9] employed the DFN model to quantitatively analyse the permeability tensor characteristics and the directional characteristics of rock mass seepage under different geometric distributions of jointed rock masses. Wang et al. [10] used a randomly generated two-dimensional DFN model to simulate the heterogeneous characteristics of fractured rock mass seepage. Ye et al. [11] proposed a mathematical model of the discrete joint network unsaturated seepage problem based on the discrete joint network model, whose proposed algorithm plays an important role in solving the reliability of the rain infiltration problem of the fractured slope. In a fracture structure characterization and mechanical characteristics research, Wang et al. [12] used the DFN model to discuss the stability calculation of fractured rock masses based on the Voronoi model, Baecher model, and Veneziano model, whose research results provided a new idea for the stability evaluation of fractured rock masses. Further, the DFN model has been widely used in fields, such as slopes [13] and tunnels [14].
The DFN model could also be used to estimate the block volume distribution using the persistent discontinuities [15]. Kiuru et al. [16] discussed the DFN modelling method based on drillholes and investigated the influence on the excavation damaged zone. Whether in the two-dimensional or three-dimensional discrete joint network model, most of the numerical simulation analysis and research on rock joints assume that the rock mass structural plane is a plane, and the joint section is a straight line. However, the structural surface of the rock mass is a rough surface with unevenness instead of a complete and smooth surface in engineering practice, as shown in Figure 1. Further, the internal structural surfaces of rock masses in different scales (e.g., fractures, bedding planes, joints, and folds) have a certain degree of roughness.
According to [17], the roughness of the joint surface will closely affect the propagation of the wave speed when studying the law of wave speed change. Mustaqim et al. [21] also revealed that the elastic wave velocity changes in rock samples with different joint roughness under cyclic loading and unloading. These studies proved that the roughness of rock mass joints is real and has an important influence on the properties of rock masses. Therefore, the roughness of the joint surface must be considered when studying rock mass.
The joint roughness coefficient (JRC) was first proposed by [22] to express the roughness of the joint. Subsequently, many scholars performed several assessments to quantitatively evaluate the JRC value and the shape of the structural joint section. Ge et al. [23] evaluated the JRC method of JRC based on the fractal principle. Xie and Pariseau [24] developed a fractal estimation method for JRC. Zhao et al. [25] used a random function with normal distribution to construct the joint section shape. Zhao et al. [26] analysed and reconstructed the rock joint morphology based on the discrete Fourier transform principle. Owing to further research on JRC by many scholars, the rock mass shear test on the characteristics of the joint surface roughness has been conducted. Shen et al. [27], assumed that the rock mass structural surface had a regular tooth shape, conducted a shear test to explore the mechanical characteristics of the tooth structural surface, and established an empirical formula for evaluating the shear strength of the structural surface. Cui et al. [28] discussed the influence of normal stiffness, initial normal stress, and structural surface roughness on the shear mechanical properties of structural surfaces. Dang et al. [29] simulated and studied the shear behaviour of rough basalt fracture under constant and dynamic normal load conditions at different shear rates, and then proposed a new shear criterion to evaluate the shear behaviour of rough joints under this condition. The findings of these studies revealed that the surface roughness of joints is the most important factor affecting the mechanical properties of rock masses, such as strength and deformation. Moreover, based on the surface roughness of joints, the mechanical properties of rock masses are closer to those of natural rock masses. The above studies mainly focused on studying a single or single group of regular rough rock mass joint models; however, the actual natural rock mass joint network is more complicated, with joints possessing complex shapes such as multiple sets of curves and broken lines. However, only relatively few studies have been performed in this field. Wang et al. [30] proposed a rough discrete fracture network (RDFN) model based on the roughness of the joint surface (Figure 2). Further, they constructed a sine curve, a triangular polyline, and a fractal fracture network model for indoor tests and numerical simulations based on three different geometric types of RDFN models and modelling methods, ultimately enabling the construction of complex structural surface networks of rock masses.
This study sought to further propose an RDFN characterization model based on the Fourier transform principle, and also based on research of the rough discrete joint network model, to ultimately achieve a unified characterization of complex geometric joints by changing the Fourier transform series. Accordingly, a joint network RDFN model that can characterize more complex geometric shapes can be established. The particle flow discrete element method was used in this study to elucidate the Fourier-based RDFN model and the complex geometric RDFN numerical model modelling. Moreover, this study aimed to further present the anisotropic mechanical properties of the complex RDFN model under biaxial compression and also to present the influence of the joint network space transformation on the force chain distribution and mesoscopic failure to obtain the anisotropic strength distribution characteristics of the jointed rock mass. The findings of this study have important scientific significance for the refined and quantitative characterization of structural surfaces of complex rock masses, which will provide a reasonable and reliable mechanical model for the study of the mechanical properties of jointed rock masses.

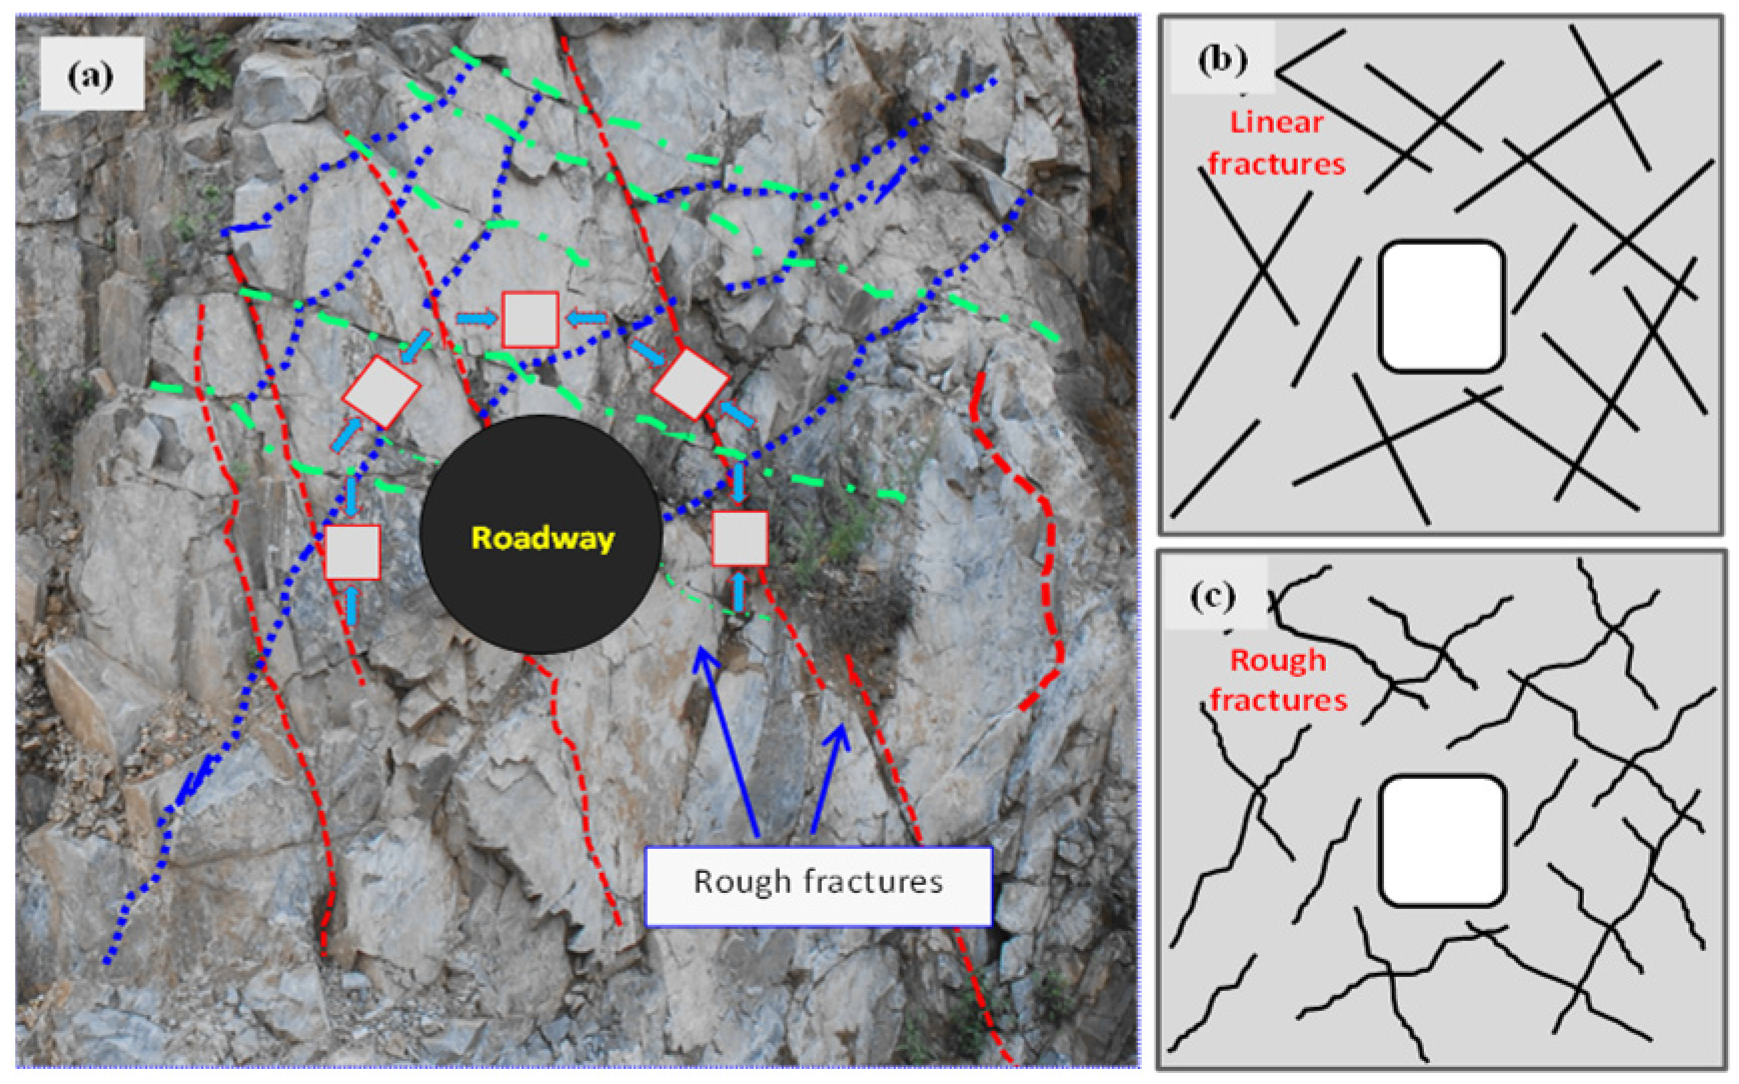
2. Characterization of the Rough Discrete Network Model
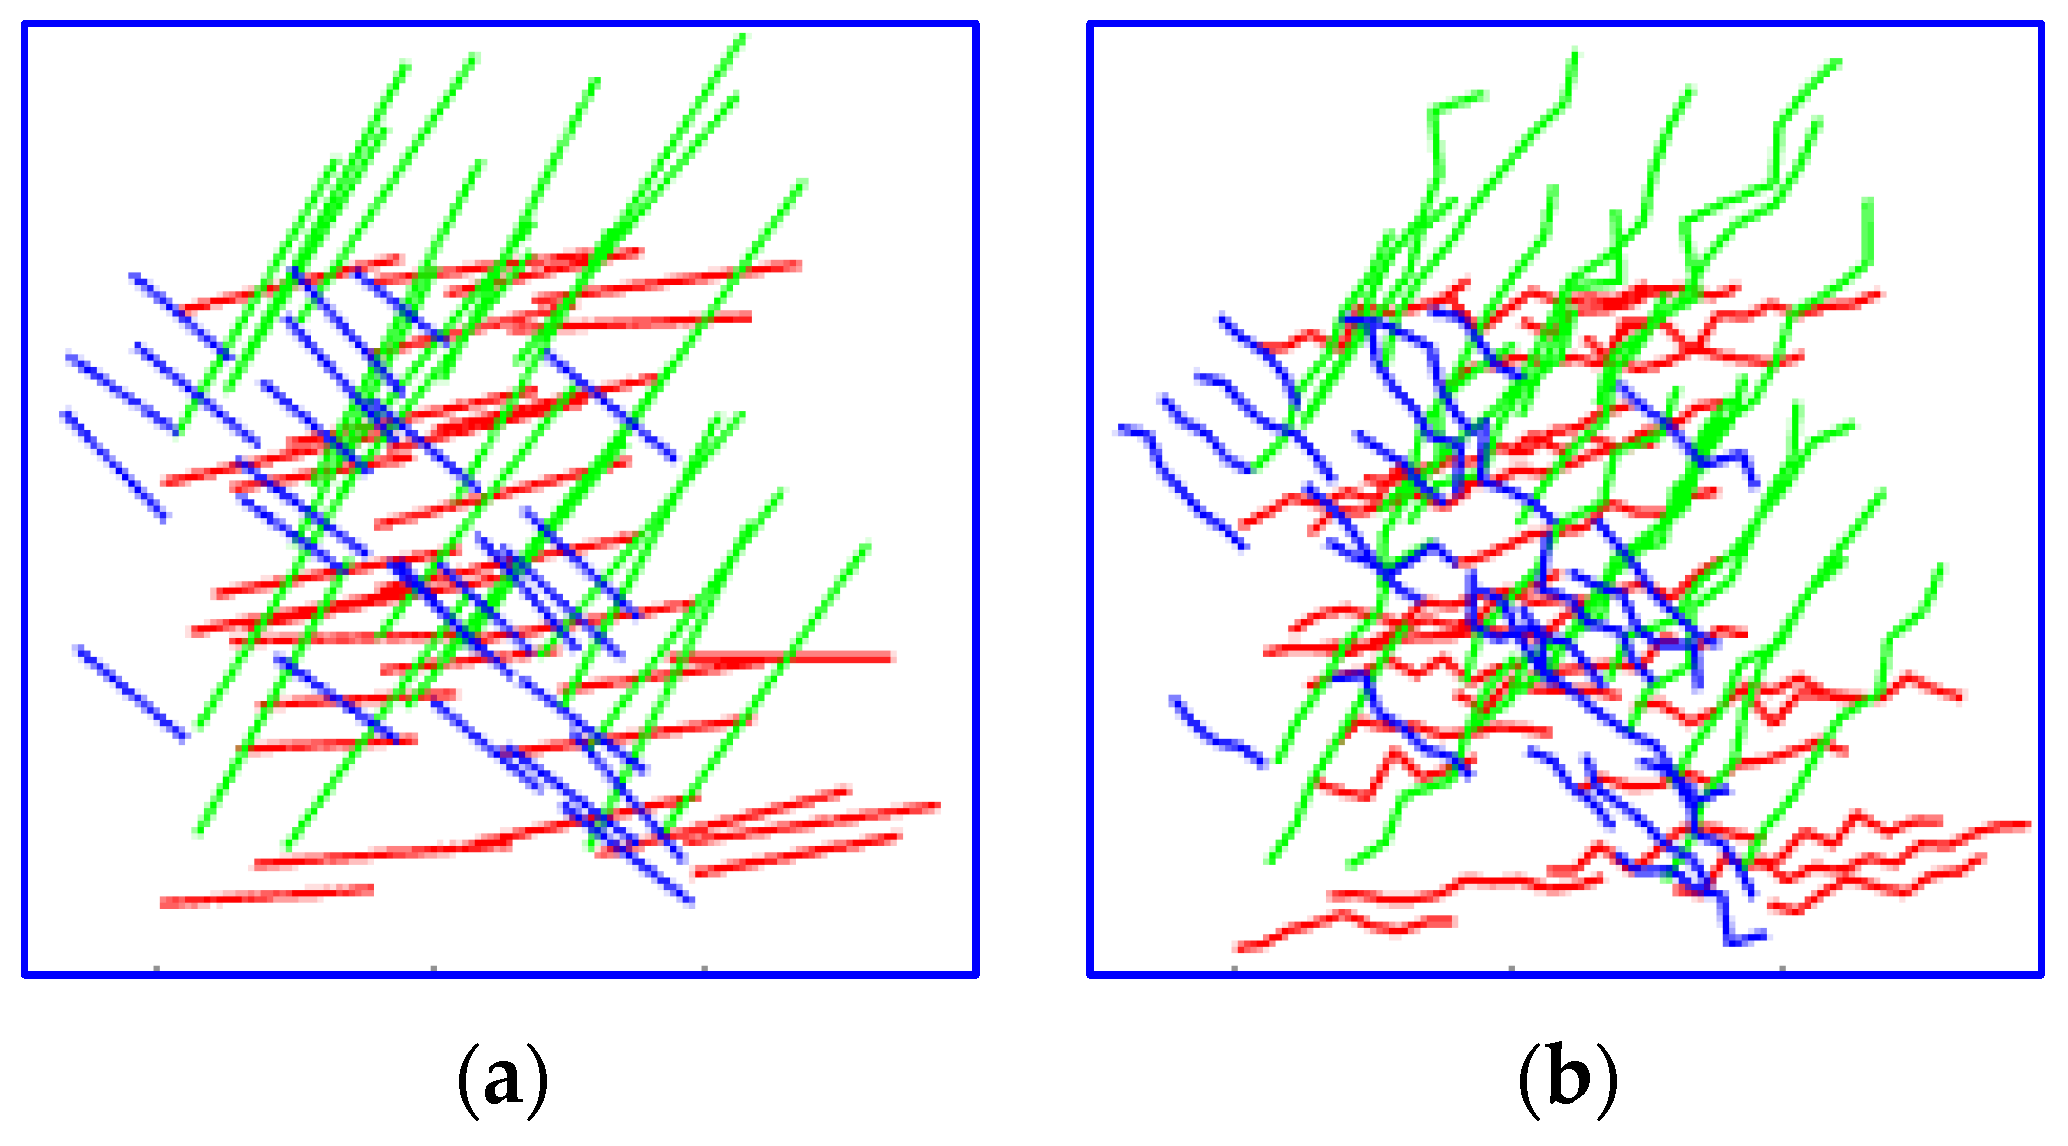
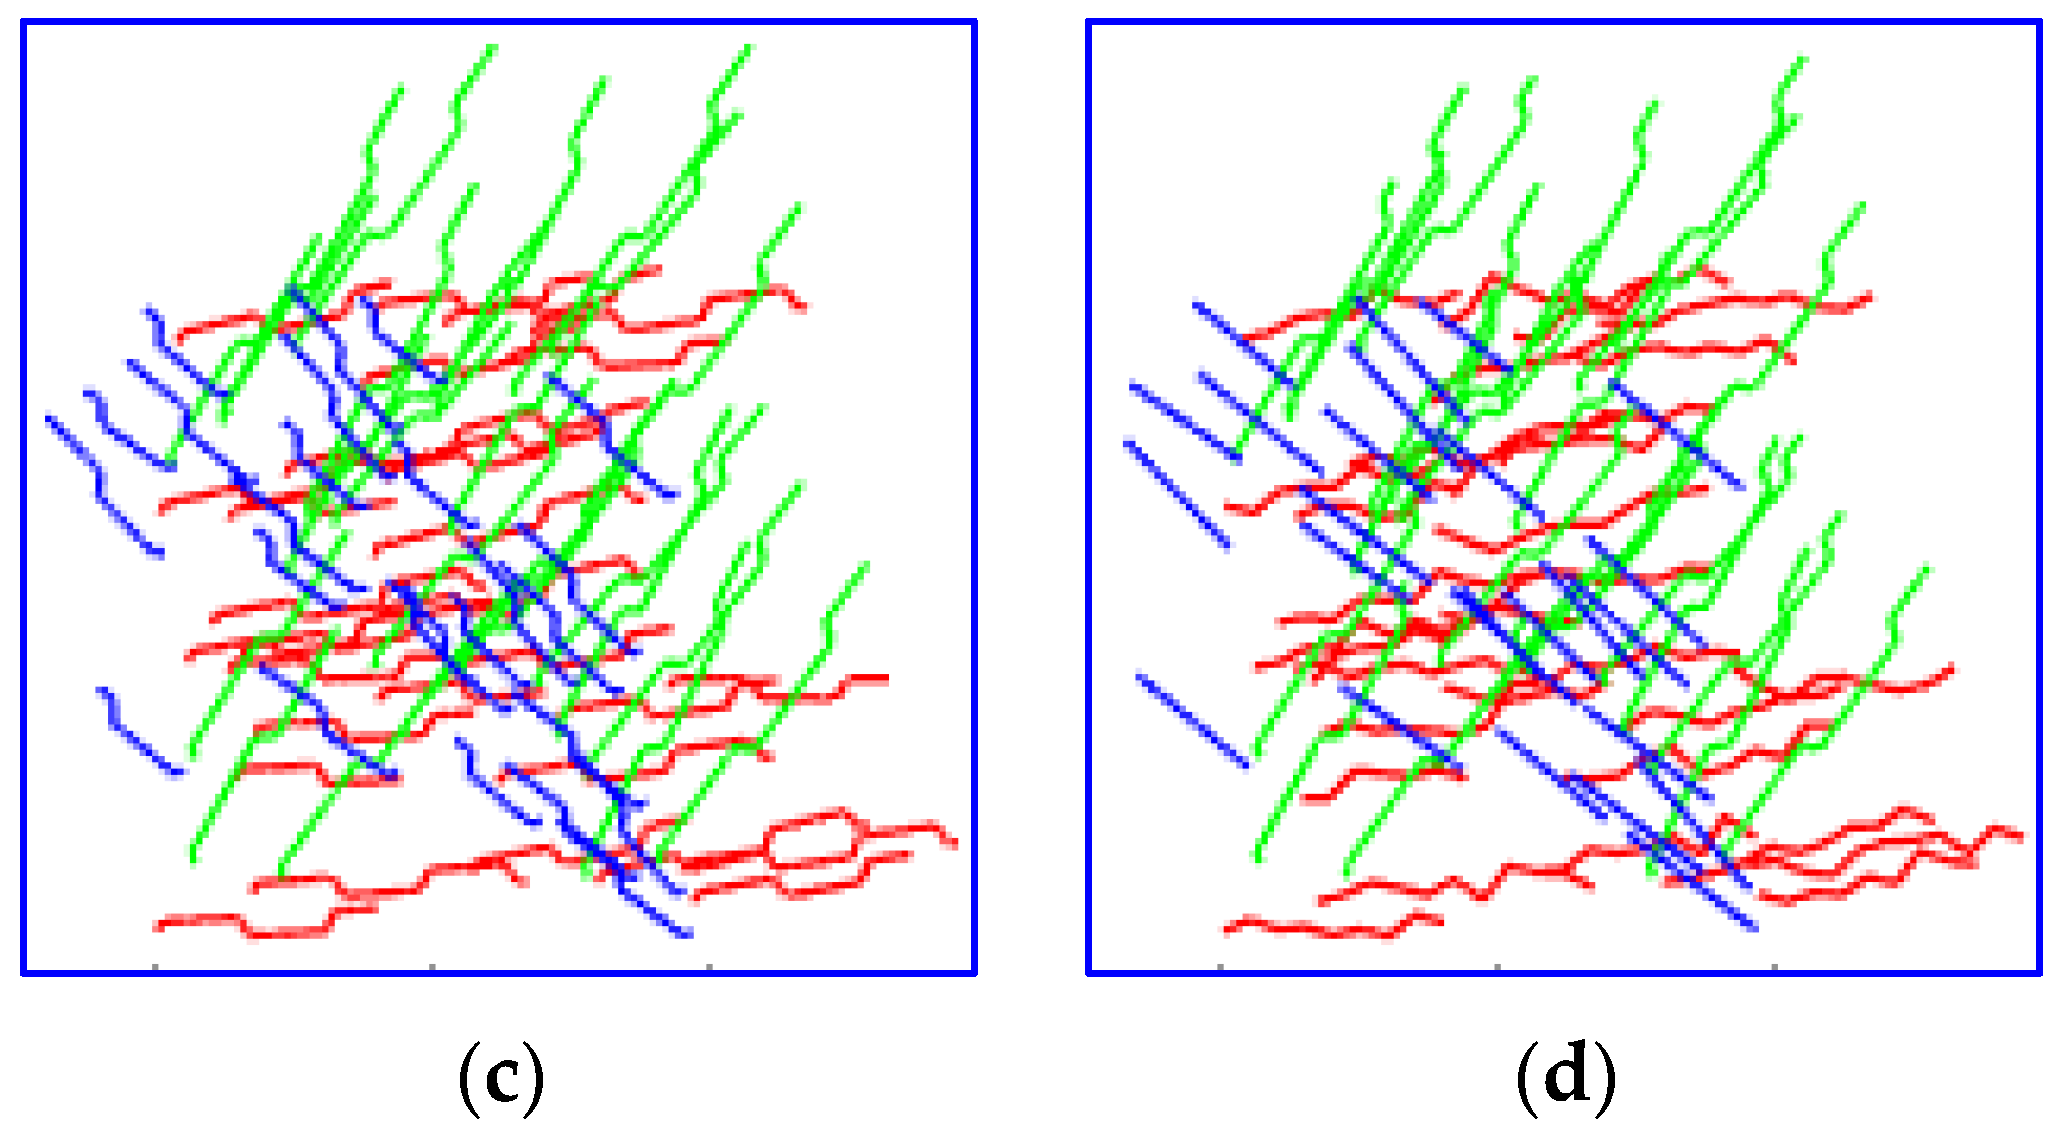
2.1. RDFN Modelling

According to Wang et al. [30], the RDFN model considers both the spatial distribution and the geometry of single joint trace, as shown in Figure 2. The DFN model is a discrete fracture model that is based on probability statistical distribution functions and is combined with random seeds and joint density to generate DFN entities that can be used to study two-dimensional [31] or three-dimensional [32,33] rock mass joint models. The RDFN model shown in Figure 2c is an extension of the DFN model (Figure 2b).
In this study, the MATLAB platform was employed to establish a two-dimensional DFN model that contains three groups of linear joint models with different trace lengths and certain densities. The steps employed to generate the RDFN models are shown in Figure 2a. The relevant geometric occurrence distribution information of joints is listed in Table 1. The author proposed an RDFN model that uses a random fractal curve generated by the Hurst exponent method to represent the natural morphology of the joint, and uses the independent segmentation of the Hurst exponent [34] to study the influence mechanism of complex joints based on the fractal method (Equation (1)).
{ p ( x ) = W R x H 0.5 , x > 0 p ( x ) = W R | x | H 0.5 , x < 0
where p(x) is the offset of each division point in the y-direction relative to the previous division point, x is the distance between the division points, R is a normally distributed random variable (the mean value is 0, the variance is 1), W is the parameter related to the amplitude, and H is the Hurst index.
In this study, three groups of joint images were established based on the fractal principle and the above three groups of linear DFN joint information. The parameter values of the related model are as follows: Hurst index H, 0.65; JRC value, between 4 and 6; W, 0.0393. The joint model is displayed in Figure 2b, and the joint information is shown in Table 2.

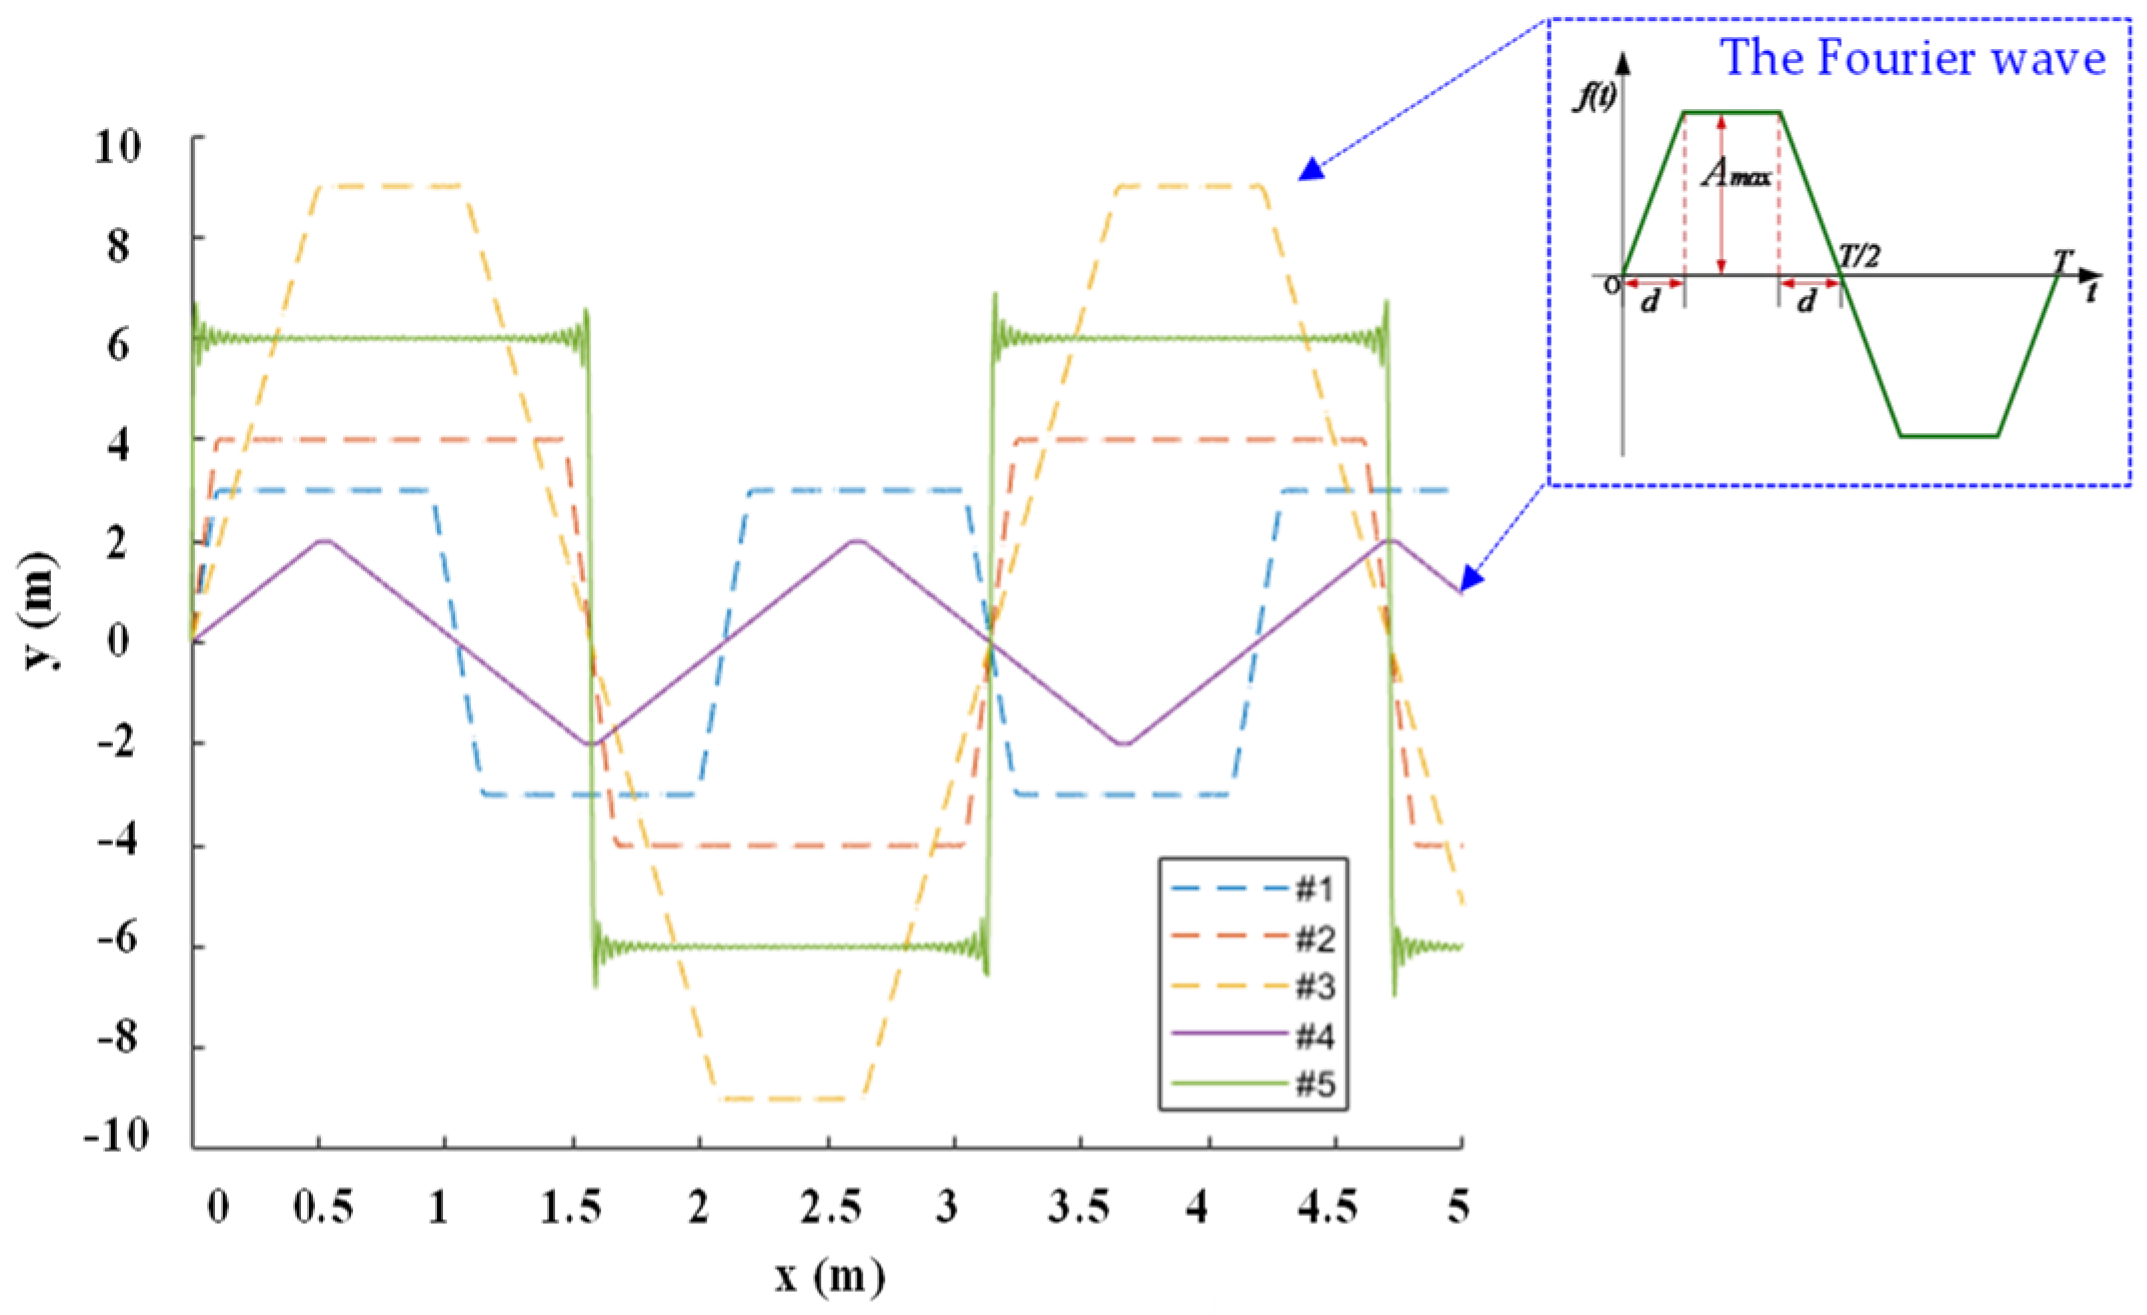
2.2. RDFN Model Based on Fourier Transform

Wang et al. [30] proposed RDFN models and modelling methods based on three different geometric types, including curves, triangular polylines, and fractal fracture network models. However, each RDFN model only enables the construction of a separate geometric representation function. To unify the model representation method, several geometric joint trace representation models based on the Fourier transform principle were proposed to represent different geometric joint models. The Fourier expansion of multi-stage trapezoidal wave is selected as Equation (2). Figure 3 shows the trapezoidal wave geometry corresponding to Equation (2)
f ( x ) = 4 A max π ω d n = 1 sin ( ( 2 n 1 ) ω d ) ( 2 n 1 ) 2 sin ( ( 2 n 1 ) ω x ) , n = 1 , 2 , 3 ,
where T is the waveform period length, Amax is the amplitude height, d is the rising width, which determines the width of the trapezoidal platform and the geometry of the Fourier curve, ω determines the frequency of the curve, and n is the Fourier series of the curve.
The joint trace that conforms with the actual shape can be obtained by changing the above parameters. Table 1 shows the Fourier parameters of different curves and Figure 3 displays the established curve conditions. The trapezoidal wave shape can be changed by modifying the trapezoidal wave d value. For example, the trapezoidal wave can evolve into a triangular wave when the d value is modified to T/4 and a square wave when the value of d is small. Figure 3 shows the trapezoidal waves under different parameters. The unified joint RDFN modelling of complex geometric shapes, such as straight, triangular, and rectangular steps can be obtained by modifying the Fourier series.
Appropriate parameters are selected to simulate the actual joint model based on the above three sets of linear DFN joint information to establish three sets of Fourier joint models with different trace lengths and a certain density on the MATLAB platform. Thereafter, the RDFN joint models (as shown in Figure 4c) with crossing network characteristics are generated based on the above steps to generate line joint sets in the DFN model. The Fourier curve information is shown in Table 2. Following several on-site investigations, the structural plane was not found to be a simple form of the same type. There are many different forms of structural planes, such as straight lines, curves, or waving lines. Therefore, a numerical joint model containing linear, fractal, and Fourier types based on the MATLAB program was established to more accurately simulate real rock mass joints. The geometric forms of each type of joint can be modified according to the actual joint distribution of the site survey. For example, amplitude, frequency, trace length, and other parameters can be appropriately modified and adjusted according to the actual distribution and fluctuations. The mixed RDFN models are shown in Figure 4 and their related mixed joint information is presented in Table 2.

3. Rock Mass Model Based on Digital Image Recognition

3.1. Principle of Image Recognition and the Numerical Model

The image can provide information for the joint distribution of the jointed rock mass and a basis for its modelling. Based on the image of the RDFN model generated using MATLAB code, digital image recognition technology can be applied to generate the numerical particle flow code (PFC) models via the following steps: firstly, the image is read into the MATLAB program (as shown in Figure 5a); secondly, different types of pixels are classified to obtain the spatial distribution coordinates of the bedrock model and joint model through image pixel recognition. The data for bedrock and joint are shown in Table 3. Finally, the joints and rock models are grouped and assigned values to enable the mechanical modelling of the RDFN model based on the particle flow discrete element method, as shown in Figure 5b.

3.2. Micro-Mechanical Parameters

Although the microscopic parameters required by the contact model in PFC are different, the basic material geometric parameters include material density and particle radius. The mechanical parameters of the element are the normal and tangential stiffness (the contact stiffness is related to this). Owing to the two-dimensional particle flow (PFC2D), the mechanical properties of the PFC particle model are closer to the mechanical response of real materials by changing the micro-mechanical parameters of the particle unit. In this study, the micro-mechanical parameters of the model were determined based on the reference of relevant studies by Wang et al. [35], as shown in Table 4.

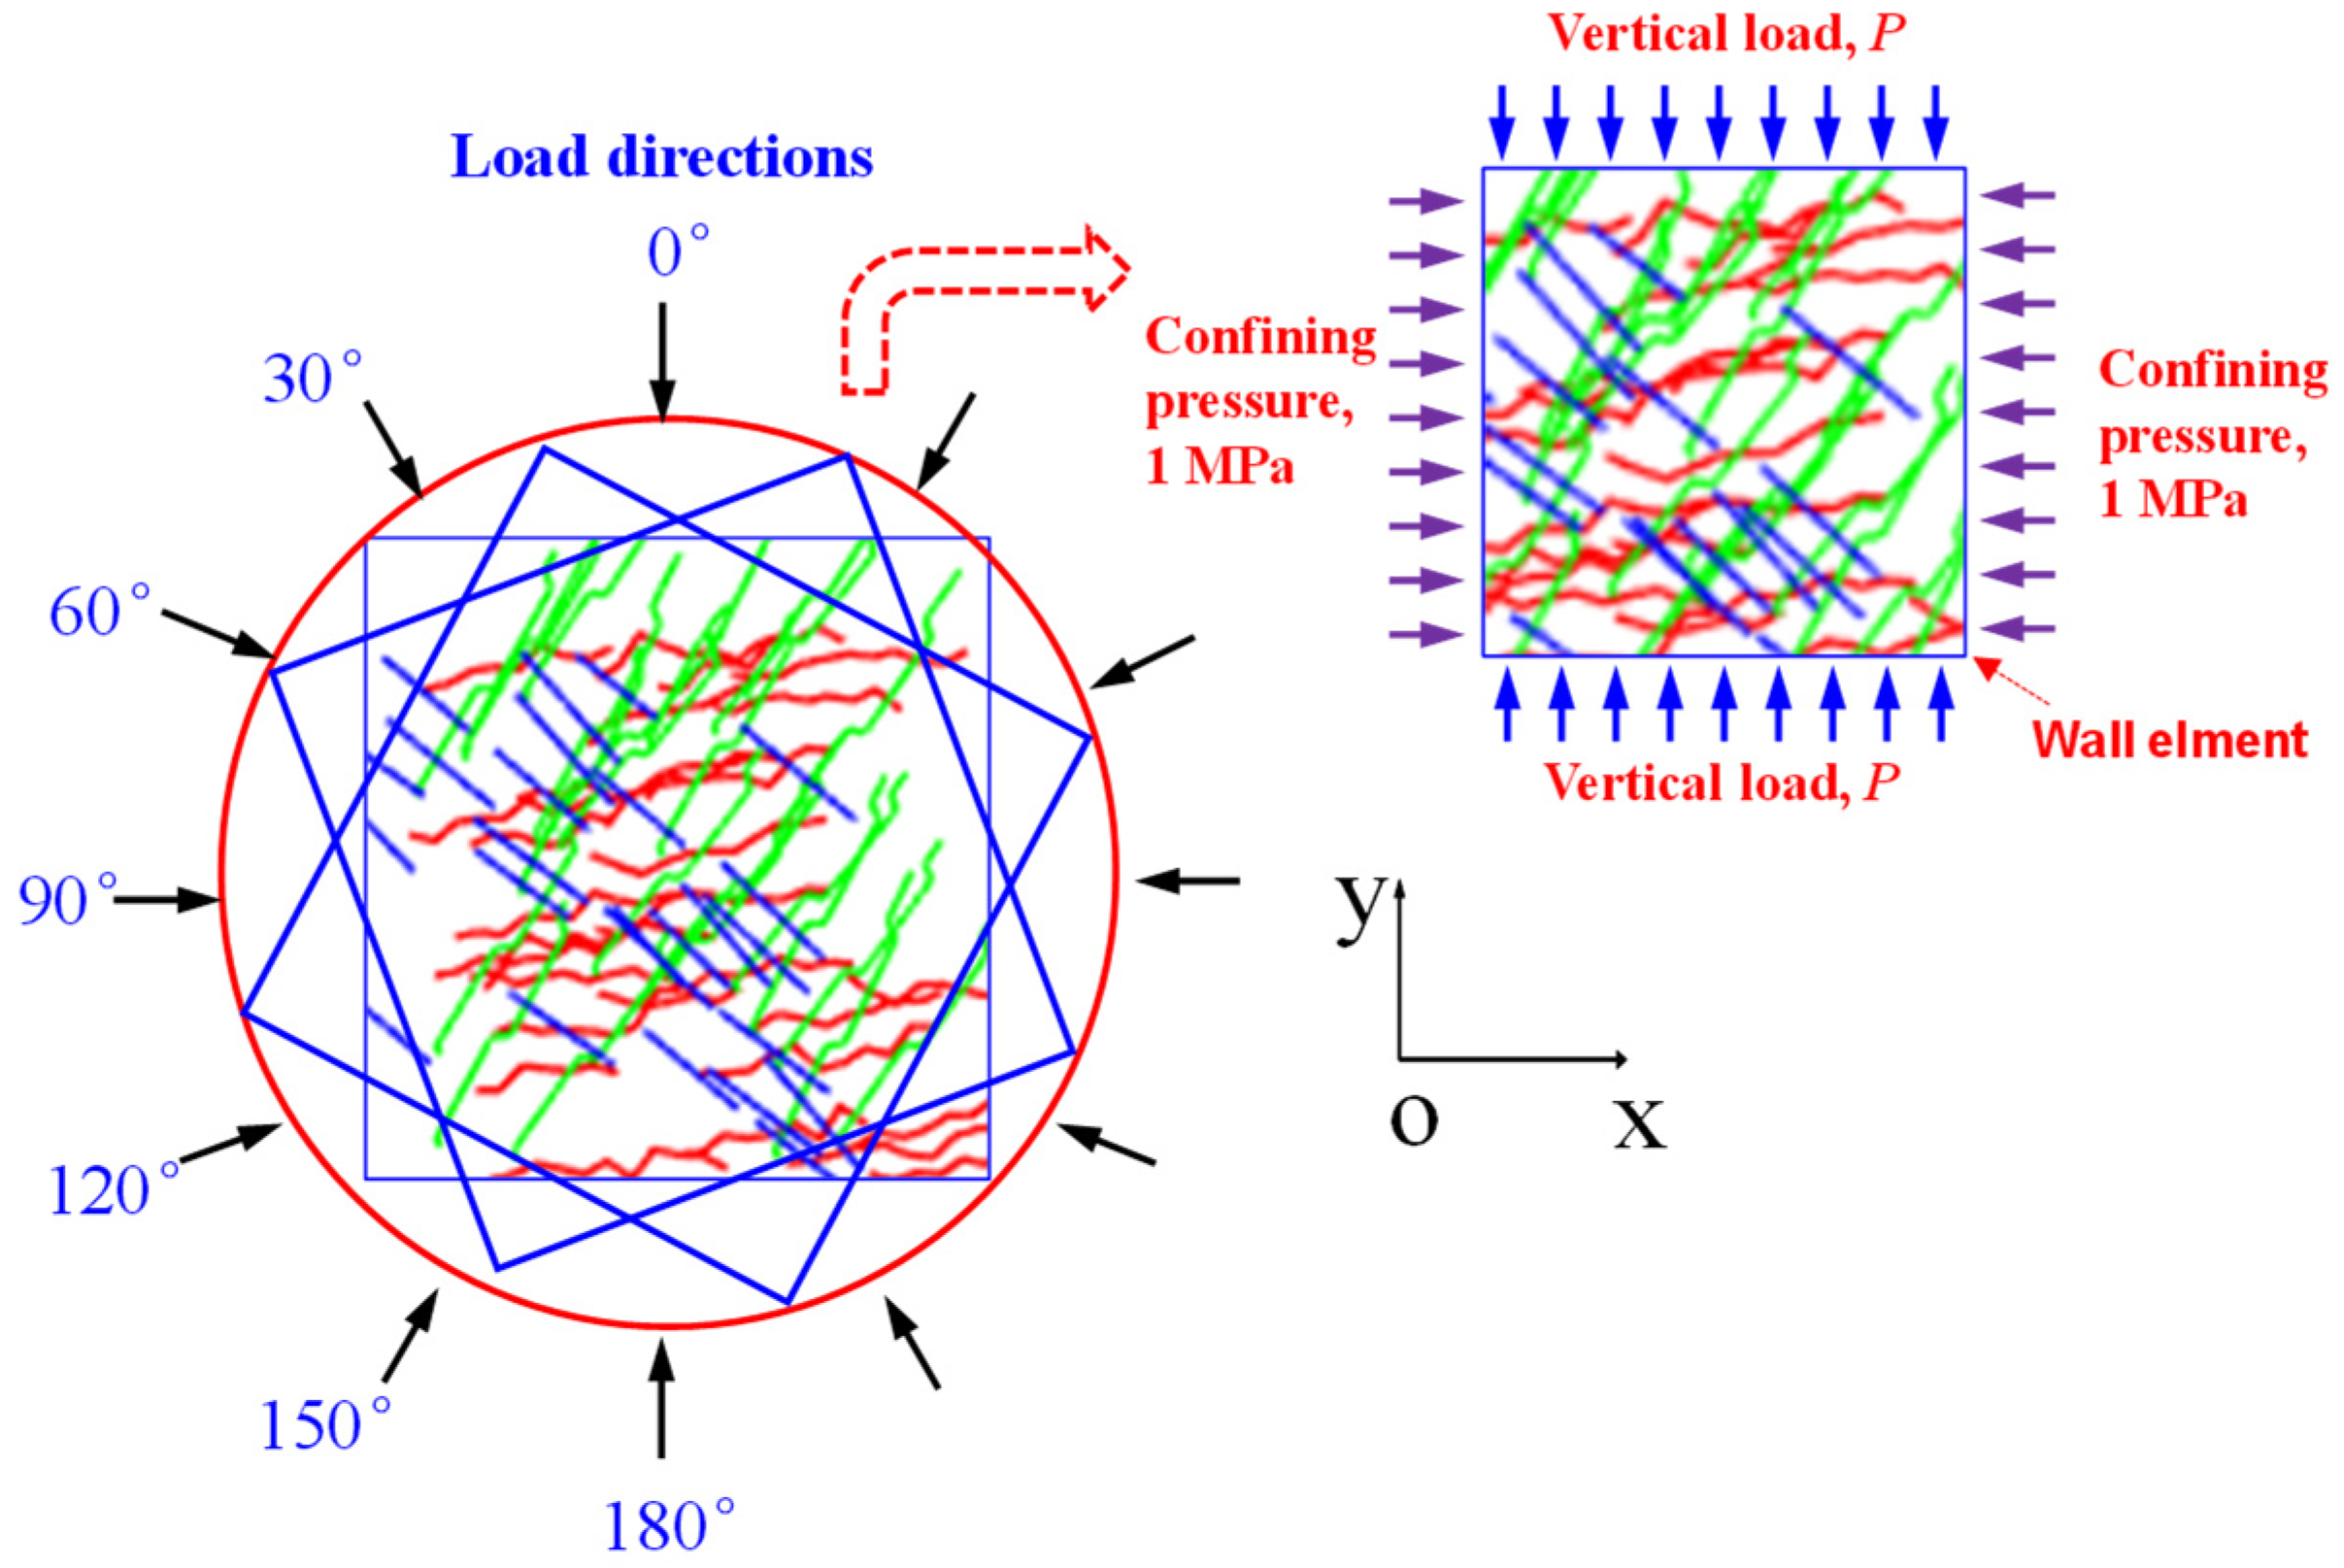
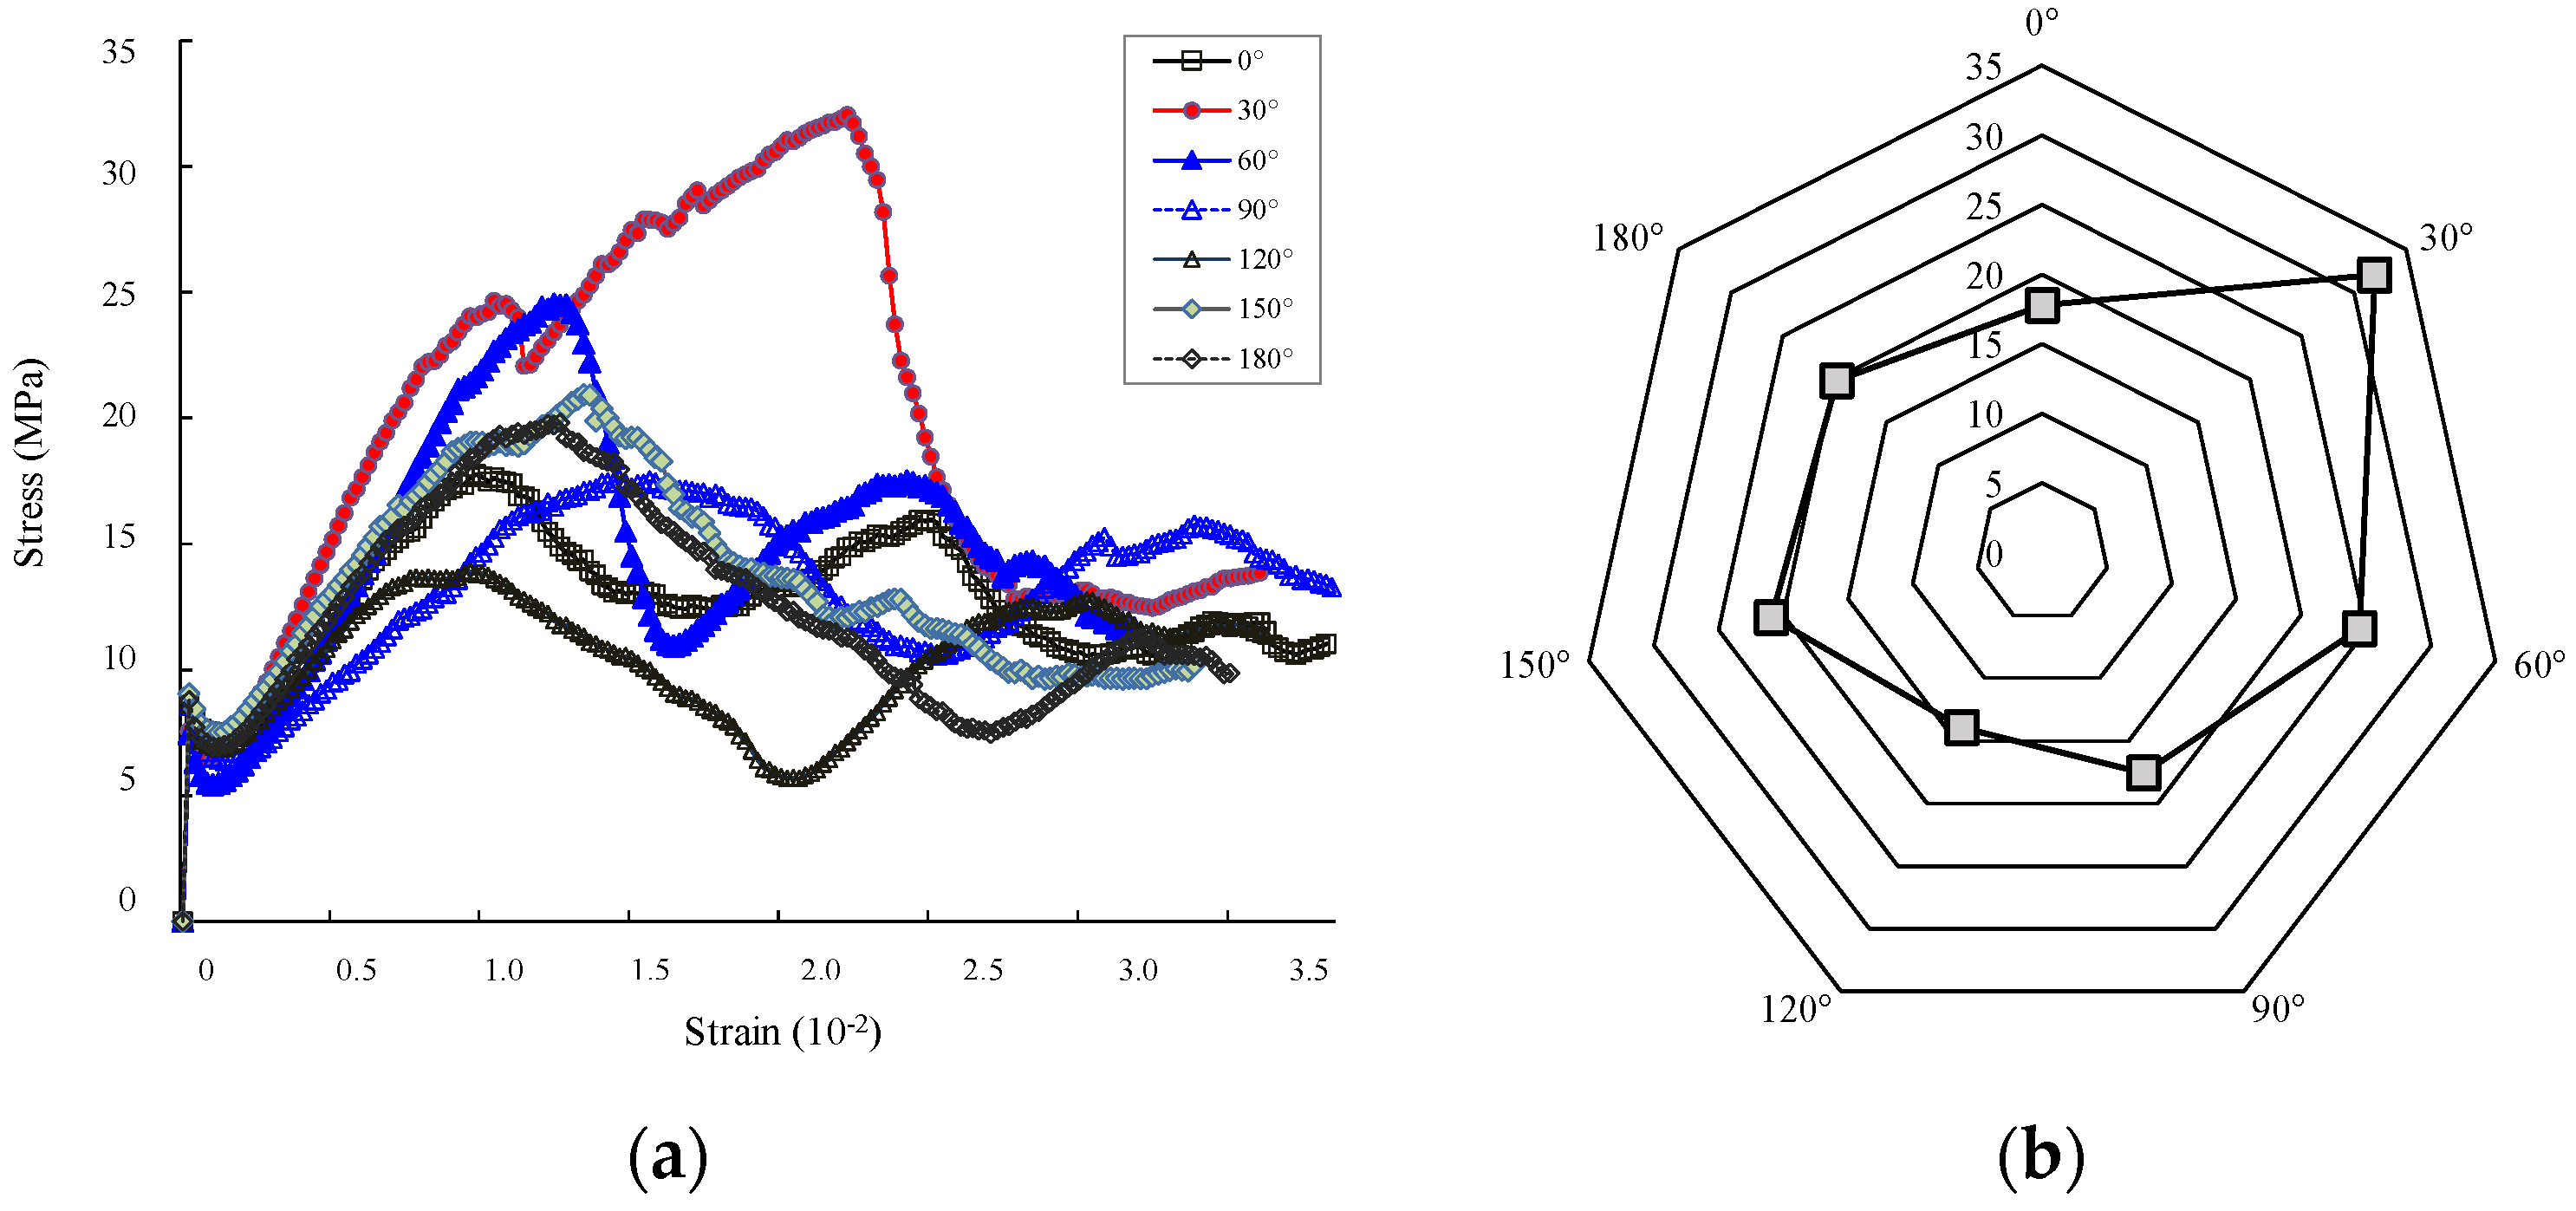
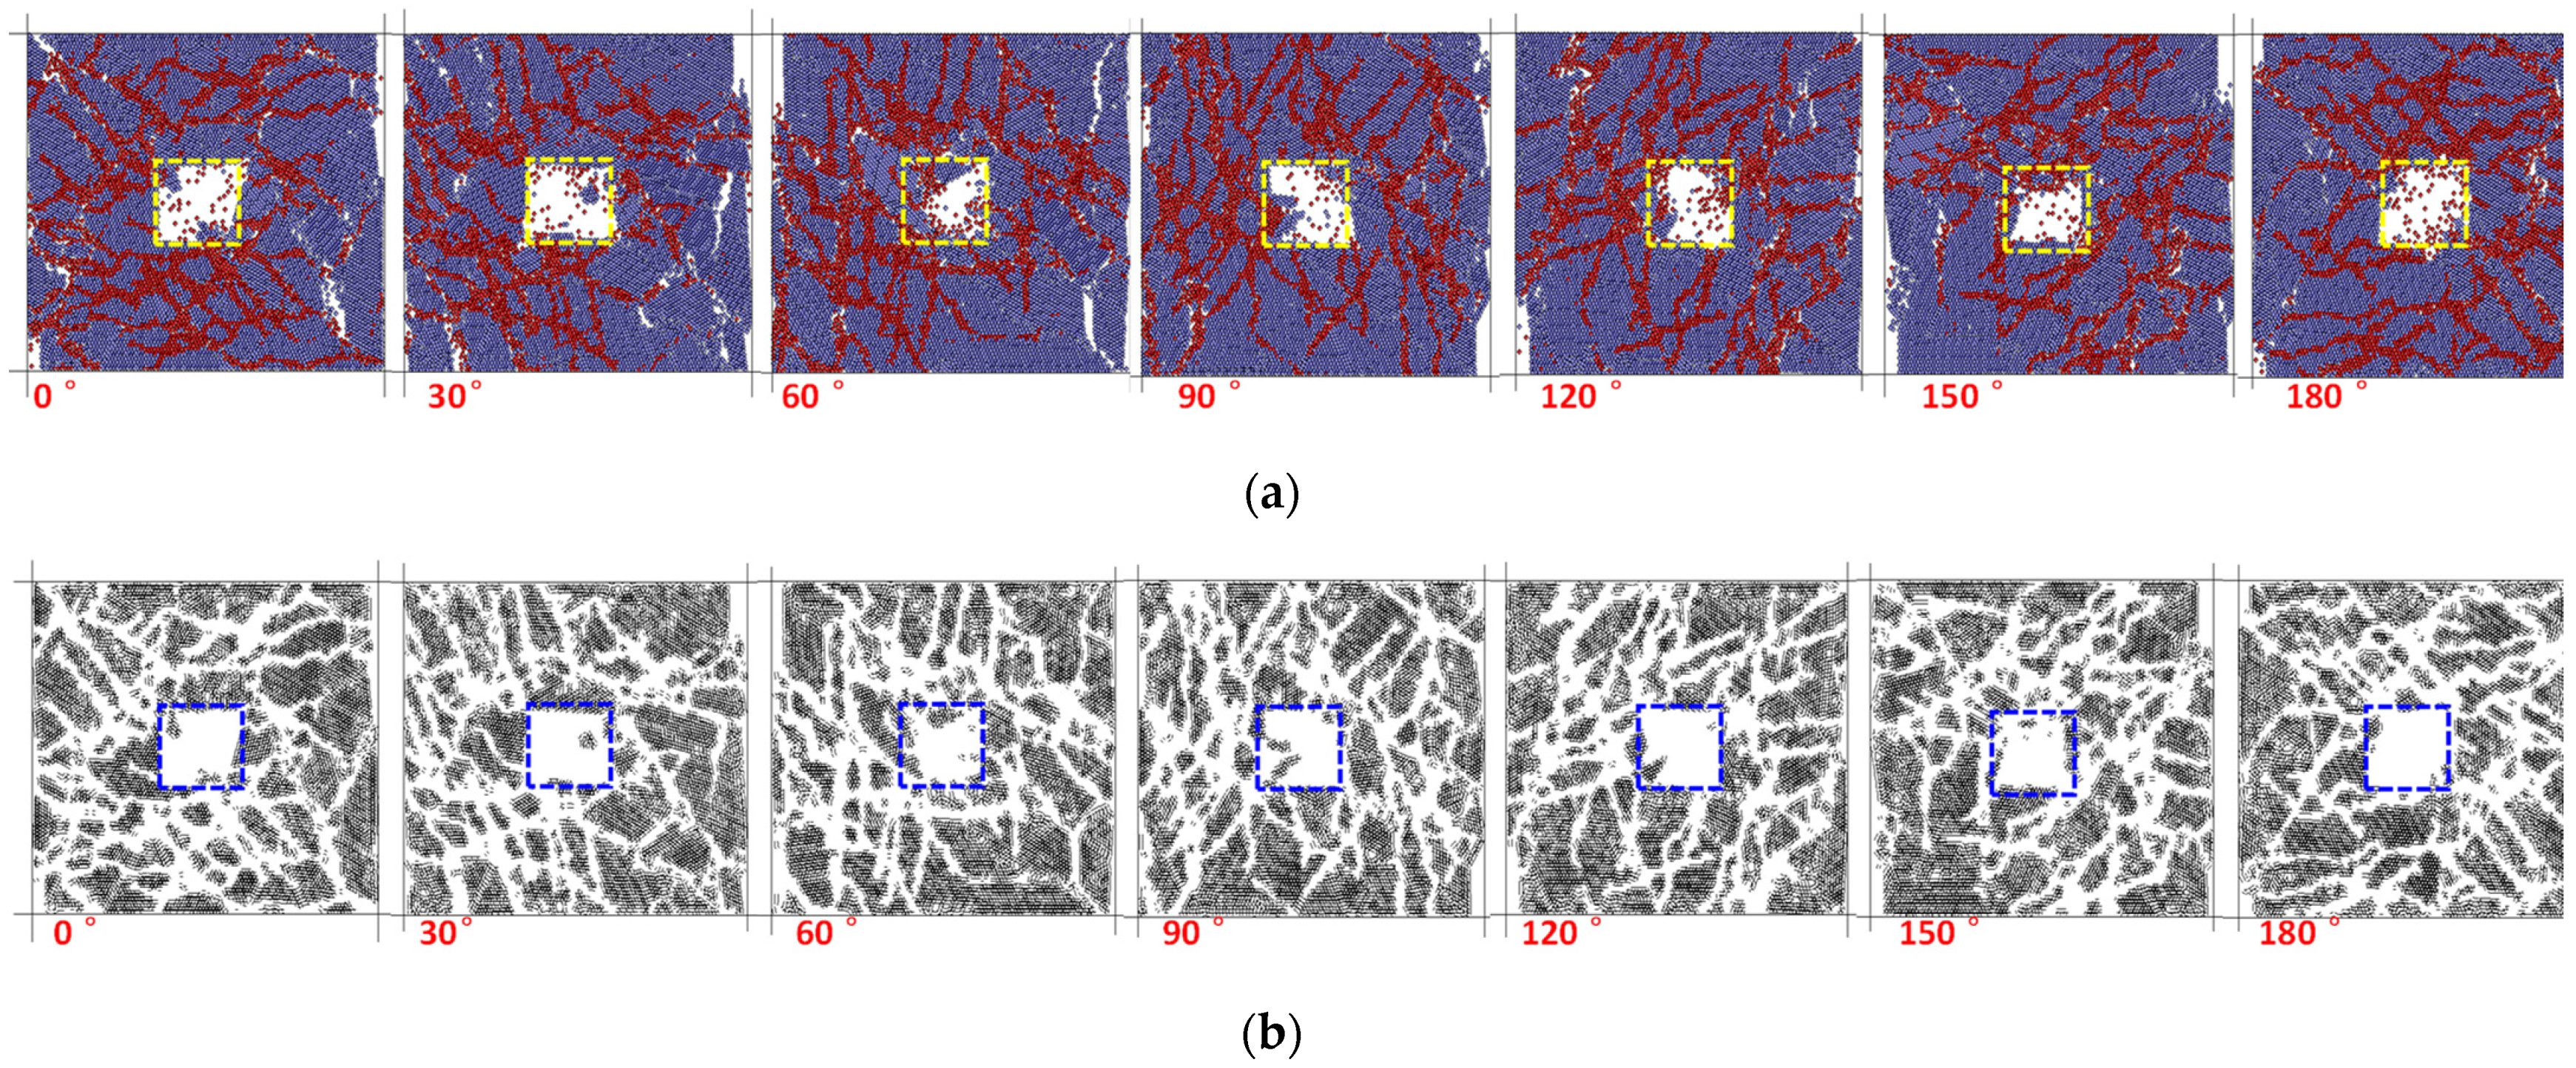
3.3. Numerical Analysis of the Anisotropic Mechanical Properties

Anisotropic mechanical behaviours of jointed rock mass are key influencers for the deformation and failure of rock engineering, and have been paid attention in recent years [36,37,38,39,40]. RDFN models with different rotation angles and the same size were established to evaluate the anisotropy of rough-jointed rock mass under biaxial compression. Firstly, a square area rock mass with a fixed pixel size was selected based on the fixed centre point of the original model. Thereafter, the selected regional rock mass was rotated to seven different angles (θ = 0°, 30°, 60°, 90°, 120°, 150°, 180°), with interception at the same size to establish the models (as shown in Figure 6 and Figure 7). According to the specimens, we could examine the spatial variation of deformation and strength of the jointed rocks. Finally, the digital images compiled by MATLAB converted these models into PFC models (as shown in Figure 8) for the compression test to study the differences in mechanical properties between models in different directions. The information of the intact rock elements and joint elements is listed in Table 5. As is shown in Figure 6, the wall elements, which could provide numerical boundary conditions around the joint model in the PFC code, are set up to monitor both the stress and displacement. The confining pressure is monitored by controlling the servo pressure in both the x and y directions, whose value was initially set as 1 MPa. According to the preload, the confining pressure is first applied to the particle model. The preload is controlled by changing the magnitude of the servo stress in the x-direction and y-direction. Thereafter, the servo in the y-axis direction is set to turn off while the servo in the x-axis direction is turned on and the y-axis direction is constantly being loaded.
The following monitoring is carried out during loading: (1) the change in the distance between the walls is used as the benchmark for compression displacement to monitor the change in the distance between the upper and lower walls. According to the displacement obtained by the distance change, the instantaneous strain of the rock mass in the biaxial compression test was calculated based on the displacement obtained from the distance change. Thereafter, the detailed information file of the stress and strain change for each step is exported. (2) The reaction forces on the upper and lower walls are monitored and the average value of the reaction forces is used as the instantaneous normal stress of biaxial compression. (3) The distribution of the connection bonds between particles is monitored to study the mesoscopic failure mechanism of jointed rock masses.

4. Numerical Results

To study the anisotropy of fractured rock mass, the mixed model was rotated to different angles (θ = 0°, 30°, 60°, 90°, 120°, 150°, 180°), and the same size (100 m × 100 m) was intercepted in the same area. Thereafter, the mixed models in different directions were converted into the PFC code for the biaxial compression test. The damage mechanism and stress–strain of the compression test of the models in different directions were monitored during the test. From the perspective of the failure mode of the rock mass (as shown in Figure 9), most of the failure of the rock mass is caused by extension along the tip of the existing joints until crack formation. When the direction of the RDFN model is 30°, the failure of the rock mass is mainly caused by the expansion and extension of linear joints until fissure formation. Although fractal joints and Fourier-type joints play a role in the destruction of the rock mass, no through joints are formed. Therefore, these joints have little effect on the damage of the rock mass. For RDFN models in other directions, the failure development mode of the rock mass is too complicated to distinguish the dominant joints that cause the failure of the rock mass. The different failure modes of the RDFN model in different directions indicate that the fractured rock mass has anisotropic mechanical characteristics.
By observing the stress–strain curves in Figure 10a, the shape curves of fractured rock mass in different directions are identified to differ. Moreover, the stress–strain curve of fractured rock mass has multiple peaks that differ from the intact rocks. According to the author, multiple peaks will exist in the stress–strain curve of fractured rock mass, such as 0° and 60°, which may be due to the complex distribution of structural planes of the actual fractured rock mass. In the process of compression, after the fractured rock mass bears certain external force conditions, some areas in the rock mass will first produce a small damage phenomenon in which some rock blocks slip along the mechanism. When the rock mass on both sides of these joints starts to move in a staggered manner, the stress–strain curve will have a small peak. When the rock blocks around multiple joints produce such dislocation phenomena, the stress–strain curve has multiple peaks, as shown in Figure 10a. The different shapes of the stress–strain curves in different directions further reflect the anisotropic mechanical properties of the fractured rock mass. Figure 9a,b show that the distribution of force chains and bond failure is significantly different due to the different distribution of joints during compression in different directions. According to Figure 10b, the peak compressive strengths from 0° to 180° are 17.77 MPa, 32.04 MPa, 24.51 MPa, 17.58 MPa, 13.94 MPa, 20.93 MPa, and 19.81 MPa, respectively, and the degree of anisotropy (the ratio of maximum to minimum) is approximately 2.30. Among them, the stress peak intensity of the RDFN model in the 30° direction is the largest, of which the stress distribution is relatively uniform, and the stress concentration area is fewer. Further, its stress–strain curve is closer to the shape of the stress–strain curve of the complete rock mass. These findings indicate that although the distribution of joints in the 30° direction RDFN model is as complicated as that of others, the degree of cutting by the joints is not high and no through cracks are formed, thereby indicating that its mechanical properties, such as strength and deformation, are closer to that of a complete rock mass. Therefore, the peak compressive strength of fractured rock mass in the 30° direction is higher than that in other directions. Further, the failure development mode, stress distribution, and stress–strain curve of fractured rock mass in different directions reflect the anisotropy of fractured rock mass.

5. Discussion

The anisotropic properties of the RDFN models have been discussed. It has been accepted that the fracture patterns of underground openings are greatly influenced by the distribution of the structure planes. Figure 11 shows the anisotropic failure patterns of the RDFN model after excavation. In this test, vertical load is applied on top and bottom boundaries, with a confining pressure of 1.0 MPa. The failure modes of the opening are highly affected by the orientation of the fracture sets. Meanwhile, certain joint sets will dominate the failure of the surrounding rock mass. Take the loading direction of 30° for example, roof failure is the principal failure type. However, rib spalling occurs when the loading direction comes to 90°.
The failure patterns are affected by both the stresses conditions and the excavation types for the jointed rock masses [41,42]. Figure 12 shows the failure patterns of surrounding rocks of the RDFN model with rectangular and circular opening. According to Figure 12a, the failure area is relatively smaller than the circular opening (Figure 12b). A larger convergence area could be obtained in the circular opening model due to the effect of the fracture sets. Similar fracture patterns observed around openings with structural planes are shown in Figure 13. According to the comparison, the influence of the distribution and geometry should be taken into account when assessing the failure modes and area of underground openings. The proposed RDFN model could provide a new reasonable model for the simulation of jointed rock mass, especially when estimating the failure patterns of surrounding rock mass of underground openings.

6. Conclusions

In this study, the jointed rock mass of the surrounding rock of the roadway was employed as the research object. The digital image of the RDFN model of various geometric forms was established in the MATLAB platform by considering the random distribution characteristics and roughness characteristics of the joint structural surface. By employing the principle of image recognition, numerical modelling of the real joint geometric distribution of rock mass on the two-dimensional particle flow code, PFC2D, was achieved. Finally, biaxial compression tests and excavation of different RDFN models were carried out to study the anisotropic mechanical characteristics of RDFN models. The main conclusions drawn are as follows:
(1) A rough discrete joint network model representation method based on the Fourier transform principle was proposed and combined with digital image recognition technology to establish a particle flow discrete element numerical calculation model, which provides a new mathematical representation method and mechanical calculation model for the study of the mechanical properties of jointed rock masses.
(2) The geometric shape of joints is an important factor affecting the final failure mode of rock mass, and the failure modes differ with different joint shapes. The compression failure mode of rough-jointed rock mass is more complex than that of intact rock mass, which may possess multiple shear slip surfaces. Therefore, the stress–strain curve will change and multiple peaks will appear. The strength and failure development modes of fractured rock mass in different directions also differ, and the discrete joint network model considering the geometric shape of complex joints can effectively analyse the mechanical properties of rock mass with complex natural structural planes.
(3) The loading anisotropy of the complex RDFN model is significant. In different loading directions from 0° to 180°, the peak compressive strengths are 17.77 MPa, 32.04 MPa, 24.51 MPa, 17.58 MPa, 13.94 MPa, 20.93 MPa, and 19.81 MPa, respectively. Further, the anisotropy is 2.30 and the maximum direction is 30°. The peak compressive strength of joint models in different directions is significantly different, and the failure modes of the jointed rock masses in different loading directions is significantly affected by the geometric distribution of the structural planes.
(4) The failure modes of the opening are highly affected by the orientation of the fracture sets. Meanwhile, certain joint sets will dominate the failure of the surrounding rock mass. The existence of the rough fracture sets could influence the failure area of different excavation situations. The influence of the distribution and geometry should be taken into account when assessing the failure modes and area of underground openings. The proposed RDFN model could provide a new reasonable model for estimating the failure modes of jointed rock mass.

Author Contributions

Methodology, P.W.; software, C.L. and Z.Q.; investigation, P.W.; data curation, Z.L.; writing—review and editing, P.W.; supervision, M.C.; project administration, P.W. All authors have read and agreed to the published version of the manuscript.

Funding

This work was financially supported by the National Natural Science Foundation of China (No. 52074020), the National Key R&D Program of China (Nos. 2021YFC2900500, 2021YFC3001302), and the Open Fund of State Key Laboratory of Water Resource Protection and Utilization in Coal Mining (No. WPUKFJJ2019-06).

Institutional Review Board Statement

Not applicable.

Informed Consent Statement

Not applicable.

Data Availability Statement

Some or all data, models, or code that support the findings of this study are available from the corresponding author upon reasonable request.

Conflicts of Interest

The authors declare that they have no conflict of interest.

References

  1. Malan, D.F.; Spottiswoode, S.M. Time-dependent fracture zone behavior and seismicity surrounding deep level stopping operations. In Rockburst and Seismicity in Mines; Balkema, A.A., Ed.; CRC Press: Boca Raton, FL, USA, 1997; pp. 173–177. [Google Scholar]
  2. Sellers, E.J.; Klerck, P. Modeling of the effect of discontinuities on the extent of the fracture zone surrounding deep tunnels. Tunn. Undergr. Space Technol. 2000, 15, 463–469. [Google Scholar] [CrossRef]
  3. Liu, G.; Zhao, J.; Song, H.W. Numerical simulation study on influence of joint distribution on failure of rock mass. J. China Univ. Min. Technol. 2007, 36, 17–22. [Google Scholar]
  4. Chen, X.; Liao, Z.H.; Li, D.J. Experimental study of effects of joint inclination angle and connectivity rate on strength and deformation properties of rock masses under uniaxial compression. Chin. J. Rock Mech. Eng. 2011, 30, 781–789. [Google Scholar]
  5. Li, X.F.; Li, H.B.; Xia, X.; Feng, H.P. Numerical simulation study on mechanical characteristics of joint-like rocks in direct shear test. Rock Soil Mech. 2016, 37, 583–591. [Google Scholar]
  6. Xiao, W.M.; Deng, R.G.; Fu, X.M.; Wang, C.Y. Model test study on deformation and strength anisotropy of columnar jointed rock mass under uniaxial compression. Chin. J. Rock Mech. Eng. 2014, 33, 957–963. [Google Scholar]
  7. Zhou, H.; Meng, F.Z.; Zhang, C.Q.; Lu, J.J.; Xu, R.C. Experimental study on the influence of fractures with different positions and sizes on rock mass failure. Chin. J. Rock Mech. Eng. 2015, 34, 3018–3028. [Google Scholar]
  8. Li, H.B.; Liu, B.; Feng, H.P.; Zhang, L.Q. Study on shear deformation characteristics and failure mechanism of simulated rock joint specimens. Rock Soil Mech. 2018, 8, 1741–1746,1752. [Google Scholar]
  9. Wang, P.T.; Yang, T.H.; Yu, Q.L. Permeability tensor and seepage properties for jointed rock masses based on discrete fracture network model. Rock Soil Mech. 2013, 34, 448–455. [Google Scholar]
  10. Wang, J.L.; Chen, X.; Huang, Y.Y.; Zhang, Z.; Man, G. Computation of heterogeneous steady flow through two-dimensional discrete fracture network model in rock mass. Geotech. Investig. Surv. 2015, 4, 44–48. [Google Scholar]
  11. Ye, Z.Y.; Jiang, Q.H.; Liu, Y.Z.; Cheng, A.P.; Sun, F.T. Numerical analysis of unsaturated seepage flow through discrete fracture networks of rock. Rock Soil Mech. 2017, 38, 3332–3340. [Google Scholar]
  12. Wang, Y.; Li, X.; Liu, S.; He, J.; Li, T. Stability calculation for discrete fracture network of rock masses based on joint finite element method. Chin. J. Rock Mech. Eng. 2013, 32, 3337–3345. [Google Scholar]
  13. Jimenez, R.R.; Sitar, N. Influence of Stochastic Discontinuity Network Parameters on the Formation of Removable Blocks in Rock Slopes. Rock Mech. Rock Eng. 2018, 41, 563–585. [Google Scholar] [CrossRef]
  14. Lisa, H.; Christian, B.; Asa, F.; Gunnar, G.; Johan, F. A hard rock tunnel case study: Characterization of the water-bearing fracture system for tunnel grouting. Tunn. Undergr. Space Technol. 2012, 30, 132–144. [Google Scholar] [CrossRef]
  15. Macciotta, R.; Gräpel, C.; Skirrow, R. Fragmented rockfall volume distribution from photogrammetry-based structural mapping and discrete fracture networks. Appl. Sci. 2020, 10, 6977. [Google Scholar] [CrossRef]
  16. Kiuru, R.; Király, D.; Dabi, G.; Jacobsson, L. Comparison of DFN modelled microfracture systems with petrophysical data in excavation damaged zone. Appl. Sci. 2021, 11, 2899. [Google Scholar] [CrossRef]
  17. Nasseri, M.H.B.; Grasselli, G.; Mohanty, B. Fracture toughness and fracture roughness in anisotropic granitic rocks. Rock Mech. Rock Eng. 2010, 43, 403–415. [Google Scholar] [CrossRef]
  18. Tien, Y.M.; Kuo, M.C.; Juang, C.H. An experimental investigation of the failure mechanism of simulated transversely isotropic rocks. Int. J. Rock Mech. Min. Sci. 2006, 43, 1163–1181. [Google Scholar] [CrossRef]
  19. Brideau, M.; Ming, Y.; Stead, D. The role of tectonic damage and brittle rock fracture in the development of large rock slope failures. Geomorphology 2009, 103, 30–49. [Google Scholar] [CrossRef]
  20. Doug, S.; Wolter, A. A critical review of rock slope failure mechanisms: The importance of structural geology. J. Struct. Geol. 2015, 74, 1–23. [Google Scholar]
  21. Mustaqim, M.-N.M.; Song, K.I.; Kim, D.; Chang, I. Evolution of Joint Roughness Degradation from Cyclic Loading and Its Effect on the Elastic Wave Velocity. Rock Mech. Rock Eng. 2016, 49, 3363–3370. [Google Scholar]
  22. Barton, N. Review of a new shear strength criterion for rock joints. Eng. Geol. 1973, 7, 287–332. [Google Scholar] [CrossRef]
  23. Ge, Y.F.; Pinnaduwa, K.; Tang, H.N.; Xiong, C. Investigation of natural rock joint roughness. Comput. Geotech. 2014, 55, 290–305. [Google Scholar] [CrossRef]
  24. Xie, H.P.; Pariseau, W.G. Fractal estimation of joint roughness coefficients. Sci. China Series B 1994, 37, 1516–1524. [Google Scholar]
  25. Zhao, Y.L.; Wan, W.; Wang, W.J.; Wang, M.; Peng, Q.Y. Shear numerical simulation of random morphology rock joint and nonlinear shear dilatancy model. Chin. J. Rock Mech. Eng. 2013, 32, 1667–1675. [Google Scholar]
  26. Zhao, L.; Yu, C.; Huang, D.; Wang, X.; Zhang, S.; Jiao, K. Fourier-based reconstruction of rock joint and the statistical analysis of its morphology. J. Railw. Sci. Eng. 2017, 14, 1606–1613. [Google Scholar]
  27. Shen, M.R.; Zhang, Q.Z. Experimental study of shear deformation characteristics of rock mass discontinuities. Chin. J. Rock Mech. Eng. 2010, 29, 0713–0719. [Google Scholar]
  28. Cui, G.J.; Zhang, C.Q.; Han, H.C.; Zeng, Z.; Zhou, H.; Lu, J.J. Experimental study on shear behaviors of artificial joint under CNL and CNS boundary conditions. Chin. J. Rock Mech. Eng. 2019, 38, 3384–3392. [Google Scholar]
  29. Dang, W.G.; Chen, J.P.; Huang, L.C. Experimental study on the velocity-dependent frictional resistance of a rough rock fracture exposed to normal load vibrations. Acta Geotech. 2021, 16, 2189–2202. [Google Scholar] [CrossRef]
  30. Wang, P.T.; Ren, F.H.; Cai, M.F. Influence of joint geometry and roughness on the multiscale shear behaviour of fractured rock mass using particle flow code. Arab. J. Geosci. 2020, 13, 165–179. [Google Scholar] [CrossRef]
  31. Elmo, D.; Stead, D.; Eberhardt, E.; Vyazmensky, A. Applications of Finite/Discrete Element Modeling to Rock Engineering Problems. Int. J. Geomech. 2013, 13, 565–580. [Google Scholar] [CrossRef] [Green Version]
  32. Alghalandis, Y.F. ADFNE: Open source software for discrete fracture network engineering, two and three dimensional applications. Comput. Geosci. 2017, 102, 1–11. [Google Scholar] [CrossRef]
  33. Dershowitz, W.S.; Pointe, P.; Doe, T.W. Advances in Discrete Fracture Network Modeling. In Proceedings of the Jan., 2004 U.S. EPA/NGWA Fractured Rock Conference: State of the Science and Measuring Success in Remediation, Portland, ME, USA, 13–15 September 2004; pp. 882–894. [Google Scholar]
  34. Odling, N.E. Natural fracture profiles, fractal dimension and joint roughness coefficients. Rock Mech. Rock Eng. 1994, 27, 135–153. [Google Scholar] [CrossRef]
  35. Wang, P.T.; Yang, T.H.; Zhu, L.K.; Liu, H.L. Strength reduction method for rock slope stability analysis based on PFC2D. J. Northeast. Univ. (Nat. Sci.) 2013, 34, 127–130. [Google Scholar]
  36. Gong, L.; Nie, L.; Xu, Y. Discrete element analysis of the strength anisotropy of fiber-reinforced sands subjected to direct shear load. Appl. Sci. 2020, 10, 3693. [Google Scholar] [CrossRef]
  37. Wang, P.T.; Cai, M.F.; Ren, F.H. Anisotropy and directionality of tensile behaviours of a jointed rock mass subjected to numerical Brazilian tests. Tunn. Undergr. Space Technol. 2018, 73, 139–153. [Google Scholar] [CrossRef]
  38. Wang, P.; Ren, F.; Miao, S.; Cai, M.; Yang, T. Evaluation of the anisotropy and directionality of a jointed rock mass under numerical direct shear tests. Eng. Geol. 2017, 225, 29–41. [Google Scholar] [CrossRef]
  39. Wang, P.T.; Yang, T.H.; Zhou, J.R. Slope failure analysis considering anisotropic characteristics of foliated rock masses. Arab. J. Geosci. 2018, 11, 1–15. [Google Scholar] [CrossRef]
  40. Wang, P.; Yang, T.; Xu, T.; Cai, M.; Li, C. Numerical analysis on scale effect of elasticity, strength and failure patterns of jointed rock masses. Geosci. J. 2016, 20, 539–549. [Google Scholar]
  41. Mathieu, E. At the Mercy of the Mountain. Tunn. Tunn. Int. 2008, 21–24. Available online: https://www.pizzarotti.it/english/rass-30-at_the_mercy_of_the_mountain (accessed on 8 January 2022).
  42. Lisjak, A.; Garitte, B.; Grasselli, G.; Müller, H.R.; Vietor, T. The excavation of a circular tunnel in a bedded argillaceous rock (Opalinus Clay): Short-term rock mass response and FDEM numerical analysis. Tunn. Undergr. Space Technol. 2015, 45, 227–248. [Google Scholar] [CrossRef] [Green Version]
Figure 1. The roughness of natural discontinuities in fractured rock masses. (a) The micro fracture [17]. (b) Bedding planes [18]. (c) The step-path surface at the Aishihik River Landslide [19]. (d) The macro fold [20].
Applsci 12 01720 g001
Figure 2. The rough fractures distributed in the natural jointed rock mass. (a) The rough joints distribution. (b) The linear DFN model. (c) The proposed RDFN model.
Applsci 12 01720 g002
Figure 3. Principle of the Fourier-based RDFN models.
Applsci 12 01720 g003
Figure 4. The RDFN models of varied geometry types. (a) The Linear DFN model. (b) The Fractal RDFN model. (c) The Fourier type RDFN model. (d) The mixed RDFN model.
Applsci 12 01720 g004aApplsci 12 01720 g004b
Figure 5. Digital image and the PFC simulation model. (a) The colour DFN model diagram. (b) The PFC numerical calculation model.
Applsci 12 01720 g005
Figure 6. The schematic of RDFN models under varied directions for anisotropic test.
Applsci 12 01720 g006
Figure 7. Joint model taken by rotation at different angles.
Applsci 12 01720 g007
Figure 8. PFC model of joints intercepted by rotation at different angles.
Applsci 12 01720 g008aApplsci 12 01720 g008b
Figure 9. Anisotropic properties of complex RDFN models. (a) The contact force chain distribution characteristics. (b) The failure modes of rock masses.
Applsci 12 01720 g009
Figure 10. Anisotropic properties of the jointed rock mass. (a) The Stress–strain curves in different directions. (b) The peak compressive strength in different directions (unit: MPa).
Applsci 12 01720 g010
Figure 11. Anisotropic properties of RDFN models after excavation under different loading directions. (a) The failure patterns. (b) The bond failure of different rock masses.
Applsci 12 01720 g011
Figure 12. Failure patterns of the RDFN models with varied excavation shapes. (a) A rectangular shape (size: 40 m × 40 m). (b) A circular shape (diameter = 40 m).
Applsci 12 01720 g012aApplsci 12 01720 g012b
Figure 13. Comparison of fracture patterns observed around openings with structural planes. (a) The present numerical simulation. (b) The convergence area of a circular tunnel (after Mathieu [41]). (c) The failure pattern of a circular tunnel in a bedded rock (after Lisjak et al. [42]).
Applsci 12 01720 g013
Table 1. The Fourier parameters of the five curves.
Serial NumberAmplitude, (Amax)/mFrequency,
ω
Ascent Width,
d/m
Fourier Series, n
#1330.150
#2420.150
#3920.530
#4230.550
#5620.00150
Table 2. Information of the joint network of varied jointed rock models.
Joint TypeGroupLinear Density (/m−1)Dip (°)Trace Length (m)Amplitude (m)FrequencySeries (n)
TypeMeanDeviationTypeMeanVariance
Straight joints#10.3Evenly distributed015Evenly
distributed
32---
#20.25Evenly
distributed
4515Evenly
distributed
51---
#30.25Evenly
distributed
13515Evenly
distributed
21---
Fractal joints#10.3Evenly
distributed
015Evenly
distributed
320.15--
#20.25Evenly
distributed
4515Evenly
distributed
510.15--
#30.25Evenly
distributed
13515Evenly
distributed
210.15--
Fourier joints#10.3Evenly
distributed
015Evenly
distributed
320.150.550
#20.25Evenly
distributed
4515Evenly
distributed
510.150.7510
#30.25Evenly
distributed
13515Evenly
distributed
210.150.510
Mixed joints#10.3Evenly
distributed
015Evenly
distributed
320.15--
#20.25Evenly
distributed
4515Evenly
distributed
510.150.7510
#30.25Evenly
distributed
13515Evenly
distributed
21---
Table 3. PFC model particle information.
TypeTotal Number of UnitsRock UnitJoint UnitRatio of Joint Units
PFC model22,50019,477302313.43%
Table 4. Micro-mechanical parameters of the particle model.
TypeMicro-ParametersNumerical Value
Particle propertiesRatio of particles,
Rmax/Rmin
1.7
Particle density (kg/m3)2700
Static elastic modulus between particles (Pa)6.0e9
Particle method/Tangential stiffness ratio0.45
Coefficient of friction 0.7
Parallel connection propertiesModulus of elasticity (GPa)5.4
Normal/Tangential stiffness ratio 0.45
Normal strength/Standard deviation (MPa)4.5/0.6
Shear strength/Standard deviation (MPa)5.0/0.7
Parallel bond radius multiplier1.0
Table 5. PFC model particle information.
AngleTotal Number of ElementsRock ElementsJoint ElementsRatio of Joint
10,0007005299529.95%
30°10,0007284271627.16%
60°10,0007146285428.54%
90°10,0006976302430.24%
120°10,0007071292929.29%
150°10,0007124287671.24%
180°10,0006892310868.92%
Publisher’s Note: MDPI stays neutral with regard to jurisdictional claims in published maps and institutional affiliations.

