Article

An Optimization Method for Mix Proportion of Wet-Mix Shotcrete: Combining Artificial Neural Network with Particle Swarm Optimization

1
Civil and Resource Engineering School, University of Science and Technology Beijing, Beijing 100083, China
2
FENY Corporation Limited, Changsha 410600, China
3
School of Resources and Safety Engineering, Central South University, Changsha 410083, China
4
Jinchuan Group Co., Ltd., Jinchang 737100, China
*
Author to whom correspondence should be addressed.
Appl. Sci. 2022, 12(3), 1698; https://doi.org/10.3390/app12031698
Submission received: 9 December 2021 / Revised: 19 January 2022 / Accepted: 25 January 2022 / Published: 8 February 2022

Abstract

:
Wet-mix shotcrete has been widely used to support roadways during the excavation of underground mining. In practice, the mix proportion of wet-mix shotcrete plays a key role in later successful application. To obtain an optimal mix proportion, a large number of trial physical experiments should be carried out. Therefore, in this paper, a new ANN–PSO model is proposed to obtain the mix proportion of wet-mix shotcrete quickly, precisely and economically. The artificial neural network (ANN) model was used to establish the objective functions for particle swarm optimization (PSO) optimization, while the PSO was adopted to optimize mix proportions of wet-mix shotcrete to achieve optimal objectives. This hybrid model was applied to optimize mix proportions of wet-mix shotcrete in the Jinchuan mine. The results revealed that the ANN model yielded a mean relative error (MRE) of 2.755% and an R2 of 0.980, indicating an excellent prediction to establish the reasonable objective function. Additionally, PSO spent less than 60 s obtaining an optimal mix proportion of wet-mix shotcrete required by the mine. Consequently, this ANN–PSO model can be used as an efficient design guide to facilitate decision making, prior to the construction phase.

1. Introduction

Wet-mix shotcrete is indispensable composite material for the application of tunneling, underground mining and building construction [1]. Apart from the excellent mechanical properties, there are other benefits with wet-mix shotcrete, including enhanced automation and reduced rebound and dust concentration. Given all these various advantages, wet-mix shotcrete will replace dry-mix shotcrete as the tendency of shotcrete development in the future. In practice, the uniaxial compressive strength (UCS) of wet-mix shotcrete is the primary concern since it is directly related to the integrity and durability of the supporting structures [2]. The UCS is mainly determined by the mix proportion of wet-mix shotcrete. Consequently, the optimal mix proportion is essential for the wide and safe application of wet-mix shotcrete.
To obtain an optimal mix proportion, there are many available optimization methods, which are generally divided into two categories, i.e., empirical optimization methods and computational optimization methods. As for the empirical optimization methods, the main method is to design specific physical experiments and analyze the results. Wet-mix shotcrete is a composite material with many components, such as cement, water, aggregates and so on. The complexity of the components forces researchers to carry out several physical experiments to obtain an optimal mix proportion under designed UCS values, which makes the optimization very time consuming, cumbersome and expensive [3]. Then, in order to decrease the number of experiments and increase the efficiency of optimization, an orthogonal experimental design method was used to design and instruct experiments. Zhi et al. analyzed the optimal mix proportion of concrete with recycled clay brick powder by using orthogonal experimental analysis [4]. Liu et al. investigated the effects of polypropylene fiber lengths on the compressive strength of wet-mix shotcrete and optimized the mix proportion by using an orthogonal experimental method [5]. Sinan et al. employed an orthogonal experimental method to analyze the optimal mix proportion of pavement concrete with fly ash and silica fume [6]. Although the orthogonal experimental design method has many advantages mentioned above, there is an important disadvantage that cannot be ignored; the number of mix proportion generated by the orthogonal experimental design method is very limited, and the method can only obtain the optimal mix proportion of given levels of experiments. So, this optimal mix proportion is a pseudo-optimal value. This has driven the search for easy and reliable methods to optimize the mix proportion. For computational optimization methods, the heuristic algorithm represented by particle swarm optimization (PSO) is a powerful tool to solve optimization problems. Particle swarm optimization has the advantages of strong robustness, simple operation and fast convergence. Tang et al. adopted the PSO algorithm to optimize the shape of truss structures [7]. Zhao et al. utilized the PSO algorithm to optimize the parameters of diesel engine–organic Rankine cycle (ORC) combined system [8]. Although PSO has been widely and successfully adopted in other engineering optimization problems, it is rare to use it to optimize mix proportion of wet-mix shotcrete. Therefore, a further study is essential to investigate the application potential of PSO in optimizing the mix proportion of wet-mix shotcrete.
Particle swarm optimization, like other heuristic algorithms, needs a defined objective function prior to the optimization process. In order to obtain a reasonable objective function, UCS, as one of the most important parameters, should be taken into account [9]. Many researchers have conducted a large number of studies to describe the relationship between the influencing factors and UCS, in other words, the prediction of UCS of wet-mix shotcrete. Liu et al. used the method of multiple nonlinear regression to study the effects of the water–binder ratio and the fly ash content on the compressive strength of concrete and predicted its strength [10]. Unfortunately, because of strong nonlinearity and uncertainty between the influencing factors and UCS, it is difficult to express the above relationship with a specific multivariate nonlinear function. Recently, artificial neural network (ANN) has paved another way to obtain the UCS of wet-mix shotcrete. Based on the characteristics of raw materials and mixing parameters, the UCS of wet-mix shotcrete can be predicted with acceptable accuracy with less or no lab experiments. ANN is similar to a black box model using training with the interconnected neurons rather than presumption, which can capture the mapping between inputs and outputs; therefore, it leads to an accurate prediction result [11]. Deng used ANN to predict the strength of ceramics under different mix ratios, which justified the use of ANN to predict the strength of the material [12]. Consequently, the objective function can be obtained by combining ANN with specific engineering requirements.
This paper aims to develop an intelligent model based on the ANN and PSO algorithm for optimizing mix proportion of wet-mix shotcrete. According to the investigations by the authors, the application of this ANN–PSO model for optimizing mix proportion of wet-mix shotcrete under important influencing variables of cement content, water–cement ratio, sand–coarse aggregate ratio and water reducer content has not been published in the literature. Moreover, this hybrid model was applied to optimize mix proportions of wet-mix shotcrete required by the Jinchuan mine. The presented intelligent model can significantly enhance the efficiency and accuracy of mix proportion optimization, which is of great significance to the successful engineering application of wet-mix shotcrete.

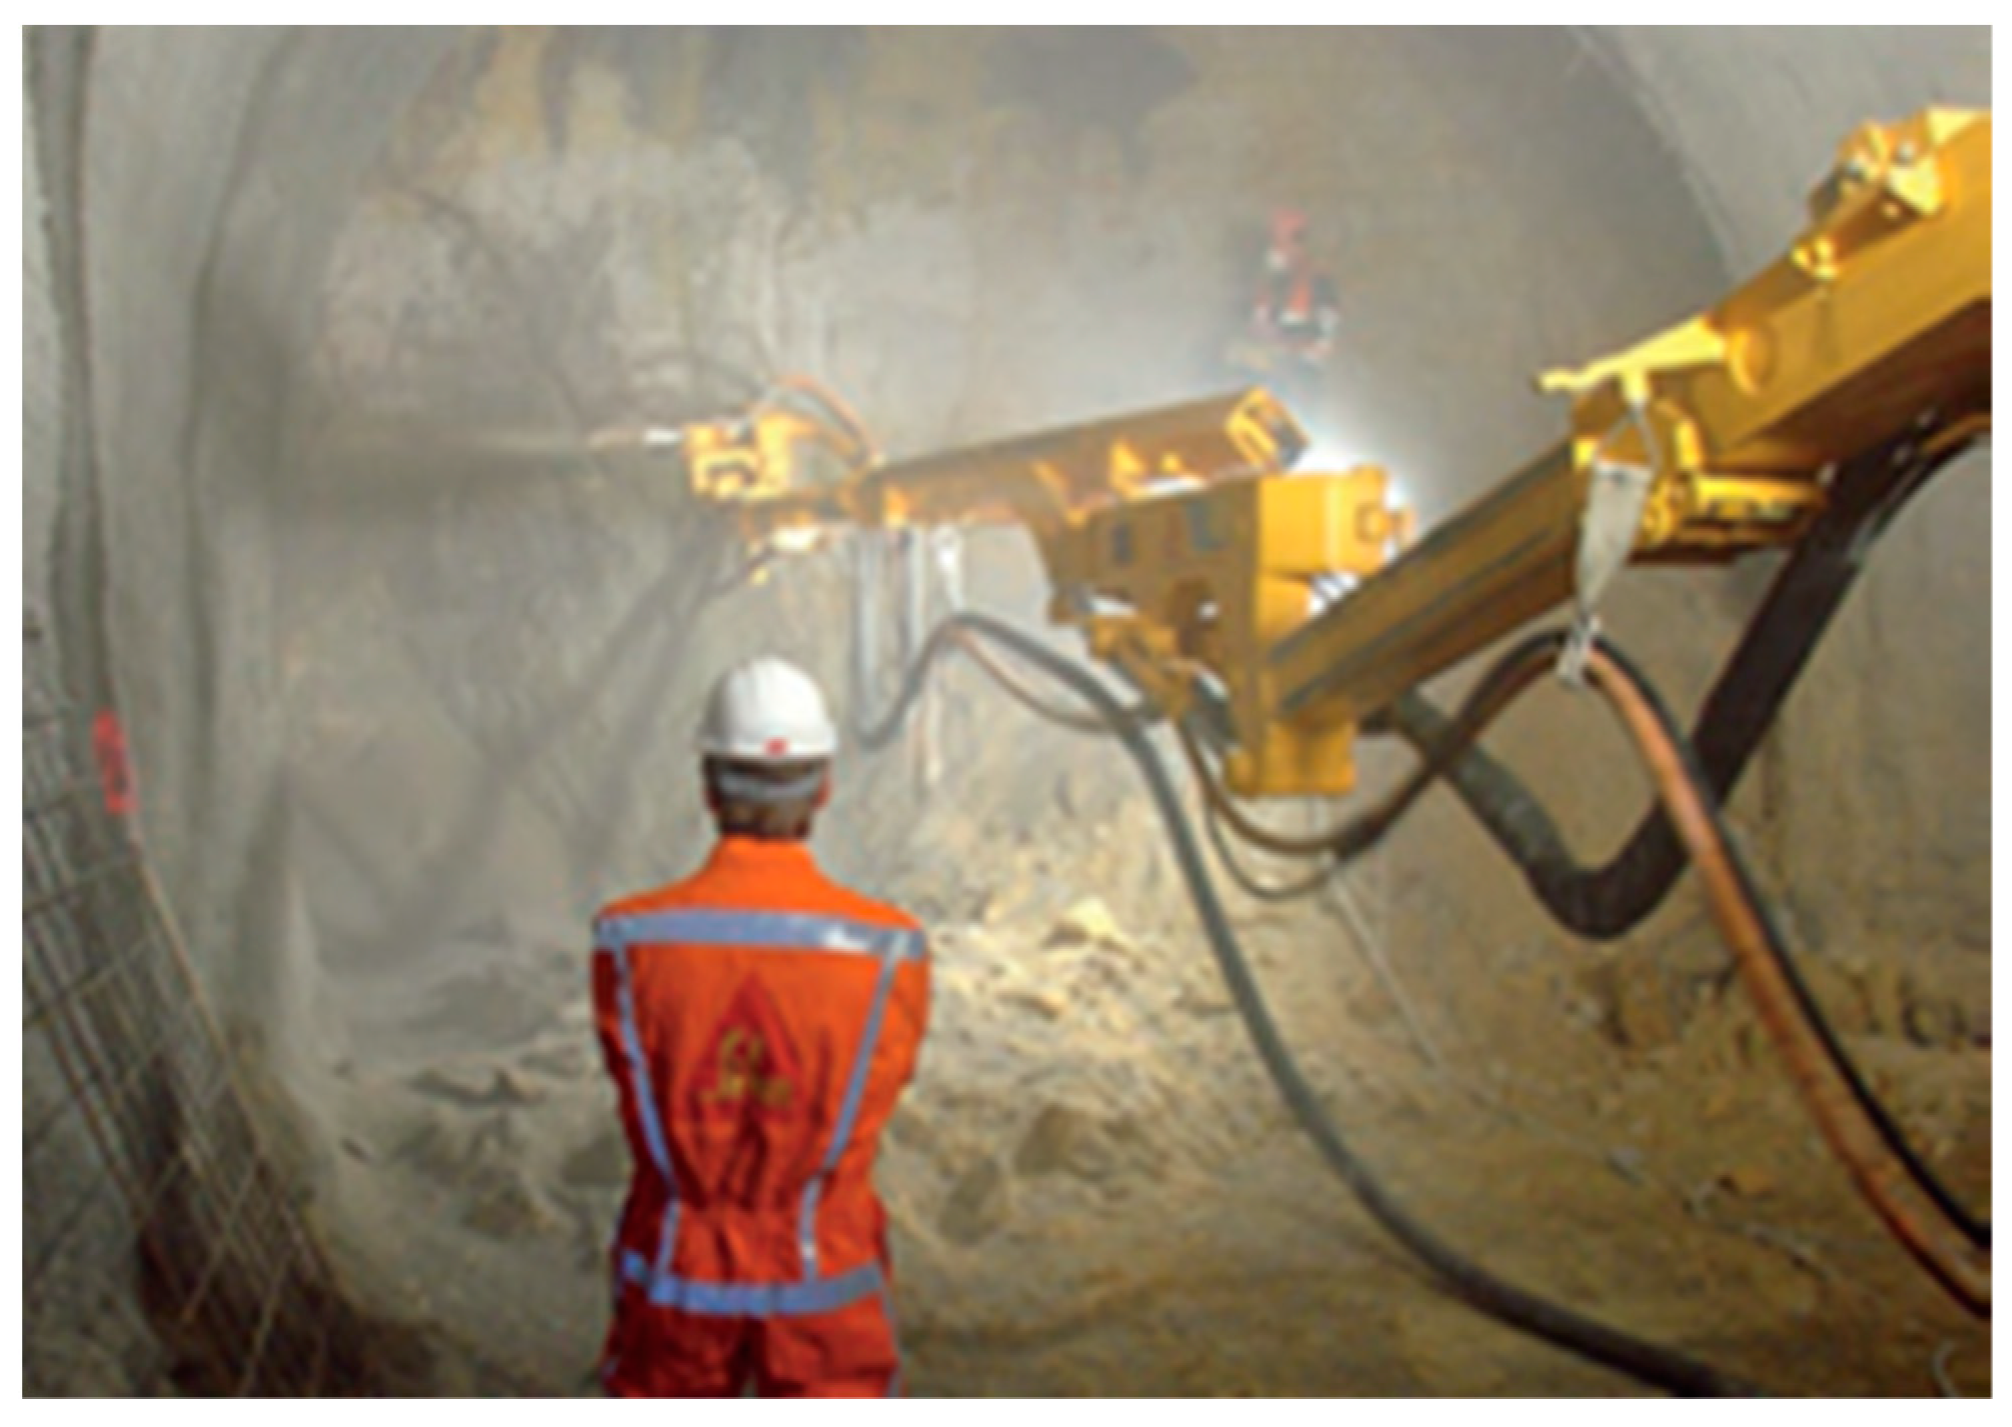
2. Application Background

The Jinchuan mine is the fourth largest nickel mine in the world, located in Jinchang city, Gansu Province, China. Due to the roadway characteristics of high in situ stress and the low strength of the surrounding rock in the Jinchuan mine, the combined support method of “cable bolt + shotcrete + steel mesh” was mostly used to maintain the stability of the roadway. However, the reinforcement effect of the combined support method was not satisfactory (see Figure 1). The field survey results revealed that the cracks of the shotcrete layer were the main form of failure of the roadway support. The reasons for roadway deformation or support failure are more complicated, but from the perspective of support, the reason was that the task of shotcrete at the Jinchuan mine was still carried out by using the traditional dry-mix shotcrete technique. The dry-mix shotcrete is nonuniformly mixed during spraying followed by poor compaction, low average strength, inhomogeneous concrete strength distribution, etc., and then it is difficult to provide sufficient support resistance to prevent the surrounding rock from displacing and deforming. Consequently, the Jinchuan mine has gradually begun to promote the use of wet-mix shotcrete technology, since wet-mix shotcrete overcomes the problems mentioned above, suffered by dry-mix shotcrete.
For the Jinchuan mine, the in situ stress varies according to the depth, and the rock quality varies from roadway to roadway, so it is necessary to use suitable wet-mix shotcrete for precise support of the roadway under different conditions, which can achieve the purpose of reducing the support cost while ensuring the stability of the roadway. Hence, the Jinchuan mine applied C20 wet-mix shotcrete support in the shallow 1000 m middle roadway project, C25 wet-mix shotcrete concrete support in the 850 m middle roadway project, and C30 wet-mix shotcrete support in the deep 640 m middle roadway project. Thus, in the process of promoting the use of wet-mix shotcrete, the most important issue was how to efficiently and accurately obtain the optimal mix proportion of wet-mix shotcrete under the designed conditions.
To address such shortcomings, this article proposed a new ANN–PSO model and used the mix proportion optimization of wet-mix shotcrete of the Jinchuan mine as an example in an attempt to optimize the mix proportion of wet mix concrete intelligently, accurately and economically.

3. Methodology and Materials

3.1. Optimization Procedure

The implementation of the presented ANN–PSO model can be executed easily. Generally, it can be summarized into four steps and the flowchart of the model is shown in Figure 2.
(1) Preparation and preprocessing of data: The datasets used for the training and testing of the ANN model were collected by carrying out physical experiments and then the data samples were normalized in the [0, 1] range. This step is detailed in Section 3.2.
(2) The establishment of the ANN model: Established the ANN model to capture the complicated mapping between UCS and the influencing factors of cement content, water–cement ratio, sand–coarse aggregate ratio, water reducer content and curing time, which can be adopted to the prediction of UCS of wet-mix shotcrete. The basis of the algorithm is presented in Section 3.3 and detailed results are shown in Section 4.1.
(3) Definition of the objective function: The definition of the objective function can be achieved by combining the well-trained ANN model with specific requirements of the Jinchuan mine in engineering application. This step is detailed in Section 3.4.
(4) PSO optimization: Taking objective function as the fitness function of PSO, PSO was run to perform a global search for the minimum fitness value. In this optimization question, the mix proportion corresponding to the minimum fitness value is the optimal mix proportion. This step is detailed in Section 3.5 and detailed optimization results are shown in Section 4.3.

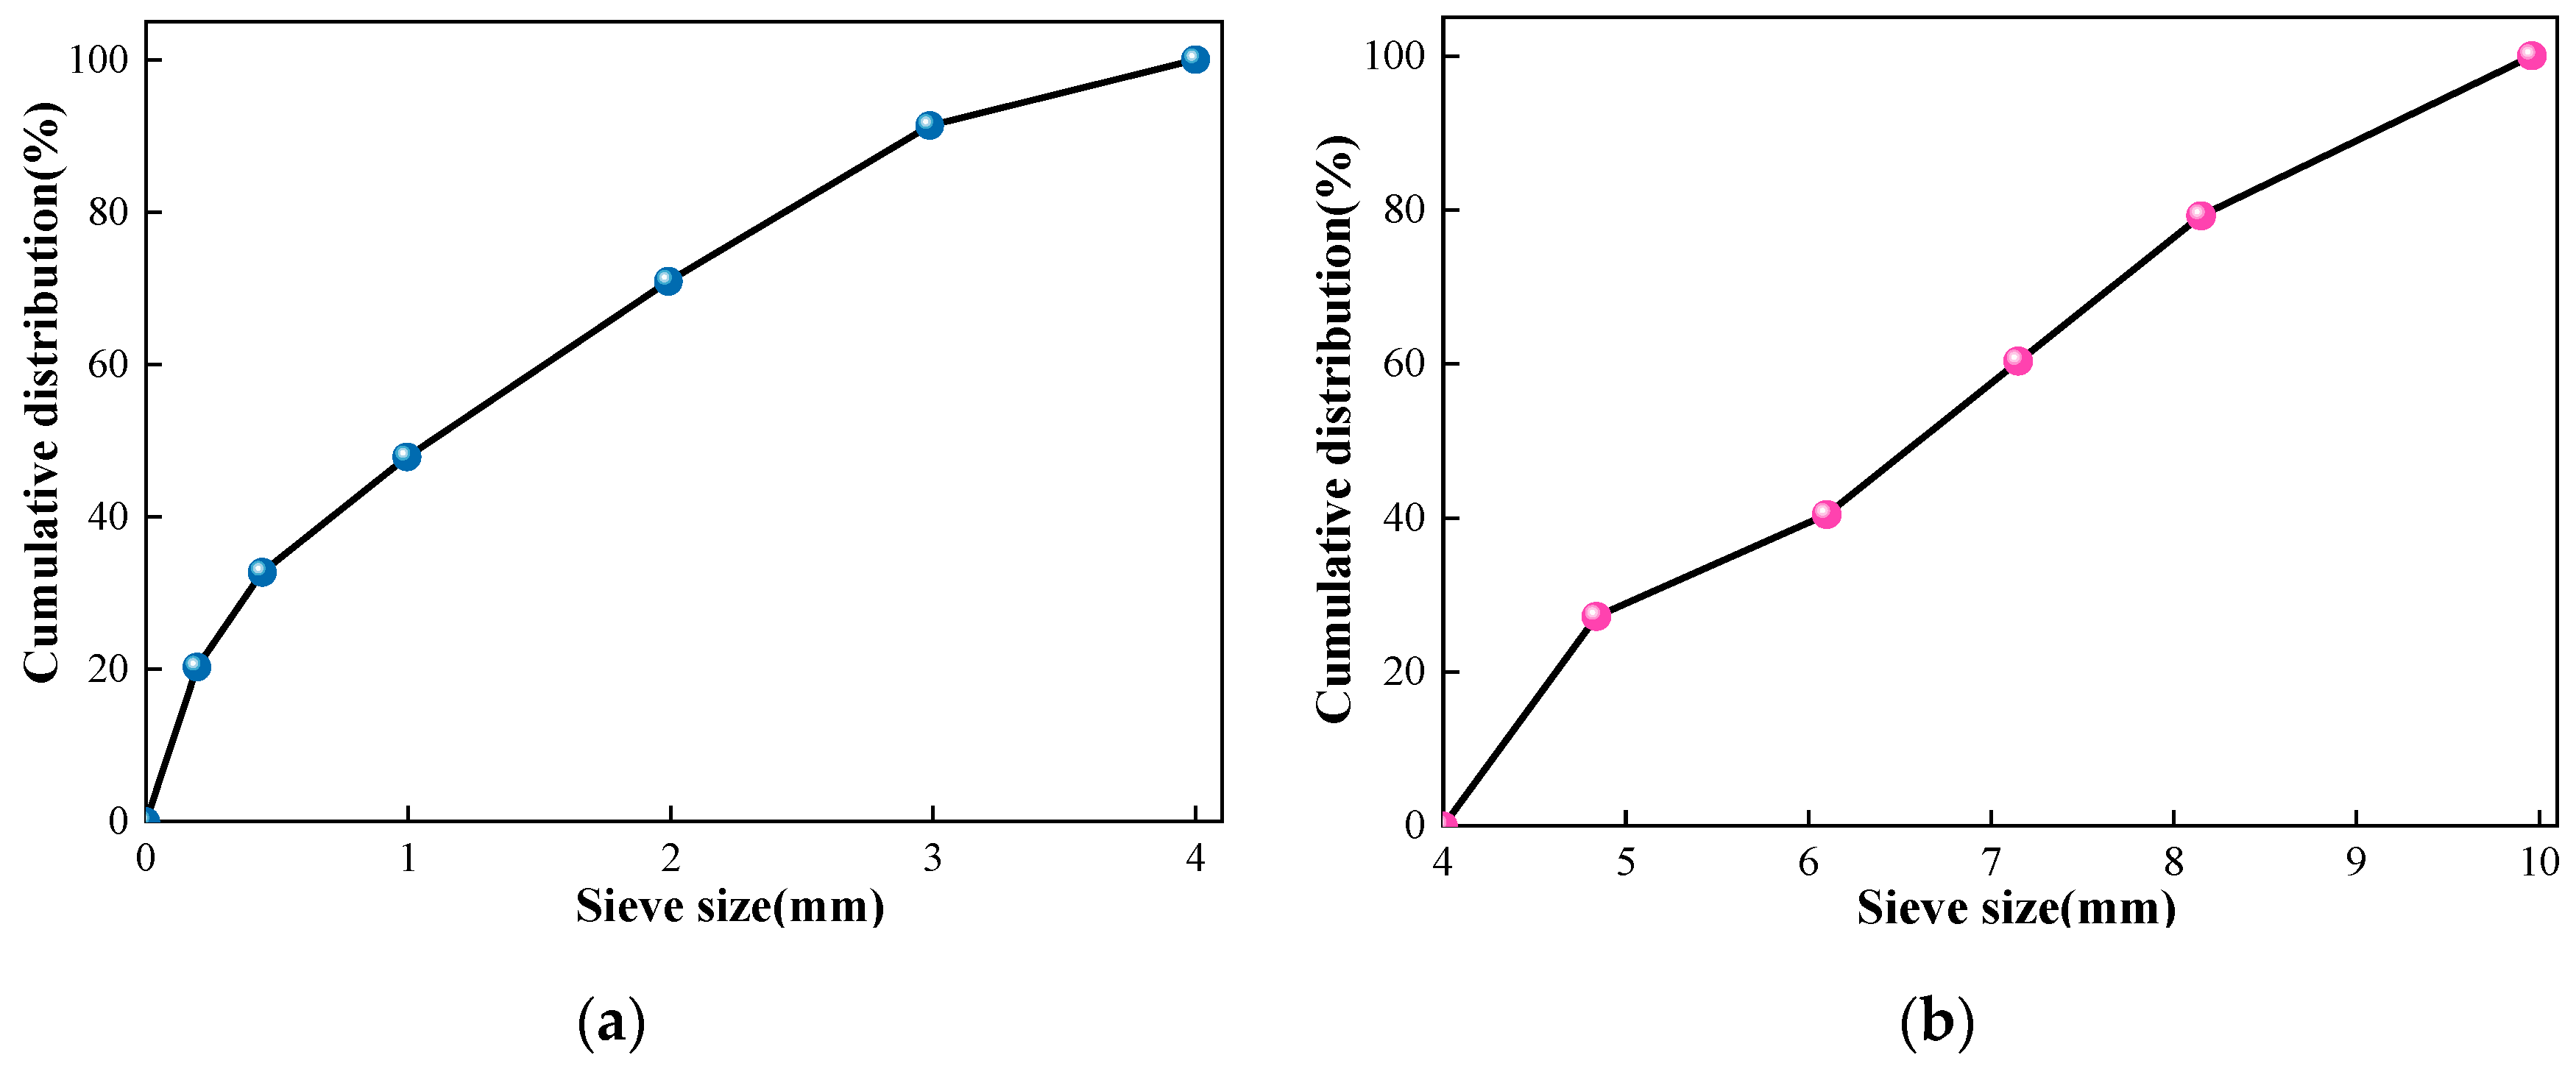
3.2. Dataset Preparation

To build up an ANN model, accurate experimental data of UCS values of wet-mix shotcrete is a prerequisite. In those experiments, P·O 42.5R cement produced by the Jinchuan mine was used as the binder agent, and the minimum UCS of cement is 42.5 MPa at 28 days. Tap water was used as the mixing water. The aggregate consists of local mungbean stone and rod-mill sand. Local mungbean stone was employed as a coarse aggregate with a specific gravity of 2.7 and maximum size of 10 mm. Rod-mill sand was used as a fine aggregate with a fineness modulus of 3.05 and a specific gravity of 2.65, with maximum size of 4 mm. The gradation curves of fine and coarse aggregates are shown in Figure 3. The admixture of water reducer was Rheoplus 26R produced by BASF Company, Jining, China.
The wet-mix shotcrete mixtures were prepared according to the experimental designs listed in Table 1. The wet-mix shotcrete specimens were made according to the standard GB/T 50081–2002 [13,14]. During the specimen preparation, all the ingredients of wet-mix shotcrete were first mixed fully by using concrete mixer, and then poured into the cube molds (edge length = 100 mm). The excess concrete slurry was removed by the sawing motion of the steel ruler. After 24 h, wet-mix shotcrete specimens were demolded and then cured in a standard curing box at 20 ± 2 °C and 95% humidity for 7 and 28 days. When the target curing time was reached, the UCS tests were performed on wet-mix shotcrete specimens using WES−100 hydraulic universal testing machine according to the standard GB/T 50081–2002 [13,14]. In order to ensure the accuracy of UCS values, three replicates were carried out for each experimental design and the mean UCS values were used for constructing the ANN model. In the end, a total of 96 UCS tests were carried out, leading to 32 samples in the dataset.
According to the rules of ANN, the 32 sets of data need to be divided into two parts: the training set and the testing set. Among them, the training set is used for ANN training, and the testing set is used to evaluate the performance of ANN. From the 32 sets of data, 26 sets were randomly selected as the training set and 6 sets were selected as the testing set [15]. As show in Table 1, there is a huge difference in the orders of magnitude between inputs and outputs. In order to avoid the reduction in model prediction accuracy caused by this reason, it is necessary to normalize all data to [0, 1] according to Formulas (1) and (2), as follow:
x i = x i x min x max x min
y i = y i y min y max y min
where x i , y i are normalized input and output values, xi and yi are experimental input and output value before the normalization, xmin, xmax, ymin and ymax are their corresponding minimum and maximum values.

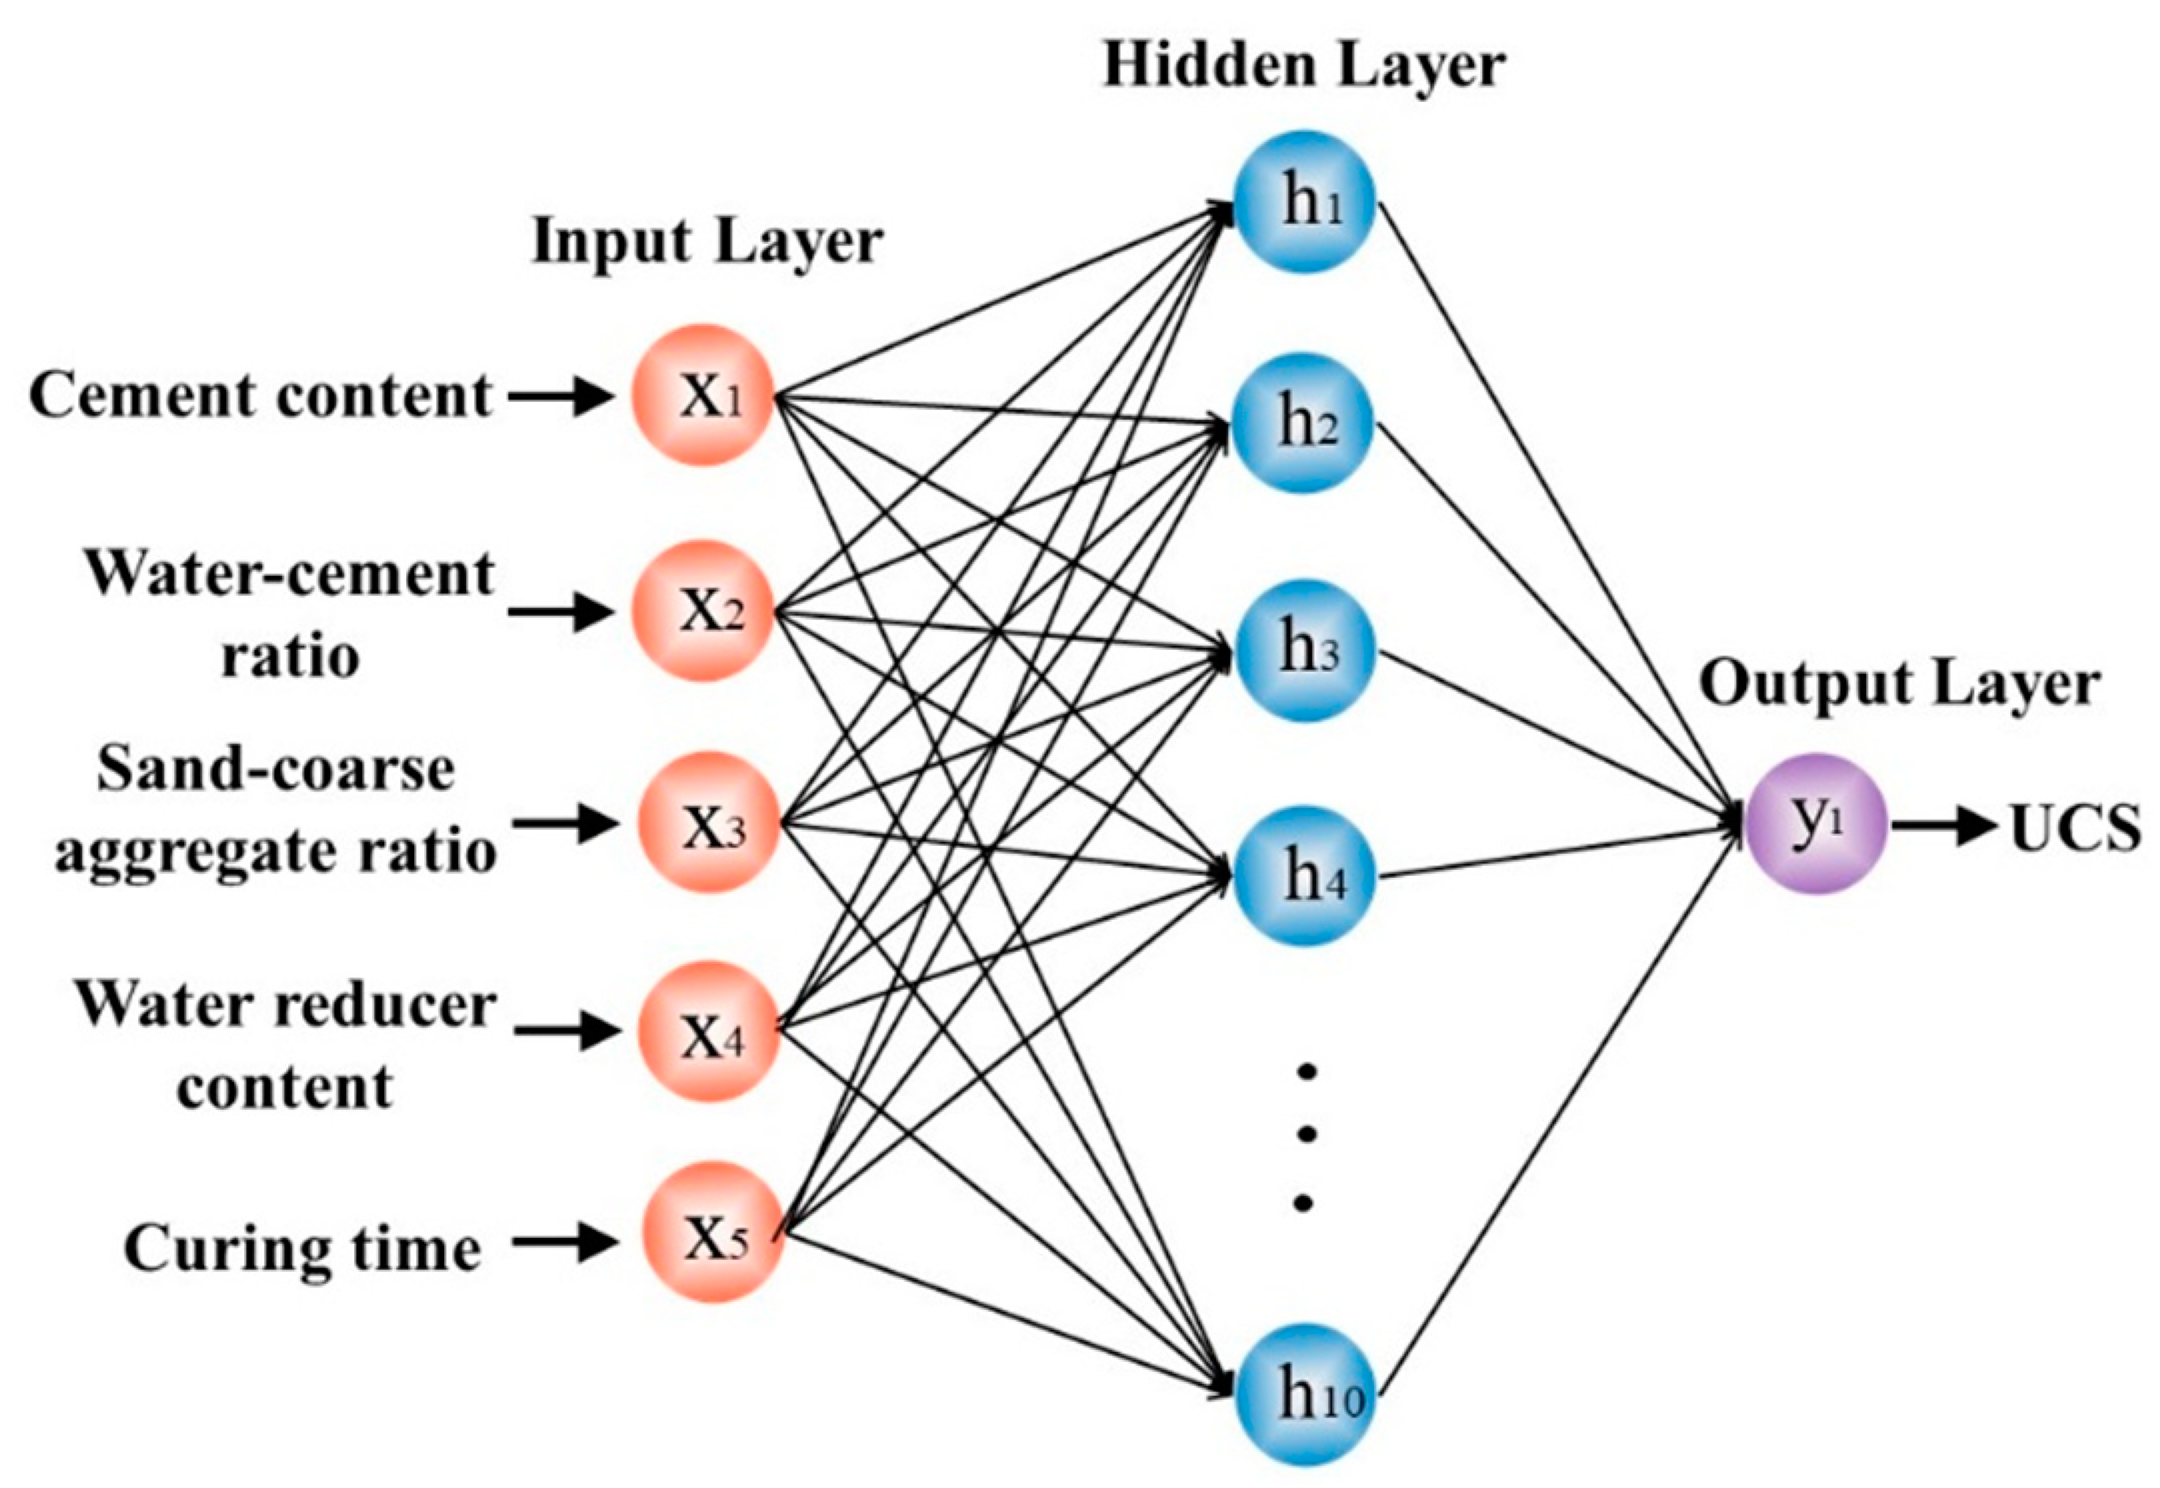
3.3. The Establishment of the ANN Model

An artificial neural network is an adaptive and nonlinear processing model composed of many interconnected neurons. Nowadays, the most widely used ANN type is back propagation (BP) artificial neural network, which includes the input layer, the hidden layer and the output layer [16]. Prior to application of prediction, the ANN model needs to be trained to learn the relationships between inputs and outputs. During the training process, the input signal is processed layer by layer from the input layer, through the hidden layer and finally transmitted to the output layer. If the error between the target output and the network output is too large at the output layer, error back propagation will be carried out. In this procedure, the connection weights and biases will be adjusted to reduce the error to a defined level, so that the network output is closer to the target output [17].
The excellent prediction performance of the ANN model can be carried out if its architecture parameter of the number of neurons in hidden layer (N) have been selected correctly. However, there are no scientific formulas to determine the optimal number of neurons in the hidden layer [18]. Therefore, a very intuitive trial-and-error method was used to determine the N value.
In this work, inputs of an ANN were the cement content, water–cement ratio, sand–coarse aggregate ratio, water reducer content and curing time, while the output was the UCS value. The ANN–PSO integrated model was developed based on MATLAB programming language. Based on trial tuning and experience, the range of N value was set to 5–12. The Levenberg–Marquardt algorithm was adopted as the training algorithm. The logsig function and the purelin function were adopted as transfer function at hidden layer and output layer, respectively. The 10-fold cross validation was used as the validation method. The learning rate was 0.2 and the momentum coefficient was 0.7 [19,20].
To assess the performance of the ANN model, the mean relative error MRE and the coefficient of determination R2 were adopted. The lower the MRE and the closer R2 is to 1, the better prediction performance of the ANN model. All formulas can be described as below:
MRE = 1 n i = 1 n | ( y i p i ) y i | × 100
R 2 = 1 i = 1 n ( y i p i ) 2 i = 1 n ( y i y ¯ i ) 2

3.4. Definition of the Objective Functions

The incompatibility of mix proportion of wet-mix shotcrete results in redundant or insufficient UCS of wet-mix shotcrete. Therefore, it is necessary to search the optimum mix proportion to make the UCS of wet-mix shotcrete that corresponding to the mix proportion greater than but as close as possible to the design values. Based on the comprehensive consideration of the mine’s precise support requirements for different roadways and the optimal optimization principle, the optimization objective function F is defined as follows:
F = | min ( f ANN C ) | s . t . f ANN C   MPa  
where fANN represents the well-trained ANN model, C represents the UCS of the wet-mix shotcrete required to support roadway and can be taken as 20, 25, 30 MPa, respectively.

3.5. The Optimization of Mix Proportion of Wet-Mix Shotcrete

Particle swarm optimization is an evolutionary computation technique to find the global optimal solution in multi-dimensional search space, which is inspired by the predatory behavior of birds [21]. The PSO is first initialized with a set of random particles which are assigned with random velocities and positions. The particle position represents the mix proportion of wet-mix shotcrete, and the velocity represents the amplitude when the particle position is updated in each iteration. The objective functions determined in the previous section were adopted as the fitness function of PSO.
The fitness values were calculated to evaluate the quality of the particles, and the best mix proportion will be represented by the particle with lowest fitness value. In each iteration, the velocity and position of the particle are updated according to their personal and neighbor information, so as to obtain the optimal solution. The detailed operation process of PSO is shown in Figure 4. The updated formulas of particle velocity and position are as follows:
V i d ( t + 1 ) = w ( t ) V i ( t ) + c 1 r 1 ( P i b e s t ( t ) X i b e s t ( t ) ) + c 2 r 2 ( G b e s t ( t ) X i b e s t ( t ) )
X i d ( t + 1 ) = X i d ( t ) + V i d ( t + 1 )
w ( t ) = w i n i w i n i w e n d t max t
where the r1 and r2 represents the random values in the range of [0, 1]; c1 and c2 are the acceleration constants; w(t) represents the inertia weight; wini is the initial inertia weight; wend is the ending inertia weight; tmax is the maximum number of iterations; t represents the current number of iterations; Pibest(t) represents the best personal position; Gbest(t) represents the best global position; Xid(t) represents the current position of particle; Vid(t) represents the current velocity of particle.
In this work, the particle individual coding method adopted real number coding. Refers to trial tuning and previously published research results, the PSO parameters were selected as shown in Table 2 [22,23].

4. Results

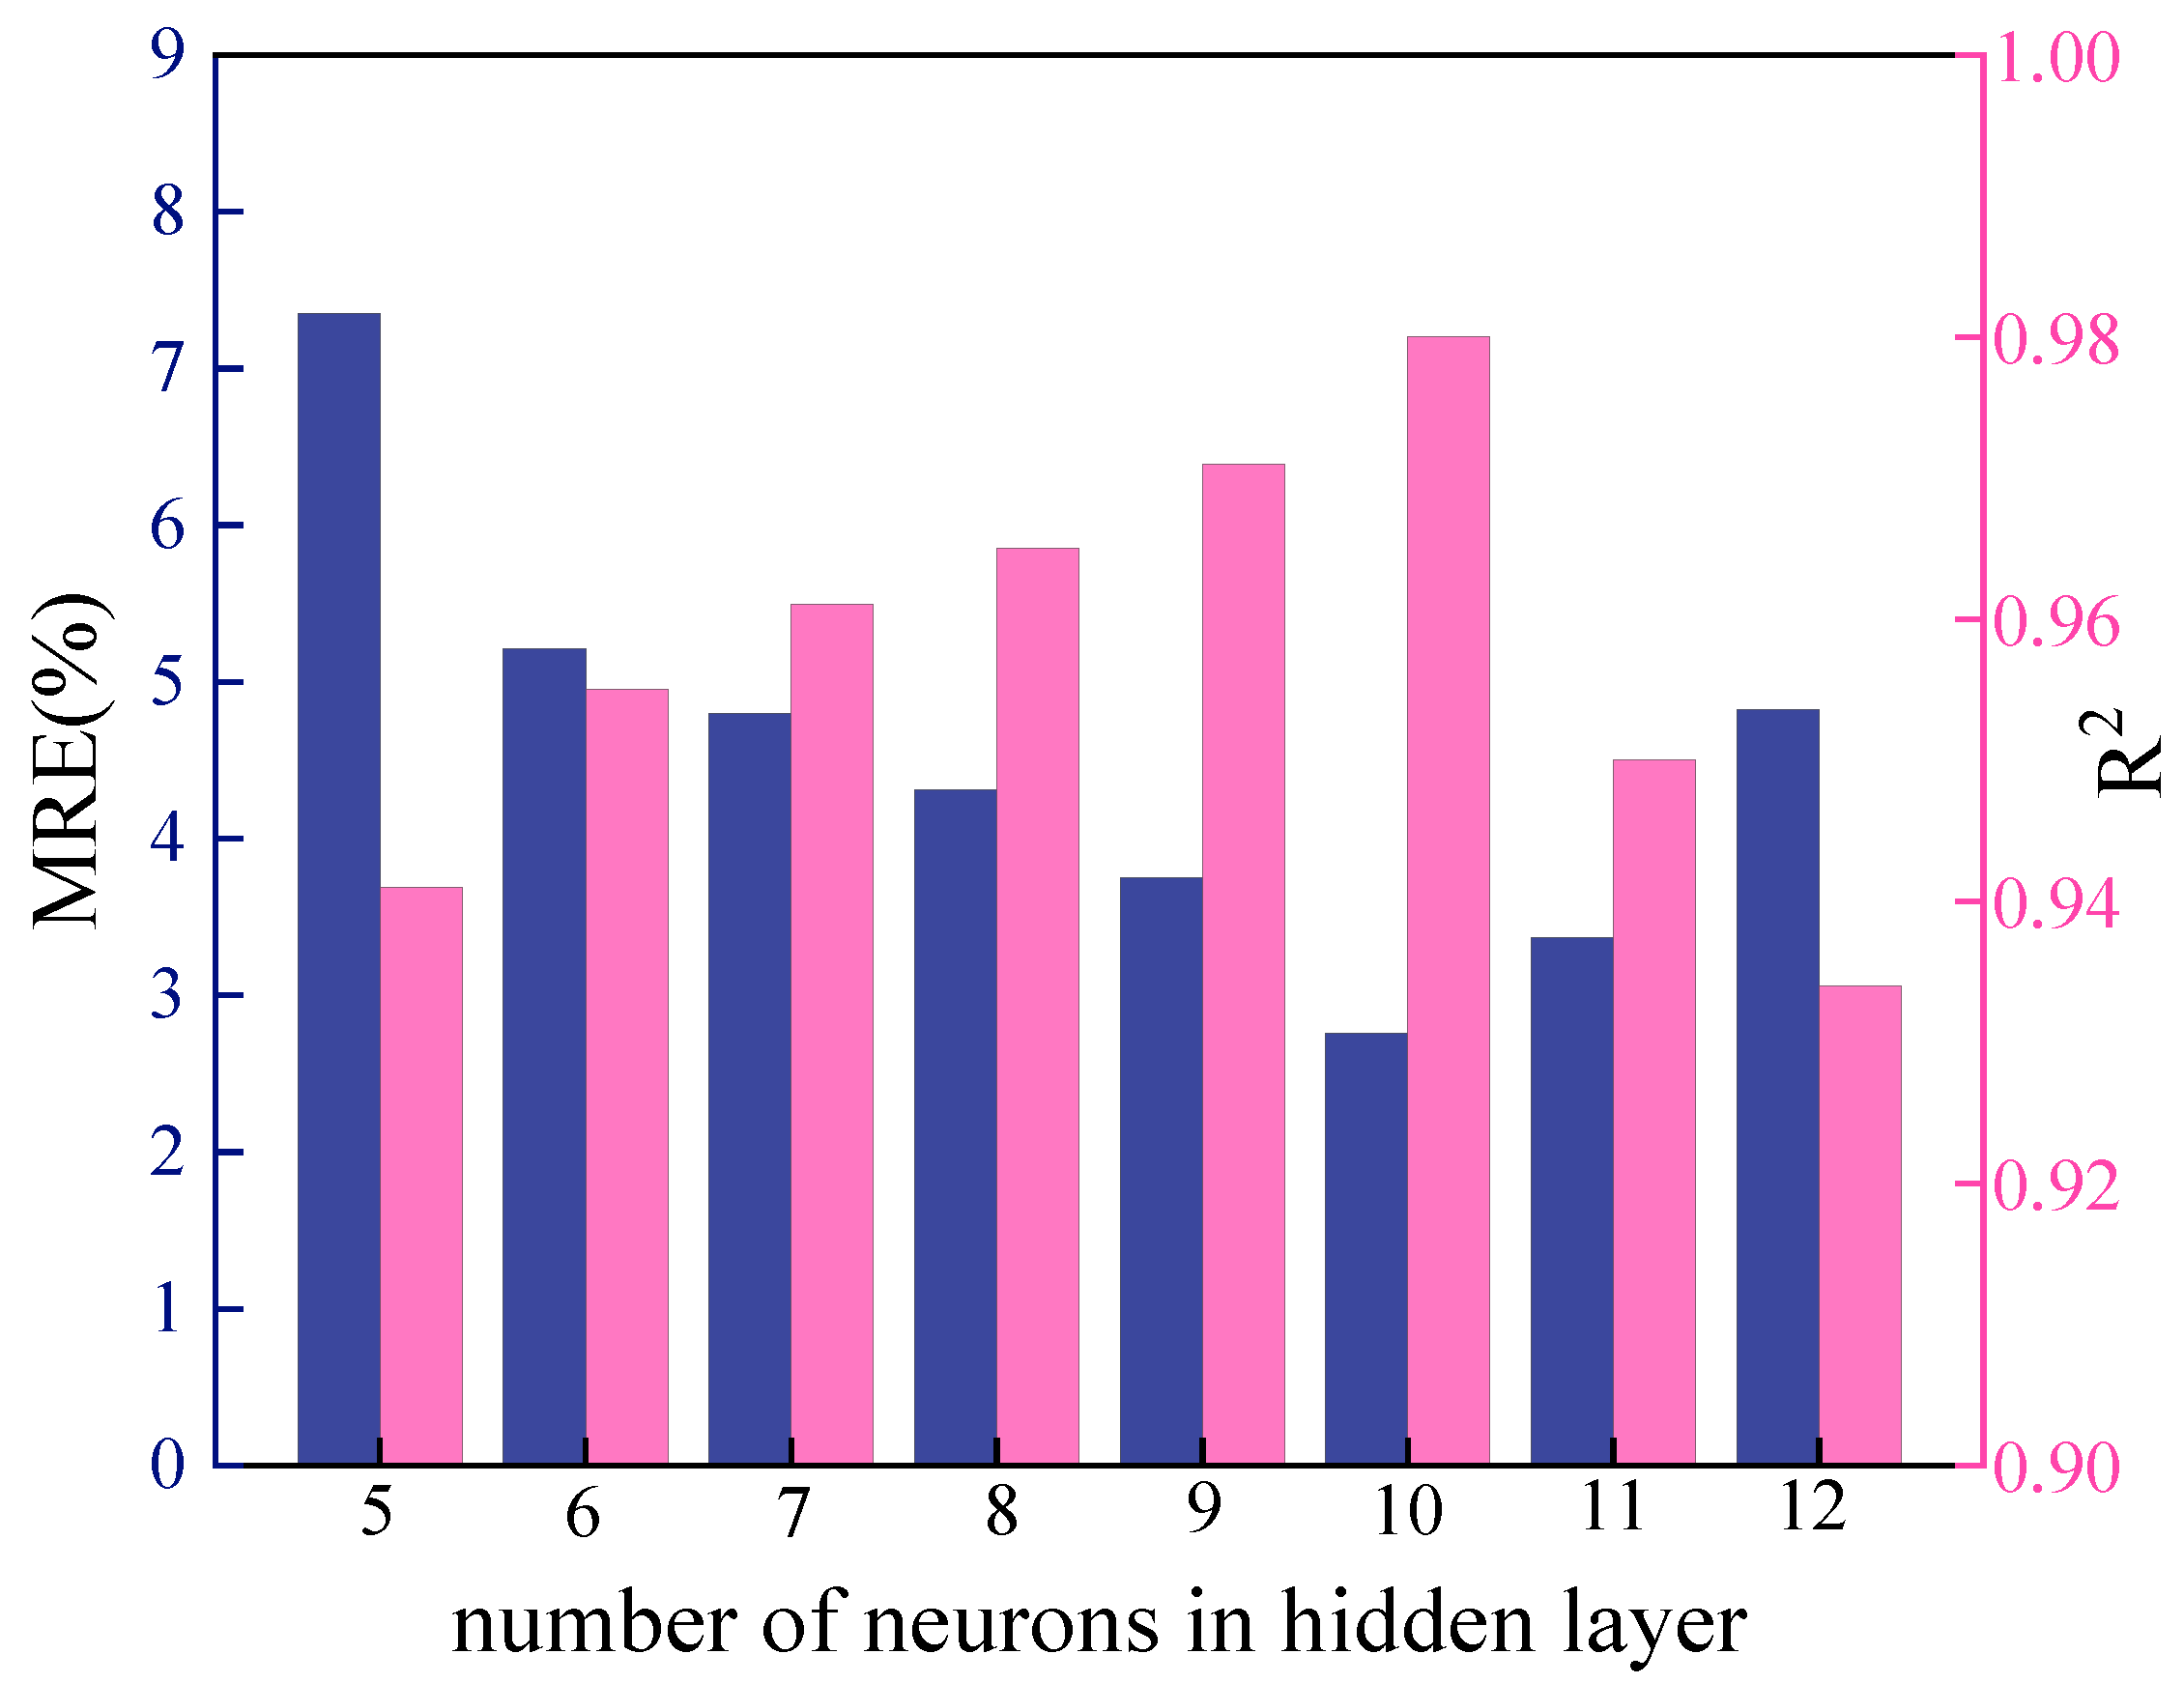
4.1. ANN Architecture Determination

In this paper, mean relative error MRE and the coefficient of determination R2 were used to evaluate the predictive effects of the model. When MRE is close to 0 and R2 is close to 1, the predictive effects of the model are better. Figure 5 shows that the MRE values on the testing set always show a gradual decrease when the N value is less than 10, while it was suddenly increasing when the N value is greater than 10. The same scenario can also be found in the relationship between R2 and N values. The R2 of the test set increases continuously when the value of N is less than 10, and decreases significantly when the N value is greater than 10. The above results indicated that too few neurons in hidden layer makes it impossible to establish an effective mapping between the inputs and output to express their nonlinear relationship, so it shows worse performance in UCS prediction. On the contrary, if there are too many neurons in the hidden layer, the complexity of the network will increase greatly, which leads to the occurrence of overfitting phenomenon and the prediction accuracy will be decreased dramatically. Therefore, when the N value was 10, the ANN model displayed the best performance in UCS prediction with the MRE and R2 value on the testing set corresponds to 2.755% and 0.980, respectively. After comprehensive consideration of the above results, the N value of 10 was selected. As the number of neurons in the input layer, hidden layer and output layer were chosen to be 5, 10 and 1, respectively, and formed the ANN architecture of 5–10–1. The optimal ANN architecture used for further research is shown in Figure 6.

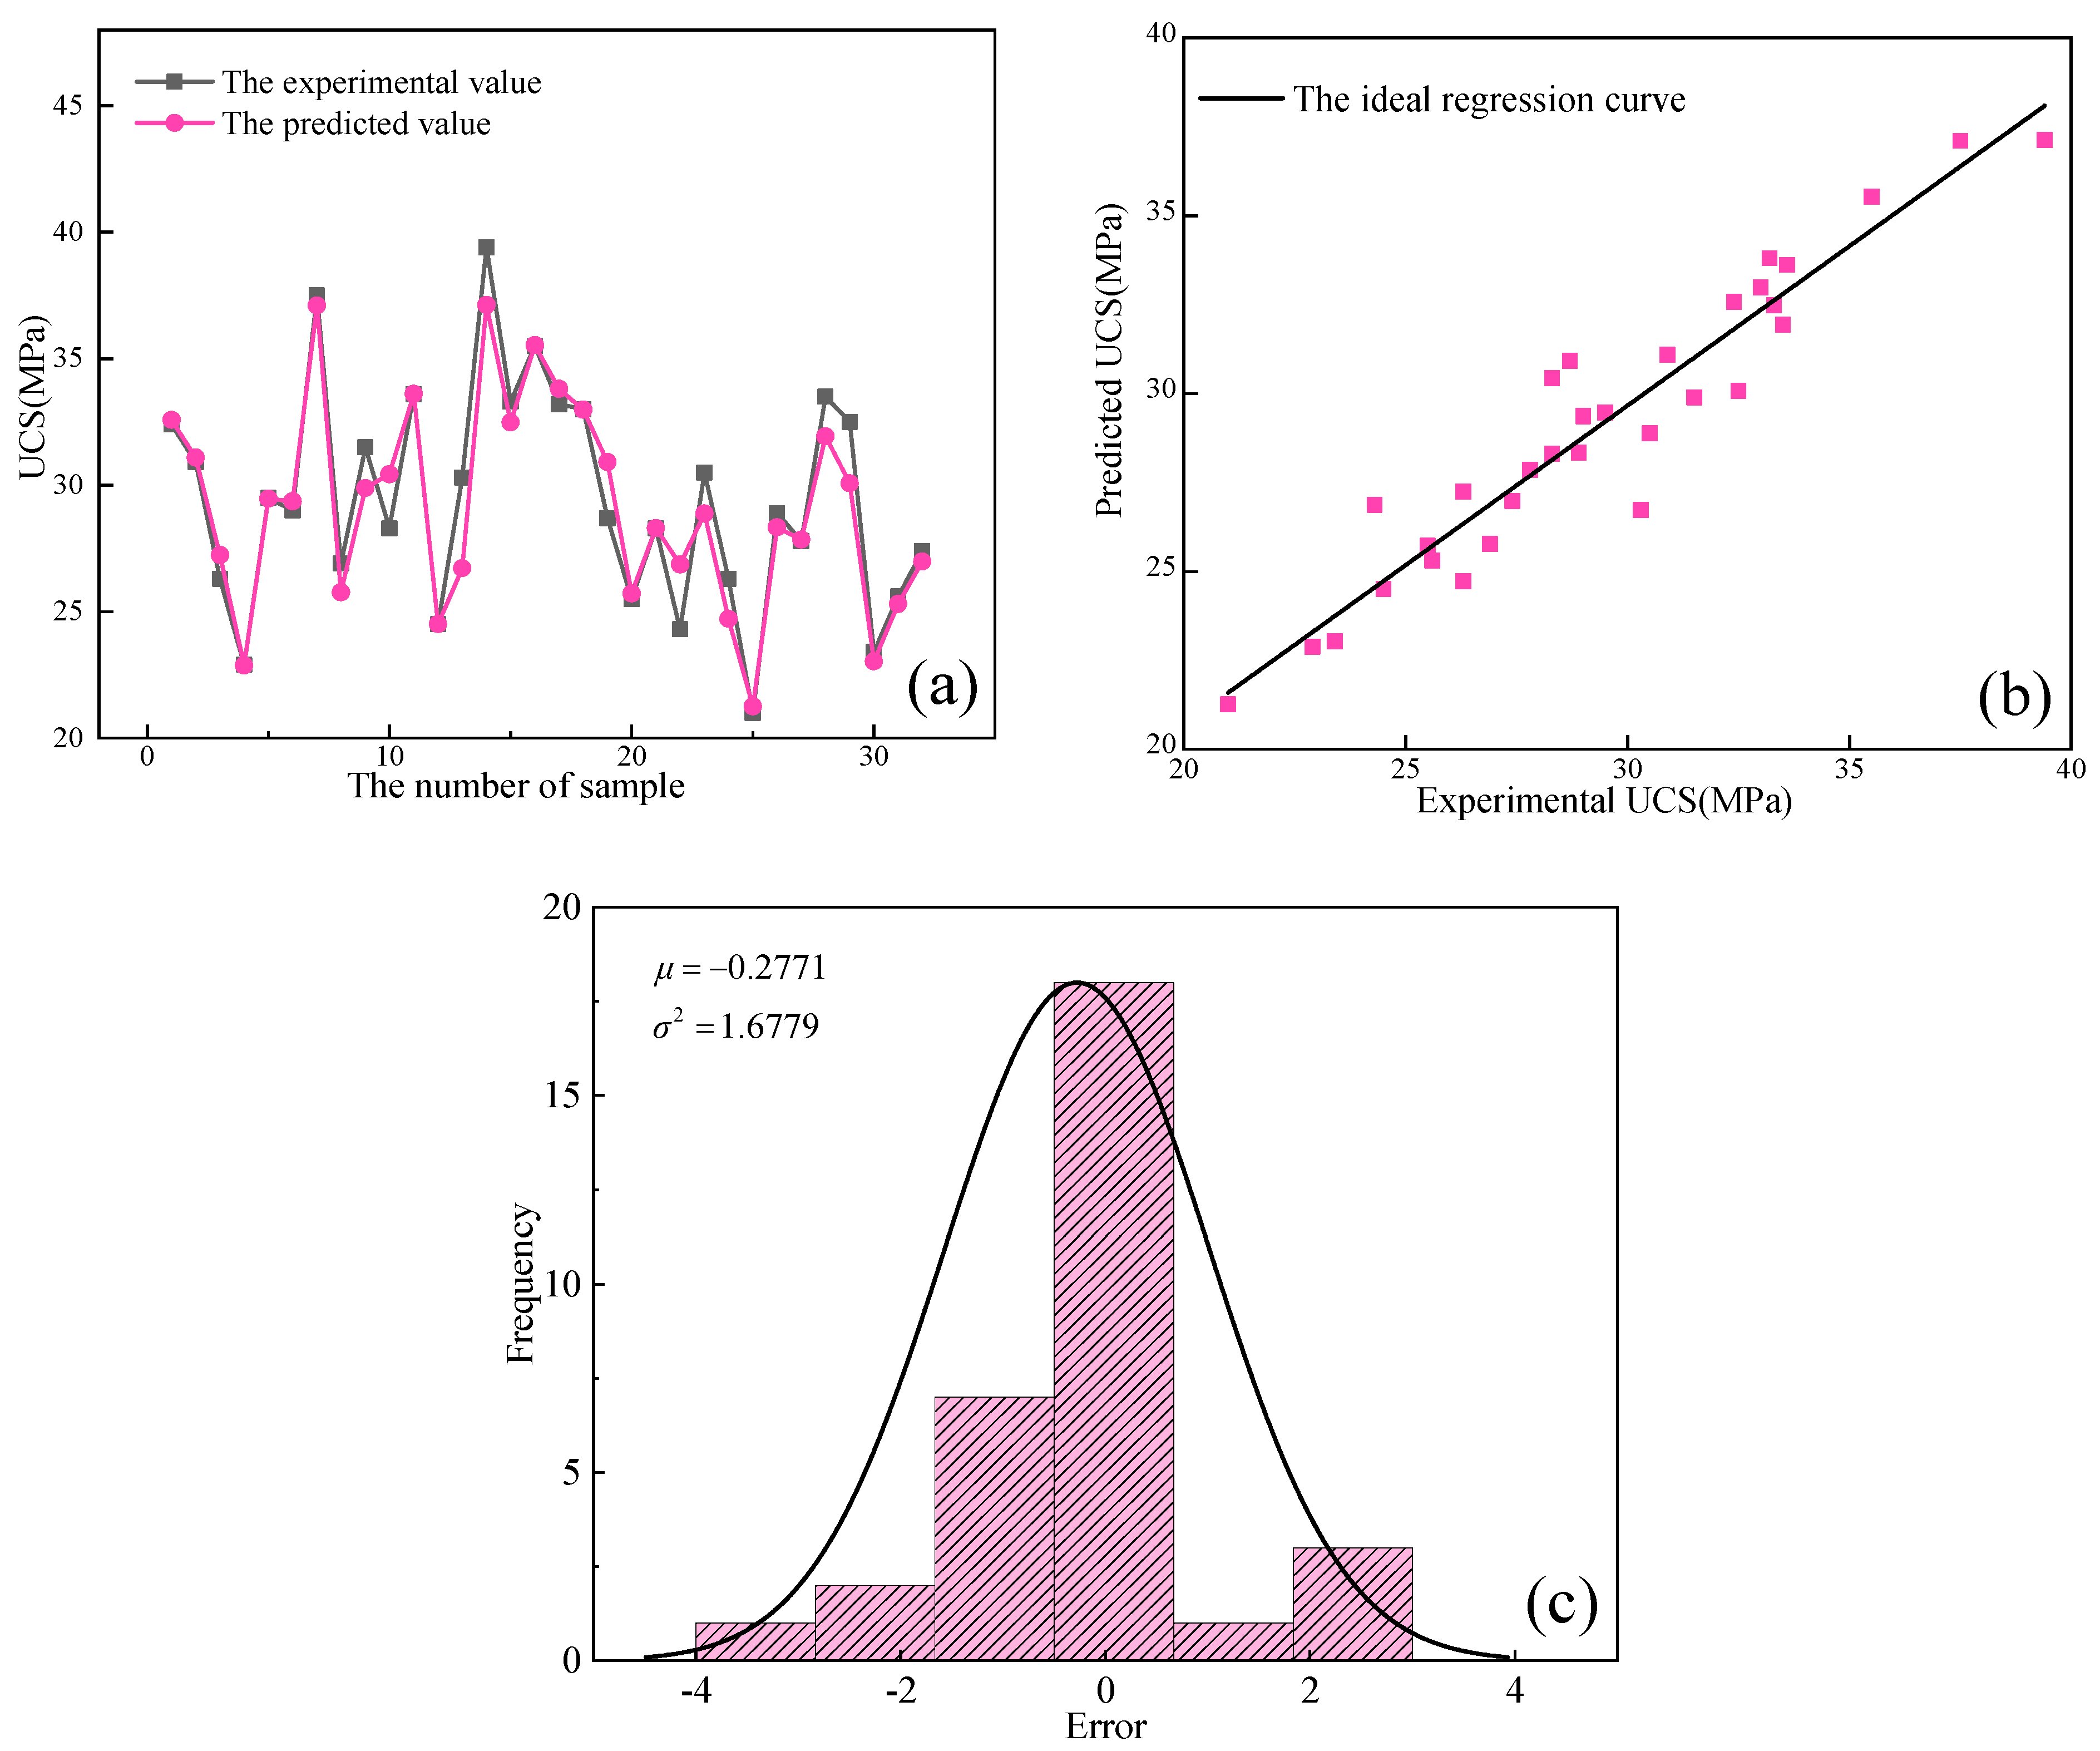
4.2. The Evaluation of the Performance of the Optimal ANN Model

Figure 7 shows the predicting results and error of the ANN model with optimal structure of 5–10–1. As shown in Figure 7a, there is an exceptionally good agreement between the predicted and experimental UCS values, with the exception of few points where the error is large. The maximum error is 3.5 MPa and the minimum error is only 0.001 MPa. Figure 7b reveals that the regression results between the experimental and predicted UCS values are better, with the data points more evenly distributed on both sides of the ideal regression curve. The bell-shaped curve in Figure 7c intuitively shows that the random error between the experimental and predicted UCS approximately obey a normal distribution, with the error mainly concentrated around 0. This shows that the model not only has excellent predictive power, but is also very robust.
Although some achievements were obtained in this research, some limitations have also been identified. The omission of other influencing variables of the UCS of wet-mix shotcrete, such as aggregate type and size distribution, curing temperature and physio-chemical characteristics of the binder, is a clear limitation of the current research. Therefore, more influential variables should be used as the ANN inputs to improve the generalization capability in the future investigation.
The above results indicate that the optimal ANN model is well trained and can learn the complex nonlinear relationship successfully between the inputs and outputs. Consequently, this ANN model is reliable for constructing the objective function of PSO optimization.

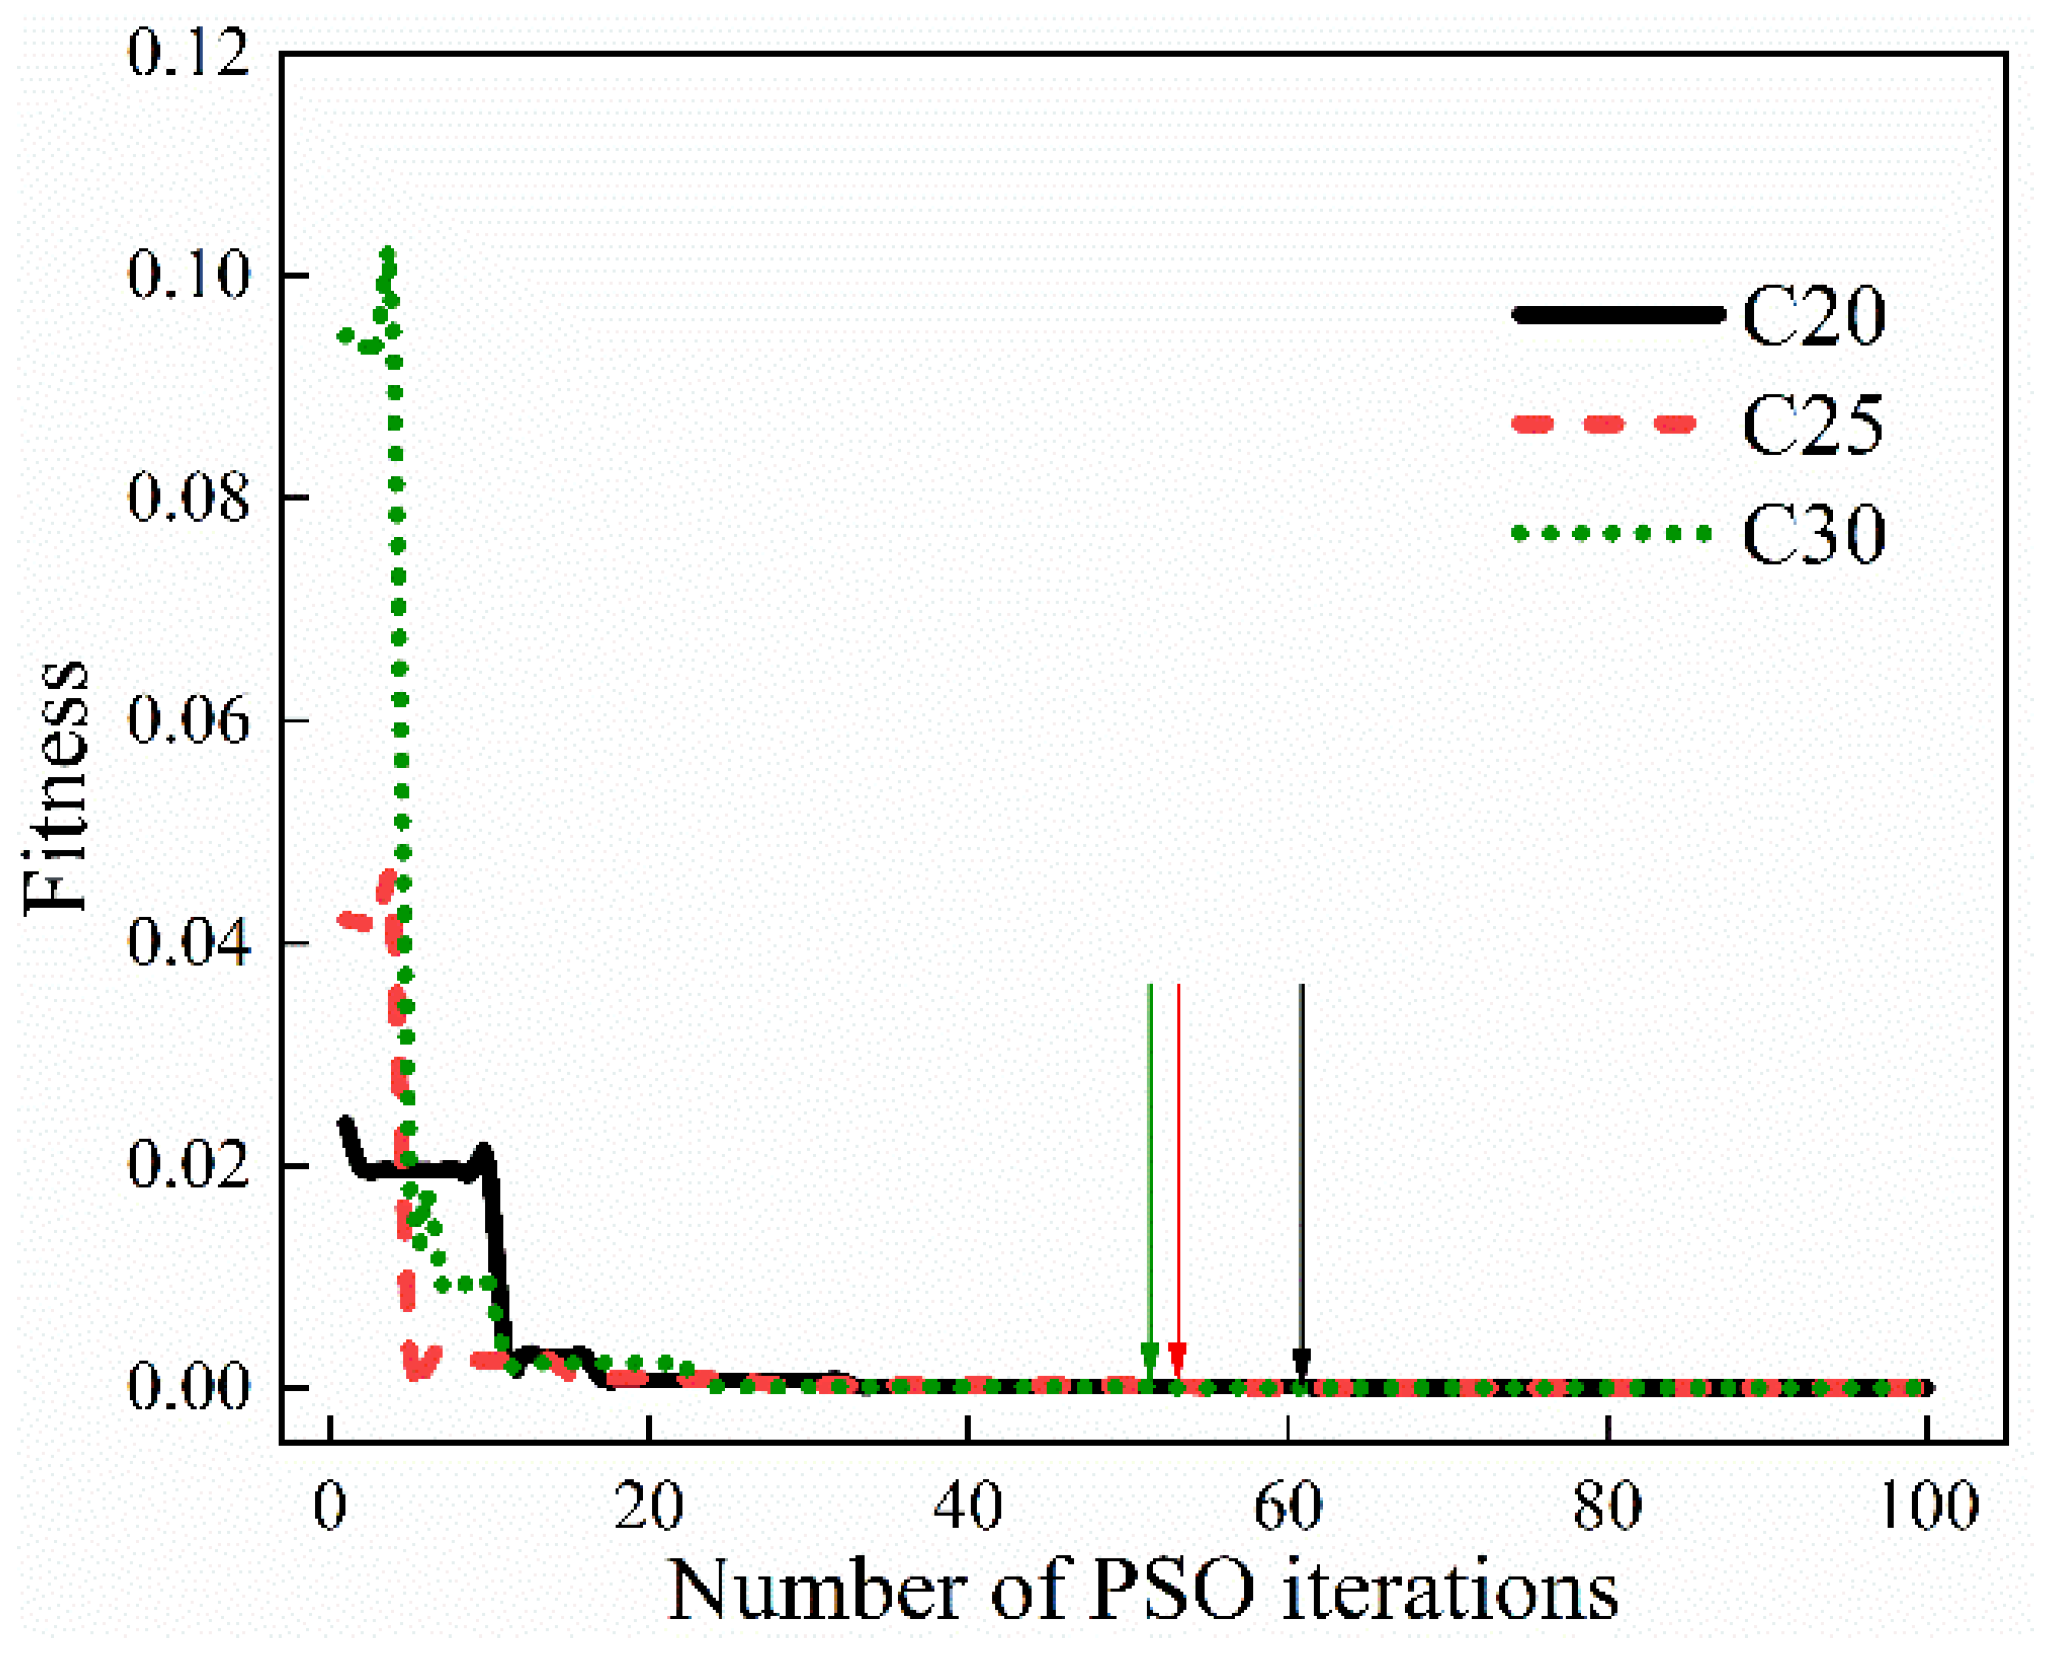
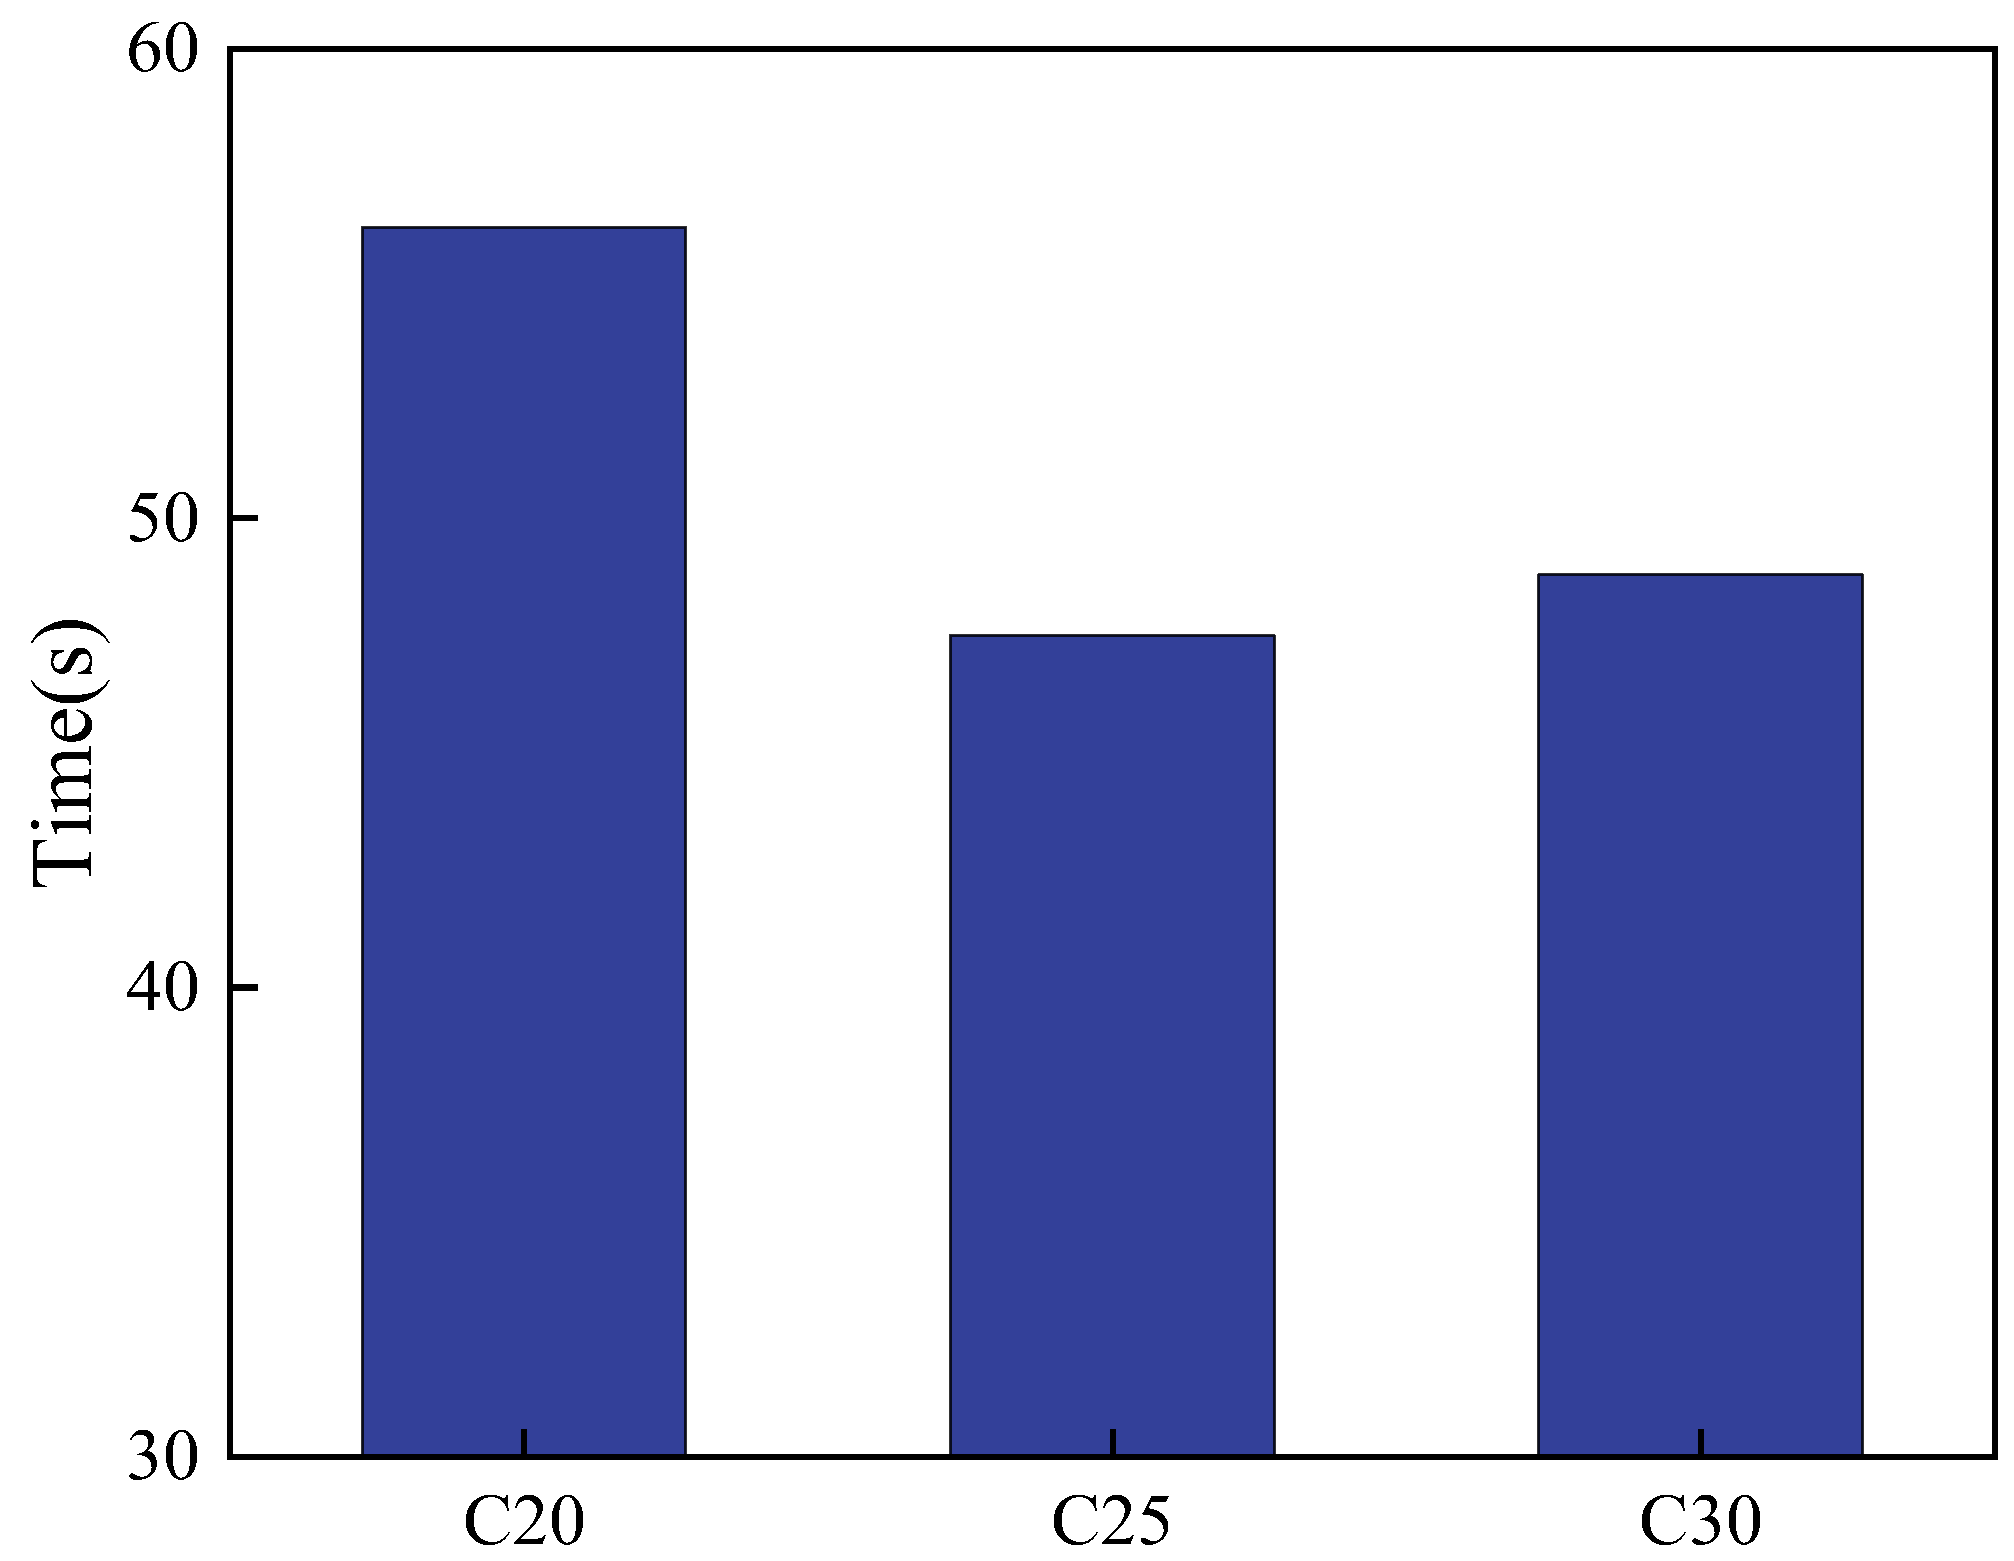
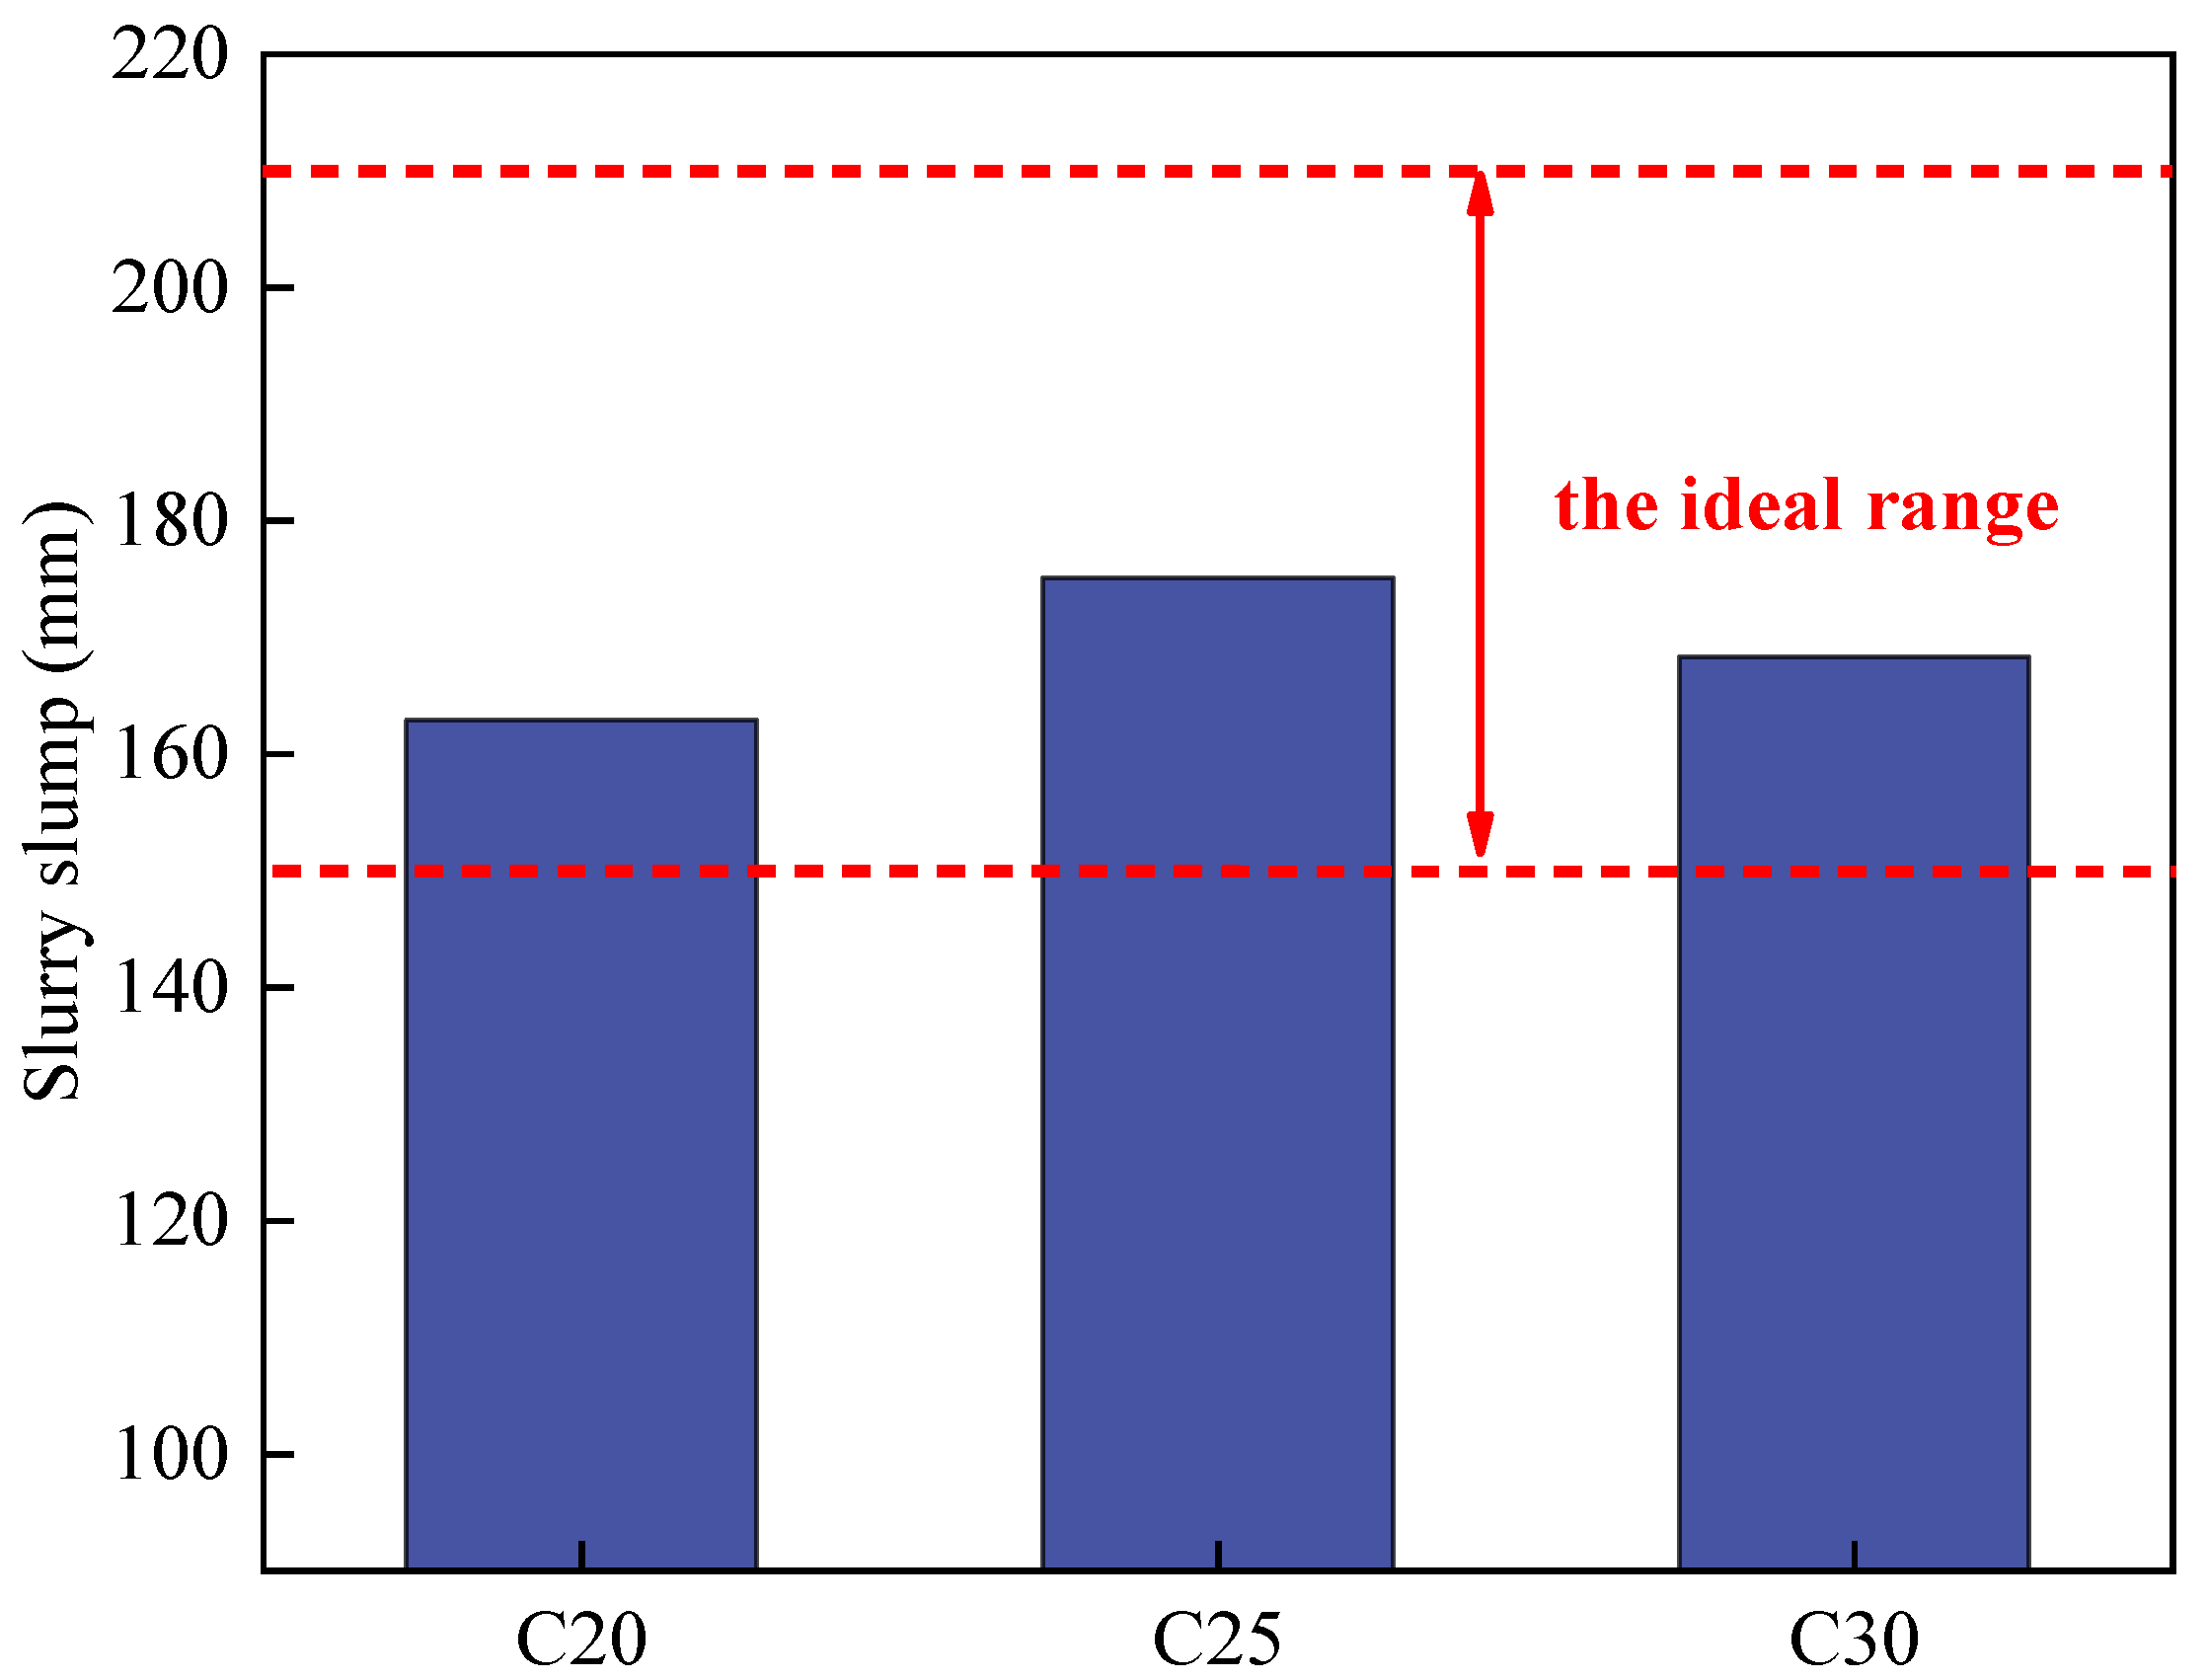
4.3. Results of Mix Proportion Optimization by PSO

Figure 8 shows the PSO optimization process of mix proportions of different wet-mix shotcrete. It can be seen that all the fitness curves converge within 61 iterations, indicating that PSO is efficient in finding the optimal mix proportions of wet-mix shotcrete. The consumed time for PSO optimization is shown in Figure 9. According to Figure 9, it took PSO less than 60 s to obtain the optimal mix proportion of wet-mix shotcrete corresponding to one type of concrete mark required by the mine. Compared with the traditional experimental optimization methods, the intelligent optimization method saves a lot of time and greatly improves the efficiency of mix proportion optimization.
After the PSO optimization process, the optimal mix proportions of wet-mix shotcrete corresponding to three different types of concrete mark are tabulated in Table 3. Considering the convenience of field construction, the parameters of mixing proportions should be rounded. To verify whether the above optimal mix proportions of wet-mix shotcrete are reasonable, the physical experiments of 28-day UCS tests were carried out. The comparisons between experimental values and predicted values are shown in Figure 10. As shown, the maximum error is 0.6 MPa and the minimum error is 0.1 MPa, which indicates that the PSO optimization model is ideal, and the strength redundancy was properly avoided.
On the other hand, it is necessary to test the fluidity of wet-mix shotcrete corresponding to above optimal mix proportions, so as to avoid the fact that—although it meets the requirements of mechanical properties—the fluidity is very poor, resulting in pipe blockage. Therefore, the slump test experiments of wet-mix shotcrete were carried out and the results are shown in Figure 11. The results show that the wet shotcrete slurry with corresponding optimum mix proportions has excellent flow performance and meets all mine flow standards (slurry slump is within 150–210 mm). The performance of UCS and slump values show that the optimal mix proportions of wet-mix shotcrete are satisfactory.
Moreover, good performance had been obtained by using those optimal mix proportions of wet-mix shotcrete in the field engineering application experiments. Figure 12 shows the underground engineering experiments in the Jinchuan mine.

5. Conclusions

In this paper, a new intelligent model for obtaining the mix proportion of wet-mix shotcrete was proposed. The methods of artificial neural networks (ANN) and particle swarm optimization (PSO) were combined in this intelligent model. ANN was adopted to establish objective function of PSO, and PSO was used to search the optimal mix proportion. The results confirmed that the MRE was 2.755% and R2 was 0.980, revealing that the optimal ANN model gave a very accurate prediction UCS of wet-mix shotcrete and can establish reasonable objective function for PSO optimization. It took the ANN–PSO model less than 60 s to obtain the optimal mix proportion of wet-mix shotcrete corresponding to one type of concrete mark required by Jinchuan mine. The presented ANN–PSO model can not only greatly reduce the workload of physical experiment and shorten the experiment period during the optimization of mix proportions, but also makes the optimization work of mix proportions that previously relied on experiments become more intelligent and precise. The method proposed in this paper can provide reference for further research on wet-mix shotcrete with mix proportion optimization.
In the future, more influential variables should be used as the ANN inputs to improve the generalization capability. Moreover, integrated modelling (i.e., UCS together with fluidity) is needed for multi-objective optimization of the mix proportion of wet-mix shotcrete.

Author Contributions

Conceptualization, B.H. and K.J.; methodology, B.H., K.J. and B.P.M.S.; software, K.J. and B.P.M.S.; validation, P.Z.; investigation, B.H., K.J. and J.Q.; writing—original draft preparation, B.H., K.J. and B.P.M.S.; writing—review and editing, B.H. and J.Q.; supervision, B.H.; All authors have read and agreed to the published version of the manuscript.

Funding

The financial support provided by the National Key R&D Program of China (Project No. 2018YFC1900603) was greatly appreciated.

Institutional Review Board Statement

Not applicable.

Informed Consent Statement

Not applicable.

Data Availability Statement

All data generated or analyzed during this study are included in this published article.

Conflicts of Interest

The authors declare no conflict of interest.

References

  1. Sun, Z.; Chen, L.; Yu, X. Study on optimization of shotcrete loading technology and the diffusion law of intermittent dust generation. J. Clean. Prod. 2021, 312, 127765. [Google Scholar] [CrossRef]
  2. Steindl, F.R.; Galan, I.; Baldermann, A. Sulfate durability and leaching behaviour of dry- and wet-mix shotcrete mixes. Cem. Concr. Res. 2020, 137, 106180. [Google Scholar] [CrossRef]
  3. Xu, M.F.; Gao, Y.T.; Jin, A.B. Prediction of cemented backfill strength by ultrasonic pulse velocity and BP neural network. Chin. J. Eng. 2016, 38, 1059–1068. [Google Scholar]
  4. Ge, Z.; Gao, Z.; Sun, R. Mix design of concrete with recycled clay-brick-powder using the orthogonal design method. Constr. Build. Mater. 2012, 31, 289–293. [Google Scholar] [CrossRef]
  5. Liu, G.M.; Chen, W.M.; Chen, L.J. Investigating and optimizing the mix proportion of pumping wet-mix shotcrete with polypropylene fiber. Constr. Build. Mater. 2017, 150, 14–23. [Google Scholar] [CrossRef]
  6. Sinan, H.; Bayrak, O. Optimization of early flexural strength of pavement concrete with silica fume and fly ash by the Taguchi method. Civ. Eng. Environ. Syst. 2004, 21, 79–90. [Google Scholar]
  7. Tang, H.S.; Li, F.; Wang, Y. Particle swarm optimization algorithm for shape optimization of truss structures. J. Harbin Inst. Technol. 2009, 12, 94–99. [Google Scholar]
  8. Zhao, R.; Zhang, H.G.; Song, S.S. Global optimization of the diesel engine–organic Rankine cycle (ORC) combined system based on particle swarm optimizer (PSO). Energy Convers. Manag. 2018, 174, 248–259. [Google Scholar] [CrossRef]
  9. Zhang, J.F.; Huang, Y.M.; Wang, Y.H. Multi-objective optimization of concrete mixture proportions using machine learning and metaheuristic algorithms. Constr. Build. Mater. 2020, 253, 119208. [Google Scholar] [CrossRef]
  10. Liu, Y.N. Application of Multivariate Nonlinear Mathematical Analysis in Prediction of Concrete Strength. Fly Ash Compr. Util. 2019, 2, 25–27. [Google Scholar]
  11. Ehsan, M.; Danial, J.A.; Mohsen, H. Prediction of uniaxial compressive strength of rock samples using hybrid particle swarm optimization-based artificial neural net-works. Measurement 2015, 60, 50–63. [Google Scholar]
  12. Deng, L.; Feng, B.; Zhang, Y. An optimization method for multi-objective and multi-factor designing of a ceramic slurry: Combining orthogonal experimental design with artificial neural networks. Ceram. Int. 2018, 44, 15918–15923. [Google Scholar] [CrossRef]
  13. Standard, C. Standard for Test Method of Mechanical Properties on Ordinary Concrete; China Architecture & Building Press: Beijing, China, 2002. [Google Scholar]
  14. Wang, Y.; Cao, Y.S.; Cui, L. Effect of external sulfate attack on the mechanical behavior of cemented paste backfill. Constr. Build. Mater. 2020, 263, 120968. [Google Scholar] [CrossRef]
  15. Qi, C.C.; Tang, X.L.; Dong, X.J. Towards Intelligent Mining for Backfill: A genetic programming-based method for strength forecasting of cemented paste backfill. Miner. Eng. 2019, 133, 69–79. [Google Scholar] [CrossRef]
  16. Shen, J.R.; Xu, Q.J. Prediction of interlayer shear strength parameters for RCC dams using artificial neural network and fuzzy logic system. J. Tsinghua Univ. (Sci. Technol.) 2019, 159, 345–353. [Google Scholar]
  17. Zhang, Q.L.; Liu, W.J.; Wang, X.M. Optimal prediction model of backfill paste rheological parameters. J. Cent. South Univ. (Sci. Technol.) 2018, 49, 124–130. [Google Scholar]
  18. Zhou, K.P.; Wang, X.M.; Gao, F. Stope structural parameters optimization based on strength reduction and ANN-GA model. J. Cent. South Univ. (Sci. Technol.) 2013, 44, 2848–2854. [Google Scholar]
  19. Qi, C.C.; Andy, F.; Chen, Q.S. Neural network and particle swarm optimization for predicting the unconfined compressive strength of cemented paste backfill. Constr. Build. Mater. 2018, 159, 473–478. [Google Scholar] [CrossRef]
  20. Shi, F.; Wang, X.C.; Yu, L. MATLAB Neural Network Analysis of 30 Cases; Beijing University of Aeronautics and Astronautics Press: Beijing, China, 2009; pp. 13–19. [Google Scholar]
  21. Behnam, J.; Mohamad, R.; Farnaz, J. Using PSO-GA algorithm for training artificial neural network to forecast solar space heating system parameters. Appl. Therm. Eng. 2019, 147, 647–660. [Google Scholar]
  22. Benvidi, A.; Abbasi, S.; Gharaghani, S. Spectrophotometric determination of synthetic colorants using PSO-GA-ANN. Food Chem. 2017, 220, 377–384. [Google Scholar] [CrossRef]
  23. Xu, J.; Zhao, X.; Yu, Y. Parametric sensitivity analysis and modelling of mechanical properties of normal- and high-strength recycled aggregate concrete using grey theory, multiple nonlinear regression and artificial neural networks. Constr. Build. Mater. 2019, 211, 479–491. [Google Scholar] [CrossRef]
Figure 1. Failure of the dry-mix shotcrete layer.
Applsci 12 01698 g001
Figure 2. Flowchart of the model.
Applsci 12 01698 g002
Figure 3. Gradation curves for (a) fine aggregate and (b) coarse aggregate.
Applsci 12 01698 g003
Figure 4. The flowchart of PSO algorithm.
Applsci 12 01698 g004
Figure 5. Relationship between number of neurons in hidden layer and MRE and R2.
Applsci 12 01698 g005
Figure 6. Optimal ANN architecture.
Applsci 12 01698 g006
Figure 7. The evaluation of predicted performance of ANN model: (a) comparison of experimental UCS and predicted UCS; (b) regression between experimental UCS and predicted UCS; (c) error distribution.
Applsci 12 01698 g007
Figure 8. The fitness curves during the PSO iteration.
Applsci 12 01698 g008
Figure 9. The consumed time of PSO optimization.
Applsci 12 01698 g009
Figure 10. Comparison of experimental UCS and predicted UCS.
Applsci 12 01698 g010
Figure 11. The slurry slump of wet-mix shotcrete.
Applsci 12 01698 g011
Figure 12. Field test of optimized mix proportion.
Applsci 12 01698 g012
Table 1. Experimental designs and UCS tests results.
No.Cement Content (kg·m−3)Water–Cement RatioWater Reducer Content (%)Sand–Coarse
Aggregate Ratio
UCS (MPa)
7 d28 d
14200.420.656:424.328.3
24200.450.807:326.328.9
34200.480.958:222.925.5
44200.511.109:121.023.4
54400.420.809:130.333.3
64400.450.956:426.330.9
74400.481.107:326.930.5
84400.510.658:224.527.8
94600.420.958:232.535.5
104600.451.109:125.628.7
114600.480.656:429.033.0
124600.510.807:327.431.5
134800.421.107:333.539.4
144800.450.658:233.637.5
154800.480.809:128.333.2
164800.510.956:429.532.4
Table 2. The values of PSO parameters.
c1c2Initial Inertia WeightEnding Inertia WeightParticle VelocityParticle
Position
Particle SizeMaximum
Iteration
Maximum Iteration Error
1.81.80.90.4[−1, 1][−0.5, 0.5]5010010−4
Table 3. Optimal mix proportions of wet-mix shotcrete.
Types of Wet-Mix
Shotcrete
Optimal Mix ProportionsThe Rounded Optimal Mixing Proportions
Cement Content (kg·m−3)Water–
Cement Ratio
Sand–Coarse
Aggregate Ratio
Water Reducer Content (%)Cement Content (kg·m−3)Water–
Cement Ratio
Sand–Coarse Aggregate RatioWater Reducer Content (%)
C20316.2280.7007.3380.6003160.707.30.6
C25374.2340.4207.4630.6003740.427.50.6
C30418.5390.4205.5520.6004190.425.60.6
Publisher’s Note: MDPI stays neutral with regard to jurisdictional claims in published maps and institutional affiliations.

