Article

On the Modeling and Analysis of Brittle Failure in Existing R/C Structures Due to Seismic Loads

by
Stylianos I. Pardalopoulos
1,
Stavroula J. Pantazopoulou
2 and
George D. Manolis
1,*
1
Department of Civil Engineering, Faculty of Engineering, Aristotle University, GR 54124 Thessaloniki, Greece
2
Department of Civil Engineering, The Lassonde Faculty of Engineering, York University, Toronto, ON M3J 1P3, Canada
*
Author to whom correspondence should be addressed.
Appl. Sci. 2022, 12(3), 1602; https://doi.org/10.3390/app12031602
Submission received: 29 December 2021 / Revised: 30 January 2022 / Accepted: 31 January 2022 / Published: 2 February 2022
(This article belongs to the Special Issue Seismic Assessment and Design of Structures)

Abstract

:
Brittle failure is often observed in older reinforced concrete (R/C) buildings that have been designed prior to the 1980s following an earthquake event. Since this has ramifications on any subsequent repair protocol, it is important to quantify the remaining strength capacity for this class of building to determine a retrofit strategy. Following along these lines, an analytical-numerical methodology is presented for use as a third-tier seismic assessment which is based on a previously developed second-tier strength assessment criterion coming from a procedure known as Rapid Seismic Assessment (RSA). The assessment framework is performance-based, aiming to determine whether estimated local drift demands can be tolerated without failure developing along the load resistance path of substandard R/C buildings. This enables the development of guidelines for modeling all possible strength mechanisms that occur in the structural system of substandard R/C buildings. An application example using data provided by a benchmark experiment involving a full-scale R/C building helps to illustrate and then validate the proposed modeling procedures and establish their accuracy and efficiency for use by practicing engineers.

1. Introduction

Existing reinforced concrete (R/C) buildings encompass a variety of structures, ranging from cases that were designed and constructed according to modern forms of detailing (see ASCE/SEI 41-17 [1], EN1998-1 [2]) to structures that were built before the early 1980s under design code frameworks (summarized in the FIB Bulletin 24 [3]) that are now often characterized as substandard. The seismic vulnerability of existing R/C buildings, particularly that of substandard construction, is continuously demonstrated when strong earthquakes strike urban areas (e.g., Loma Prieta 1989, Northridge 1994, Kobe 1995, Kocaeli 1999, Athens 1999, Bhuj 2001, Port-au-Prince 2010, Gorkha 2015, and Mexico City 2017). Field observations have repeatedly suggested that most of the buildings that collapsed did not show signs of flexural yielding (such as densely spaced flexural cracks normal to the member axis), nor the development of any kind of global ductility prior to collapse. Rather, it appears that most of the collapsed structures had formed a brittle mechanism upon failure, marked by severe damage localization in a few areas with high shear demand, such as the disintegration of exterior frame joints, shear failure of severely unconfined captive columns, and soft-story damage in sway-frames.
Given the need for identifying among the vast inventory of existing R/C buildings those cases that are potentially vulnerable to collapse, thus representing a serious hazard to human safety in the event of a moderate or a strong earthquake, extensive research has been conducted over the past three decades and different assessment procedures have been developed. Analytical assessment procedures, also known as third-tier evaluation procedures (ASCE/SEI 41-17 [1], EN1998-3 [4], Greek Code of Structural Interventions [5], FEMA-356 [6], Vamvatsikos and Cornell [7]) include the mathematical simulation of the examined building using advanced numerical tools such as 3D finite element (FE) models combined with elastic and/or inelastic analysis methods. This category of assessment procedures enables the simulation of complex mechanisms throughout the structural system of buildings and evaluation of demand and supply in R/C structures in terms of deformation (either drift or ductility ratios at milestone performance points). Since they originate from design procedures that were developed for modern R/C structures, most of the analytical assessment procedures simulate the response of R/C members using nonlinear moment-rotation envelope curves associated with zones of inelasticity-spread, demonstrating a strain hardening, post-yielding plateau. However, in poorly detailed R/C members, strength and deformation capacity seems to be controlled by localization of the prevailing mode of failure which depends on the rate of degradation of the alternative strength mechanisms with increasing ductility demand and load history [8,9,10,11,12,13,14,15,16,17,18,19,20,21,22,23,24,25,26,27]. In order for the analysis results to be realistic, member resistance skeleton curves must necessarily reflect the brittle modes of failure that typically prevail in poorly reinforced members, a feature that leads to an unstable solution and lack of convergence with most Newton-Raphson type schemes used to perform nonlinear structural analysis. This also affects the post-processing of the numerical analysis results [28,29].
A new methodology for modeling member response of substandard R/C buildings for seismic evaluation is presented here. This is motivated by the need for analytical modeling tools that can effectively capture the seismic behavior of substandard R/C structural elements. The proposed methodology can be used for a third-tier seismic evaluation procedure, using commercial software that is easily accessible to practitioners. Concepts from the strength assessment criterion in the Rapid Seismic Assessment (RSA) procedure are adopted here (Pardalopoulos and Pantazopoulou [30], Pardalopoulos et al. [31,32]). A core objective of the method is to determine whether or not the local drift demands can be tolerated without failure along the load resistance path of substandard R/C buildings. Building on the aforementioned concepts, we provide guidelines for modeling all possible strength mechanisms that may develop in the various components of the structural system of substandard R/C buildings. In order to validate the introduced modeling procedures and to establish their accuracy and efficiency, an application example is presented, illustrating in practical terms the steps needed for evaluating the seismic response of a substandard, full-scale R/C test building.

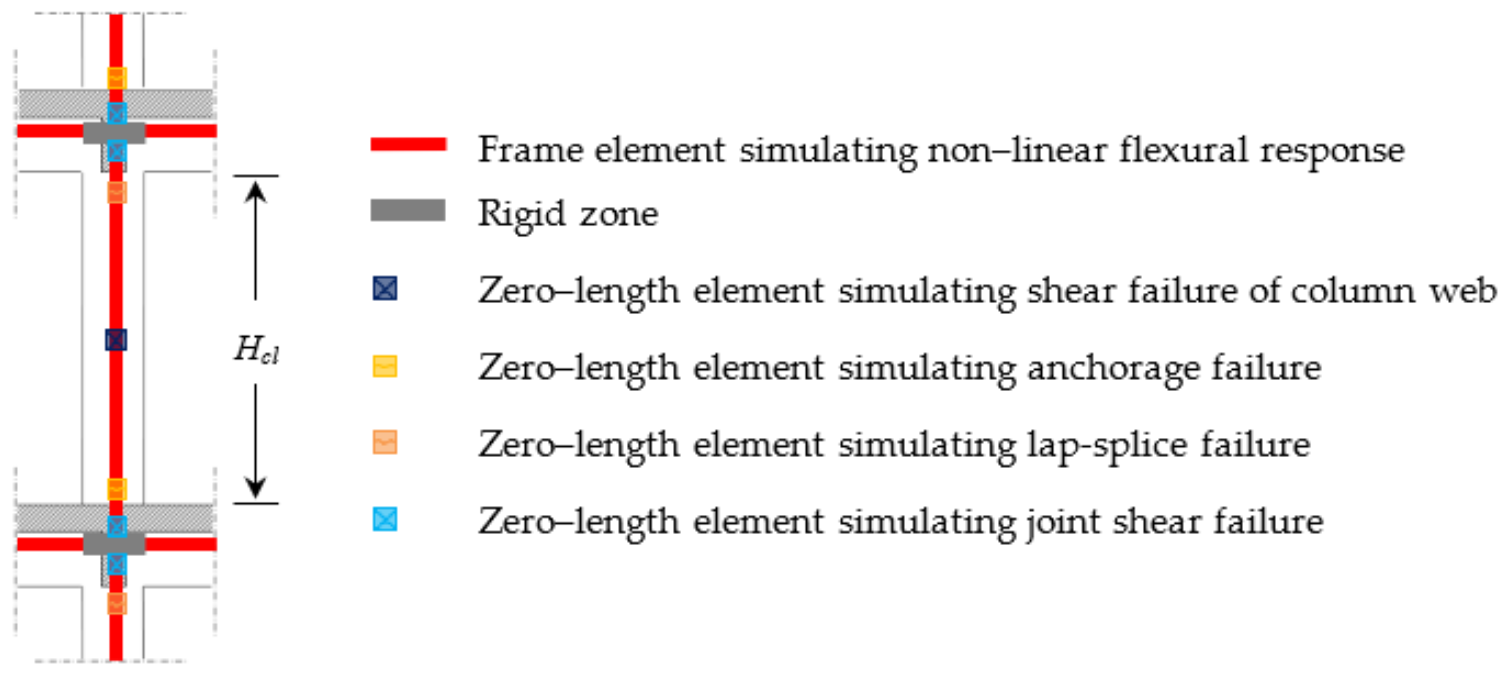
2. Procedures for Simulating Strength Mechanisms in Substandard R/C Buildings

Contrary to analysis procedures used in the design of new R/C buildings that focus on the numerical simulation of ductile resistance mechanisms in structural members (under the proviso that all undesirable brittle failure modes will be capacity-designed and therefore suppressed) in the analytical seismic assessment of poorly reinforced R/C buildings, the potential prevalence of brittle-type mechanisms of resistance across the structural system must be examined. The typical layout of the structural system of R/C buildings constructed up to the early 1980s (at a time when construction details were still relatively primitive since their role in the seismic response was not yet fully understood) included poorly reinforced frames comprising columns of section sizes ranging between 250 mm and 500 mm, beams of a 150 mm to 250 mm width and 600 mm to 700 mm height (including the slab thickness), and slabs with a thickness ranging between 120 mm and 160 mm. Longitudinal reinforcement usually comprised relative low amounts of StI (fy = 220 MPa, fu = 340 MPa) to StIII (fy = 420 MPa, fu = 500 MPa) smooth bars, lap-spliced to arbitrary lengths and under poor confinement conditions. Column and beam stirrups were usually 6 mm to 8 mm, smooth, rectangular, StI bars (usually mild steel), with 90° hooks in the ends, spaced at 200 mm to 300 mm on center (o.c.). Beam-column joints were usually left without stirrups for the convenience of construction. Concrete quality was usually Bn150 to Bn200 as per DIN 1045 [33], corresponding to C12/15 and C16/20 concrete grades according to EN1992-1-1 [34].
To address the need for an effective simulation of the seismic response of substandard R/C buildings, the present research introduces new procedures for modeling the mechanisms of resistance developing in old-type R/C structural elements. Based on the principles of the RSA System [30,31,32], emphasis is placed on numerical simulation procedures that are applicable to column lines of existing R/C buildings, non-conforming to modern standards of seismic design and detailing. These lines usually collapse in a brittle manner, forming a mechanism characterized by pronounced localization of damage in a few locations with a high shear demand before there is a chance for the development of any form of redistribution and ductility (see Lang and Marshall [35], Augenti and Parisi [36], Mehrabian and Haldar [37], Dogangun [38], Joeng and Elnashai [39], and Varum [40]).
The modeling procedures introduced here include the simulation of the following mechanisms: M1: non-linear flexural response of columns and beams; M2: shear failure of the column web; M3: anchorage failure of longitudinal reinforcement of columns; M4: attainment of the development capacity in column lap splices; and M5: beam-column joint shear failure. The proposed procedures for simulating the seismic response of substandard R/C buildings are summarized in Figure 1 and discussed in detail in the following sections. Note that simulation of mechanisms {M2–M5} along column lines of existing R/C building is meaningful only if they prevail over mechanism M1. According to the RSA system, this occurs when the corresponding resistance ratios (r) that represent the shear strength associated with the examined failure mode, normalized by the shearing force required in order to support flexural yielding in the column, are equal to or greater than 1.0.

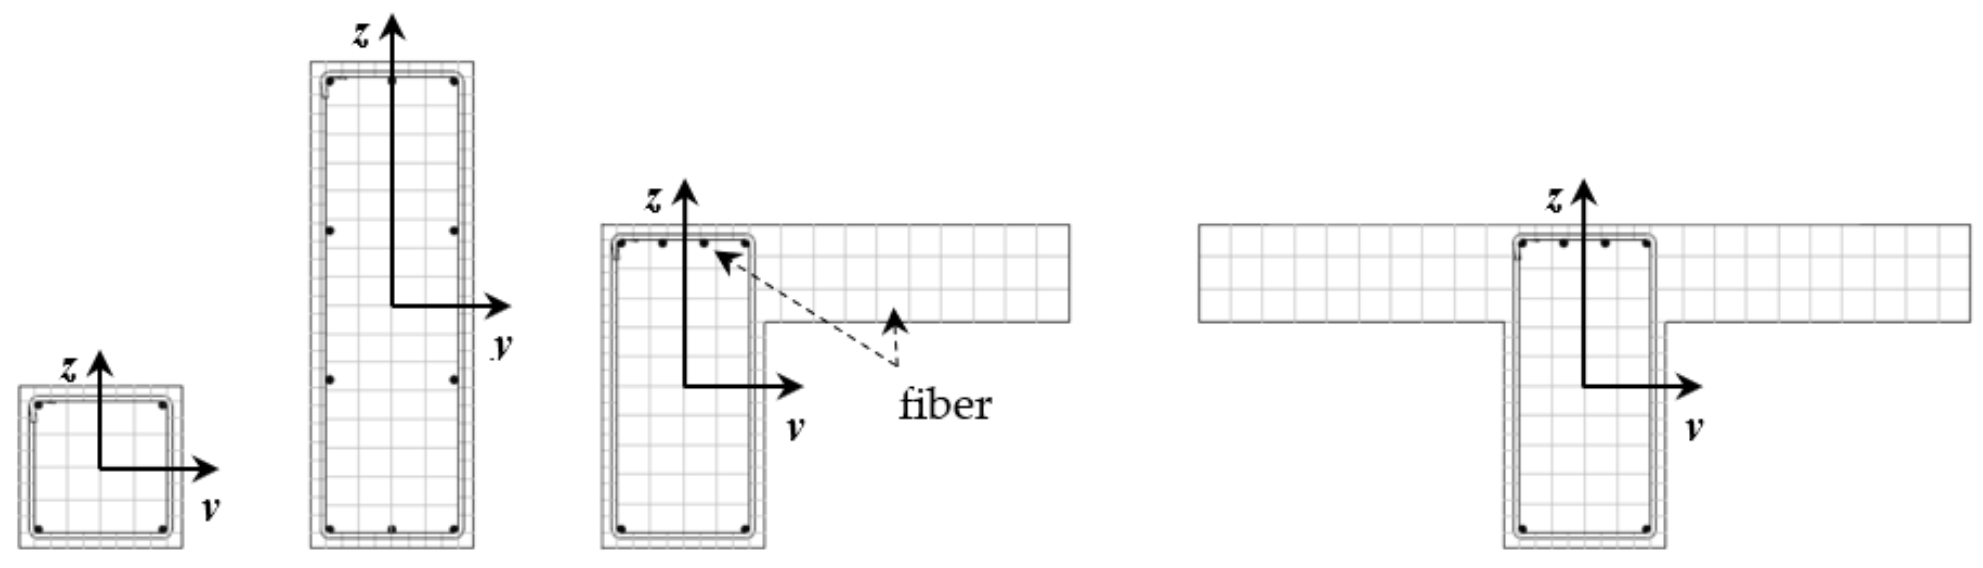
2.1. Simulation of InelasticFlexural Response in Columns and Beams

Flexural behavior of R/C structural elements is associated with ductile member response and materializes only if it can be supported by all other resistance mechanisms developing along the element length. The inelastic flexural response is linked with the formation of extensive cracking, perpendicular to the axis of bending of R/C elements, in regions where the longitudinal reinforcement yields in tension. In columns and beams subjected to earthquake loading, flexural cracking usually forms in both ends, in a length approximately equal to twice the elements’ width. By way of contrast, in R/C beams subjected to excessive gravity loading, the yielding of longitudinal reinforcement occurs at locations of maximum values for the developing bending moment.
Simulation of the inelastic flexural response of R/C elements may be performed using different, alternative approaches that are documented in the international literature. The most preferable approach in simulating inelastic flexural response in R/C elements subjected to biaxial bending is the use of linear elements encompassing fiber discretization of their cross-section [41]. According to this approach, the reinforcing bars plus the confined and the unconfined concrete of an R/C structural element are all modeled as separate fibers, possessing stress-strain relationships that characterize their response under uniaxial loading (see Figure 2). Based on the assumption that plane sections remain plane during member deformation, member stresses and deformations in both section directions are calculated through the integration of the response of the fibers over the element section. For R/C beams under seismic excitation that are primarily subjected to uniaxial bending, an alternative simulation approach is through the use of a lumped plasticity approach which combines a linear element with non-linear hinges at the locations where beams connect with other structural members (columns and/or beams). Inelastic response in each hinge is then defined by appropriate force-deformation relations, derived from sectional analysis of the corresponding element and classical mechanics.

2.2. Simulation of Shear Failure of the Column Web

Shear failure of an R/C element web develops when the transverse reinforcement cannot provide adequate supporting shear resistance to displacement reversals beyond flexural yielding. In a third-tier seismic evaluation of existing R/C buildings, simulation of shear failure of the column web is essential, as this mechanism is linked to brittle member failure that can compromise the load-carrying capacity of columns and potentially lead to the collapse of the building.
The best approach to simulate the brittle response of R/C columns to shear failure of the web is to use a non-linear, zero-length element (the two end element nodes are distinct from each other but placed at the same location) at mid-height of the column’s clear (deformable) length, Hcl (see Figure 1). Element response in each section direction is defined by the multilinear Moment–Rotation (Mθ) relationship illustrated in Figure 3, where Mv = Vv · (Hcl/2) is the bending moment associated with the shear strength Vv, of the column web in the examined direction. This Vv is calculated according to the RSA system from Equation (A4) in the Appendix A. Coefficient rv in Figure 3 is the resistance ratio to shear failure of the column web, rv = Vv/Vflex, where Vflex is calculated according to Equation (A3) in the Appendix A. Note that the column normalized axial load appearing in the expressions given in the Appendix A (denoted as νd) is obtained from static analysis of the examined R/C building to gravity loading and for the vertical component of the seismic load combination Gk + ψE · Qk, as perEN1998-1 [2].

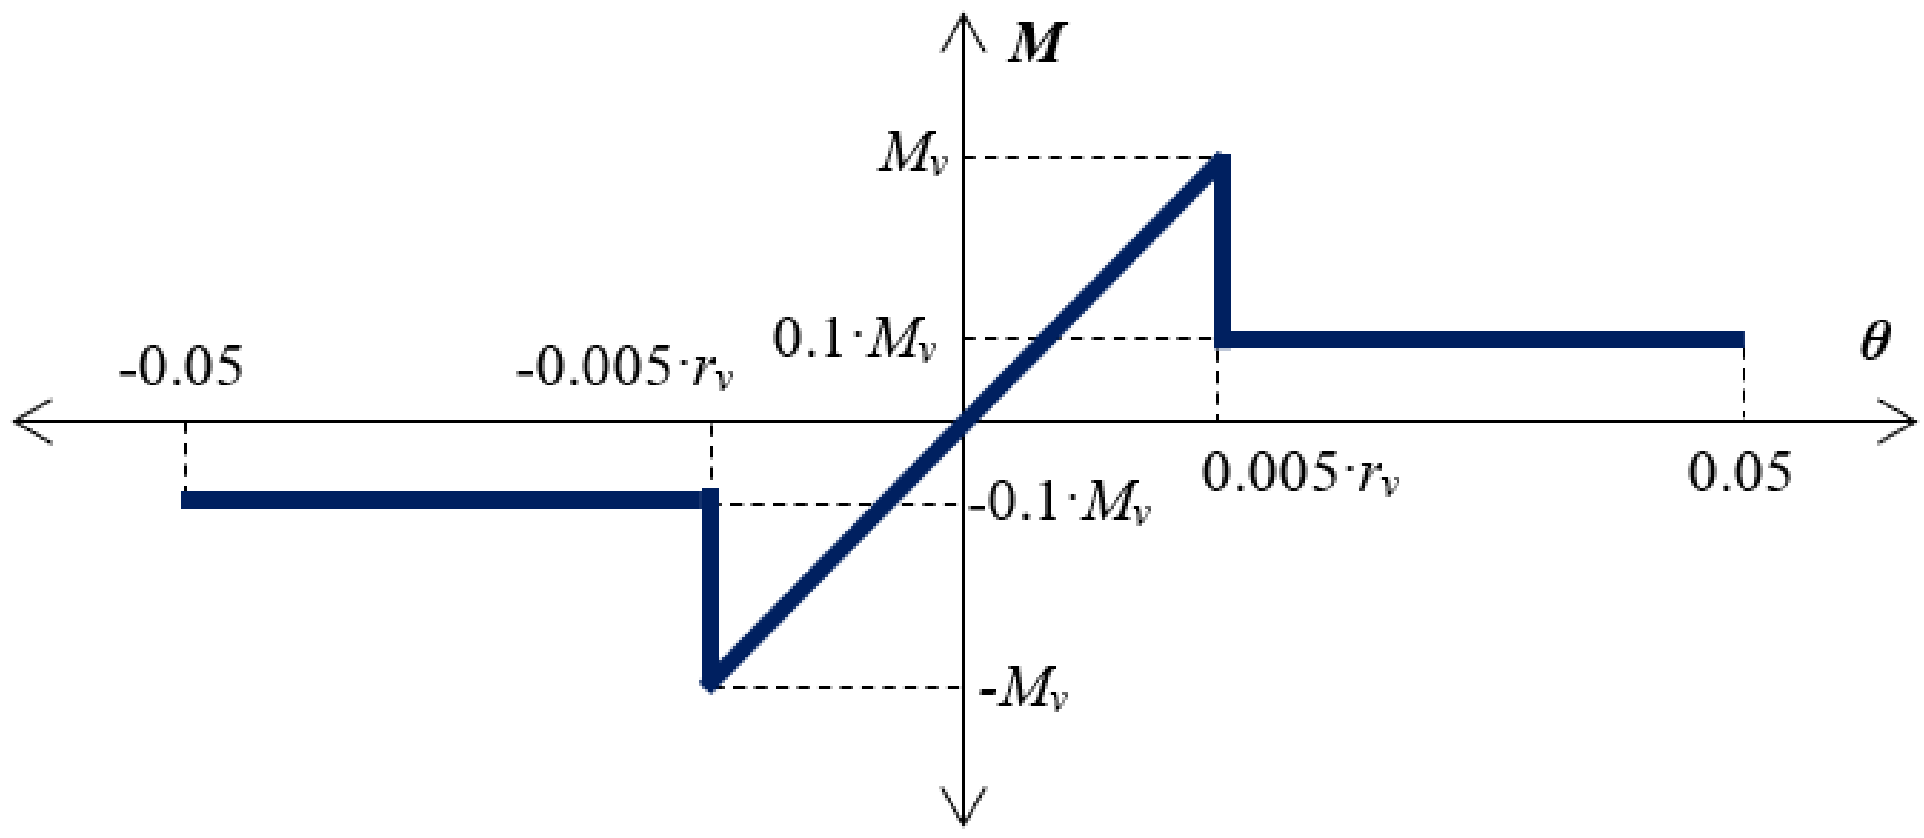
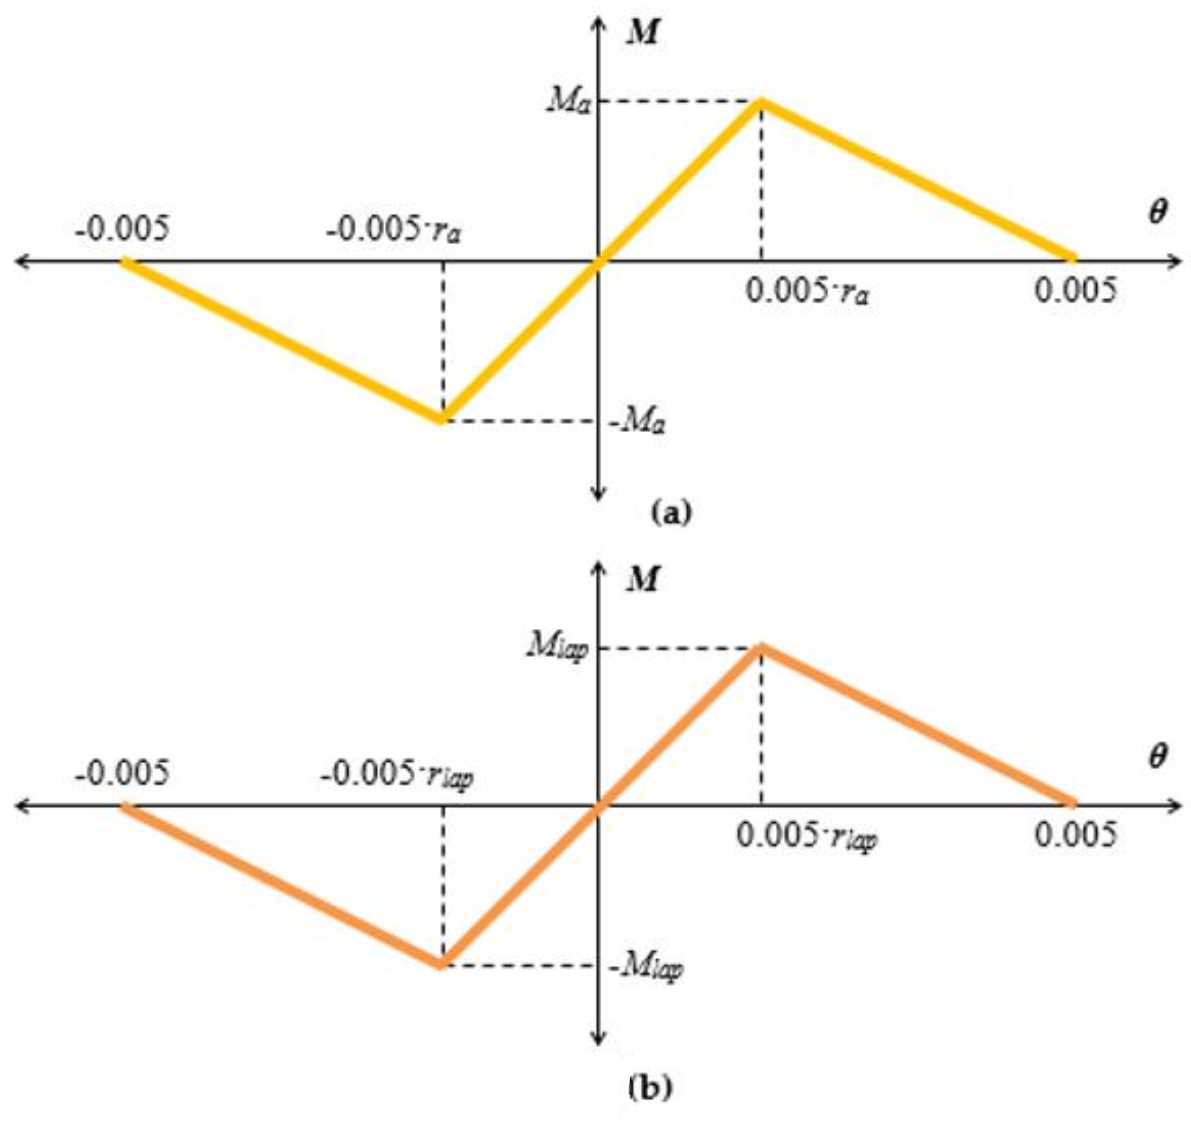
2.3. Simulation of Anchorage and Lap-Splice Failure of Longitudinal Reinforcement in Columns

Failure of anchorage and lap-splice of longitudinal bars limits the force developing in the bars to a value lower than their true axial strength and strain capacity. Both anchorage and lap-splice failures result from insufficient bond strength and are manifested with the formation of a single crack, perpendicular to the axis of the member. For columns, this occurs below the beam-column joint and above the base of the column in cases of anchorage and lap-splice failures, respectively.
In the framework of a third-tier seismic assessment of existing R/C buildings, anchorage and lap-splice failure of longitudinal reinforcement can be simulated with the use of two different zero-length elements, located at the top and the bottom of the clear length of an R/C column, as illustrated in Figure 1. The response of the zero-length elements is defined in each of the two-section directions by the Mθ trilinear relationships of Figure 4, where Ma = Vv · (Hcl/2), Mlap = Vlap · (Hcl/2). The column shear strengths against anchorage and lap-splice failure of the longitudinal reinforcement, Va and Vlap, respectively, are calculated using the closed-form expressions given in the Appendix A and their respective resistance ratios, ra = Va/Vflex and rlap = Vlap/Vflex.

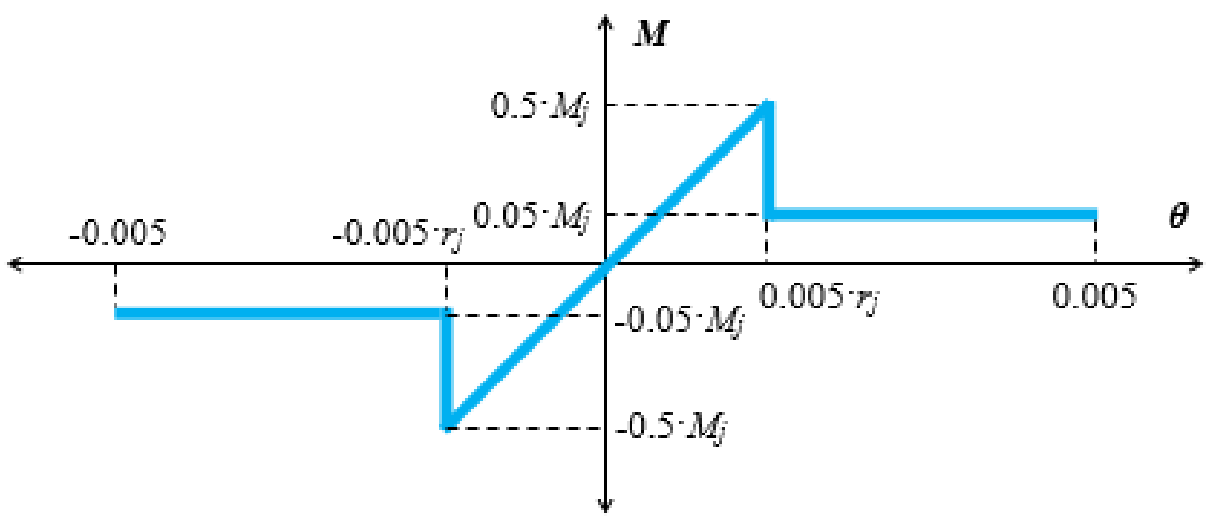
2.4. Simulation of Beam-Column Joint Behavior

Shear failure of beam-column joints in R/C buildings during earthquakes is a pronounced brittle mode of failure that may cause excessive flexibility of the overall frame and a consequent loss of vertical load-carrying capacity [3]. The integrity of R/C beam-column joints is secured through the compressive stress field acting within the joint which enables the concrete to participate in the joint shear action and allows (through the development of high bond stresses) for steep force gradients along with the beam and column primary reinforcements. In R/C buildings designed and constructed under contemporary standards (ASCE/SEI 41-17 [1], EN1998-1 [2], etc.), beam-column joints are dimensioned so as to sustain the development of the flexural strengths of the adjacent frame elements at the joint faces without significant degradation of the bond along with beam and column primary reinforcement. In substandard R/C buildings, the absence of a limited number of stirrups within the beam-column joints does not provide sufficient confinement to support the formation of the diagonal strut mechanism that is essential for force transfer between adjacent members during earthquake excitations.
Simulation of R/C beam-column joint behavior in FE models of existing R/C buildings can be achieved through the use of zero-length elements placed above and below the intersection of the beam and column elements used for simulating the mechanical behavior within the joint (see Figure 1). The joint response in each of the building principal plan dimensions is defined by the multilinear Mθ relationship of Figure 5. In this figure, Mj = Vj · (Hcl/2) is the bending moment associated with the shear capacity Vj of an R/C beam-column joint according to the RSA (see Equations (A11) and (A12) in the Appendix A, for unreinforced and well-reinforced joints, respectively), whereas rj (= Vj/Vflex) is the resistance ratio to shear failure in the beam-column joints.

3. Example Application of the Proposed Numerical Simulation Procedures

The accuracy of the present numerical simulation methodology is investigated through the analytical evaluation of the seismic response of the SPEAR test building that was constructed and tested in the European Laboratory of Seismic Assessment (ELSA) at the Joint Research Center (JRC) in Ispra, Italy. This testing was conducted within the framework of the Seismic Performance Assessment and Rehabilitation (SPEAR) European research program (Fardis [42]; Negro et al. [43], Jeong and Elnashai [44]).

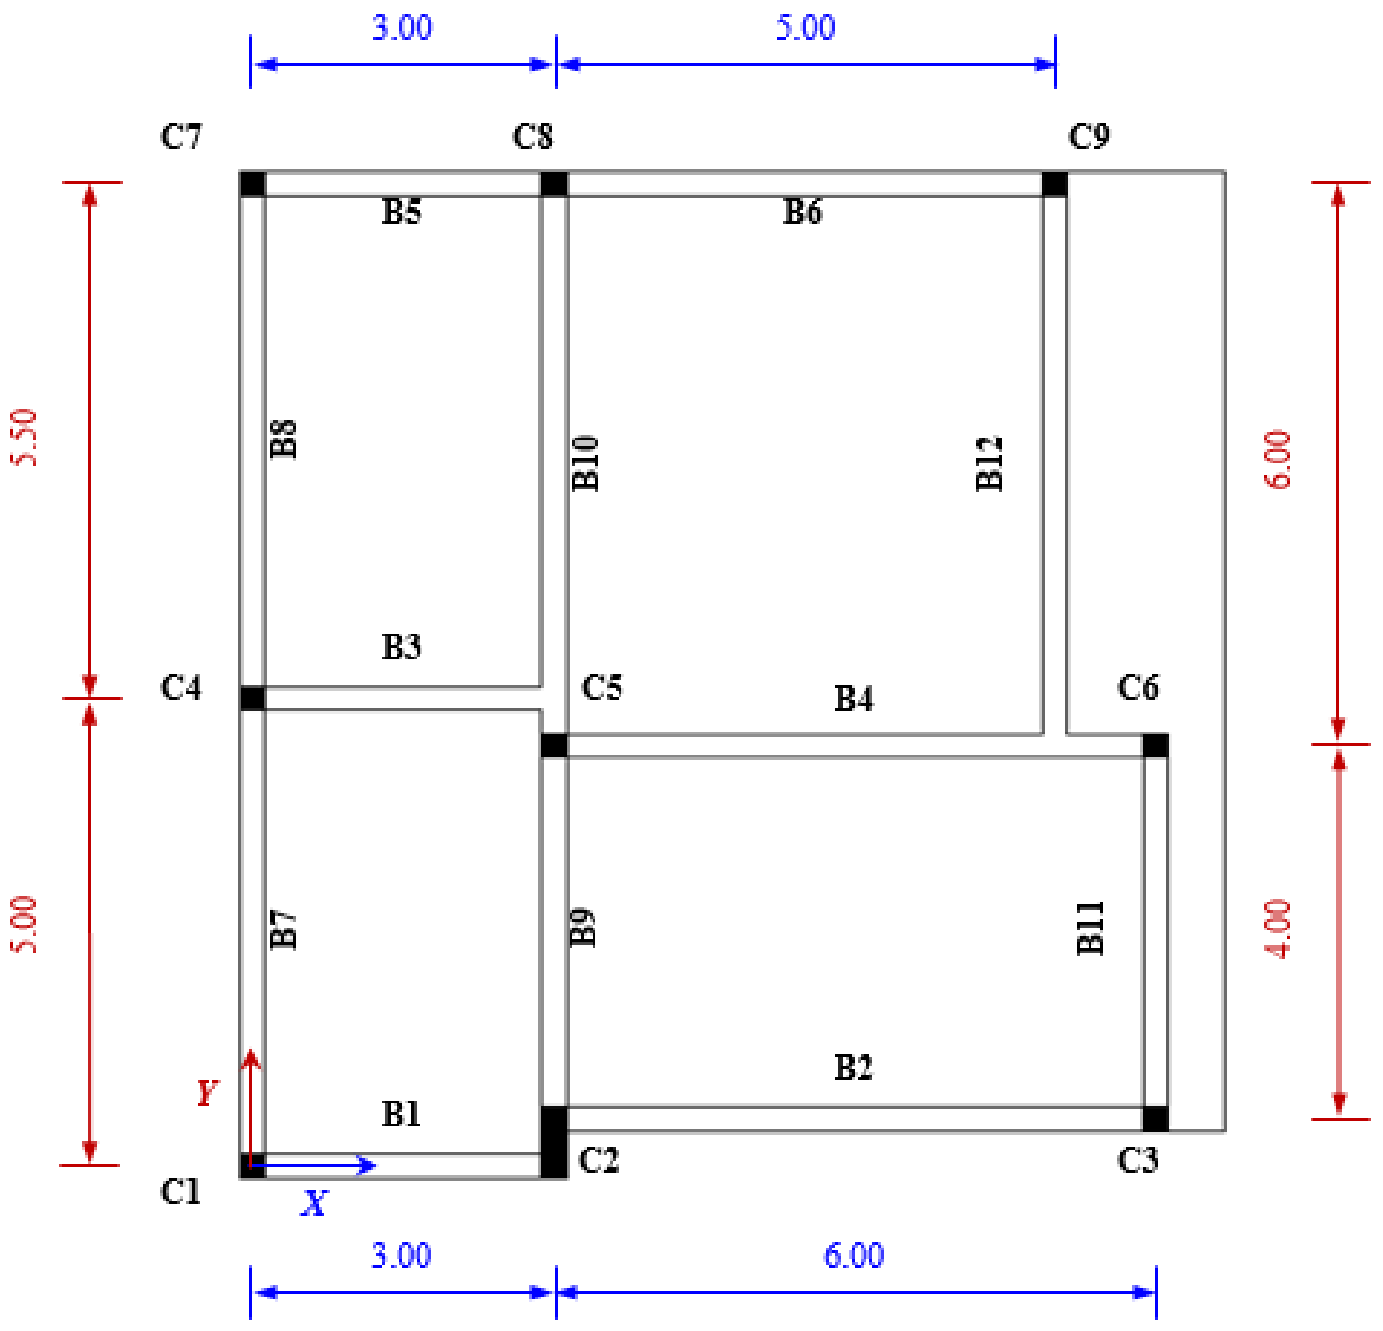
3.1. Geometric and Loading Characteristics of the SPEAR Building

The SPEAR building was a full-scale, three-story, 2 × 2 bay, torsionally sensitive R/C building which is considered representative of the structures that were designed and constructed throughout southern Europe from the 1950s until the mid-1980s (Figure 6). The building was designed for gravity loads alone, in addition to the self-weight of the R/C structural elements, as well as for 0.5 kN/m2 and 2.0 kN/m2 gravity loads on slabs accounting for finishing and live loads, respectively. All stories had an identical plan configuration with external dimensions of 12.825 m × 10.75 m, comprising eight columns of a 250 mm rectangular cross-section and one strong column of 250 mm × 750 mm cross-section. The columns were connected to beams having 250 mm × 500 mm web cross-sectional dimensions. Slab thickness was 150 mm, while story height in all cases was 3.00 m o.c. The columns had longitudinal reinforcement ∅12 mm smooth bars (see Figure 2), which were lap-spliced over 400 mm at the base for all three levels with a hook formation at the end of the bars. All columns had ∅8 mm perimeter stirrups, spaced at 250 mm o.c. which did not continue in the beam-column joints. Longitudinal reinforcement at both ends of all beams was 4 ∅12 mm bars at the top and 2 ∅12 mm bars at the bottom. Exceptions were: (i) beam B4 with 4 ∅20 mm plus 2 ∅12 mm bars at the top and 3 ∅20 mm bars at the bottom of both ends; (ii) beam B8 that was reinforced with 2 ∅20 mm top bars plus 4 ∅12 mm top bars at the connection with column C4, 4 ∅12 mm bars at the connection with column C7 and 2 ∅12 mm bars at both ends; (iii) beam B10 at the top had 4 ∅20 mm plus 2 ∅12 mm bars at the connection with column C5, 2 ∅20 mm plus 2 ∅12 mm bars at the connection with column C8 and 2 ∅20 mm bars at both ends; and (iv) beam B12 had 3 ∅20 mm plus 2 ∅12 mm bars at the top and 2 ∅20 mm bars at the bottom of both ends. The mean concrete compressive strengths fcm obtained from tests on cylindrical core specimen taken from the building after completion of the experiment was found equal to 24.73 MPa, 26.70 MPa, and 25.32 MPa for the first, second, and third story columns, respectively. Finally, uniaxial tensile tests on steel bar coupons yielded stress of reinforcement fy that was equal to 479.45 MPa, 474.11 MPa, and 396.87 MPa in the cases of the ∅8 mm, the ∅12 mm and the ∅20 mm bars, respectively.
The testing protocol at JRC consisted of a series of simulated ground motions of increasing intensity which were applied to the R/C structure through a pseudo-dynamic procedure. The basic accelerograms used were the two components of the Montenegro 1979 (Herceg Novi) ground motion, sequentially scaled upwards to 0.02 g, 0.15 g, and 0.20 g, labeled as the s10, s11, and s12 pseudo-dynamic tests. These accelerograms were applied in both the X and Y plan directions and were normalized with respect to the peak ground acceleration (PGA), as shown in Figure 7.

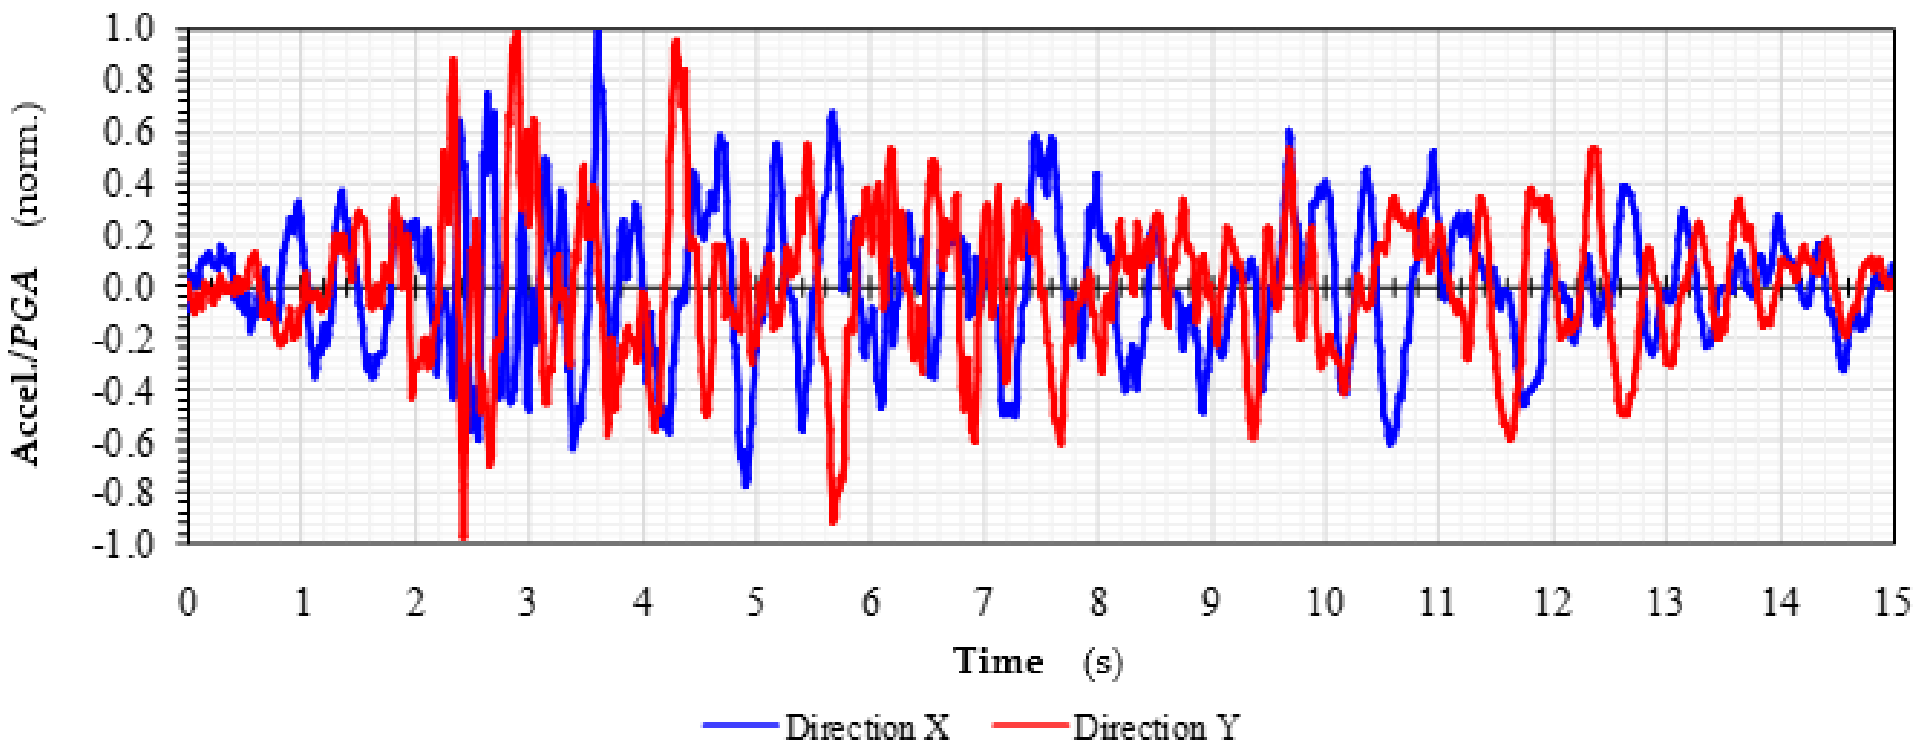
3.2. Numerical Simulation and Analysis of the SPEAR Βuilding

In order to evaluate the seismic response of the SPEAR test building, the structural system was simulated as a 3D-FE model comprising linear and zero-length elements as described in Section 2, using the OpenSees platform [41].
At first, the flexural response of the columns was modeled using two equal-length nonlinear Beam-Column element objects with a longitudinal fiber section discretization along the column clear length Hcl (see Figure 1). The reinforcing steel material properties were represented by the uniaxial, bilinear stress-strain relationship with kinematic hardening (Steel01 Material) with an initial elastic modulus equal to 200 GPa and a strain-hardening ratio of 3.3‰ and 5.3‰ in the cases of the ∅12 mm and the ∅20 mm bars, respectively. The inelastic concrete behavior was modeled using the uniaxial Kent-Scott-Park stress-strain envelope with degrading unloading/reloading hysteresis loops and no tensile strength (Concrete01 Material). Specifically, the concrete had an initial tangent modulus of 2 · fcm/εcy (εcy = 0.0022) and an ultimate strength and deformation capacity of fcu = 0.2 · fcm and εcu= 0.0035 according to Park, Priestley, and Gill [45,46]. Details of the fiber discretization of the column cross-sections are depicted in Figure 2.
Next, the modeling of the flexural response of beams was similar to that of columns, using the nonlinear Beam-Column element objects with longitudinal fiber section discretization. The cross-section of beam elements was a T-shape for all beams with effective width equal to bw + 2 · d (bw: beam web width; d: beam static height), except for beams {B1, B2, B5, B6, B7, and B8} which had an L-shape cross-section with effective width equal to bw + d. Beam finite elements spanning areas within the beam-column joints were modeled as rigid zones (see Figure 1).
Finally, the brittle response mechanisms of column failure (shear failure of the column web, of the anchorage, and lap-splice failure of column longitudinal reinforcements) were all simulated using Zero-Length element objects in the locations shown in Figure 1. Mechanical properties of the Zero-Length elements were defined according to the discussion in Section 2.2, Section 2.3 and Section 2.4, further considering column shear strengths corresponding to the different response mechanisms as calculated from Equations (A1)–(A6). The normalized average axial load ν in the columns that were used in Equations (A1)–(A6) was calculated from a static analysis of the FE building model under the self-weight of the structural elements and the additional gravity loads applied to the SPEAR building during the tests [42,43,44]. It is noted that the true axial load is variable, fluctuating about an average value due to overturning effects in the ground motion, with maximum values recorded in the columns that are furthest from the center of mass. Table 1 presents the normalized average axial load and the shear strengths of the SPEAR building columns corresponding to the mechanisms considered in the RSA system [30,31,32], whereas Table 2 presents the parameters defining the multilinear Mθ relationships used for simulating the responses of the zero-length elements parallel to the two principal plan directions.
Regarding the building mass needed for conducting a dynamic analysis, the numerical simulations used lumped masses defined at the centroid of each structural element (i.e., the slabs, the clear length of columns and beams, and the beam-column joints). Lumped masses were also added at individual nodes which were inserted at locations on the building floors where water tanks were placed during the tests for simulating the operational loads. For more information on the location of these tanks in the SPEAR building see References [42,43,44].
Diaphragm action at the floor levels was simulated by slaving the translational and rotational degrees of freedom acting parallel to the floor plane of all nodes located at the mid thickness of the building’s slabs. This was done by employing the rigid-Diaphragm multi-point constraint object at each floor level, in order to connect all intersected column nodes, all nodes located at the centroid of the corresponding R/C slabs, and all nodes simulating the aforementioned water tanks representing the SPEAR building operational loads. Furthermore, gravity loads associated with the SPEAR building and used for static analysis of the FE model were simulated as uniformly distributed loads along with the frame elements of the model.
The first step was to investigate the accuracy of the numerical simulation procedures proposed in this research. To this end, the SPEAR building FE model was subjected to time-history dynamic analyses for the cases of the s10 (PGA = 0.02 g), the s11 (PGA = 0.15 g), and the s12 (PGA = 0.20 g) earthquake records. Damping in the FE model during the dynamic analyses was represented by Rayleigh damping coefficients using the principal translational mode with the greatest period of vibration and the first torsional period of vibration in the XY plane. These were computed from a modal analysis of the FE building model, to which the standard 5% viscous damping was applied.

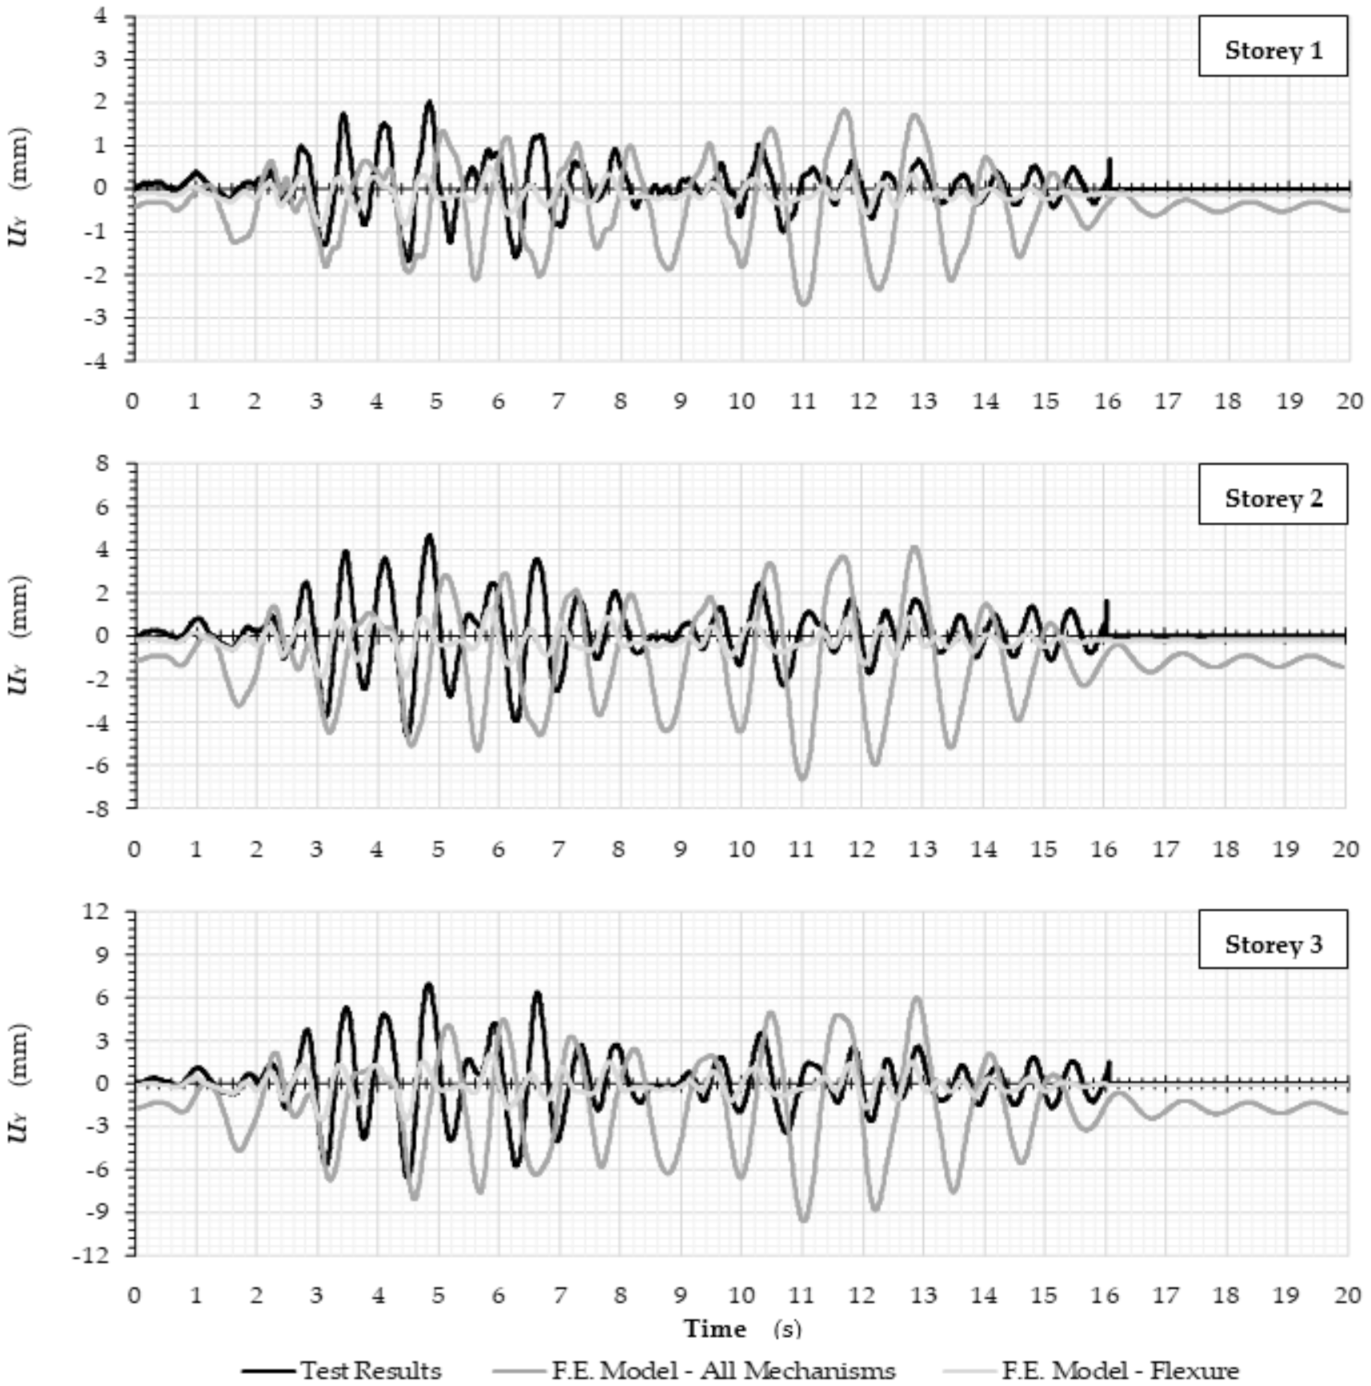
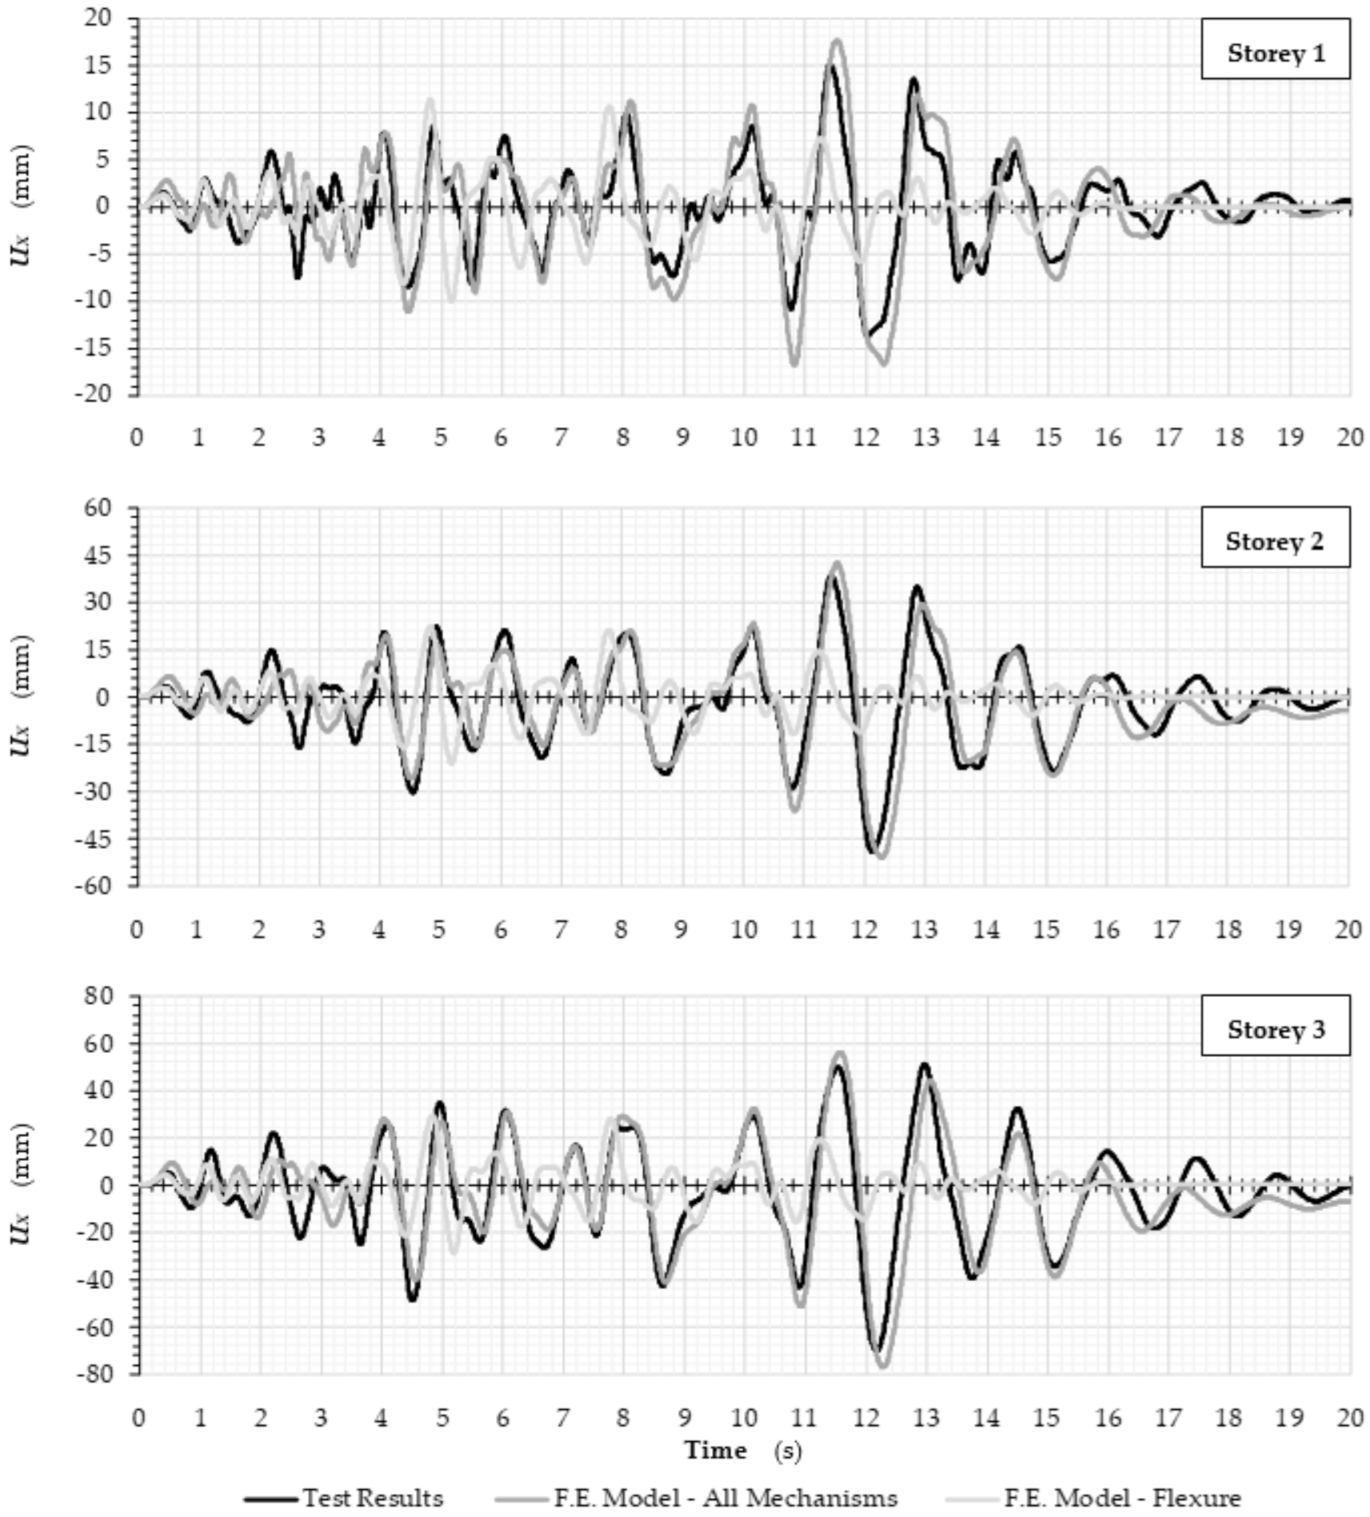
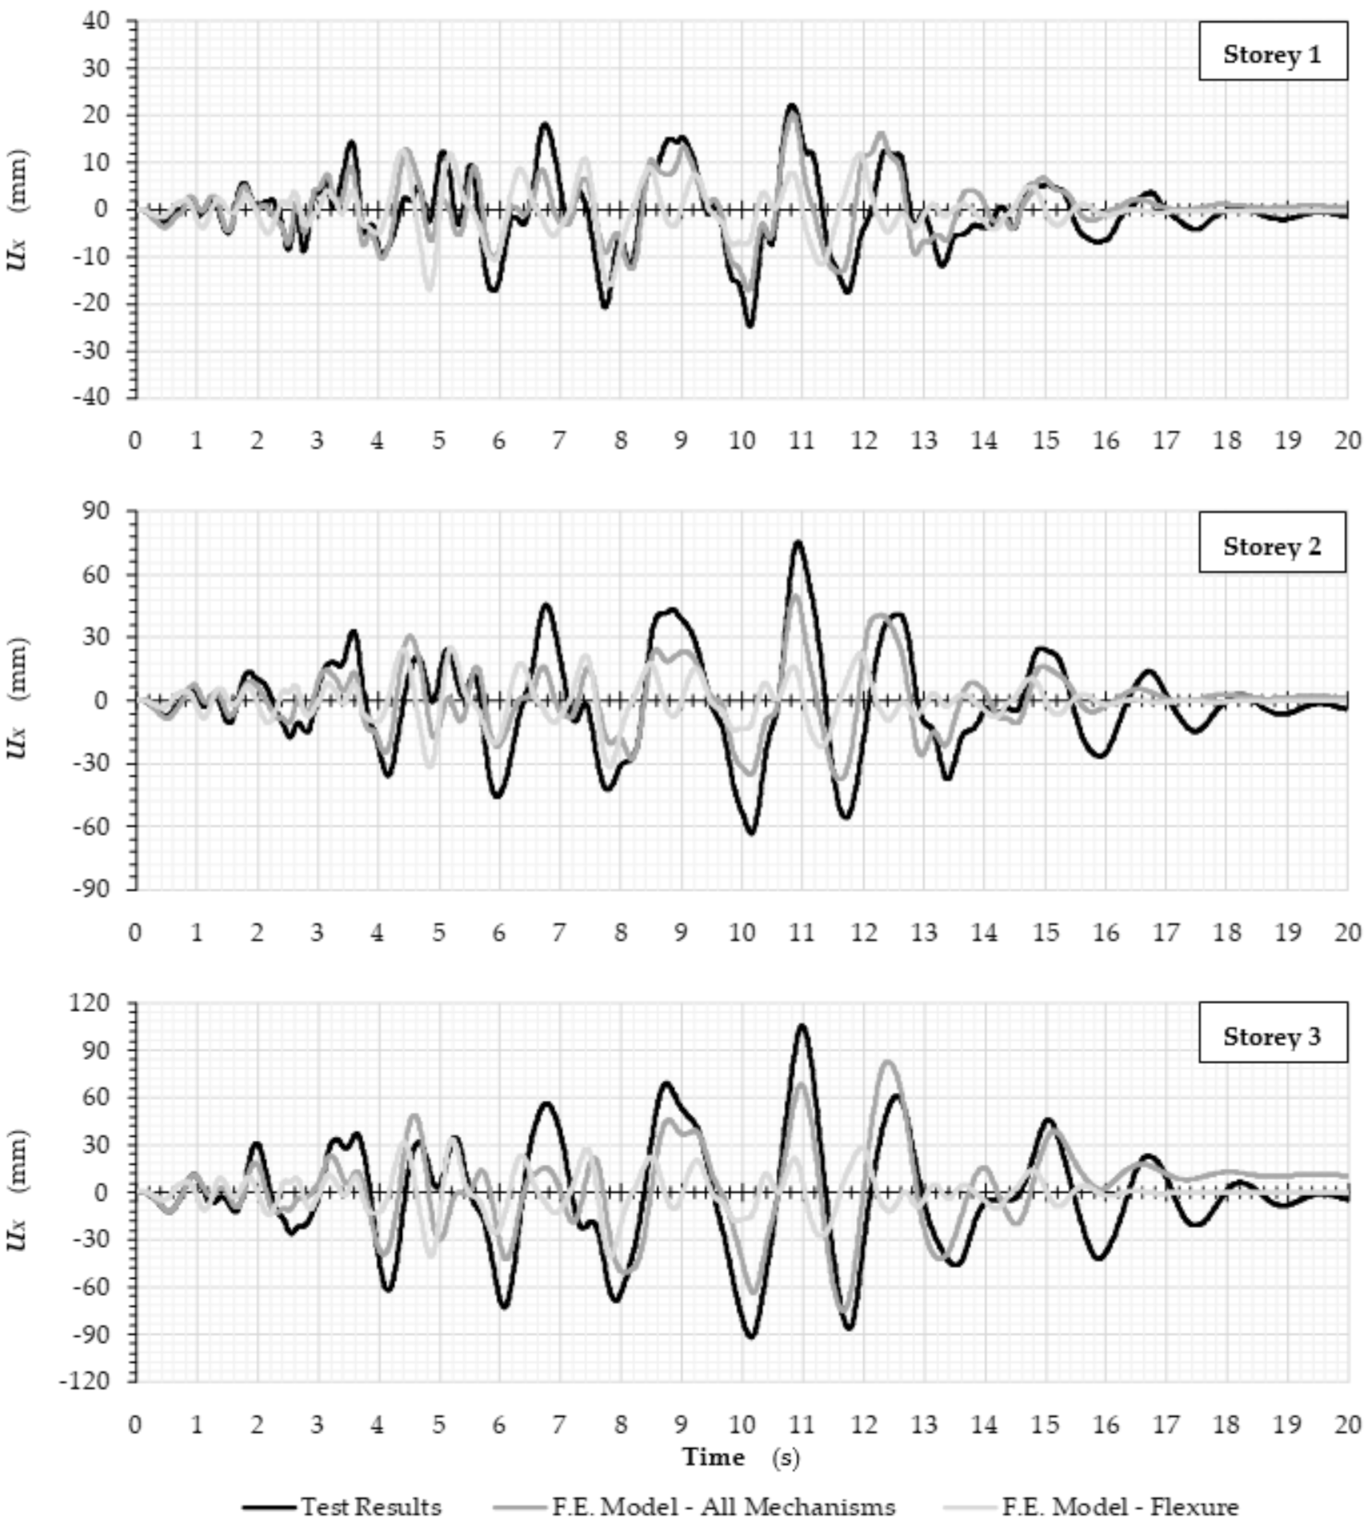
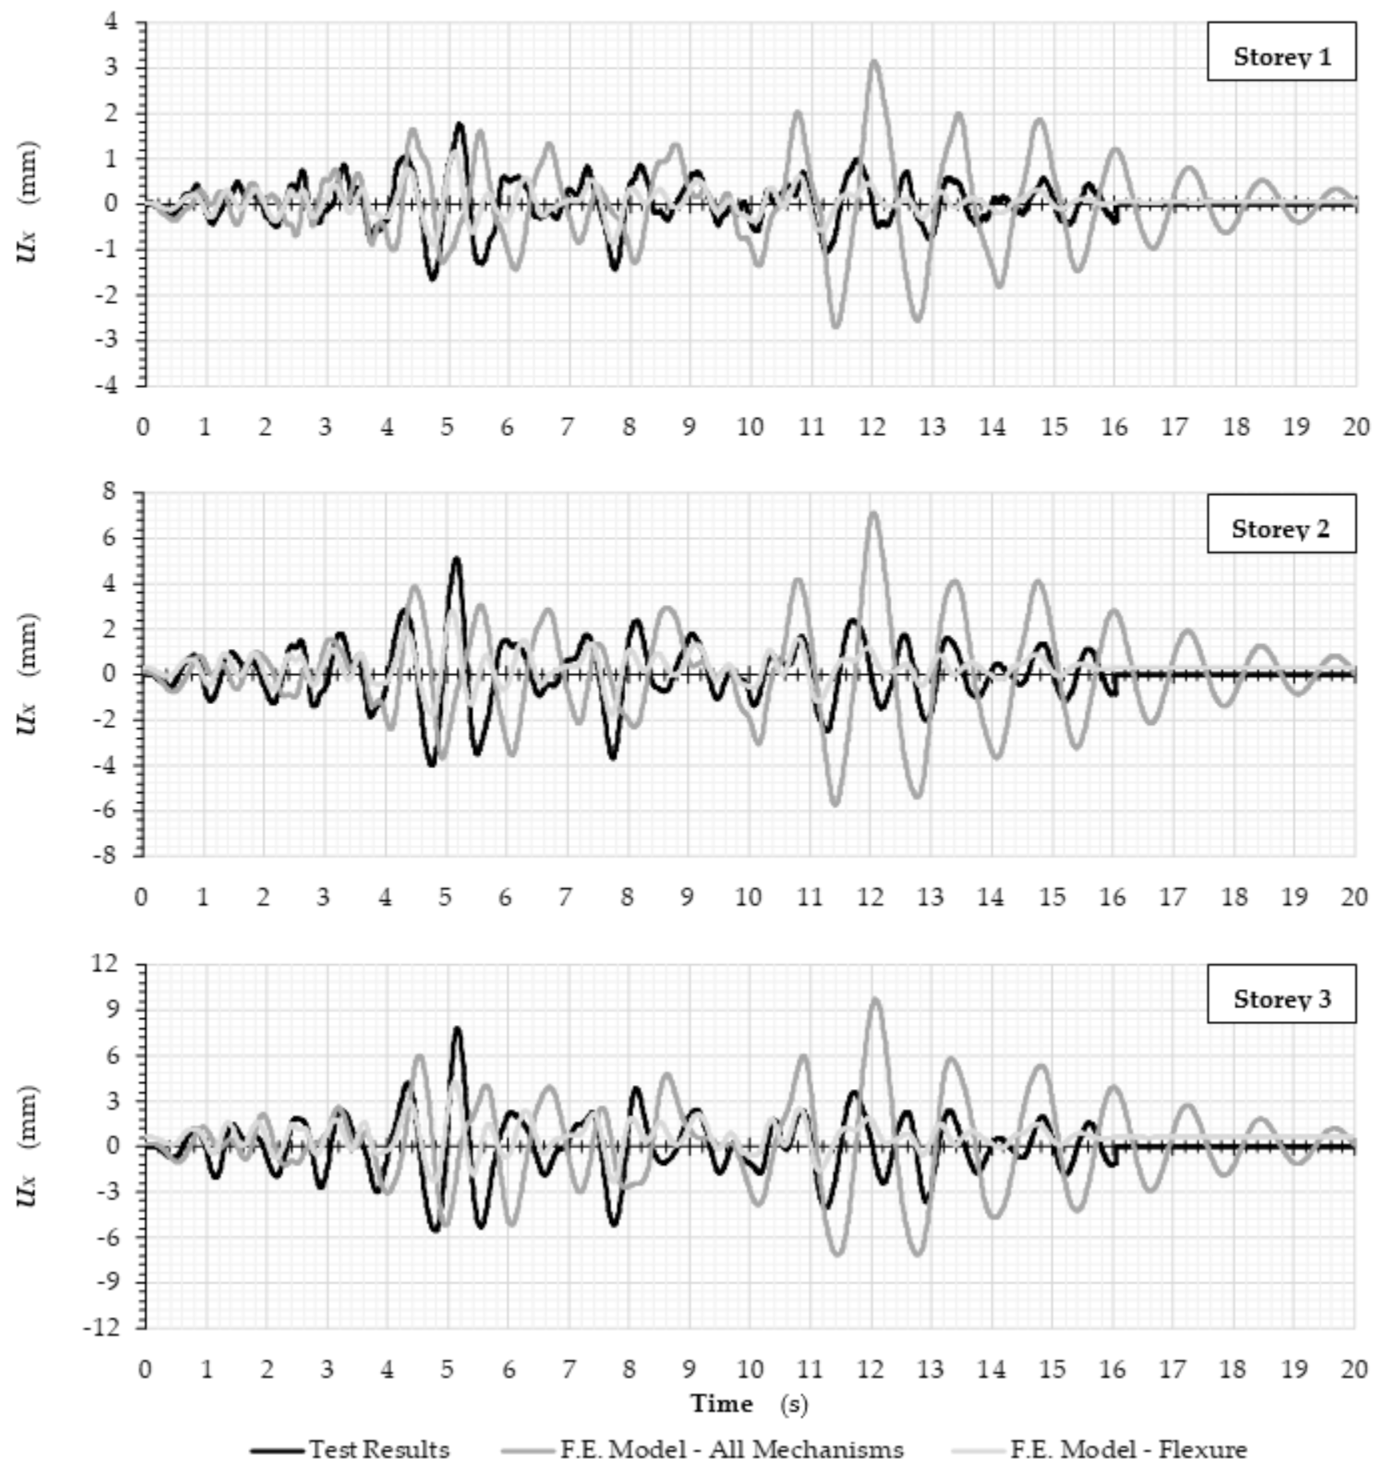
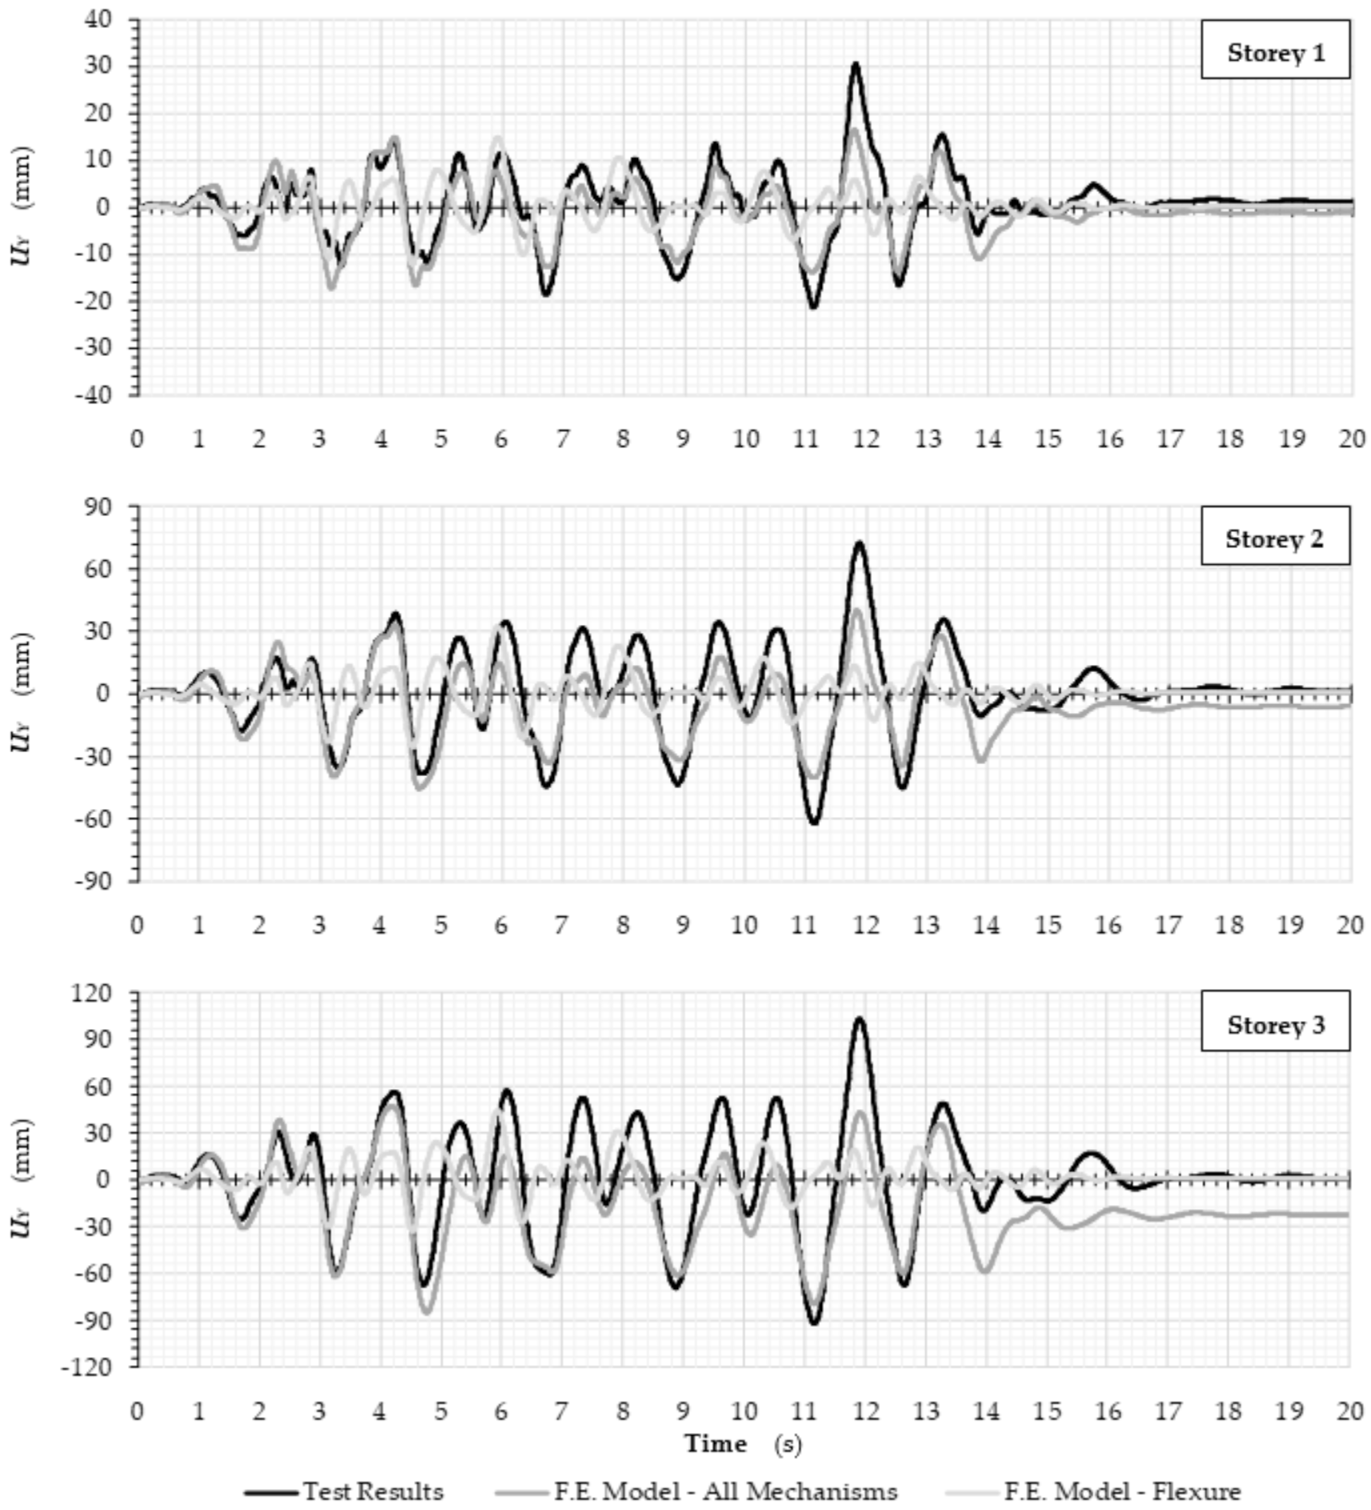
3.3. Evaluation of the Analyses Results

In order to evaluate the accuracy of the results obtained from a third-tier seismic assessment of substandard R/C buildings simulated according to the proposed modeling procedures, the computed response of the FE building model of the SPEAR building is compared to the actual response recorded at ELSA–JRC during the testing. To demonstrate the significance of simulating the brittle mechanisms of failure in substandard R/C buildings, these comparisons considered modifications in the structural response as follows: (i) a first FE building model of the SPEAR building accounted only for the inelastic flexural response of the R/C structural elements, while (ii) in a second FE building model, zero-length elements simulating mechanism {M2–M5} along column lines according to Section 2 were also included.
Figure 8, Figure 9, Figure 10, Figure 11, Figure 12 and Figure 13 present a comparison between the computed time histories of the horizontal displacements along with the X and Y plan directions, UX and UY, versus those recorded at ELSA–JRC during the s10, s11, and s12 pseudo-dynamic tests (black lines). Specifically, the numerical responses obtained from the time-history dynamic analyses of the FE building model using the proposed simulation procedure (dark grey lines) and those of the FE building model, accounting only for an inelastic flexural response, are plotted concurrently (light gray lines). These displacements correspond to the vibration of the center of mass (CM) of the three floors of the SPEAR building. Note that the overestimation of flexural stiffness leads to very low estimates of displacements and a stiffer overall structure, i.e., a lower natural period leading to unconservative results for the displacement demands and the anticipated damage. In the s11 earthquake case, the displacement demands estimated from analysis of the FE building model accounting only for inelastic flexural response are downgraded by 24% to 58% in the X plan direction and by 16% to 37% in the Y plan direction as compared to the response of the test building. In the case of the s12 earthquake case, the estimated displacement demands according to the analysis results of the same FE building model are downgraded by 32% to 61% and by 51% to 57% in the X and Y plan directions, respectively, as compared to the actual building response. On the other hand, the addition of the zero-length elements seem to have lengthened the natural period, leading to convergence of the displacement response and damage as compared to the response of the test building. Decisions made based on these two bounding estimates respectively would lead to little or no retrofit in the former case, and excessive and invasive retrofit in the latter case. It is also noted that as the intensity of shaking and damage accumulation from previous shaking increases in the structure, the waveforms of the more compliant model where all mechanism formations have been activated converge to the experimental response. This primarily occurs during the duration of the response pulses, which suggests convergence in the fundamental period computation.
Table 3 summarizes the peak displacement values obtained from the sequence of analyses for the center of mass of the three floors to the different intensity ground motions. Relative lateral drift ratios were obtained by dividing the relative floor displacement values by the clear floor height. Peak values, as well as the time instant of their occurrence, are also given in Table 3.
It is observed that the results of the flexural analysis (Fiber Model), where all the other premature local failure mechanisms were omitted in the model, fail to reproduce the salient characteristics of the response including the intensity of the drift demands by systematically underestimating them. In the s11 case, the analysis results of the fiber model lead to an underestimation of the actual drift demands by 24% in the first and by 69% in the second and third story with regards to the vibration in the X plan direction. These numbers respectively are 16%, 40%, and 53% in the first, second, and third stories in reference to the vibrations in the Y plan direction. In the s12 case, the drift demands obtained from analysis of the fiber FE model in the first, second, and third stories were underestimated by 32%, 73%, and 75% in the X plan direction and by 51%, 63%, and 64% in the Y plan direction as compared to the drift demands recorded during the testing of the SPEAR building. On the contrary, the complete model where local mechanism formation was enabled showed an increased rate of convergence with the experimental values as the intensity of the shaking and damage accumulation increased. In the s11 earthquake case, the results obtained from analysis of the complete model deviate by {+17%; −5%; +9%} in the X plan direction and by {+37%; +25%; +43%} in the Y plan direction with regards to the drift demands recorded at the first, the second, and the third story of the SPEAR building. Furthermore, in the case of the s12 pseudo-dynamic testing, the corresponding deviations of the analytical and experimental results were {−18%; −46%; +27%} in the X plan direction and {−43%; −32%; +35%} in the Y plan direction.
In reference to the instant of maximum horizontal translation of the centers of mass of the three floors, the analysis results converged to the experimental values in the longitudinal (X) direction (both in terms of the instant of time of occurrence as well as in terms of the magnitude). There was, however, a deviation in the transverse (Y) direction, particularly in the higher intensity earthquake motions s11 and s12. This deviation in the convergence of the estimated responses of both FE building models with the responses recorded at the SPEAR building in the Y direction is mainly due to the degree of accuracy prescribed in simulating the flexural response of the columns of the SPEAR building through fiber discretization. A discretization of the core of the building columns that is finer than the one used in the two FE building models (Figure 2), combined with the use of more advanced stress-strain relationships from the OpenSees library for simulating the inelastic response of steel and concrete materials, would most probably result in a better convergence between the analytically and experimentally obtained responses. However, such fine-tuning of the flexural behavior of the FE building models would have not affected the degree of influence that the simulated brittle mechanisms of response along the column lines of the SPEAR building have on the overall seismic response of the FE building models.
Finally, with regards to the additional computational cost incurred from implementing the present analytical-numerical methodology for simulating the brittle mechanisms of response along the column lines of sub-standard R/C buildings, the conclusion is as follows: No significant difference was observed in terms of convergence rate and time requirements by either simulating the brittle mechanisms of failure in the FE building models according to the proposed methodology or by simulating only the nonlinear flexural response of the same buildings.

4. Conclusions

This work investigates the validity of a proposed methodology for the performance assessment of older, substandard moment-resisting R/C frame buildings following an earthquake event. The classification ‘sub-standard’ comes from the fact that R/C construction prior to the mid-1980s did not benefit from the findings of subsequent research regarding pertinent seismic detailing of R/C structures which has now filtered into contemporary building codes. The proposed methodology is based on the earlier work by two of the authors leading to the development of a procedure known as Rapid Seismic Assessment (RSA) which hinges on whether or not the local drift demands can be tolerated without failure along the load resistance path. Guidelines are provided here for modeling all brittle localized strength mechanisms that may occur in the load path of frame structures under lateral loading which is manifested in substandard R/C buildings subjected to seismic loads. An application example using test data from a well-documented experimental program helps to clarify the importance of these mechanisms in a realistic evaluation of the seismic response for this category of buildings.

Author Contributions

Conceptualization, S.I.P., S.J.P. and G.D.M.; methodology, S.I.P. and S.J.P.; software, S.I.P.; validation, S.I.P.; formal analysis, S.I.P., S.J.P. and G.D.M.; investigation, S.J.P.; resources, G.D.M.; data curation, S.I.P.; writing—original draft preparation, S.I.P.; writing—review and editing, G.D.M. and S.J.P.; critical review, G.D.M.; project administration, G.D.M. All authors have read and agreed to the published version of the manuscript.

Funding

This research received no external funding.

Institutional Review Board Statement

Not applicable.

Informed Consent Statement

Not applicable.

Data Availability Statement

Data generated by the FE numerical simulations of the SPEAR testing building carried out for the purposes of this work are available in the form of text files by directly contacting the first author (SIP).

Acknowledgments

The Civil Engineering department of Aristotle University is acknowledged for providing a post-doctoral appointment to the first author (SIP) for the period 2017–2021.

Conflicts of Interest

The authors declare no conflict of interest.

Appendix A

The individual strength terms of an R/C column for an RSA are calculated using closed form expressions which lend themselves to easy spreadsheet calculations. These expressions represent the current state-of-the-art information in the field and may be subject to revisions as the knowledge base in R/C leads to improved models for the individual resistance mechanisms.
The first step towards the calculation of the individual strength terms of an R/C column is the determination of the normalized depth of the compression zone, ξ = x/d, at the ultimate limit state, which is estimated for a specified axial load ratio ν = N/(Ac · fc) from the following interpolations:
if   v b a l <   v <   v m a x ,   ξ = ξ b a l , u +   1 ξ b a l , u   ·   v v b a l v m a x v b a l
if   v m i n <   v   v b a l ,   ξ = δ 2 +   ξ b a l , u δ 2   ·   v v m i n v b a l v m i n
The values of νmin, νbal, and νmax correspond to characteristic values of the depth of compression zone x, for εcu = 0.005, and are given as follows:
for   x = d 2 ξ 2 = δ 2 ,   v m i n A c · f c = 0.72 · δ 2 f y 1 α · f c ·   ρ s 1 + ρ v ·   1 2 · δ 2
for   x = x b a l ξ b a l , u = 0.64 ,   v b a l A c · f c =   ρ s 2 ρ s 1   ·   f y f c + 0.462 + 0.275 · ρ v · f y f c
for   x = d ξ d = 1 ,   v m a x A c · f c = 0.85 2 + f y f c ·   ρ s 2 + 0.8 · ρ v
With the interpolated value of ξ, the following strength terms are now determined:
Flexural shear demand:
V f l e x =   ρ , t o t · f y f c ·   1 0.4 · ξ   +   v · h d 0.8 · ξ · b · d 2 · f c H c l
Exhaustion of shear strength:
If     v <   0.10 : V v = A t r · f s t · d · ( 1 0.4 · ξ ) s · cot θ v
If     v     0.10 : V v = v · b · d · f c · tan α + A t r · f s t · d · ( 1 0.4 · ξ ) s · cot θ v
Anchorage failure of longitudinal reinforcement:
V a =   ρ , t o t · min 4 · L a · f b D b + α h o o k · 50 · f b ; f y f c ·   1 0.4 · ξ   +   v · h d 0.8 · ξ · b · d 2 · f c H c l
Lap failure of longitudinal reinforcement:
V l a p =   min μ f r · L l a p · A t r s · f s t + α b ·   b N b · D b · f t + + α h o o k · 50 · N b · A b · f b ; N b · A b · f y · d · 1 0.4 · ξ + + v · b · d 2 · f c · 0.5 · h / d 0.4 · ξ H c l / 2
Shear capacity of joints:
Unreinforced   or   lightly   reinforced   joints : V j = γ j · 0.5 · f c · 1 + v j · f c 0.5 · f c · b j · d · d b e a m H c l
Well   reinforced   joints : V j =   γ j · 0.5 · f c · 1 + v j · f c 0.5 · f c · b j · d · d b e a m H c l · 1 + ρ j , h o r i z · f s t f t
In the above expressions, the following terms appear:
  • ρℓ,tot = As,tot/(b · d) is the total longitudinal reinforcement ratio of a column with external dimensions h × b,
  • As,tot is the total area of the longitudinal reinforcement at the column’s critical section,
  • d is the column effective depth,
  • fy is the longitudinal reinforcement yield stress,
  • fc is the concrete compressive strength,
  • ξ (= x/d) is the normalized depth of compression zone,
  • v is the axial load ratio acting on the cross-section (Ng+0.3q/(b · d · fc)),
  • Hcl is the column’s deformable length,
  • tanα = (h/d − 0.8 · ξ) · d/Hcl, where a (≤θv) is the angle of inclination of the diagonal strut created between the centroids of the compression zones at the top and bottom column cross-sections of the column. This represents the strut forming by the axial load acting on the column according to Priestley et al. [44],
  • θv = {45° when v < 0.10, 30° when v ≥ 0.25, whereas for 0.10 ≤ v < 0.25 θv is calculated from linear interpolation} is the angle of sliding plane. Specifically, θv is the angle forming between the longitudinal member axis and a major inclined crack developing in the plastic hinge region of the column. It determines the number of stirrup legs that are intersected by the inclined sliding plane,
  • hst is the height of the stirrup legs,
  • Atr is the total area of stirrup legs in a single stirrup pattern, which are intersected by the inclined sliding plane,
  • s is the stirrup spacing,
  • fst is the stirrup yield stress,
  • Lα is the anchorage length of the longitudinal reinforcement,
  • Db is the diameter of longitudinal reinforcing bars,
  • αhook is a binary index (1/0) to account for hooked anchorages (αhook = 0 ⇒ no hooks),
  • fb = 2 · fb,o is the concrete bond stress, where fb,o = n1 · (fc/20)0.5, n1 = {1.80 for ribbed bars; 0.90 for smooth bars},
  • μfr is the friction coefficient {0.2 ≤ μfr ≤ 0.3 for smooth bars; 1.0 ≤ μfr ≤ 1.5 for ribbed bars},
  • Llap is the lap-splice length,
  • αb is a binary index {1 or 0} depending on whether ribbed or smooth reinforcement has been used,
  • Nb is the number of longitudinal bars in tension,
  • Ab is the area of a single tension bar,
  • ft = 0.3 · fc2/3 is the concrete tensile strength,
  • γj = {1.40 for interior joints; 1.00 for all other cases, whereas, for joints without stirrups these values are reduced to 0.4 and 0.3 respectively},
  • vj is the (service) axial load acting on the bottom of the column adjusted at the top of the joint (compression is positive),
  • bj = (b + bbeam)/2 is the joint width, where bbeam is the web width of the adjacent beam,
  • dbeam is the beam depth, and
  • ρj,horiz = Atr/(s · bj).

References

  1. ASCE Standard, ASCE/SEI, 41–17Seismic Evaluation and Retrofit of Existing Buildings, American Society of Civil Engineers: Reston, VA, USA, 2017.
  2. EN 1998-1Eurocode 8: Design of Structures for Earthquake Resistance—Part 1: General Rules, Seismic Actions and Rules for Buildings, European Committee for Standardization (CEN): Brussels, Belgium, 2004.
  3. FIB Bulletin 24Seismic Assessment and Retrofit of Reinforced Concrete Buildings, State-of-Art Report prepared by Task Group 7.1, Federation of Structural Concrete (FIB): Lausanne, Switzerland, 2003.
  4. EN 1998-3Eurocode 8: Design of Structures for Earthquake Resistance—Part 3: Assessment and Retrofitting of Buildings, European Committee for Standardization (CEN): Brussels, Belgium, 2005.
  5. EPPO. Greek Code of Structural Interventions; Earthquake Planning and Protection Organization of Greece (EPPO): Athens, Greece, 2012. [Google Scholar]
  6. FEMA-356 Pre-StandardCommentary for the Seismic Rehabilitation of Buildings, Federal Emergency Management Agency (FEMA): Washington, DC, USA, 2000.
  7. Vamvatsikos, D.; Cornell, C.A. Incremental dynamic analysis. Earthq. Eng. Struct. Dyn. 2002, 31, 491–514. [Google Scholar] [CrossRef]
  8. Syntzirma, D.V.; Pardalopoulos, S.Ι.; Pantazopoulou, S.J. Experimental evaluation of strength assessment procedures for R/C elements with sub-standard details. Eng. Struct. 2020, 224, 111191. [Google Scholar] [CrossRef]
  9. Henkhaus, K.; Pujol, S.; Ramirez, J. Axial failure of reinforced concrete columns damaged by shear reversals. J. Struct. Eng. 2013, 139, 1172–1180. [Google Scholar] [CrossRef]
  10. Sokoli, D.; Ghannoum, W.M. High-strength reinforcement in columns under high shear stresses. ACI Struct. J. 2016, 113, 605–614. [Google Scholar] [CrossRef]
  11. Panagiotakos, T.; Fardis, M.N. Deformation of R/C members at yielding and ultimate. ACI Struct. J. 2001, 98, 135–148. [Google Scholar]
  12. Pujol, S.; Ramirez, J.A.; Sozen, M.A. Drift capacity of reinforced concrete columns subjected to cyclic shear reversals. ACI Spec. Publ. 1999, 187, 255–274. [Google Scholar]
  13. Di Ludovico, M.; Verderame, G.M.; Prota, A.; Manfredi, G.; Cosenza, E. Cyclic behavior of nonconforming full-scale RC columns. J. Struct. Eng. 2014, 140, 04013107. [Google Scholar] [CrossRef]
  14. Lynn, A.; Moehle, J.P.; Mahin, S.; Holmes, W. Seismic evaluation of existing RC building columns. Earthq. Spectra 1996, 12, 715–739. [Google Scholar] [CrossRef]
  15. Aboutaha, R.S.; Engelhardt, M.D.; Jirsa, J.O.; Kreger, M.E. Experimental investigation of seismic repair of lap splice failures in damaged concrete columns. ACI Struct. J. 1999, 96, 297–306. [Google Scholar]
  16. Tastani, S.P.; Pantazopoulou, S.J. Yield penetration in seismically loaded anchorages: Effects on member deformation capacity. Earthq. Struct. 2013, 5, 527–552. [Google Scholar] [CrossRef]
  17. Thanh Ngoc Tran, C.; Li, B. Ultimate displacement of reinforced concrete columns with light transverse reinforcement. J. Earthq. Eng. 2013, 17, 282–300. [Google Scholar] [CrossRef]
  18. Elwood, K.J.; Moehle, J.P. Drift capacity of reinforced concrete columns with light transverse reinforcement. Earthq. Spectra 2005, 21, 71–89. [Google Scholar] [CrossRef]
  19. Inel, M.; Aschheim, M.A.; Pantazopoulou, S.J. Seismic deformation capacity estimates for concrete columns. Mag. Concr. Res. 2007, 59, 297–310. [Google Scholar] [CrossRef]
  20. Tastani, S.P.; Thermou, G.E.; Pantazopoulou, S.J. Yield penetration in bar anchorages and the effect on rotation capacity. In Special Volume Compiled by the Institut fur Werkstofeim Bauwesen in Honor of Prof. R. Eligehausen; Universitat Stuttgart: Stuttgart, Germany, 2012. [Google Scholar]
  21. Pantazopoulou, S.J. Detailing for reinforcement stability in RC members. J. Struct. Eng. 1998, 124, 623–632. [Google Scholar] [CrossRef]
  22. Pujol, S.; Sozen, M.; Ramirez, J. Displacement history effects of drift capacity of reinforced concrete columns. ACI Struct. J. 2006, 103, 253–262. [Google Scholar]
  23. Ranf, R.T.; Eberhard, M.O.; Stanton, J.F. Effects of displacement history on lightly confined, reinforced concrete bridge columns. ACI Spec. Publ. 2006, 236, 23–42. [Google Scholar]
  24. Wood, S.L.; Sittipunt, C. Cyclic response of reinforced concrete structural walls. ACI Spec. Publ. 1996, 162, 399–430. [Google Scholar]
  25. Zhu, L.; Elwood, K.J.; Haukaas, T. Classification and seismic safety evaluation of existing reinforced concrete columns. J. Struct. Eng. 2007, 133, 1316–1330. [Google Scholar] [CrossRef]
  26. ACI 318Building Code Requirements for Structural Concrete and Commentary, American Concrete Institute (ACI): Farmington Hills, MI, USA, 2019.
  27. Berry, M.P.; Eberhard, M.O. Practical performance model for bar buckling. J. Struct. Eng. 2005, 131, 1060–1070. [Google Scholar] [CrossRef]
  28. Ruggieri, S.; Porco, F.; Uva, G.; Vamvatsikos, D. Two frugal options to assess class fragility and seismic safety for low-rise reinforced concrete school buildings in Southern Italy. Bull. Earthq. Eng. 2021, 19, 1415–1439. [Google Scholar] [CrossRef]
  29. Ruggieri, S.; Porco, F.; Uva, G. A practical approach for estimating the floor deformability in existing RC buildings: Evaluation of the effects in the structural response and seismic fragility. Bull. Earthq. Eng. 2020, 18, 2083–2113. [Google Scholar] [CrossRef]
  30. Pardalopoulos, S.Ι.; Pantazopoulou, S.J. Rapid seismic assessment of two four-storey R/C test buildings. Bull. Earthq. Eng. 2019, 17, 1379–1406. [Google Scholar] [CrossRef]
  31. Pardalopoulos, S.I.; Pantazopoulou, S.J.; Lekidis, V.A. Simplified method for rapid seismic assessment of older R/C buildings. Eng. Struct. 2018, 154, 10–22. [Google Scholar] [CrossRef]
  32. Pardalopoulos, S.; Thermou, G.E.; Pantazopoulou, S.J. Screening criteria to identify brittle R/C structural failures in earthquakes. Bull. Earthq. Eng. 2013, 11, 607–636. [Google Scholar] [CrossRef]
  33. DIN 1045Beton und Stahlbetonbau: Bemessung und Ausführung, Deutsches Institut für Normung (DIN): Berlin, Germany, 1972.
  34. EN1992-1-1Eurocode 2: Design of Concrete Structures—Part 1-1: General Rules and Rules for Buildings, European Committee for Standardization (CEN): Brussels, Belgium, 2004.
  35. Lang, A.F.; Marshall, J.D. Devil in the details: Success and failure of Haiti’s non-engineered structures. Earthq. Spectra 2011, 27, S345–S372. [Google Scholar] [CrossRef]
  36. Augenti, N.; Parisi, F. Learning from construction failures due to the 2009 L’Aquila, Italy, earthquake. ASCE J. Perform. Constr. Facil. 2010, 24, 536–555. [Google Scholar] [CrossRef]
  37. Mehrabian, A.; Haldar, A. Some lessons learned from post-earthquake damage survey of structures in Bam, Iran earthquake of 2003. Struct. Surv. 2005, 23, 180–192. [Google Scholar] [CrossRef]
  38. Dogangun, A. Performance of reinforced concrete buildings during the May 1, 2003 Bingol Earthquake in Turkey. Eng. Struct. 2004, 26, 841–856. [Google Scholar] [CrossRef]
  39. Jeong, S.H.; Elnashai, A.S. Analytical and experimental seismic assessment of irregular RC buildings. In Proceedings of the 13th World Conference on Earthquake Engineering (13th WCEE), Vancouver, BC, Canada, 1–6 August 2004. [Google Scholar]
  40. Varum, H. Seismic Assessment, Strengthening and Repair of Existing Buildings. Ph.D. Thesis, Universidade de Aveiro, Aveiro, Portugal, 2003. [Google Scholar]
  41. OpenSees—Open System for Earthquake Simulation; Pacific Earthquake Engineering Research Center (PEER): Berkeley, CA, USA, 2020; Available online: https://opensees.berkeley.edu/ (accessed on 1 December 2021).
  42. Fardis, M.N. Design of an Irregular Building for the SPEAR Project—Description of the 3-Storey Structure; University of Patras Publication: Patras, Greece, 2002. [Google Scholar]
  43. Negro, P.; Mola, E.; Molina, F.J.; Magonette, G.E. Full-scale PSD testing of a torsionally unbalanced three-storey non-seismic RC frame. In Proceedings of the 13th World Conference on Earthquake Engineering (13th WCEE), Vancouver, BC, Canada, 1–6 August 2004. [Google Scholar]
  44. Jeong, S.-H.; Elnashai, A.S. Analytical Assessment of an Irregular RC Full Scale 3D Test Structure; Mid-America Earthquake Center (MAE) Publication: Urbana, IL, USA, 2004. [Google Scholar]
  45. Park, R.; Priestley, M.J.N.; Gill, W.D. Ductility of square confined concrete columns. ASCE J. Struct. Eng. 1982, 108, 929–950. [Google Scholar] [CrossRef]
  46. Priestley, M.N.; Seible, F.; Calvi, G.M. Seismic Design and Retrofit of Bridges; Wiley: Hoboken, NJ, USA, 1996. [Google Scholar]
Figure 1. Simulation of strength mechanisms that develop within the structural system of substandard R/C buildings. Hatched regions represent cross-sections of members extending normal to the plane of view (e.g., slab and transverse beams).
Applsci 12 01602 g001
Figure 2. Simulation of the inelastic flexural response of R/C columns and beams using fiber discretization of cross-sections.
Applsci 12 01602 g002
Figure 3. Moment–Rotation (Mθ) relationship used in simulating the response of R/C columns to shear failure in the web.
Applsci 12 01602 g003
Figure 4. Moment–Rotation (M-θ) relationship for simulating (a) anchorage and (b) lap-splice behavior of longitudinal reinforcement in substandard R/C columns.
Applsci 12 01602 g004
Figure 5. Moment–Rotation (Mθ) relationship representing the shear response of R/C beam-column joints in an intermediate floor of a building (the 0.5 factor for the moment is replaced by 1.0 for a roof joint in the building).
Applsci 12 01602 g005
Figure 6. Typical story plan of the SPEAR test building at ELSA-JRC, Ispra, Italy (units in m).
Applsci 12 01602 g006
Figure 7. Time-histories of the two components of ground acceleration used in the testing of the SPEAR building at ELSA-JRC.
Applsci 12 01602 g007
Figure 8. Comparison of the horizontal displacements in the X-plan direction measured at the SPEAR building during the s10 earthquake case and the corresponding response estimated from a dynamic analysis using two different FE building models.
Applsci 12 01602 g008
Figure 9. Comparison of the horizontal displacements in the Y-plan direction measured at the SPEAR building during the s10 earthquake case and the corresponding response estimated from a dynamic analysis using two different FE building models.
Applsci 12 01602 g009
Figure 10. Comparison of the horizontal displacements in the X-plan direction measured at the SPEAR building during the s11 earthquake case and the corresponding response estimated from a dynamic analysis using two different FE building models.
Applsci 12 01602 g010
Figure 11. Comparison of the horizontal displacements in the Y-plan direction measured at the SPEAR building during the s11 earthquake case and the corresponding response estimated from a dynamic analysis using two different FE building models.
Applsci 12 01602 g011
Figure 12. Comparison of the horizontal displacements in the X-plan direction measured at the SPEAR building during the s12 earthquake case and the corresponding response estimated from a dynamic analysis using two different FE building models.
Applsci 12 01602 g012
Figure 13. Comparison of the horizontal displacements in the Y-plan direction measured at the SPEAR building during the s12 earthquake case and the corresponding responses estimated from a dynamic analysis using two different FE building models.
Applsci 12 01602 g013
Table 1. Normalized average axial load and shear strengths of the SPEAR building columns calculated according to the RSA system [30,31,32].
StoryColumnvPlan Direction XPlan Direction Y
Vflex,X
(kN)
Vv,X
(kN)
Va,X
(kN)
Vlap,X
(kN)
Vj,X
(kN)
Vflex,Y
(kN)
Vv,Y
(kN)
Va,Y
(kN)
Vlap,Y
(kN)
Vj,Y
(kN)
1C1,10.0624.5039.3624.5018.1732.6424.5039.3624.5018.1732.64
C2,10.0665.7539.4665.7540.5165.74208.03128.81208.03113.55105.58
C3,10.1028.8050.5828.8022.6036.7728.8050.5828.8022.6036.77
C4,10.1432.4459.6032.4426.3640.2732.4459.6032.4426.3640.27
C5,10.2942.6987.7642.6937.0651.0742.6987.7642.6937.0651.07
C6,10.2338.6079.5038.6032.7946.6538.6079.5038.6032.7946.65
C7,10.0826.3338.9926.3320.0634.4626.3338.9926.3320.0634.46
C8,10.1634.1464.2734.1428.1241.9134.1464.2734.1428.1241.91
C9,10.1835.1467.4335.1429.1843.0435.1467.4335.1429.1843.04
2C1,20.0322.3840.0622.3816.2331.3622.3840.0622.3816.2331.36
C2,20.0459.4939.9559.4934.5263.58189.69130.38189.6995.49102.52
C3,20.0625.5139.4825.5119.4534.4725.5139.4825.5119.4534.47
C4,20.0928.1838.9028.1822.2137.1128.1838.9028.1822.2137.11
C5,20.1837.4070.8137.4031.7045.7537.4070.8137.4031.7045.75
C6,20.1433.5060.3333.5027.6842.0933.5060.3333.5027.6842.09
C7,20.0523.7139.6723.7117.6332.7923.7139.6723.7117.6332.79
C8,20.1029.7051.3829.7023.7638.4729.7051.3829.7023.7638.47
C9,20.1130.2852.7430.2824.3839.1030.2852.7430.2824.3839.10
3C1,30.0119.7940.3519.7913.4028.0619.7940.3519.7913.4028.06
C2,30.0252.1040.2552.1026.5357.29167.86131.36167.8671.9592.84
C3,30.0321.3639.9721.3615.0329.7621.3639.9721.3615.0329.76
C4,30.0422.7639.7822.7616.4631.1522.7639.7822.7616.4631.15
C5,30.1130.0453.0630.0423.9438.2130.0453.0630.0423.9438.21
C6,30.0826.5039.0226.5020.3134.9026.5039.0226.5020.3134.90
C7,30.0220.4140.1620.4114.0428.7620.4140.1620.4114.0428.76
C8,30.0624.3239.4024.3218.0732.7824.3239.4024.3218.0732.78
C9,30.0524.1739.5924.1717.8932.5224.1739.5924.1717.8932.52
Table 2. Moment-Rotation relationships used in the zero-length elements of the SPEAR FE building model. Note: Symbols (-) indicate that brittle fracture was not considered and (;) separate values between the X and Y directions.
StoryColumnMv,X
Mv,Y
(kN-m)
θ0.005r_v,X
θ0.005r_v,Y
(rad)
Ma,X
Ma,Y
(kN-m)
θ0.005r_a,X
θ0.005r_a,Y
(rad)
Mlap,X
Mlap,Y
(kN-m)
θ0.005r_lap,X
θ0.005r_lap,Y
(rad)
Mj,X
Mj,Y
(kN-m)
θ0.005r_j,X
θ0.005r_j,Y
(rad)
1C1,1----22.710.0037--
C2,149.33
;
161.01
0.0030
;
0.0031
-
;
-
-
;
-
50.64
;
141.94
0.0031
;
0.0027
-
;
131.98
-
;
0.0025
C3,1----28.250.0039--
C4,1----32.950.0041--
C5,1----46.330.0043--
C6,1----40.990.0042--
C7,1----25.070.0038--
C8,1----35.150.0041--
C9,1----36.470.0042--
2C1,2----20.290.0036--
C2,249.94
;
162.98
0.0034
;
0.0034
-
;
-
-
;
-
43.15
;
119.36
0.0029
;
0.0025
-
;
128.15
-
;
0.0027
C3,2----24.310.0038--
C4,2----27.770.0039--
C5,2----39.630.0042--
C6,2----34.600.0041--
C7,2----22.040.0037--
C8,2----29.700.0040--
C9,2----30.470.0040--
3C1,3----16.750.0034--
C2,350.32
;
164.20
0.0039
;
0.0039
-
;
-
-
;
-
33.16
;
89.94
0.0025
;
0.0021
-
;
116.04
-
;
0.0028
C3,3----18.780.0035--
C4,3----20.570.0036--
C5,3----29.930.0040--
C6,3----25.390.0038--
C7,3----17.550.0034--
C8,3----22.590.0037--
C9,3----22.360.0037--
Table 3. Peak floor displacements and inter-story drifts in the two plan directions of the SPEAR building were obtained from the test and the analyses (ID = Inter-story drift; FD = Floor Displacement).
Analysis CasePlanStoryStory
No.
Test ResultsFE Model–All MechanismsFE Model–Flexure Only
Time (s) at Peak FDPeak ID
× 103 rad
Time (s) at Peak IDTime (s) at Peak FDPeak ID
× 103 rad
Time (s) at Peak IDTime (s) at Peak FDPeak ID
× 103 rad
Time (s) at Peak ID
s10X15.170.5915.175.100.3855.1012.031.04912.03
25.171.1275.165.100.5445.1112.051.33512.06
35.150.9435.145.110.4875.1112.070.93712.13
Y14.860.6744.863.070.2793.0711.010.89911.01
24.491.0284.493.070.3584.4711.011.32411.01
34.820.9526.633.070.2675.8711.011.0544.61
s11X111.415.02611.4111.525.90411.524.813.8124.81
212.1212.05212.1312.2811.48712.274.823.7315.19
312.168.05413.0212.278.76212.254.832.5115.19
Y113.113.87713.1111.795.29411.793.133.2523.13
213.096.64813.044.598.3194.633.143.9753.15
313.006.0766.024.658.7164.693.142.8493.16
s12X110.138.19710.1310.846.72310.844.835.5954.83
210.9219.02210.9510.8710.30810.914.845.1407.82
310.9711.93111.0412.3915.16412.464.853.0317.81
Y111.8010.18511.803.175.7603.175.914.9855.91
211.8815.73711.924.6310.7504.665.925.8325.92
311.9010.85711.964.7514.6134.785.923.8955.94
Publisher’s Note: MDPI stays neutral with regard to jurisdictional claims in published maps and institutional affiliations.

