
Seismic Analysis Method for Underground Structure in Loess Area Based on the Modified Displacement-Based Method


Abstract
:1. Introduction
2. Seismic Calculation Method and Important Calculation Parameters of Subway Underground Structures
2.1. FBM
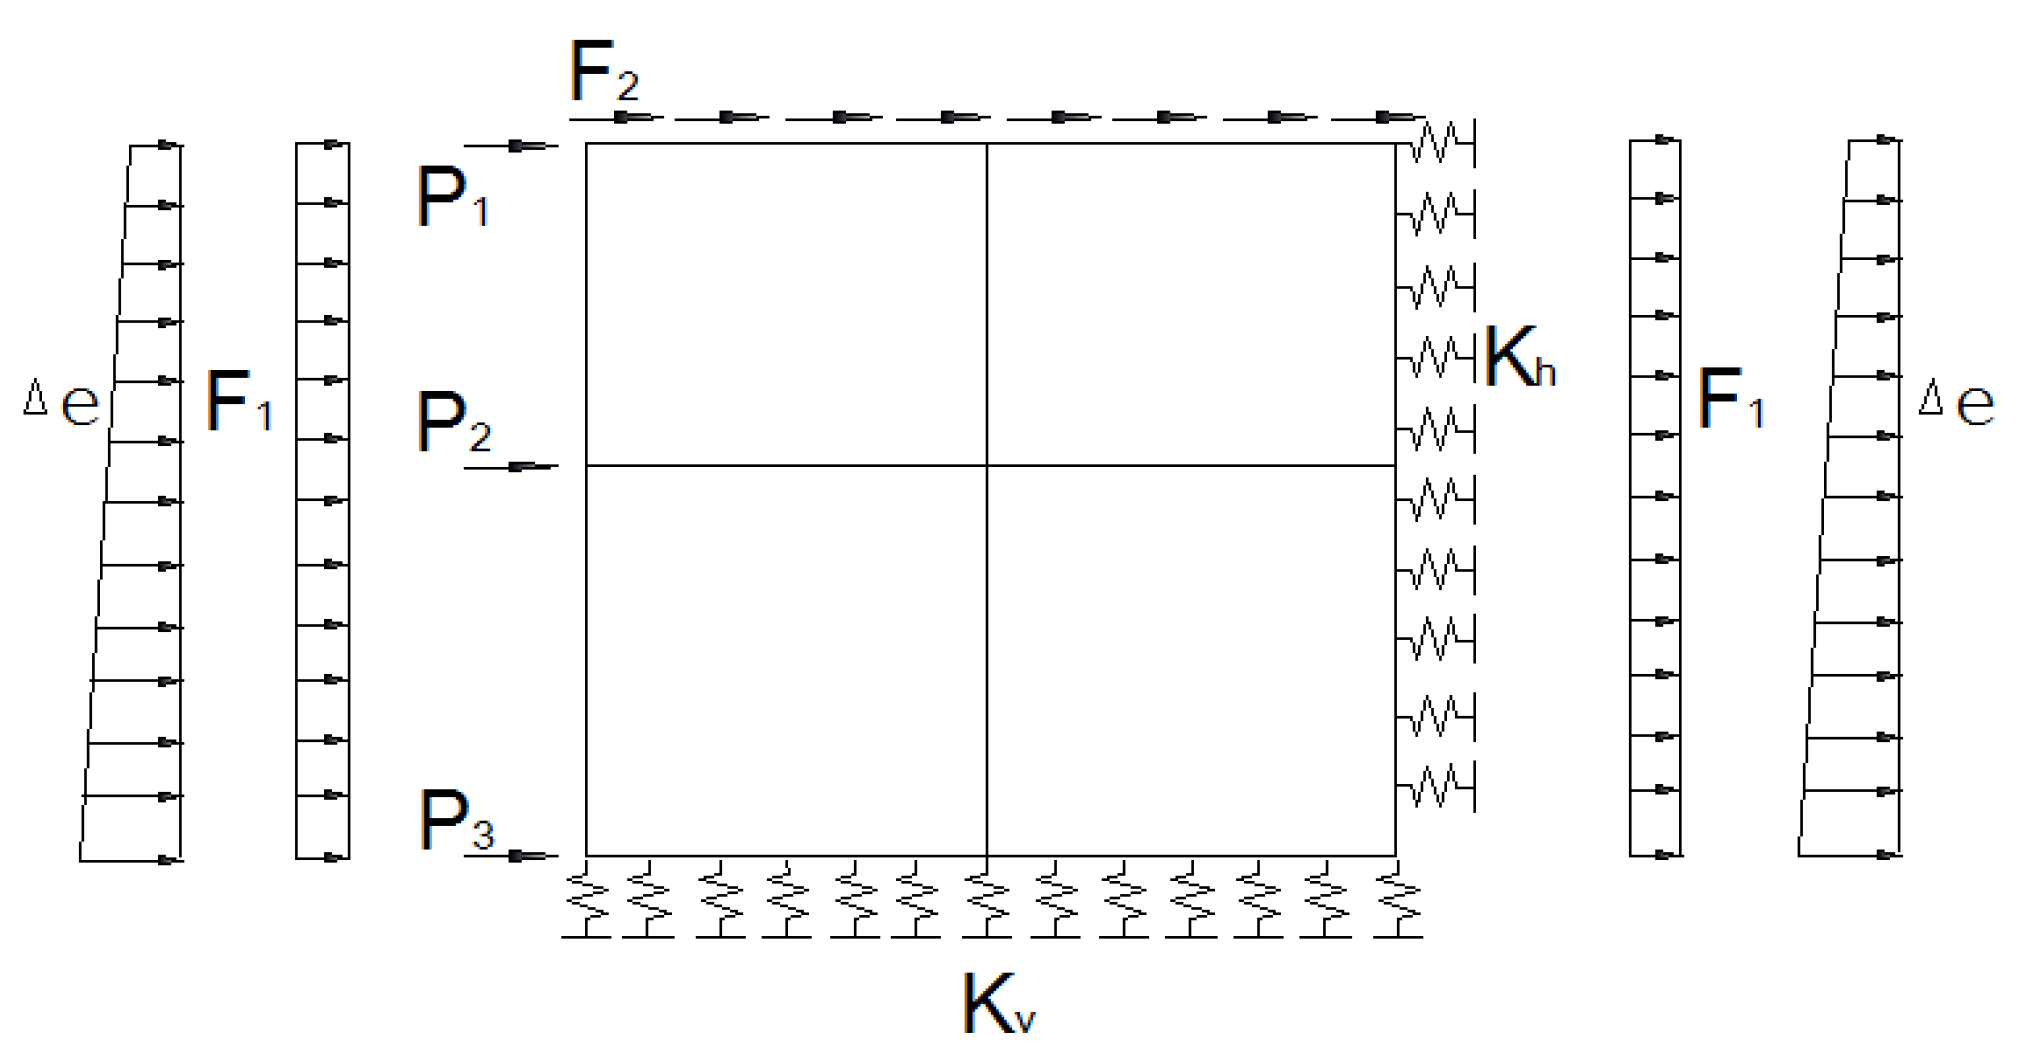
2.2. DBM
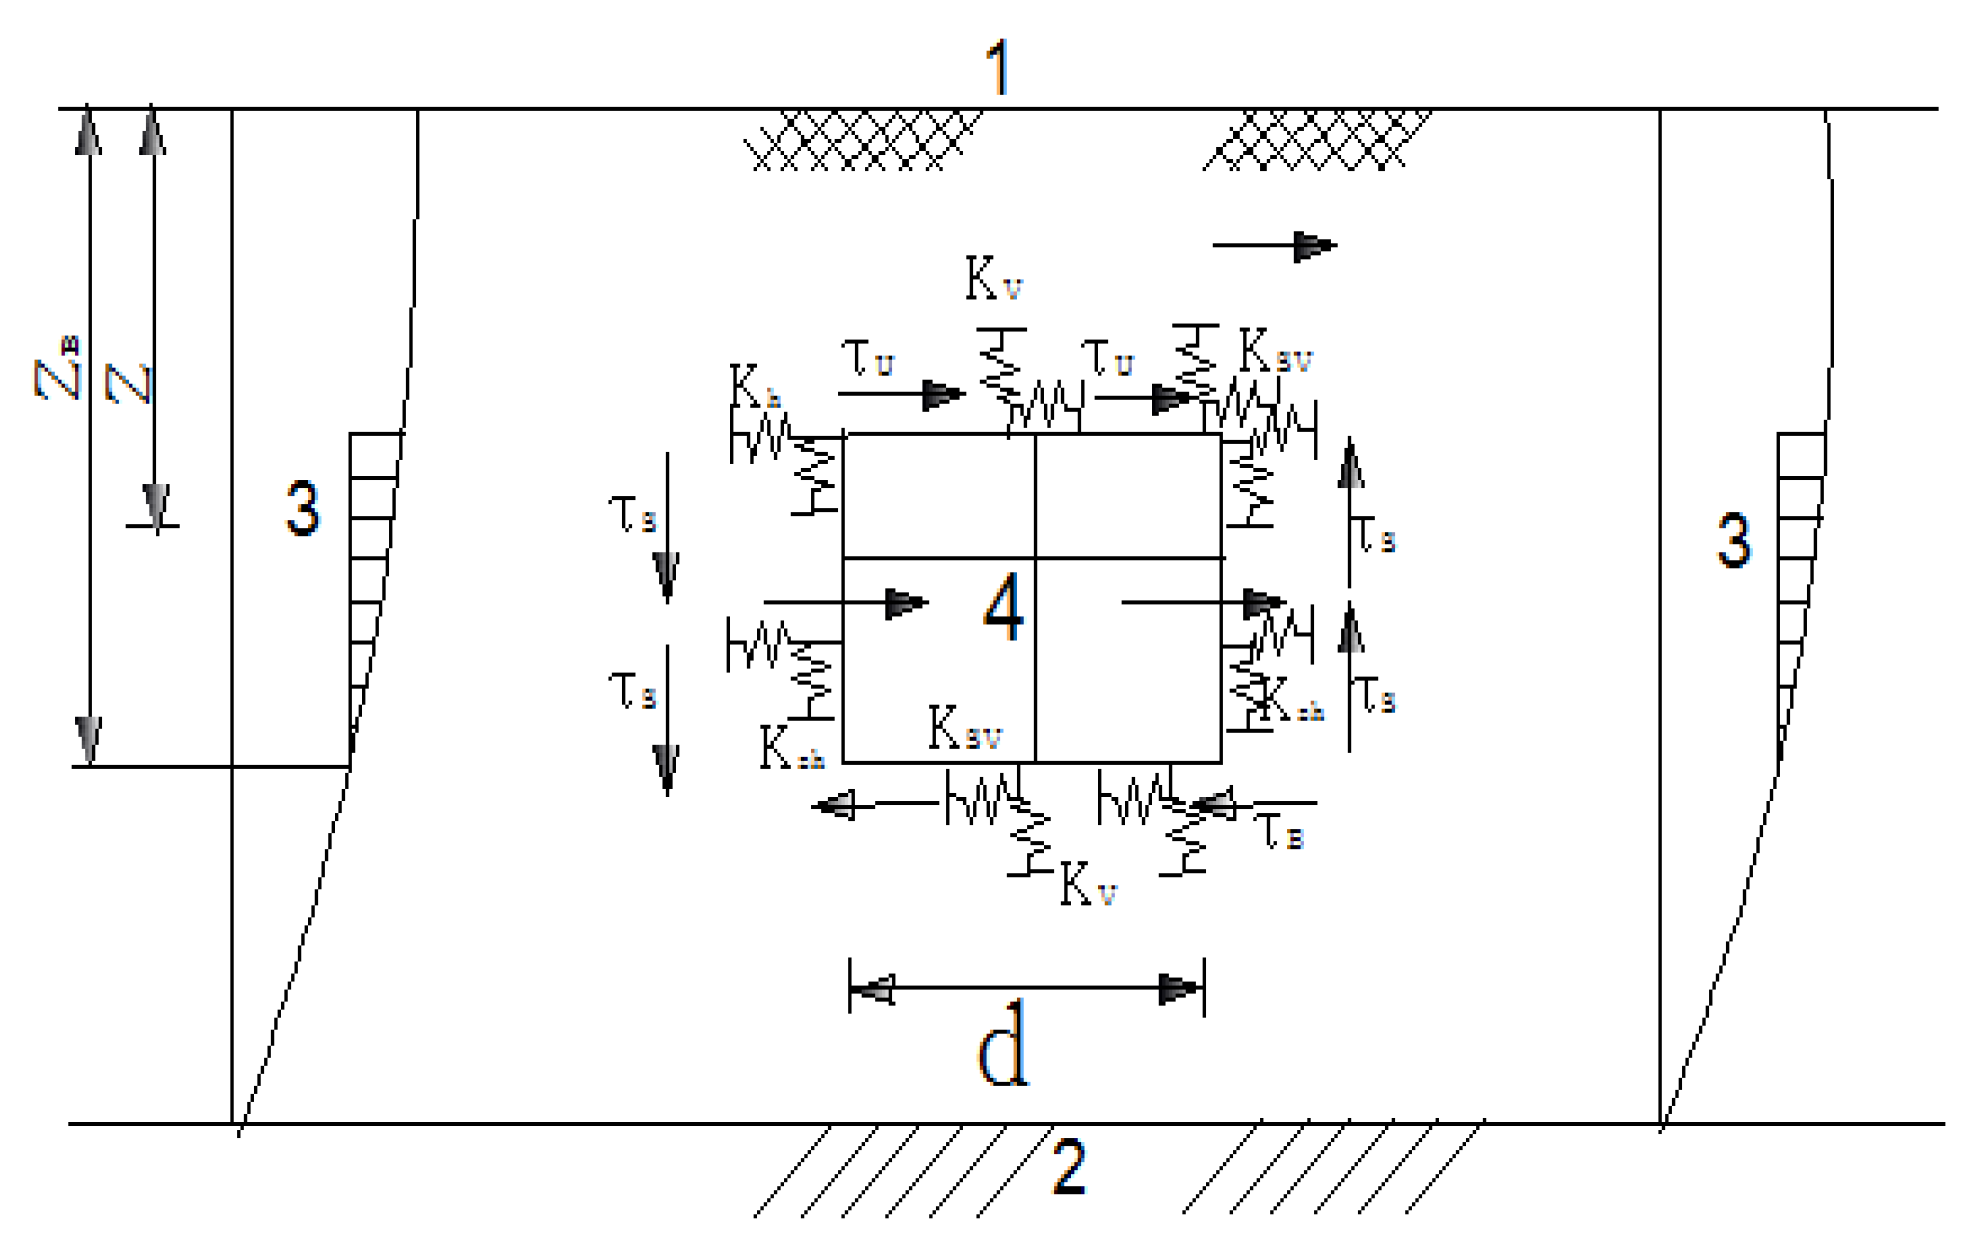
2.3. DESANM
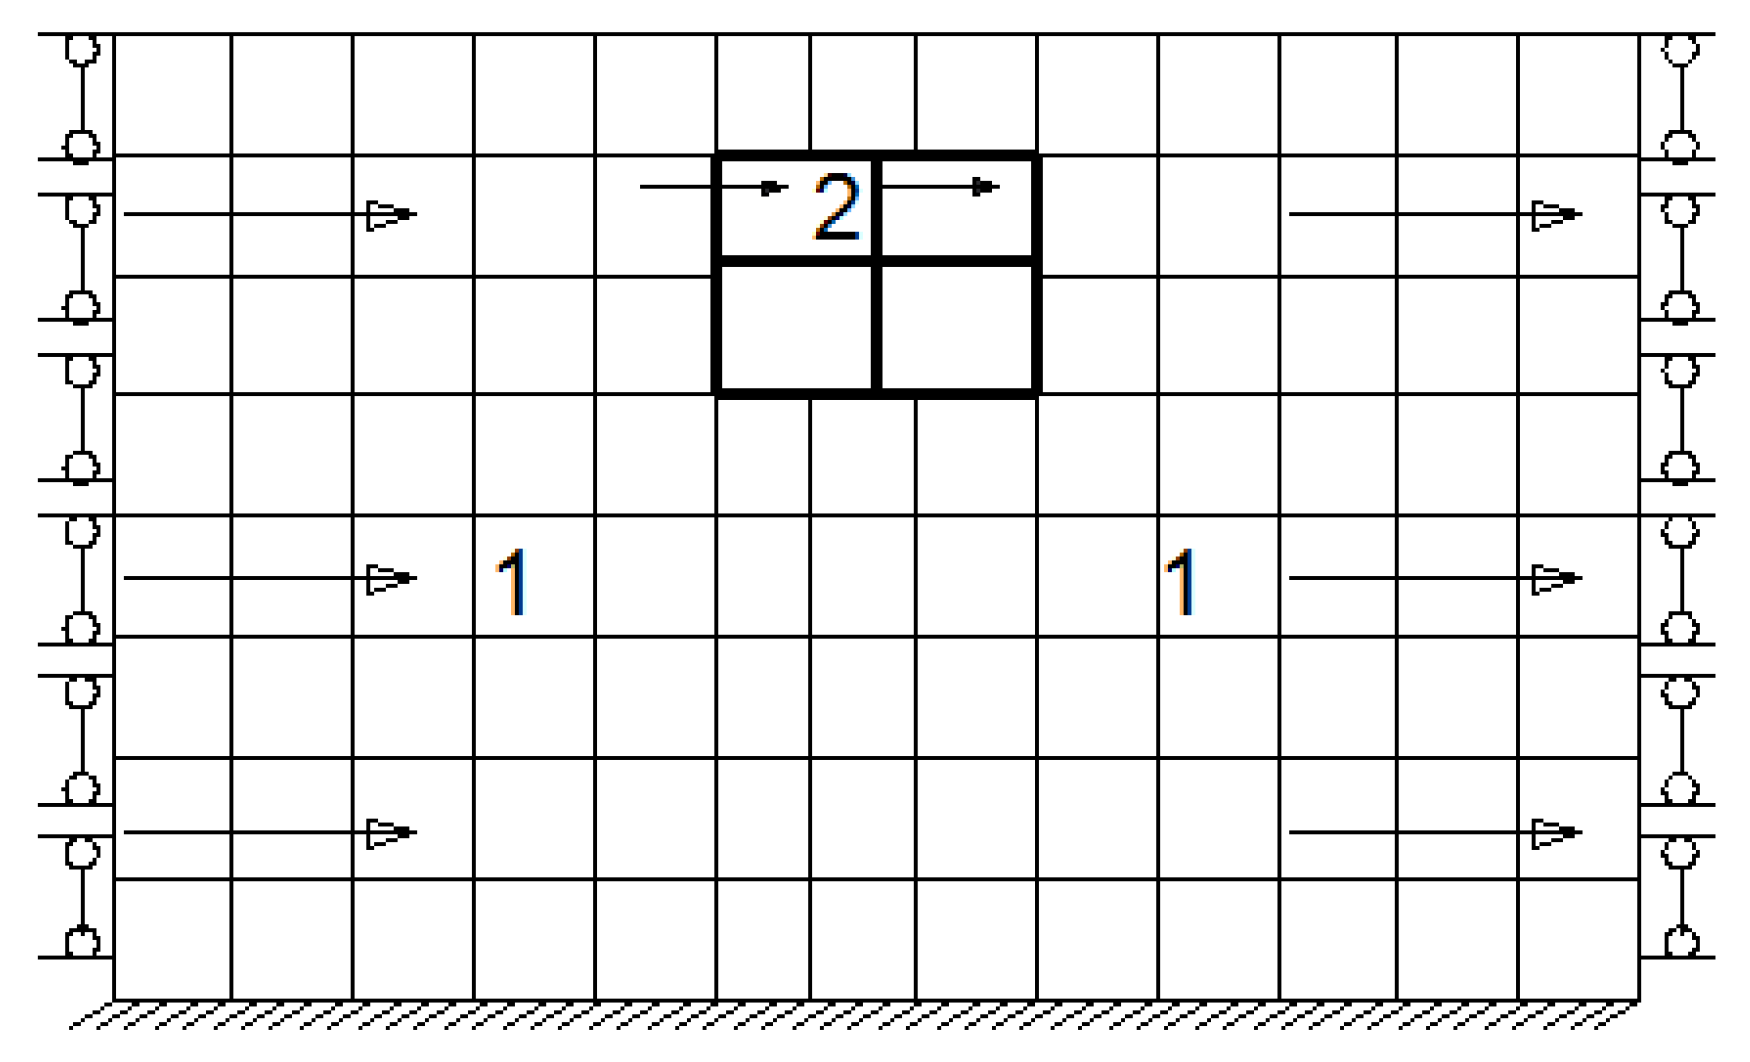
2.4. FDTHA
2.5. Important Calculation Parameters
- (1)
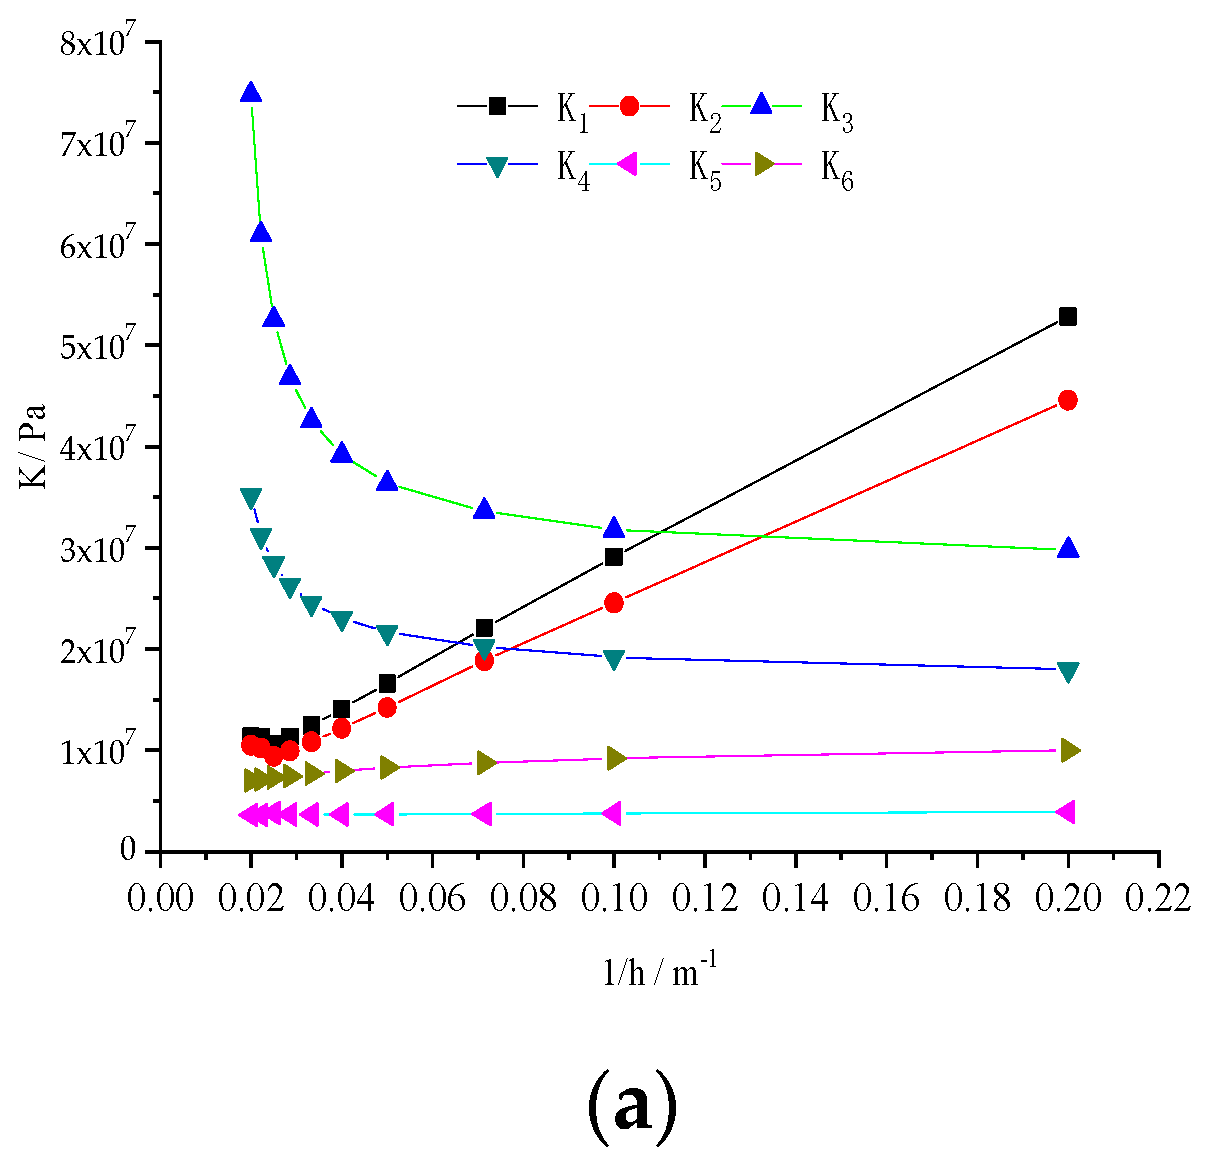
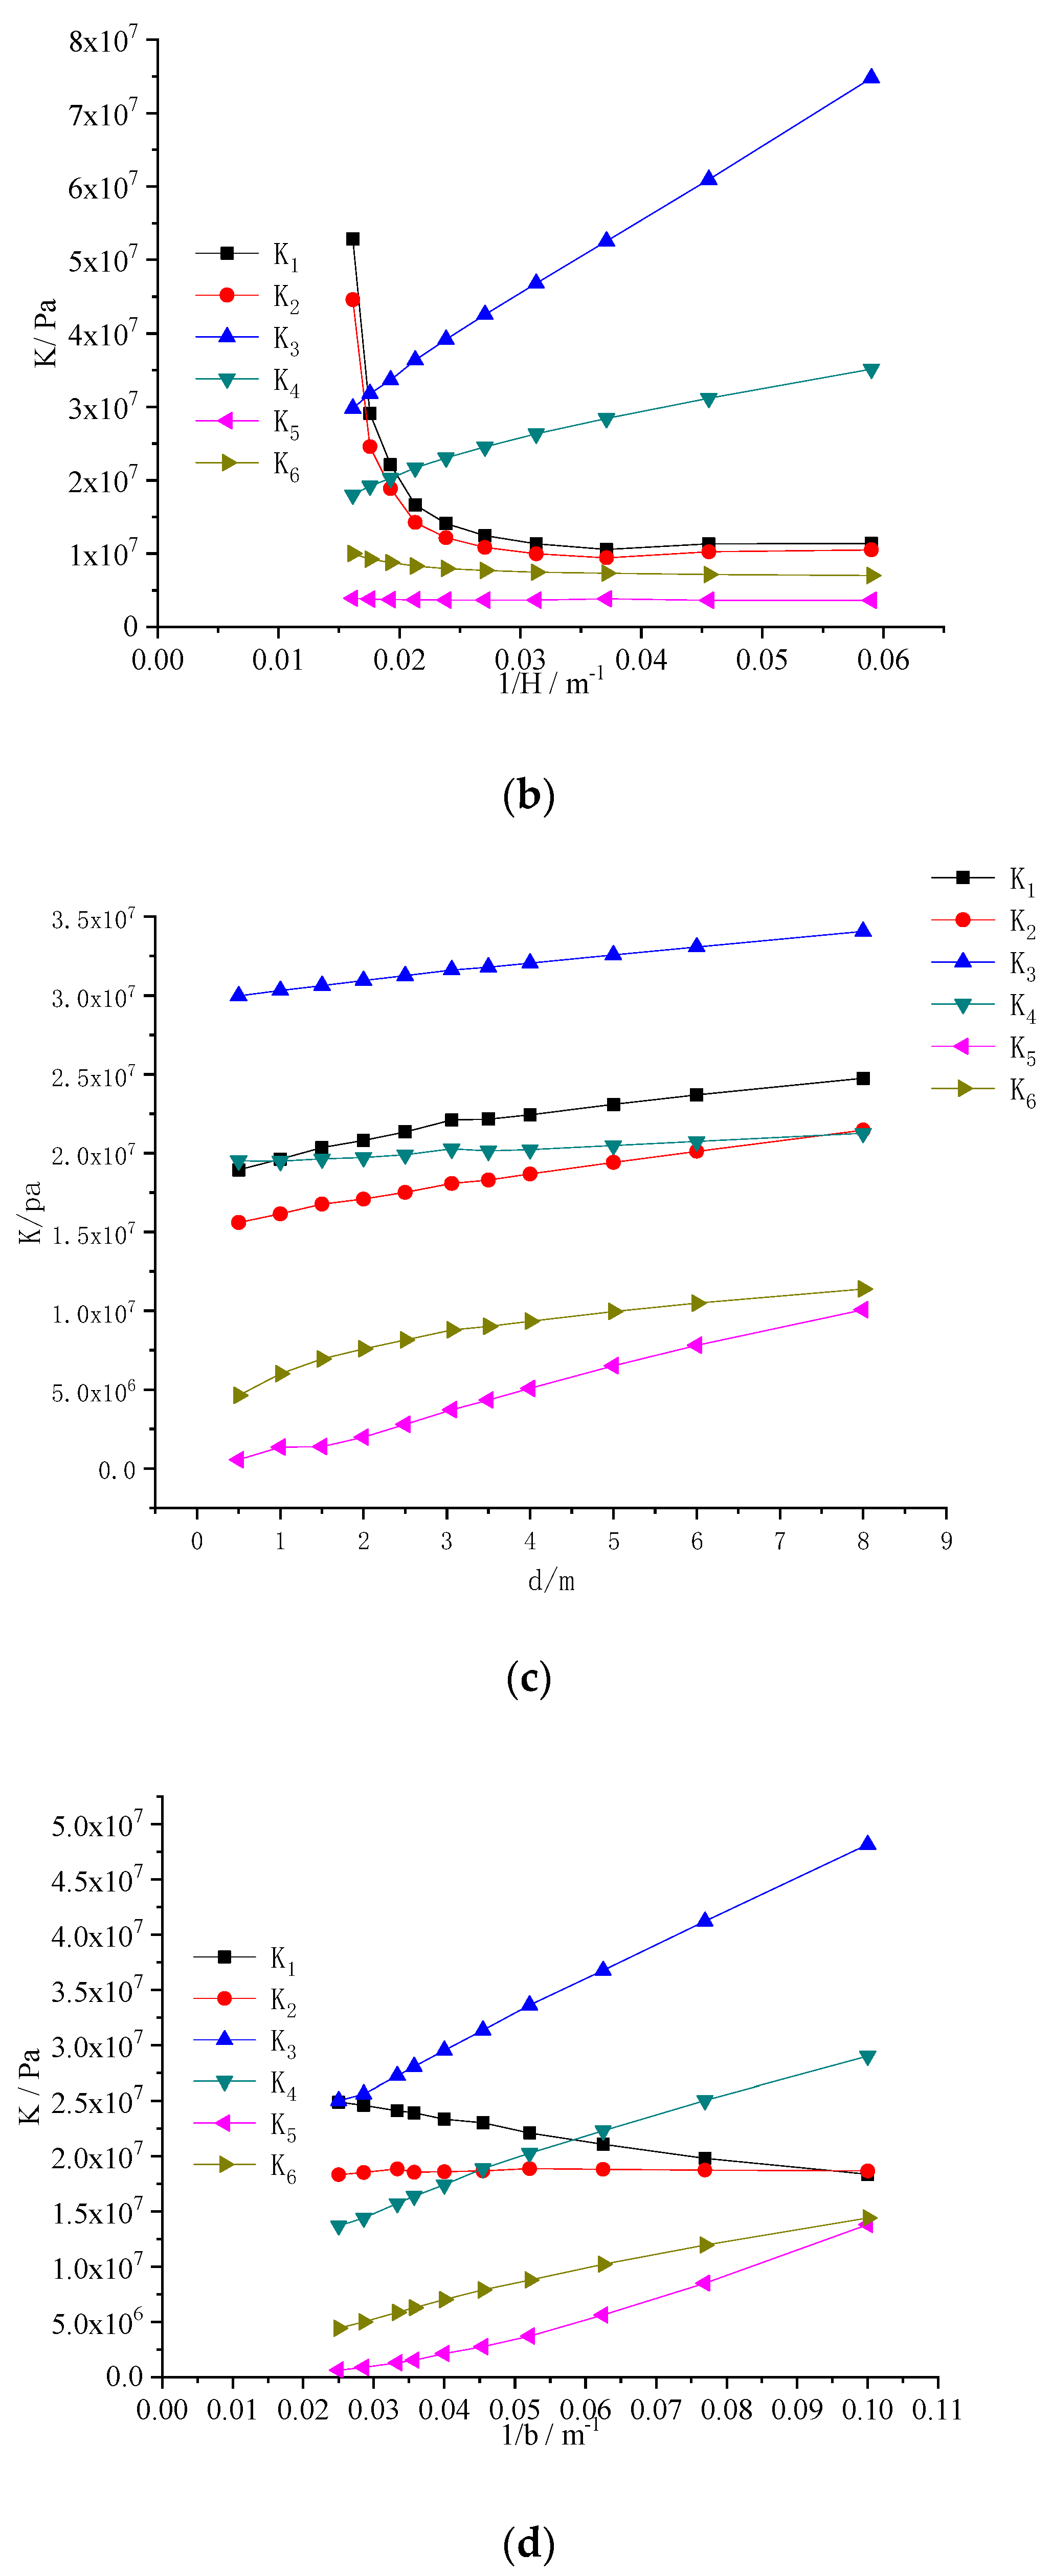
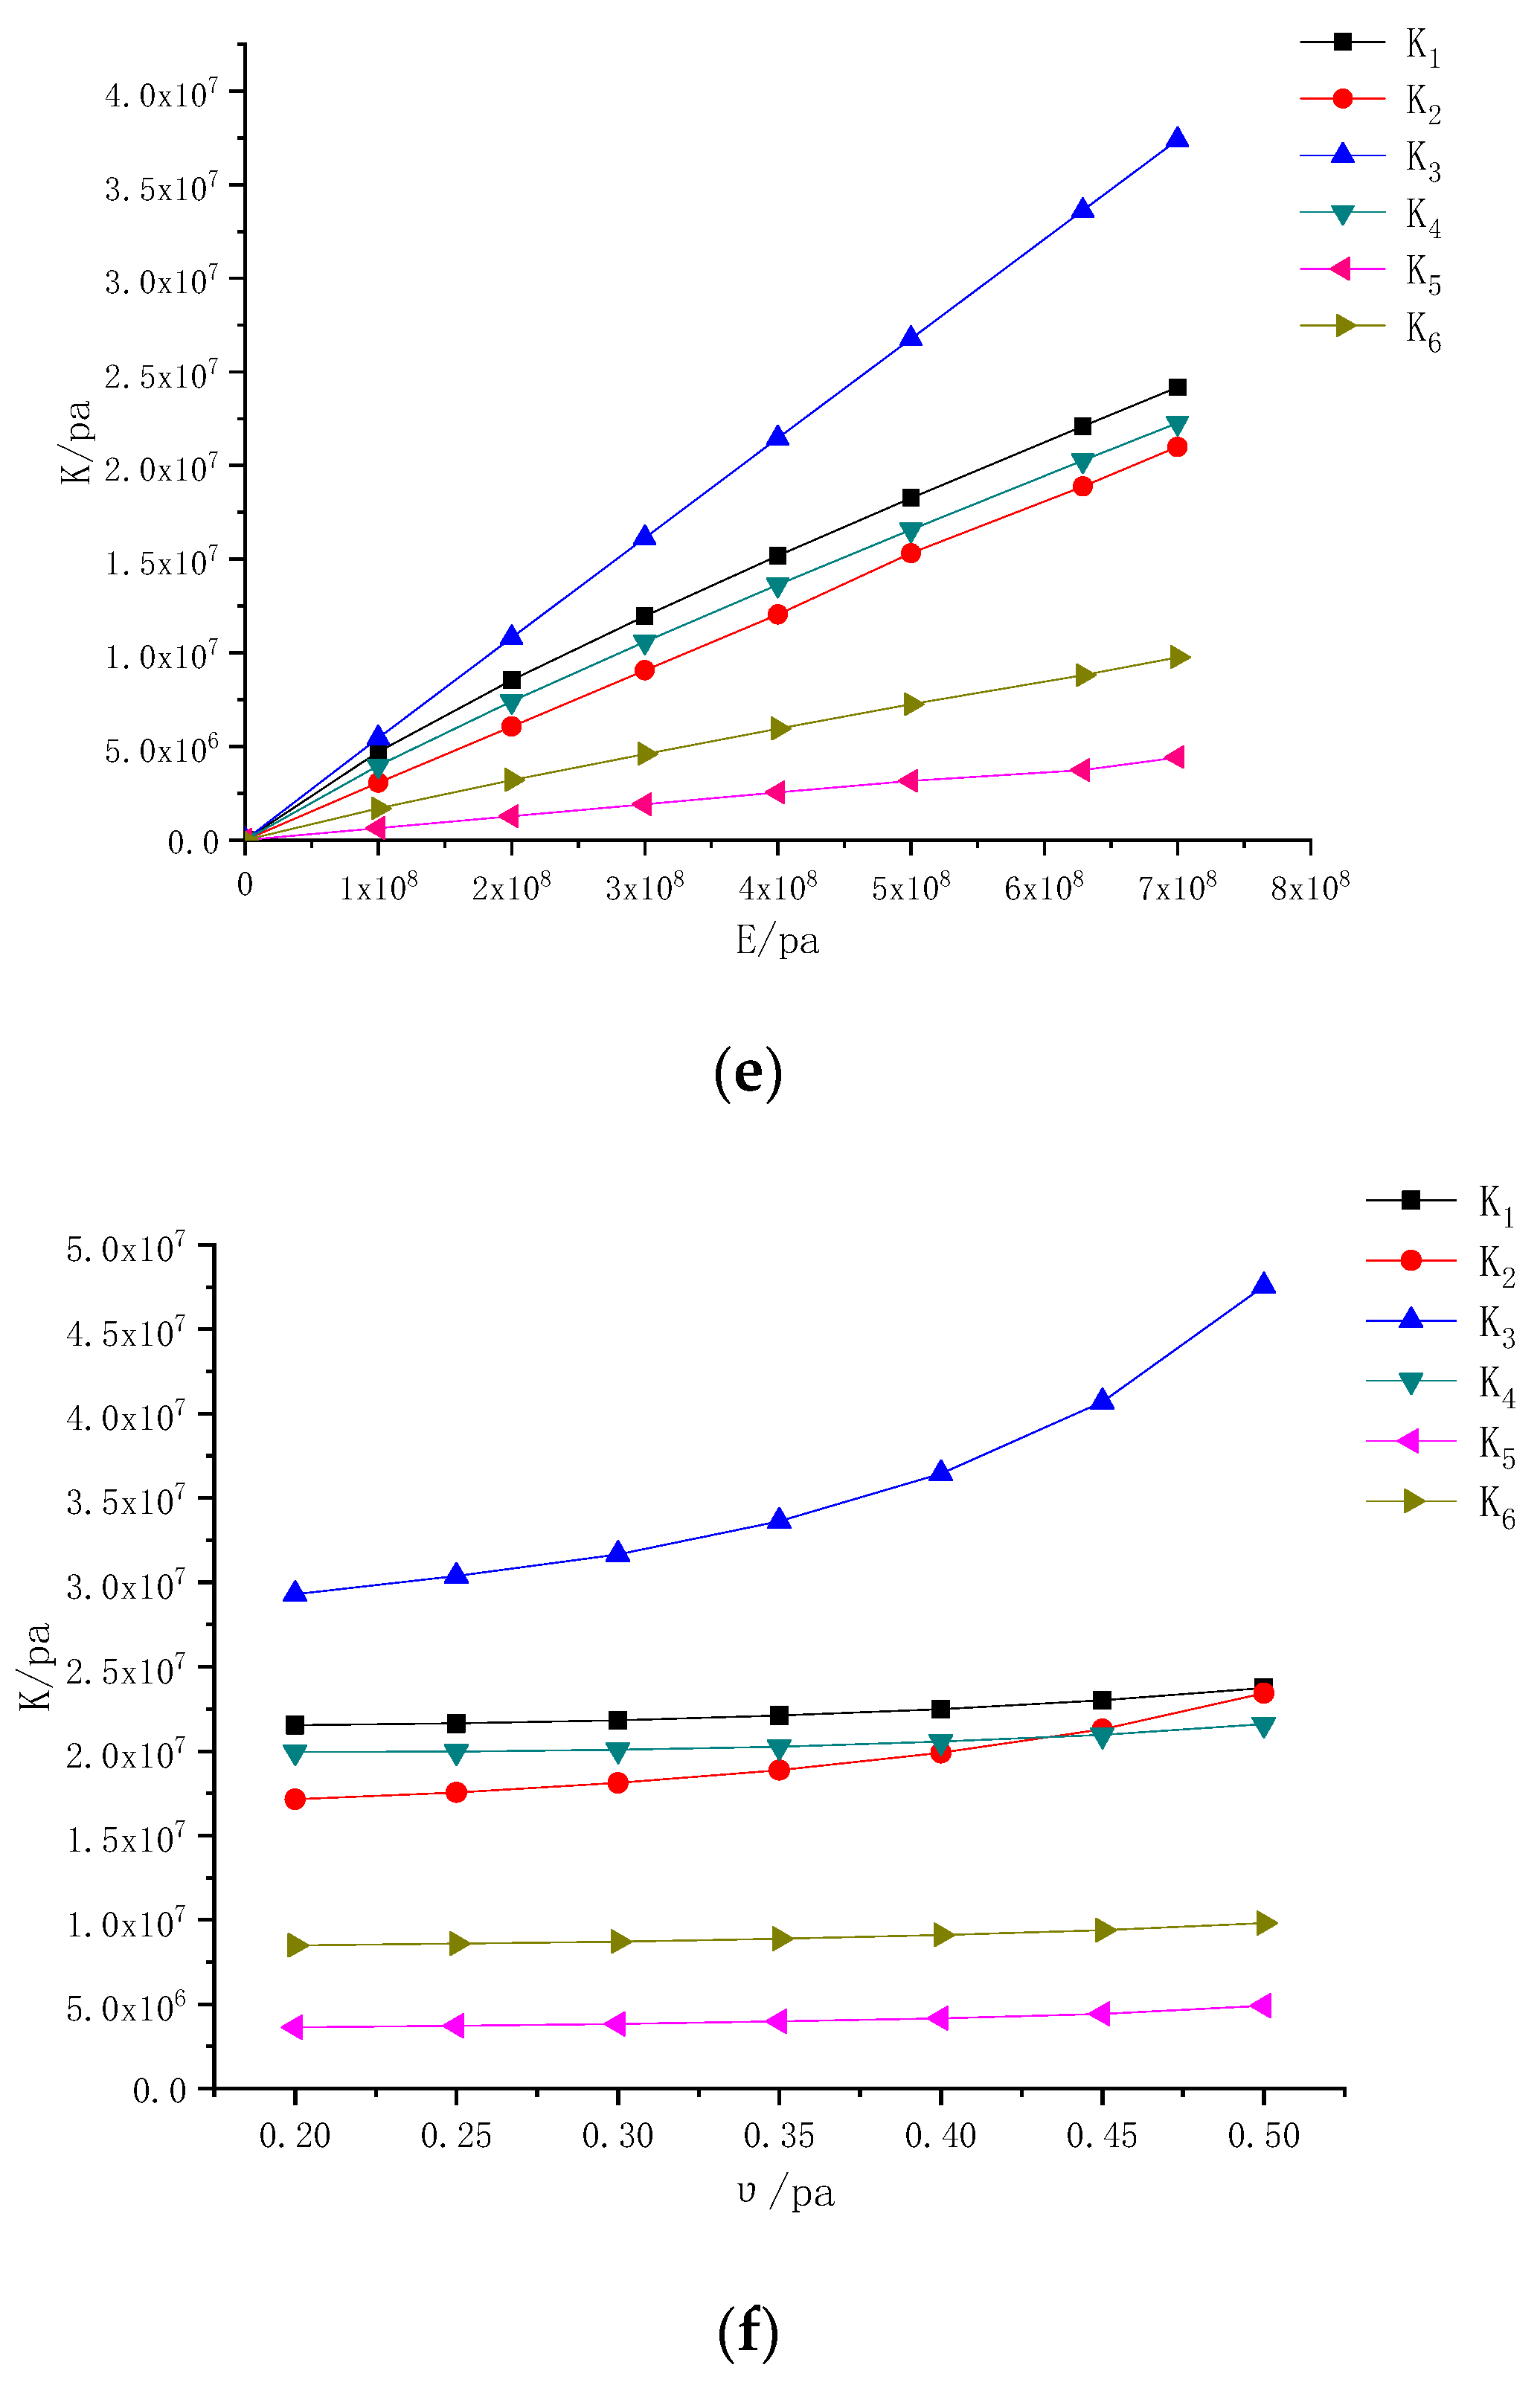
- Foundation Spring Stiffness
- (2)
- Horizontal Relative Displacement of Strata in a Loess Area
3. Experiment and Simulation
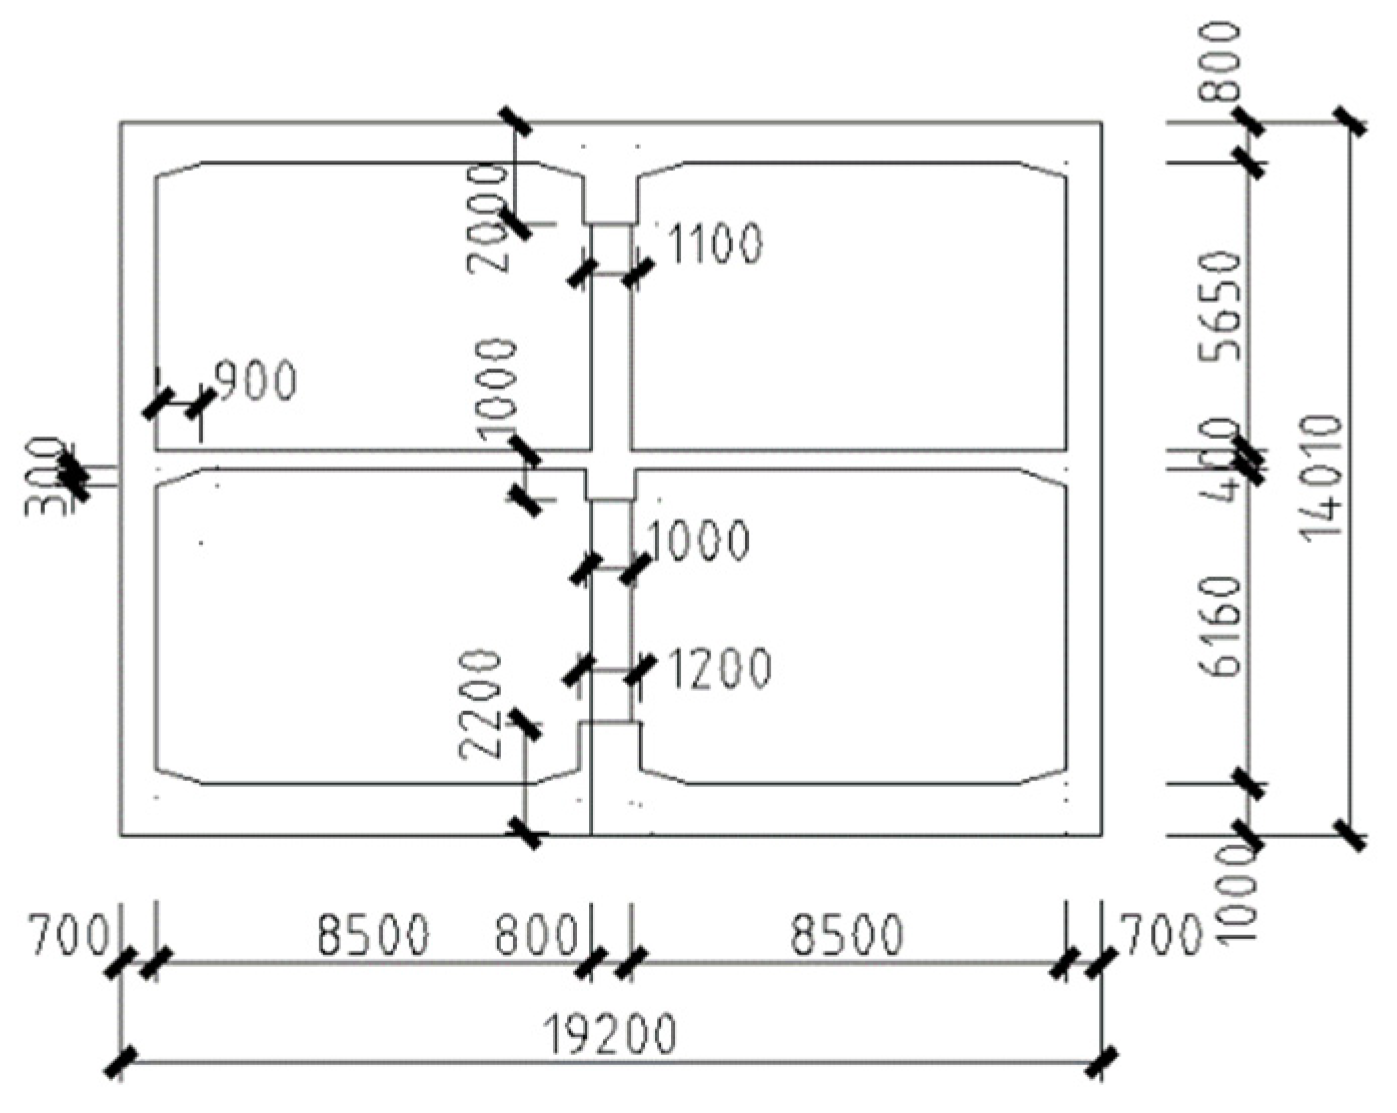
3.1. Background to the Experiment
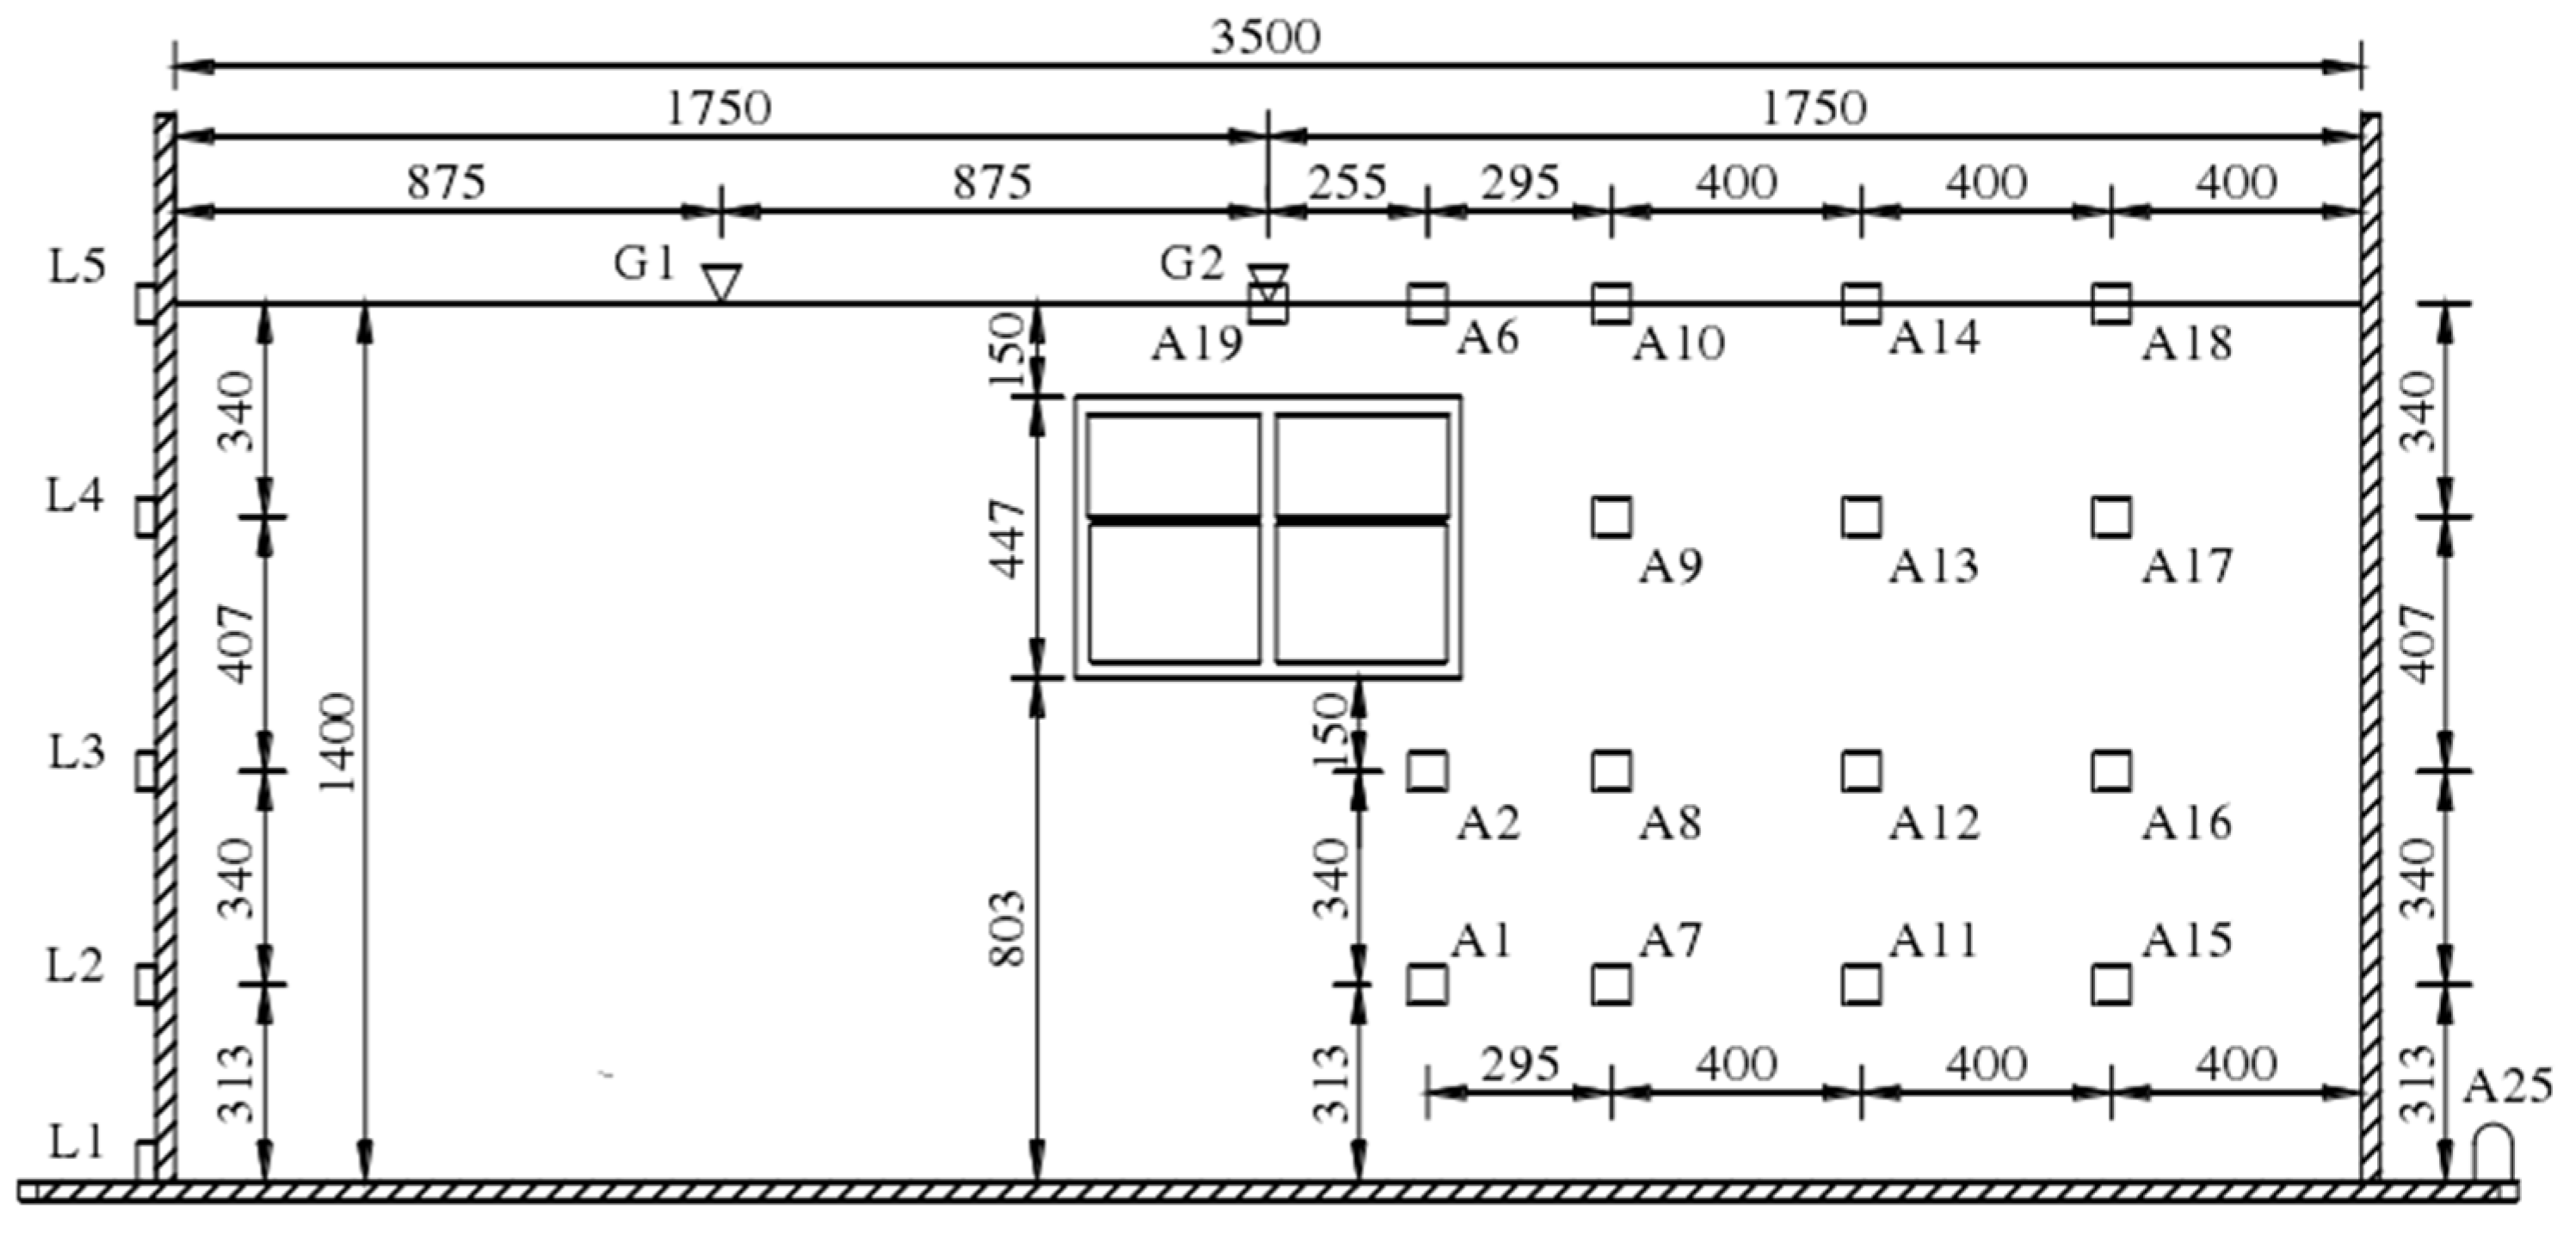
3.2. Shaking-Table TEST Scheme
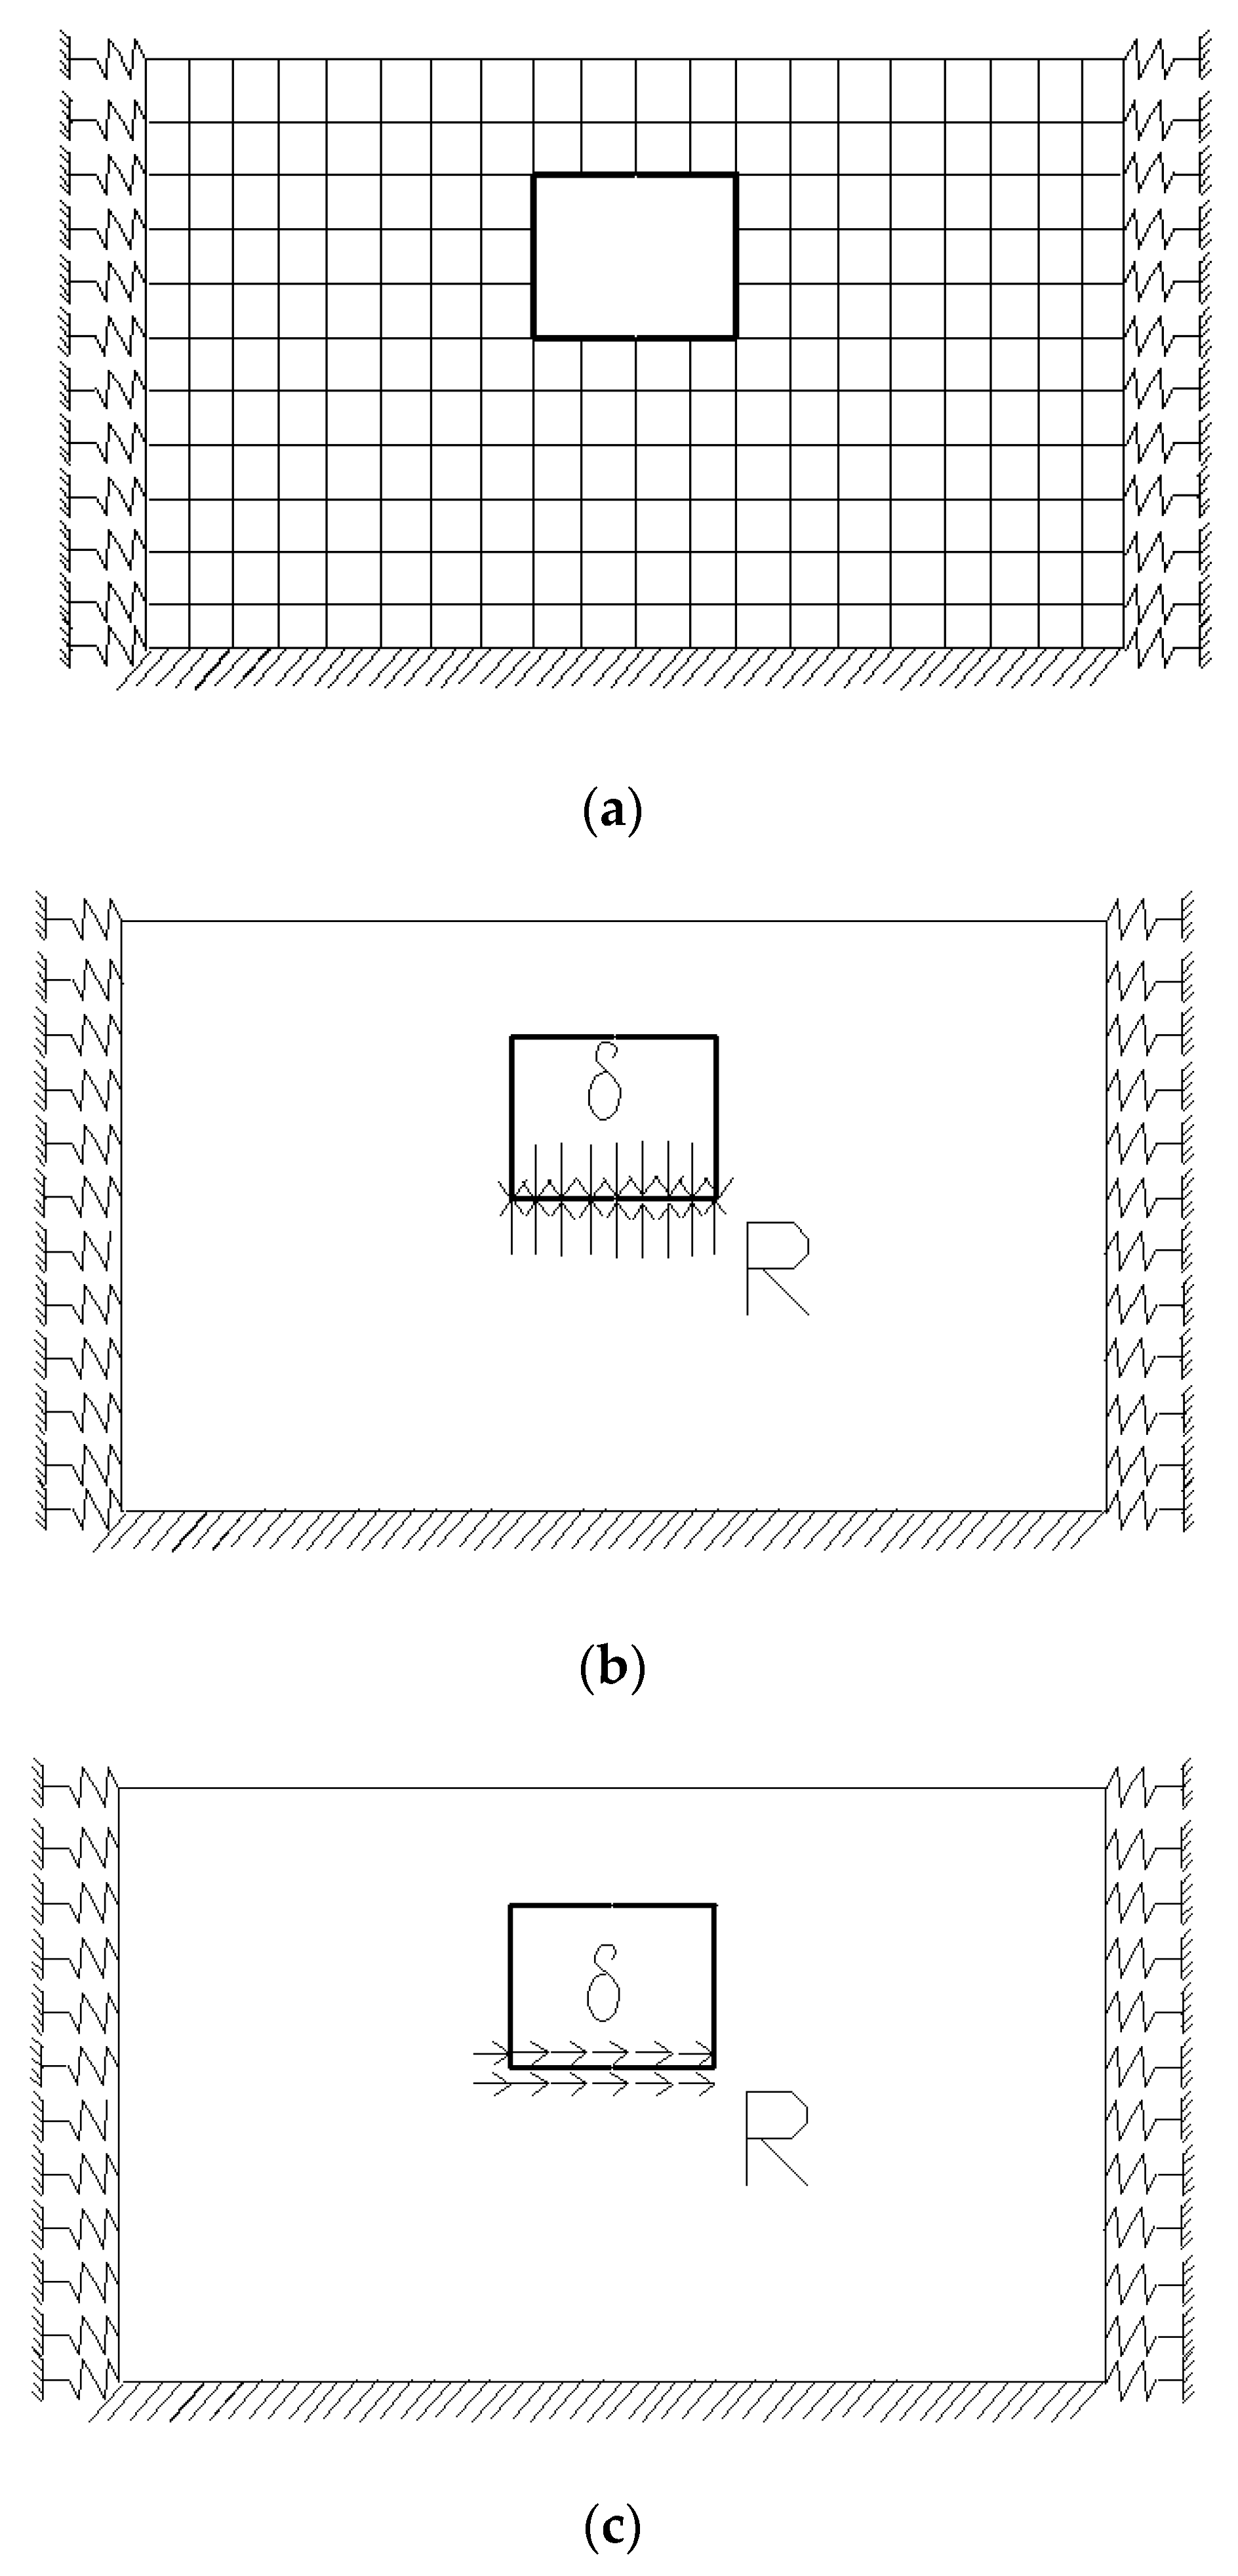
3.3. FDTHA Modeling
4. Results
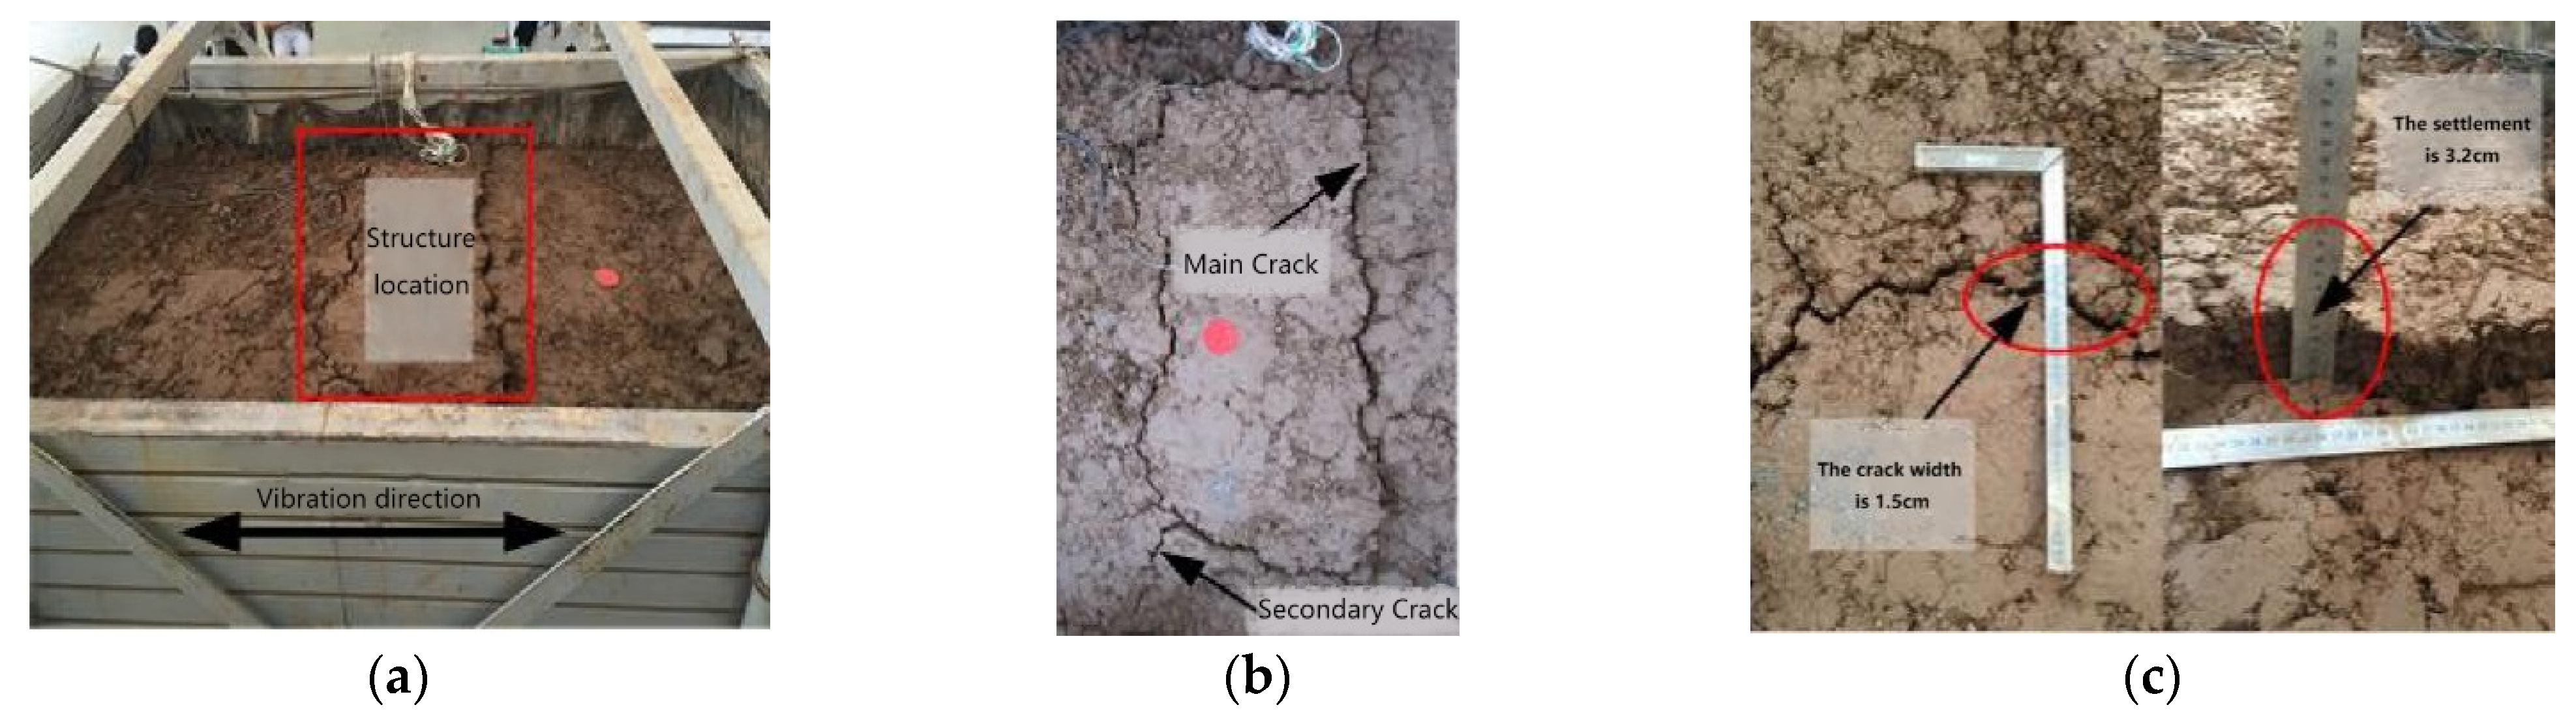
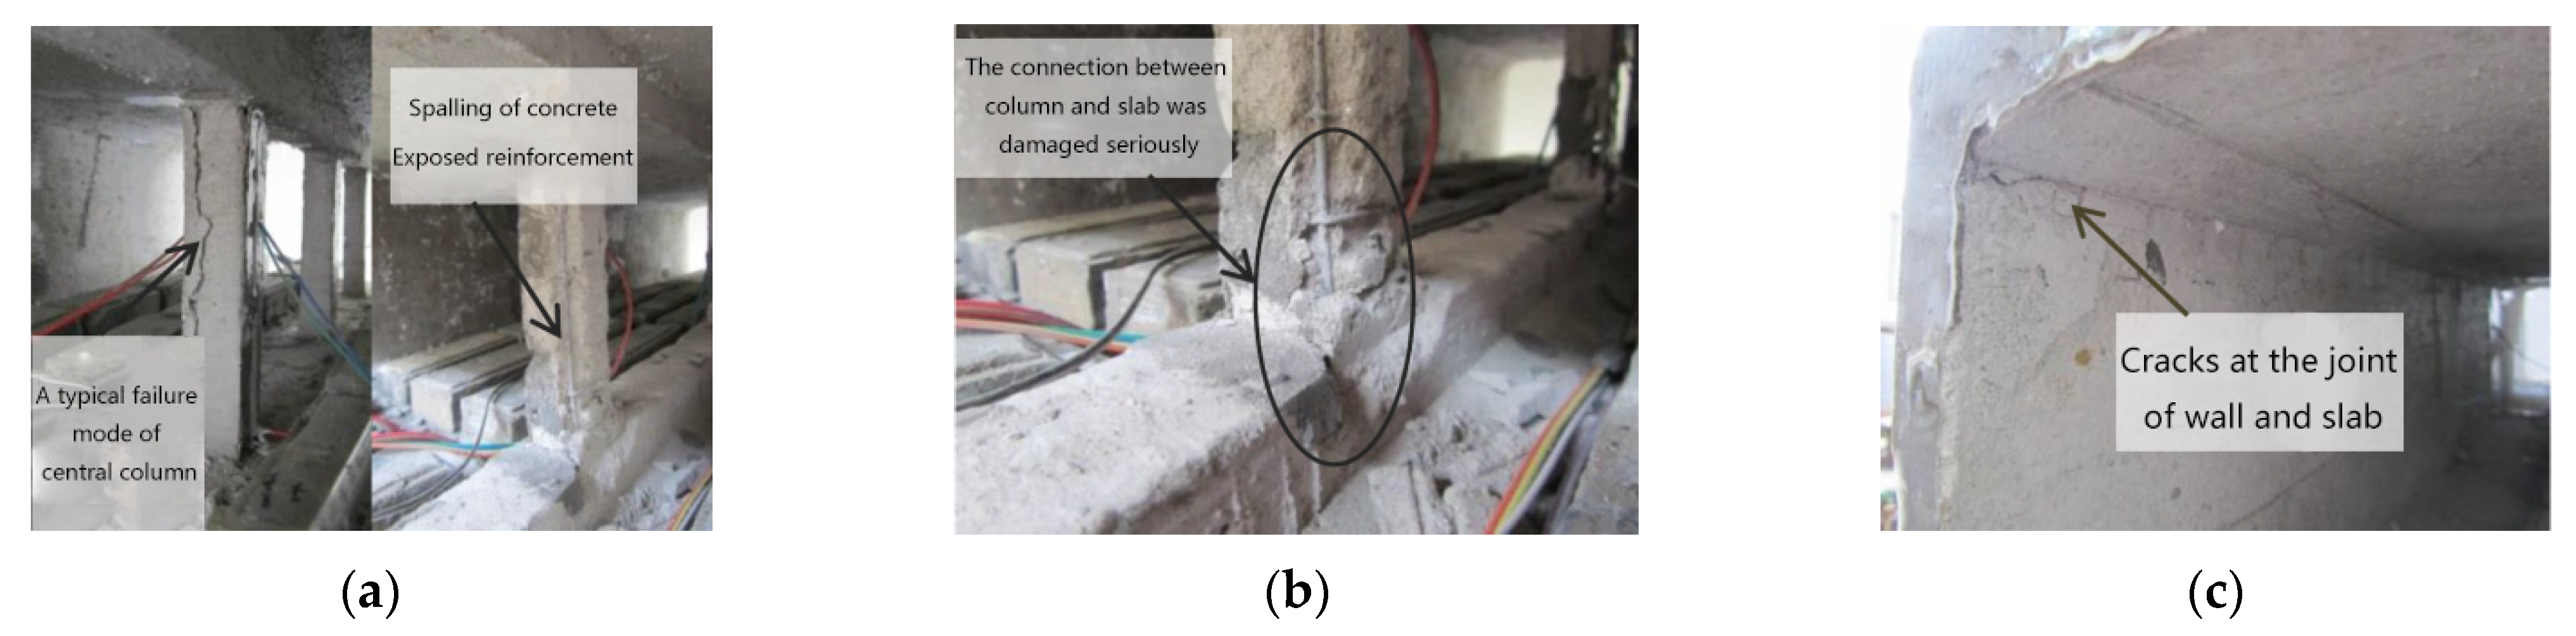
4.1. Earthquake Damage
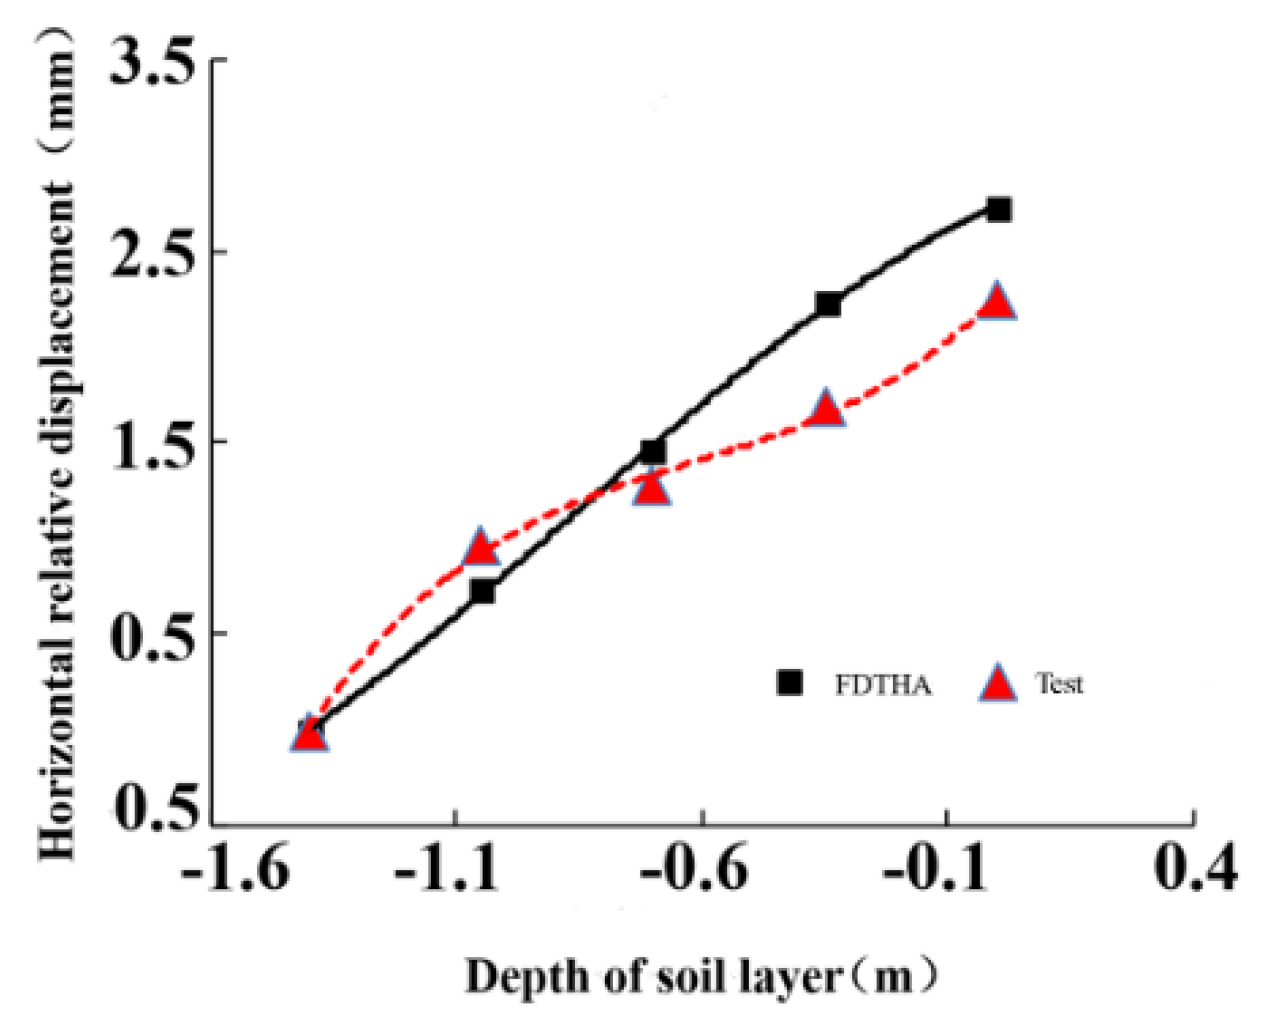
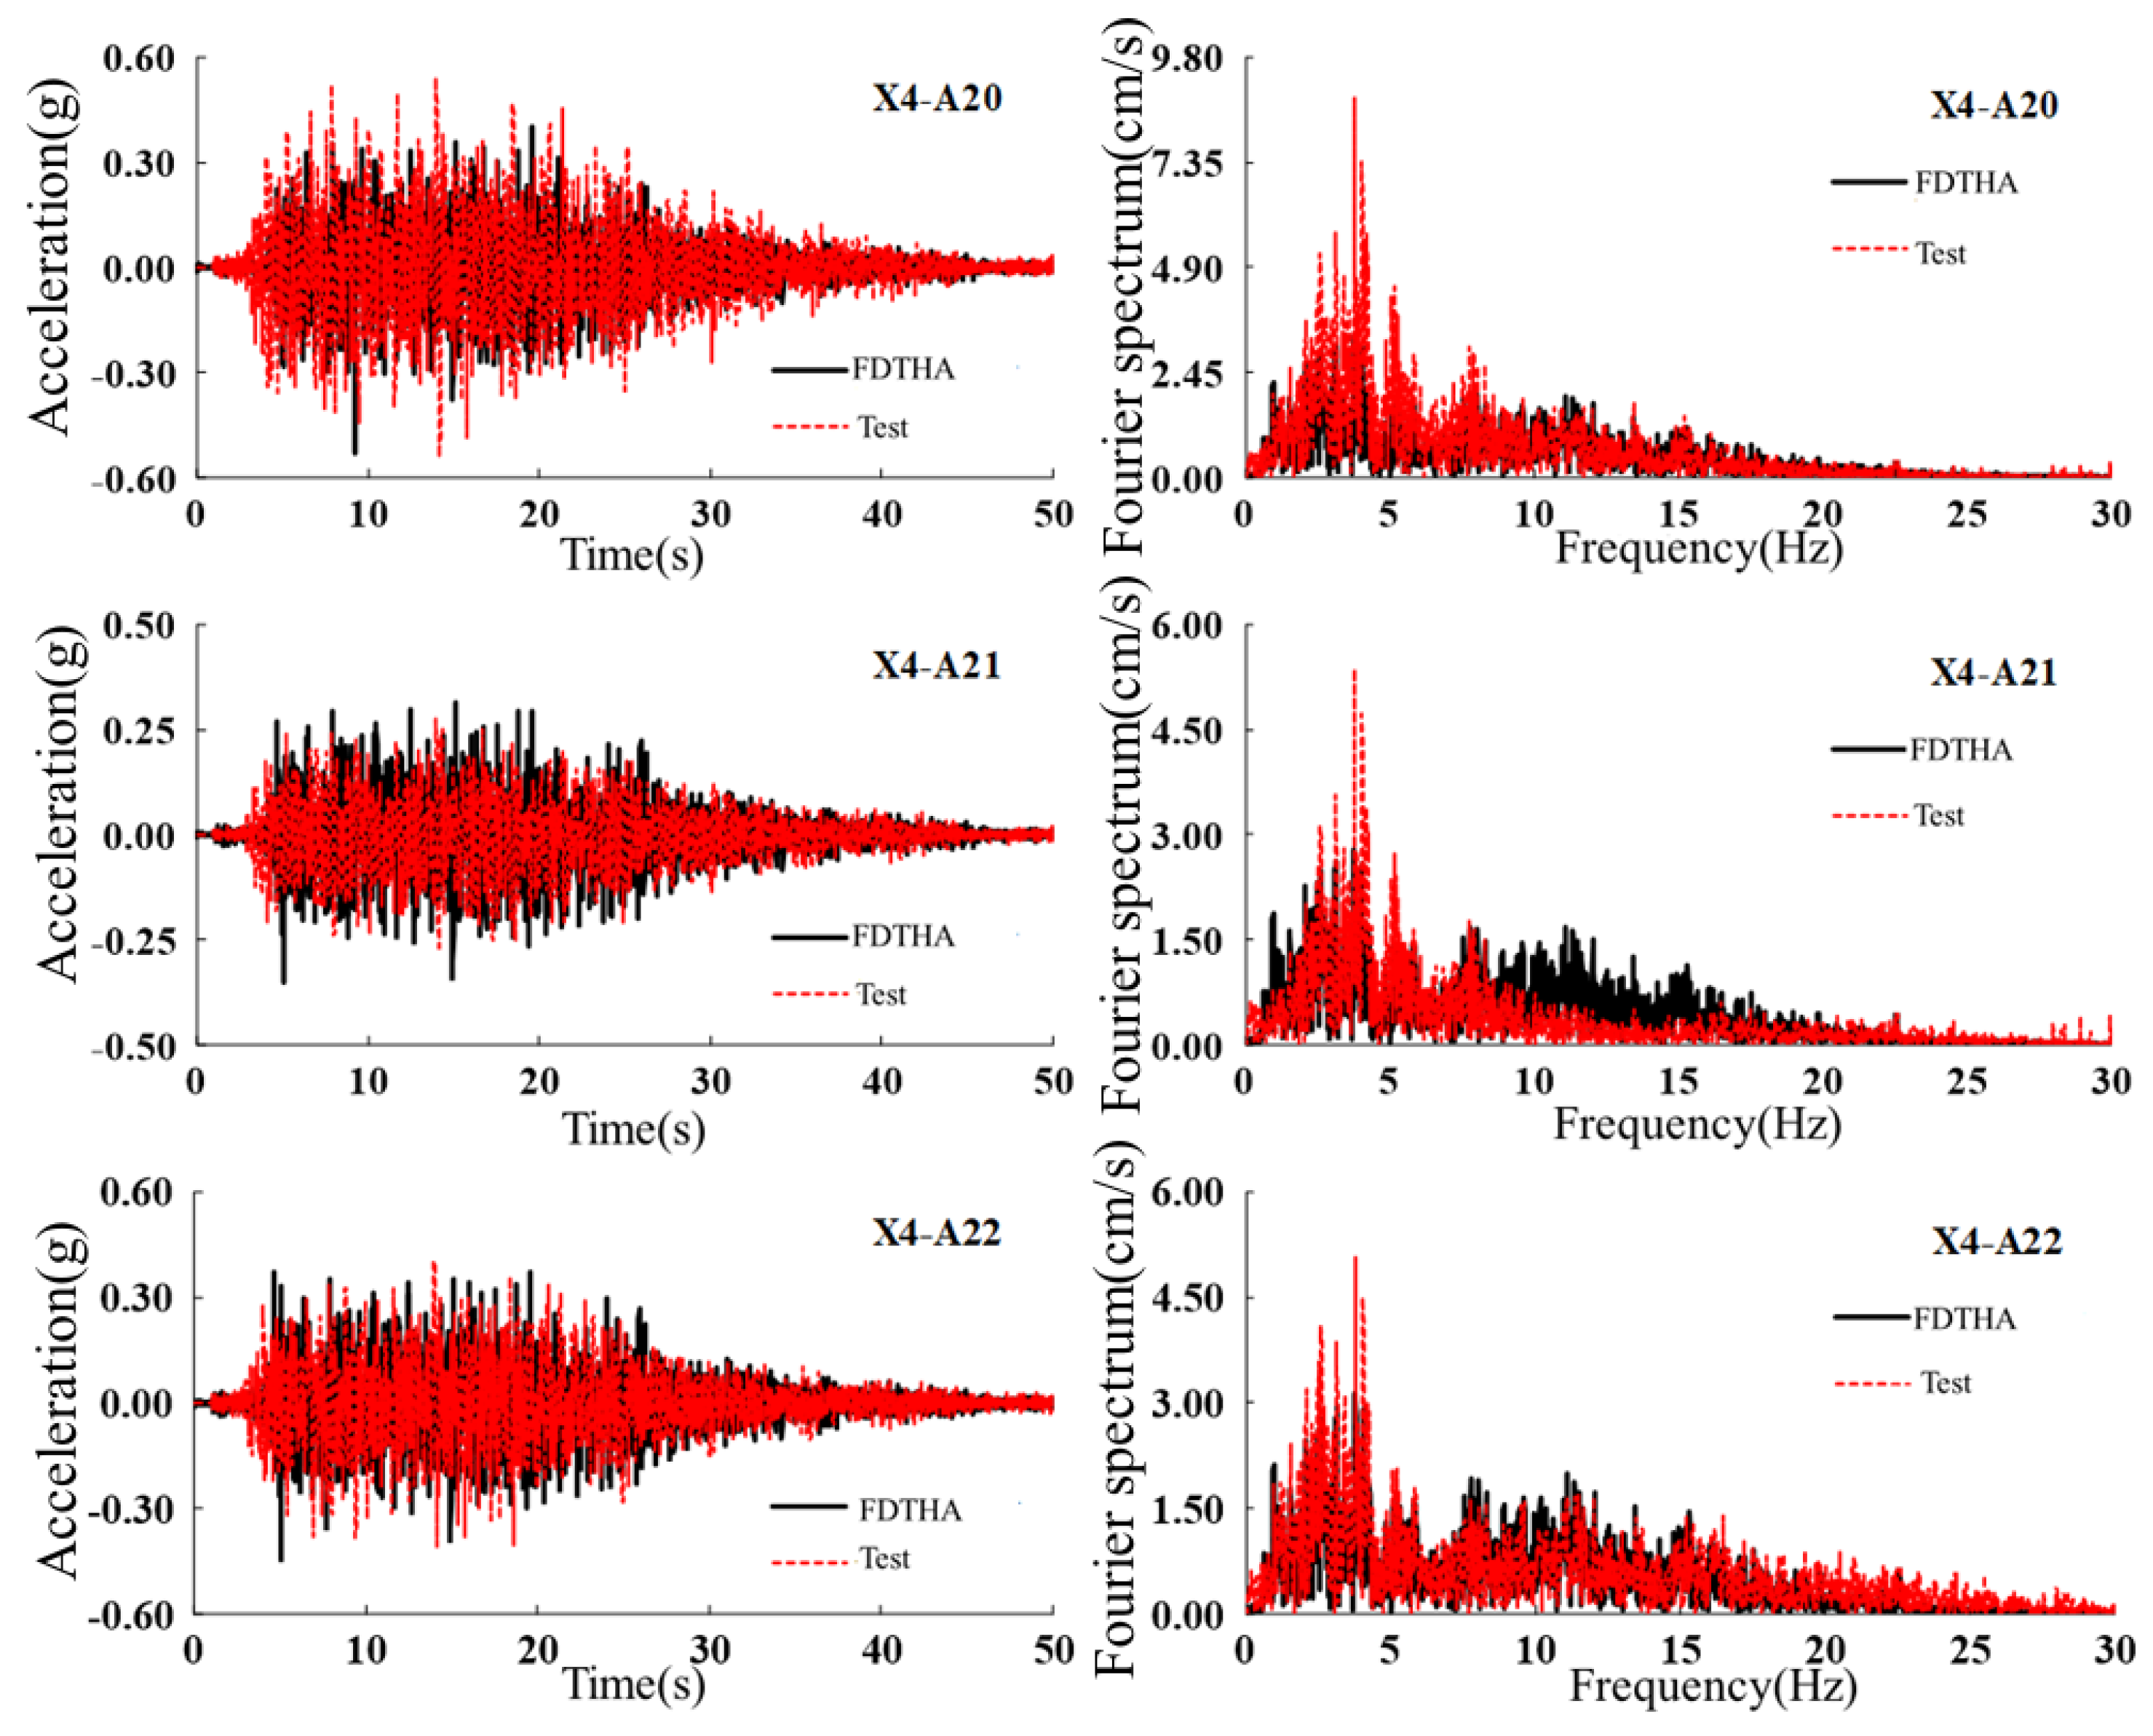
4.2. Reliability Analysis of FDTHA
4.3. Reliability Analysis of Seismic Calculation Methods for Subway Underground Structure
- (1)
- After selecting reasonable seismic design parameters (the practical data tabulated herein were used for the horizontal relative displacement of the stratum in the loess area, and the comprehensive recommended equation proposed in this paper was used for the foundation spring stiffness), the results of the structural internal force of the DESANM are more consistent with the time-history analysis method. The FBM that neglects the seismic shear force leads to underestimation of the internal forces. The bending moment and shear force output by DBM are closest to those predicted by use of the time-history analysis method, but the accuracy of the axial force output remains insufficient.
- (2)
- From the shaking-table test, the top of the upper column is the most severely damaged, and the bottom of the lower column follows. The results of time-history analysis and DESANM are consistent with the damage seen in the shaking-table test; the maximum bending moment on the middle column is located at the top of the upper column, followed by the bottom of the lower column. Therefore, the comprehensive recommended equation and practical tabulated data better reflect the effect of soil on the structure.
4.4. Seismic Analysis
- (1)
- The internal forces on an underground structure, as calculated by FBM, are small, which is related to the fact that the friction and shear stresses caused by soil deformation are not considered in the FBM. The DBM is simple to establish, and the principle is to simulate the interaction between soil and structure by establishing springs and applying horizontal displacement to the key stratum.
- (2)
- The DBM simulates the interaction between soil and structure by establishing springs and applying horizontal displacement to a stratum, and the model is simple. The correct values of spring stiffness and ground horizontal displacement make the output of structural shear force and bending moment approach those calculated using the time-history method of analysis. The output accuracy of shear force and bending moment values is higher than that of DESANM, but the accuracy of axial force output is poorer than that of DESANM.
- (3)
- The loess stratum is established in the calculation model of the DESANM, so the calculation relies on fewer parameters. When the value of horizontal relative displacement is accurate, the results of structural internal force of DESANM are consistent with that of the time-history method of analysis. However, the calculation is more onerous, ranking second only in complexity compared to that in the time-history analysis.
5. Modification of DBM
5.1. Influences of Transverse Seismic Force on Subway Underground Structure
5.2. Vertical Seismic EARTH Pressure
5.3. Earth Pressure Acting on the Floor
5.4. Reliability Analysis: Modified DBM
6. Conclusions
- (1)
- A new analysis method useful for the evaluation of the seismic behavior of underground structures in loess area was proposed based on the DBM and it is named the modified DBM. The DBM was modified according to the results obtained from a shaking-table test and numerical simulations. The results show that the modified displacement-based method improves the accuracy of structural axial force output and compensates for the defects of the DBM. The modified DBM is applicable to any typology of underground structure and it can be applied to the seismic design of underground structure.
- (2)
- The modified DBM was compared with the most commonly used methods of analysis (FBM, DESANM, DBM, and FDTHM). The results were validated considering using data from a shaking table test based on the Feitian Road underground subway station in Xi’an. The comparison of output results shows that the modified DBM offers good accuracy, a simple model, rapid modeling, and easy convergence.
- (3)
- Based on the finite element analysis method, a practical table of horizontal relative displacements of strata in loess areas, and the comprehensive recommended equation of foundation reaction spring stiffness, were provided. The practical table and the comprehensive recommended equation provide a method of estimation of those seismic calculation parameters required by designers of underground subway stations in loess areas.
- (4)
- Due to the special properties of loess, the modified DBM is suitable for the seismic response analysis of underground structures in loess area. However, whether it is applicable to other soils remains to be studied in future research.
Author Contributions
Funding
Institutional Review Board Statement
Informed Consent Statement
Data Availability Statement
Conflicts of Interest
Appendix A

| Number | Soil | Weight Density/kN/m3 | Elastic Modulus/MPa | Cohesion/kPa | Internal Friction Angle/° | Liquidity Index |
|---|---|---|---|---|---|---|
| 3-1-1 | New loess | 16.2 | 7 | 27 | 24.5 | 0.17 |
| 3-2-1 | Paleosol | 17.4 | 10 | 45 | 24 | 0.15 |
| 4-1-1-1 | Old loess | 16.1 | 9 | 35 | 23 | 0.3 |
| 4-2-1 | Paleosol 2 | 17.6 | 11 | 44 | 23 | 0.31 |
| 4-1-1-2 | Old loess 2 | 16.9 | 10 | 36 | 22.5 | 0.44 |
| Number | Soil | Thickness/m | Equivalent Shear Wave Velocity/m/s | Density/kg/m3 |
|---|---|---|---|---|
| 3-1-1 | New loess | 7.3 | 223.8 | 1620 |
| 3-2-1 | Paleosol | 3 | 335.5 | 1740 |
| 3-1-1 | New loess | 8.8 | 348.4 | 1620 |
| 3-2-1 | Paleosol | 4.2 | 354 | 1740 |
| 3-1-1 | New loess | 3.3 | 360 | 1620 |
| 3-2-1 | Paleosol | 3.6 | 361.7 | 1740 |
| 3-1-1 | New loess | 3.6 | 371.9 | 1620 |
| 4-2-1 | Paleosol 2 | 5.1 | 384.9 | 1760 |
| 3-1-1 | New loess | 2.6 | 403.8 | 1620 |
| 4-2-1 | Paleosol 2 | 2.3 | 422.8 | 1760 |
| 4-1-1-1 | Old loess | 4 | 422.8 | 1610 |
| 4-2-1 | Paleosol 2 | 2.1 | 458.5 | 1760 |
| 4-1-1-1 | Old loess | 3.2 | 465 | 1610 |
| 4-2-1 | Paleosol 2 | 2.5 | 465.3 | 1760 |
| 4-1-1-1 | Old loess | 8 | 475.7 | 1610 |
| 4-2-1 | Paleosol 2 | 1.6 | 483.5 | 1760 |
| 4-1-1-2 | Old loess 2 | 4.8 | 488.6 | 1690 |
| Physical Property | Physical Quantity | Similarity Relationship | Similarity Constant |
|---|---|---|---|
| Geometric characteristics | Length l | Sl | 1/30 |
| Area A | SA = Sl2 | 1/900 | |
| Linear displacement l | Sl | 1/30 | |
| Material characteristics | Elastic modulus E | SE | 1/5 |
| Stress σ | Sσ = SE | 1/5 | |
| Density ρ | Sρ = SE/(SlSα) | 3.0 | |
| Quality m | Sm = SσSl2/Sα | 1.11 × 10⁻⁴ | |
| Load performance | Point force F | SF = SσSl2 | 2.22 × 10⁻⁴ |
| Line load q | Sq = SσSl | 6.67 × 10⁻³ | |
| Moment M | SM = SσSl3 | 7.41 × 10⁻⁶ | |
| Dynamic characteristics | Time t | St = Sl0.5Sα−0.5 | 0.13 |
| Velocity ν | St = Sl0.5Sα0.5 | 0.26 | |
| Acceleration α | Sα | 2.0 |
| Bending Moment/N·m | Shear Force/N | Axial Force/N | |||||||||||
|---|---|---|---|---|---|---|---|---|---|---|---|---|---|
| Observation Point | FDTHA | FBM | DBM | FBM | FDTHA | FBM | DBM | FBM | FDTHA | FBM | DBM | FBM | |
| Central column | a | 215,555 | 10,423.3 | 238,803 | 279,008 | −49,184 | −4141.44 | −44,832 | −69,461.7 | −1,031,720 | −4141.44 | −510,953 | −1,045,410 |
| b | −153,906 | −6832.71 | −181,235 | −198,130 | −67,739 | −4141.44 | −44,832 | −178,655 | −1,154,460 | −4141.44 | −522,453 | −1,140,410 | |
| c | 131,605 | −2701.63 | 121,486 | 363,861 | −43,857 | 741.297 | −109,800 | −92,933.5 | −1,421,870 | 741.297 | −712,100 | −1,297,840 | |
| d | −197,523 | 930.728 | −214,180 | −615,633 | −50,276 | 741.297 | −109,800 | −261,956 | −1,558,590 | 741.297 | −724,804 | −1,408,240 | |
| Flank | e | −658,209 | −66,093.9 | −677,207 | −435,546 | 769,365 | −99,877.4 | 659,369 | −532,570 | −506,949 | −99,877.4 | −388,257 | −536,758 |
| f | 49,262 | 45,317.8 | 43,402 | 502,996 | −143,782 | 29,138.5 | −724,622 | −178,655 | −794,779 | 29,138.5 | −738,997 | −772,260 | |
| g | −224,909 | −30,203.7 | −251,916 | −18,654.4 | 231,968 | −40,416.1 | 661,587 | −248,115 | −854,289 | −40,416.1 | −330,183 | −855,921 | |
| h | −1,352,410 | −147,243 | −1,768,540 | 363,861 | −1,995,360 | 100,578 | −1,435,260 | −2,190,510 | −1,394,980 | 100,578 | −1,887,020 | −1,411,240 | |
References
- An, X.; Shawky, A.; Maekawa, K. The collapse mechanism of a subway station during the great Hanshin earthquake. Cem. Concr. Compos. 1997, 19, 241–257. [Google Scholar] [CrossRef]
- Samata, S.; Ohuchi, H.; Matsuda, T. A study of the damage of subway structures during the 1995 Hanshin—Awaj i earthquake. Cem. Concr. Compos. 1997, 19, 223–239. [Google Scholar] [CrossRef]
- St. John, C.M.; Zahrah, T.F. Aseismic design of underground structures. Tunn. Undergr. Space Technol. 1987, 2, 165–197. [Google Scholar] [CrossRef]
- MOHURD; General Administration of Quality Supervision, Inspection and Quarantine of the People’s Republic of China. Code for Seismic Design of Building; China Architecture & Building Press: Beijing, China, 2010; pp. 6–43. [Google Scholar]
- MOHURD; General Administration of Quality Supervision, Inspection and Quarantine of the People’s Republic of China. Code for Design of Civil Defence Basement; China Architecture & Building Press: Beijing, China, 2005; pp. 10–35. [Google Scholar]
- MOHURD; General Administration of Quality Supervision, Inspection and Quarantine of the People’s Republic of China. Code for Seismic Design of Subway Structures; China Architecture & Building Press: Shanghai, China, 2009; pp. 43–67. [Google Scholar]
- MOHURD; General Administration of Quality Supervision, Inspection and Quarantine of the People’s Republic of China. Code for Seismic Design of Urban Rail Transit Structures; China Planning Press: Beijing, China, 2014; pp. 34–40. [Google Scholar]
- MOHURD; General Administration of Quality Supervision, Inspection and Quarantine of the People’s Republic of China. Standard for Seismic Design of Underground Structures; China Architecture & Building Press: Beijing, China, 2018; pp. 6–50. [Google Scholar]
- Ministry of Railways of the People’s Republic of China. Code for Seismic Design of Railway Engineering; China Planning Press: Beijing, China, 2006; pp. 40–43. [Google Scholar]
- Ministry of Transport of the people’s Republic of China. Specifications for Seismic Design of Highway Tunnels; People’s communications Publishing House Co., Ltd.: Beijing, China, 2019; pp. 10–13. [Google Scholar]
- The State Bureau of Quality and Technical Supervision; MOHURD. Code on Geotechncal Investigations for Metro and Light Rail Transit; China Planning Press: Beijing, China, 1999; pp. 13–20. [Google Scholar]
- MOHURD; General Administration of Quality Supervision, Inspection and Quarantine of the People’s Republic of China. Code for Geotechnical Investigations of Urban Rail Transit; China Planning Press: Beijing, China, 2012; pp. 6–10. [Google Scholar]
- AFPS/AFTES. Guidelines on Earthquake Design and Protection of Underground Structures; Version 1; Working Group of the Frech Association for Seismic Engineering (AFPS); French Tunneling Association (AFTES): Paris, France, 2001. [Google Scholar]
- ALA. Seismic Fragility Equationtions for Water Systems, Part1-Guideline; ASCE-FEMA: Reston, VA, USA, 2001. [Google Scholar]
- ASCE Committee in Gas and Liquid Fuel Lifelines. Guidelines for the Seismic Design of Oil and Gas Pipeline Systems; Technical Council on Lifeline Earthquake Engineering; ASCE: New York, NY, USA, 1984. [Google Scholar]
- Kuesel, T.R. Earthquake design criteria for subways. J. Struct. Div. 1969, 95, 1213–1231. [Google Scholar] [CrossRef]
- Japan Road Associaton. Guide Specifications of Design and Construction of Underground Parking Lots; Japan Road Association: Tokyo, Japan, 1992. [Google Scholar]
- Wang, J.N. Seismic Design of Tunnels; Parson Brinckerhoff Inc.: New York, NY, USA, 1993. [Google Scholar]
- Penzien, J. Seismically induced racking of tunnels lining. Earthq. Eng. Struct. Dyn. 2000, 27, 683–691. [Google Scholar] [CrossRef]
- Kawashima, K. Seismic analysis of underground structures. J. Disaster Res. 2006, 1, 378–389. [Google Scholar] [CrossRef]
- Kiyomiya, O. Earthquake-resistant design features of immersed tunnels in Japan. Tunn. Undergr. Space Technol. 1995, 10, 463–475. [Google Scholar] [CrossRef]
- Hashash, Y.M.A.; Hook, J.J.; Schmidit, B.; Yao, J.C. Seismic design and analysis of underground structures. Tunn. Undergr. Space Technol. 2001, 16, 247–293. [Google Scholar] [CrossRef]
- Kisiridis, A.E. Seismic analysis of underground structures. Int. J. Soil Dyn. Earthq. Eng. 1983. [Google Scholar] [CrossRef]
- Penzien, J.; Wu, C. Stresses in linings of bored tunnels. Earthq. Eng. Struct. Dyn. 1998, 27, 283–300. [Google Scholar] [CrossRef]
- Bobet, A. Effect of pore water pressure on tunnel support during static and seismic loading. Tunn. Undergr. Space Technol. 2003, 18, 377–393. [Google Scholar] [CrossRef]
- Park, K.H.; Tantayopin, K.; Tontavanich, B.; Owatsiriwong, A. Analytical solution for seismic-induced ovaling of circular tunnel lining under no-slip interface conditions: A revisit. Tunn. Undergr. Space Technol. 2009, 24, 231–235. [Google Scholar] [CrossRef]
- Bobet, A. Drained and undrained response of deep tunnels subjected to far-fieldshear loading. Tunn. Undergr. Space Technol. 2010, 25, 21–31. [Google Scholar] [CrossRef]
- Zucca, M.; Valente, M. On the limitations of coupled and decoupled approaches for the seismic behaviour evaluation of shallow multi-propped underground structures embedded in granular soils. Eng. Struct. 2020, 211, 110497. [Google Scholar] [CrossRef]
- Soccodato, F.M.; Tropeano, G. The role of ground motion characters on the dynamic performance of propped retaining structures. In Proceedings of the 6ICEGE, 6th International Conference on Earthquake Geotechnical Engineering, Christchurch, New Zealand, 1–4 November 2015. [Google Scholar]
- Zucca, M.; Tropeano, G.; Crespi, P.; Erbì, E. 2D linear equivalent analysis for the seismic vulnerability evaluation of multi-propped retaining structures. In Proceedings of the XVII ECSMGE—European Conference on Soil Mechanics and Geotechnical Engineering, Reykjavik, Iceland, 1–6 September 2019. [Google Scholar]
- ISO 23469. Bases for Design of Structures-Seismic Actions for Designing Geotechnical Works; ISO TC 98/SC3/WG10; ISO International Standard: Geneva, Switzerland, 2005. [Google Scholar]
- Liu, R.S.; Hu, S.Q.; Shi, H.B. Study on seismic loading of pseudo-static approach used in the seismic design of underground structure. Chin. J. Geotech. Eng. 2007, 29, 237–242. (In Chinese) [Google Scholar] [CrossRef]
- Liu, J.B.; Wang, W.H.; Zhao, D.D. Comparison of the pseudo-static method for seismic analysis of the underground structures. Eng. Mech. 2003, 30, 105–111. (In Chinese) [Google Scholar] [CrossRef]
- Gingery, J. A simplified method for estimating shear strains for ovaling and racking analysis of tunnels. In Proceedings of the 4th International Conference on Earthquake Geotechnical Engineering, Thessalonoki, Greece, 25–28 June 2007. [Google Scholar]
- Newmark, N.M. Problems in wave propagation in soil and rock. In Proceedings of the International Symposium on Wave Propagation and Dymamic Properties of Earth Materials, Albuquerque, NM, USA, 1–3 August 1968. [Google Scholar]
- FWHA. Technical Manual for Design and Construction of Road Tunnels-Civil Element; Puplication No. FHWA-NHI-10-034; U.S. Department of Transportation, Federal Highway Administration: Washington, DC, USA, 2009; p. 702. [Google Scholar]
- Liu, J.B.; Wang, W.H.; Zhao, D.D.; Zhang, X.B. Integral response deformation method in seismic analysis of complex section underground structures. China Civ. Eng. J. 2014, 47, 134–142. (In Chinese) [Google Scholar] [CrossRef]
- Liu, J.B.; Wang, D.Y.; Tan, H. Response displacement methods for longitudinal seismic response analysis of tunnel structures. J. Vib. Shock. 2019, 38, 104–111. (In Chinese) [Google Scholar]
- Yin, S.Z.; Ye, D.; Liang, Y.J. Application of 2D arc consistent viscous-spring artifical boundary element in the ABAGUS. World Earthq. Eng. 2017, 33, 69–74. (In Chinese) [Google Scholar]


| Seismic Fortification Intensity/Degree | 7 | 7.5 | 8 | 8.5 | 9 |
| Peak acceleration of seismic wave/g | 0.1 | 0.15 | 0.2 | 0.3 | 0.4 |
| Peak value of horizontal displacement/m | 0.251 | 0.502 | 0.528 | 0.847 | 1.141 |
| Position | Parameter | 50-Year Exceedance Probability | 100-Year Exceedance Probability | |||
|---|---|---|---|---|---|---|
| 63% | 10% | 2% | 10% | 2% | ||
| Ground | Tg(s) | 0.38 | 0.43 | 0.68 | 0.59 | 0.83 |
| Ag(g) | 0.079 | 0.235 | 0.457 | 0.340 | 0.575 | |
| Floor | Tg(s) | 0.60 | 0.64 | 0.90 | 0.75 | 1.00 |
| Ag(g) | 0.051 | 0.151 | 0.358 | 0.247 | 0.441 | |
| Parameter | Value | Parameter | Value |
|---|---|---|---|
| Density/kg/m3 | 2500 | Angle of dilation /° | 30 |
| Elastic modulus E/MPa | 0.66 × 10⁴ | Coefficient of viscosity | 0.0005 |
| Poisson’s ratio | 0.2 | Tensile variable | 0 |
| Ultimate compressive stress/MPa | 5.39 | Compression variable | 1 |
| Invariant stress ratio Kc | 0.667 | Damping ratio | 0.1 |
| Observation Point | Bending Moment/kN·m | Shear Force/kN | Axial Force/kN | |||
|---|---|---|---|---|---|---|
| Normal Use Stage | Under Lateral Seismic Action | Normal Use Stage | Under Lateral Seismic Action | Normal Use Stage | Under Lateral Seismic Action | |
| a | −0.014 | 215.6 | 0.005 | −201 | −1180 | −1031.7 |
| b | 78.2 | −153.9 | −132.000 | −284 | −1260 | −1154.5 |
| c | 0.005 | 131.6 | 0.003 | −419.6 | −1560 | −1421.9 |
| d | 90.5 | −197.5 | −134 | −517.6 | −428 | −1558.6 |
| e | −248 | −658.2 | −976 | −118.2 | −547 | −506.9 |
| f | −550 | 49.2 | 1050 | −180.9 | −727 | −794.8 |
| g | −347 | −224.9 | −183 | −272.5 | −610 | −854.3 |
| h | −418 | −1352.4 | 568 | −358.2 | −1080 | −1395 |
| Seismic Fortification Intensity/Degree | 7 | 7.5 | 8 | 8.5 | 9 |
|---|---|---|---|---|---|
| Peak acceleration of seismic wave/g | 0.1 | 0.15 | 0.2 | 0.3 | 0.4 |
| Peak value of surface displacement/mm | 10.5 | 13.3 | 16.2 | 19.7 | 24.1 |
| Observation Point | Modified DBM/kN | DBM/kN | FDTHA/kN | Error in Modified DBM | Error in DBM | |
|---|---|---|---|---|---|---|
| Central column | a | −1172.70 | −510.95 | −1031.70 | 13.70% | −50.47% |
| b | −1184.20 | −522.45 | −1154.50 | 2.60% | −54.75% | |
| c | −1399.20 | −712.10 | −1421.90 | −1.60% | −49.92% | |
| d | −1411.90 | −724.80 | −1558.60 | −9.40% | −53.50% | |
| Flank | e | −509.40 | −388.26 | −506.90 | 0.50% | −23.41% |
| f | −671.30 | −739.00 | −794.80 | −15.50% | −7.02% | |
| g | −823.80 | −330.18 | −854.30 | −3.60% | −61.35% | |
| h | −1307.50 | −188.70 | −1395.00 | −6.30% | −86.47% | |
Publisher’s Note: MDPI stays neutral with regard to jurisdictional claims in published maps and institutional affiliations. |
© 2021 by the authors. Licensee MDPI, Basel, Switzerland. This article is an open access article distributed under the terms and conditions of the Creative Commons Attribution (CC BY) license (https://creativecommons.org/licenses/by/4.0/).
Share and Cite
Zhang, R.; Ye, D.; Zhou, J.; Quan, D. Seismic Analysis Method for Underground Structure in Loess Area Based on the Modified Displacement-Based Method. Appl. Sci. 2021, 11, 11245. https://doi.org/10.3390/app112311245
Zhang R, Ye D, Zhou J, Quan D. Seismic Analysis Method for Underground Structure in Loess Area Based on the Modified Displacement-Based Method. Applied Sciences. 2021; 11(23):11245. https://doi.org/10.3390/app112311245
Chicago/Turabian StyleZhang, Ruijie, Dan Ye, Jianting Zhou, and Dengzhou Quan. 2021. "Seismic Analysis Method for Underground Structure in Loess Area Based on the Modified Displacement-Based Method" Applied Sciences 11, no. 23: 11245. https://doi.org/10.3390/app112311245
APA StyleZhang, R., Ye, D., Zhou, J., & Quan, D. (2021). Seismic Analysis Method for Underground Structure in Loess Area Based on the Modified Displacement-Based Method. Applied Sciences, 11(23), 11245. https://doi.org/10.3390/app112311245