Article

Experimental Study on the Seismic Performance of New Energy Dissipation Connectors in an Autoclaved Aerated Concrete Panel with Assembled Steel Frame

1
Urban Construction Institute, Anhui Xinhua University, Hefei 230088, China
2
School of Civil Engineering, Anhui Jianzhu University, Hefei 230601, China
3
Uyi Township Government, Chuzhou 239000, China
*
Author to whom correspondence should be addressed.
Appl. Sci. 2022, 12(24), 13035; https://doi.org/10.3390/app122413035
Submission received: 30 November 2022 / Revised: 13 December 2022 / Accepted: 16 December 2022 / Published: 19 December 2022

Abstract

:
This study proposes a new energy dissipation connector (NEDC) to connect an external autoclaved aerated concrete (AAC) wall panel with an assembled steel frame. To investigate the seismic performance and working mechanism of the NEDC under seismic action, horizontal low-cyclic loading tests were conducted on two sets of steel frames with different connectors using an MTS actuator. Similarly, the seismic performance and working mechanism of the AAC wall panels were elucidated using horizontal low-cyclic loading tests. Test results revealed that the NEDC increased ductility by 10.69–21.12% and energy consumption by 101.14% when compared to those obtained using hook bolt connectors. Overall, the NEDC provides good seismic performance, large deformability, and high energy consumption capacity, thereby rendering it ideal for assembled steel buildings. Furthermore, the NEDC can reduce wall panel damage during earthquake action and enhance the seismic performance of composite frames.

1. Introduction

Autoclaved aerated concrete is an environment friendly building material with lightweight characteristics, excellent fireproof performance, and good sound insulation. Autoclaved aerated concrete (AAC) wall panels are green, economical, and easy to construct [1]. These wall panels can be connected with assembled steel frames internally and externally. External AAC wall panels can prevent the onset of a thermal bridge (cold bridge) and increase insulation performance. Numerous [2] studies have shown that AAC wall panels can slow down the damage caused to a structure and improve the mechanical properties governing its load-bearing capacity. Therefore, AAC wall panels are increasingly used in assembled steel structures. Steel structures have specific deformation properties and can adapt to certain external deformations [3]. However, the deformation capacity of AAC wall panels is poor [4]. To achieve synergy between the enclosure wall panels and main body of the steel structure, the connection nodes between the exterior wall panels and steel structure ensure that the enclosure wall panels exhibit good follow-through performance. To enhance the seismic performance of the external suspension of a steel structure [5], two types of nodes are used to connect the exterior wall panel and steel structure: rigid and flexible nodes. When the structure using rigid nodes is subjected to external loads and impact, the interaction between the wall panel and main body tends to be significant; thus, the wall tends to crack and even fall off [6]. Employing flexible connection nodes can circumvent these risks. When subjected to external loads, the wall panels can slip or sway using flexible connections to produce a coordinated deformation between the exterior wall panels and the main body. This can effectively reduce the degree of cracking and damage caused to the wall panels, thus rendering the structure safer and more stable and preventing disasters [7].
The most common method for connecting AAC wall panels to assembled steel frames is by using hook bolts as connectors. Hook bolts cannot stabilize the relative displacement between the wall panels and steel frame under high seismic action [8]. Guowei et al. improved the hook head bolt connectors to ensure that the AAC wall panels firmly connect with the steel beams [9,10]. The results proved that the two nodes with sway motion exhibit excellent connection performance under seismic activity. Getz et al. [11] studied the seismic performance of AAC wall panels for engineering applications in the United States. It was found that conventional connection nodes, which are used to connect AAC enclosure panels to main steel frame structures, did not fully meet the in-plane seismic design requirements related to the interlayer displacement angles and safety of the building code. Bo et al. [12] conducted an experimental study and revealed that steel frame structures comprising AAC slats with sway connection (ADR) nodes have good energy consumption capacity, which ensures that AAC walls and steel pipe frames made of concrete are jointly stressed and function safely under seismic effects.
Based on the abovementioned research, a new energy dissipation connector (NEDC) has been proposed in this study. This connector can significantly improve the deformation capacity of external AAC wall panels in assembled steel frame structures and improve the seismic performance of the overall structure. To verify the effect of the NEDC on the overall structure, two sets of horizontal low-cyclic loading tests have been performed on the AAC wall panels connected with steel frames using different connectors. Subsequently, seismic indexes such as hysteresis and skeleton curves, stiffness degradation laws, ductility, and the energy dissipation capacity of these AAC wall panels are examined.

2. Materials and Methods

2.1. NEDC Design

2.1.1. NEDC Structure

AAC wall panels are a brittle building material. General connectors can easily cause damage to the wall panels during installation, making the overall performance of AAC wall panels degrade. AAC wall panels are installed in two ways: inline and outline. NEDC is the connection piece that connects the external AAC wall panel to the steel frame. In the case of an earthquake, the NEDCs reduce the effect of the seismic transverse waves by allowing the bolts to move through the transverse bolt holes in the lower part. The seismic longitudinal waves cause the bolts to move in the vertical bolt holes in the upper part of the NEDC to reduce the effect of vertical seismic waves. This achieves the purpose of reducing earthquake energy and protecting the integrity of the building.
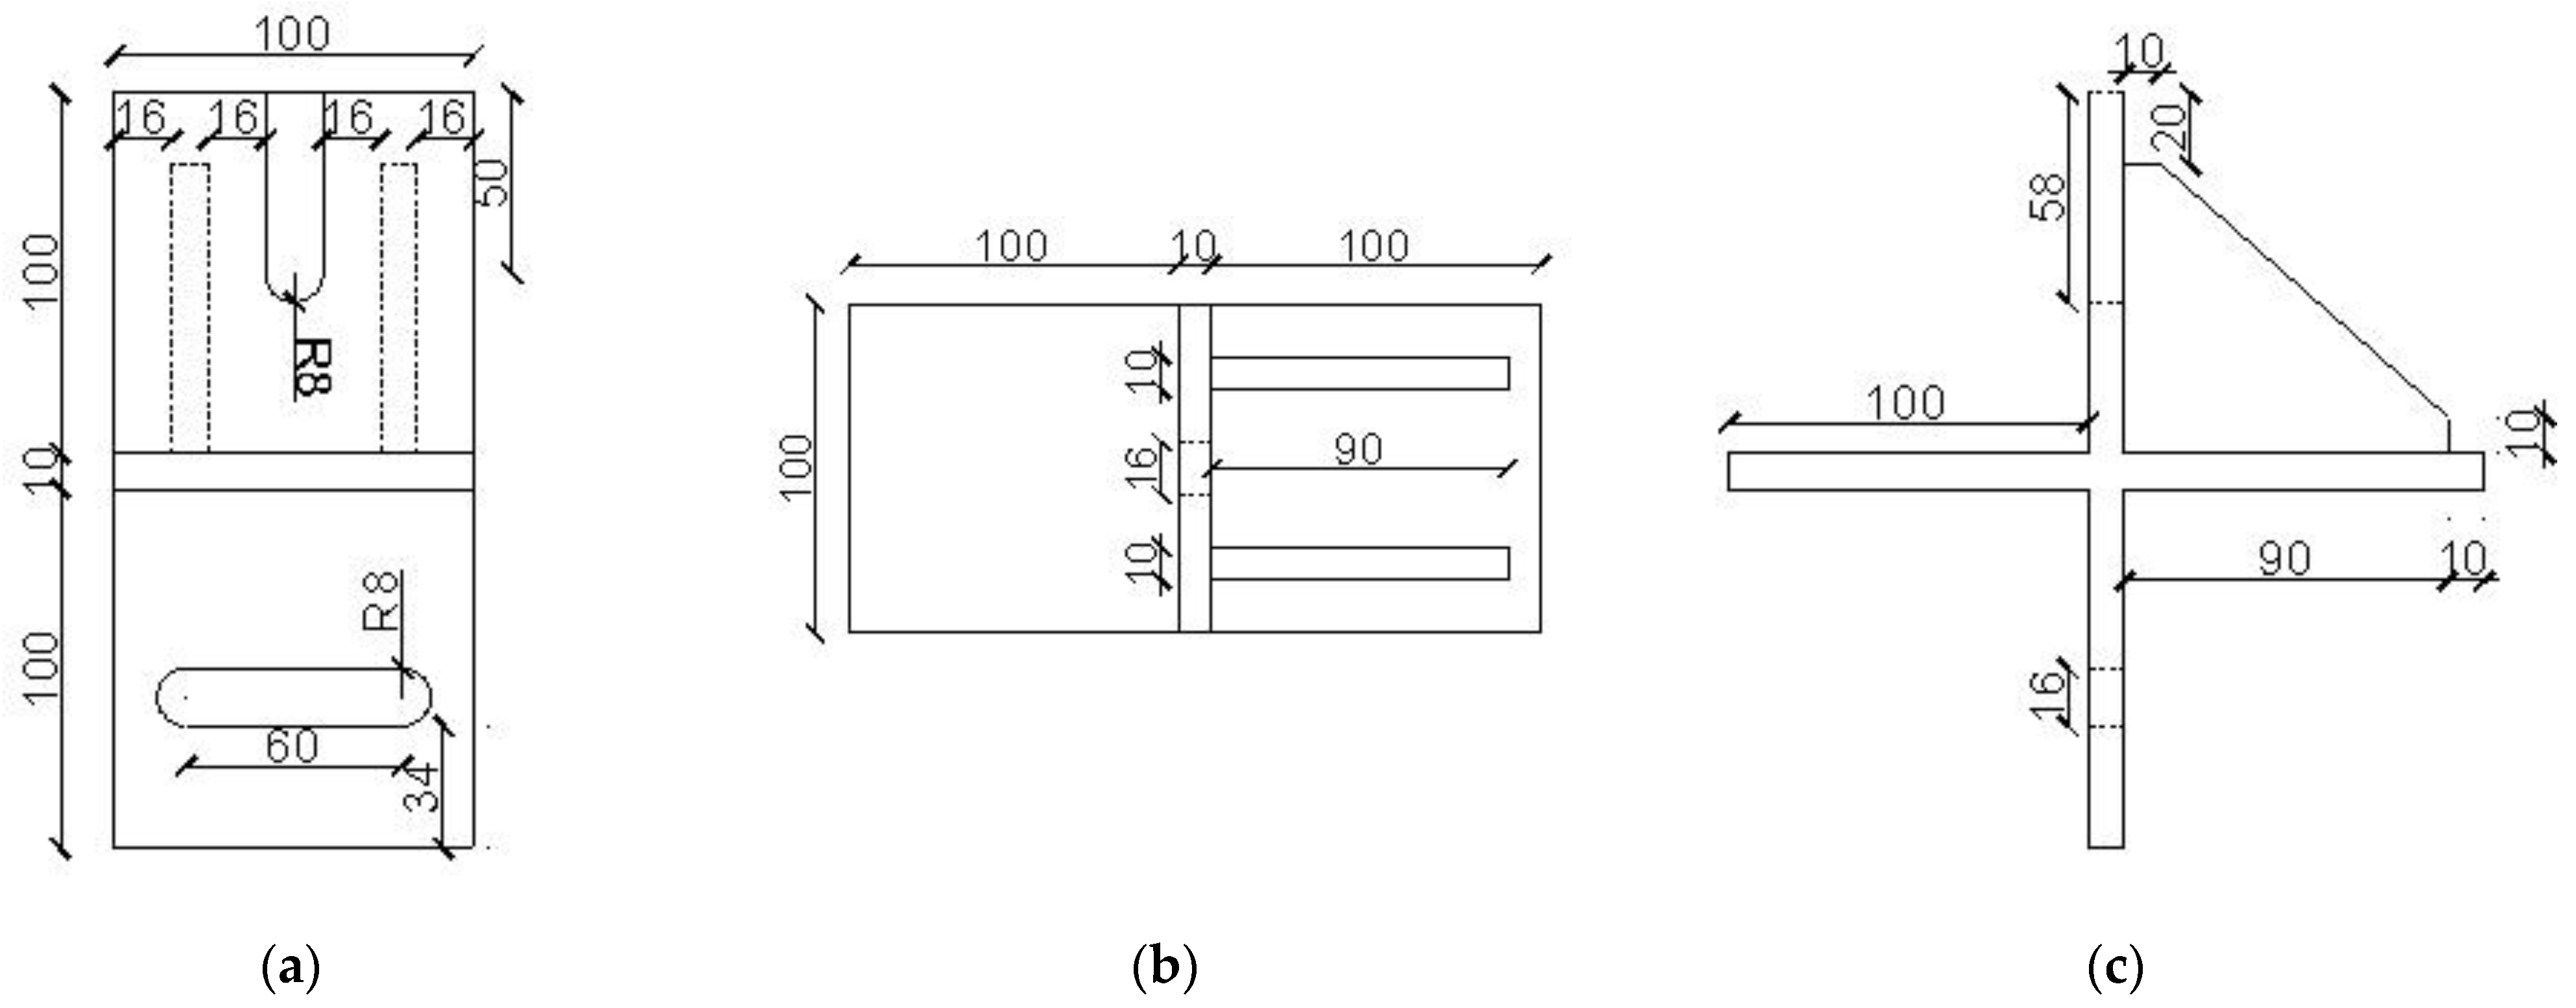
The NEDC connects the external AAC wall panel and the assembled steel frame. These connectors are installed in the upper part of the steel beam at intervals. The NEDC structure shown in Figure 1 mainly comprises a bearing plate (NEDC-BP), restrained plate (NEDC-RP), and stiffening rib (NEDC-SR). The NEDC-BP bears the load from the self-weight of the structure in the vertical direction. The NEDC-RP restrains the deformation loads from out-of-plane sources that are generated by eccentricity, such as horizontal wind loads and out-of-plane loads. The upper and lower parts of the NEDC-RP are equipped with long round bolt holes in the horizontal direction and with unsealed bolt holes in the vertical direction. The long round bolt holes are located in the lower part of NEDC-RP, which is connected to the upper part of the AAC wall panel. The design of these bolt holes allows them to slide horizontally, which offsets some of the secondary wave effects and ensures structural safety. The upper part of NEDC-RP comprises the unsealed bolt slot holes that connect with the lower part of the AAC wall panel. These vertically slotted holes use an unsealed design to facilitate the external installation of AAC wall panels and allow vertical displacement within certain limits. Comparing and analyzing the studies of Özkılıç [13,14,15,16], we designed the size and shape of the NEDC-SR. to make the NEDC-RB work better in the use of the NEDC. The design dimensions of the NEDC are shown in Figure 2.

2.1.2. Connection Structure of AAC Wall Panel with the NEDC

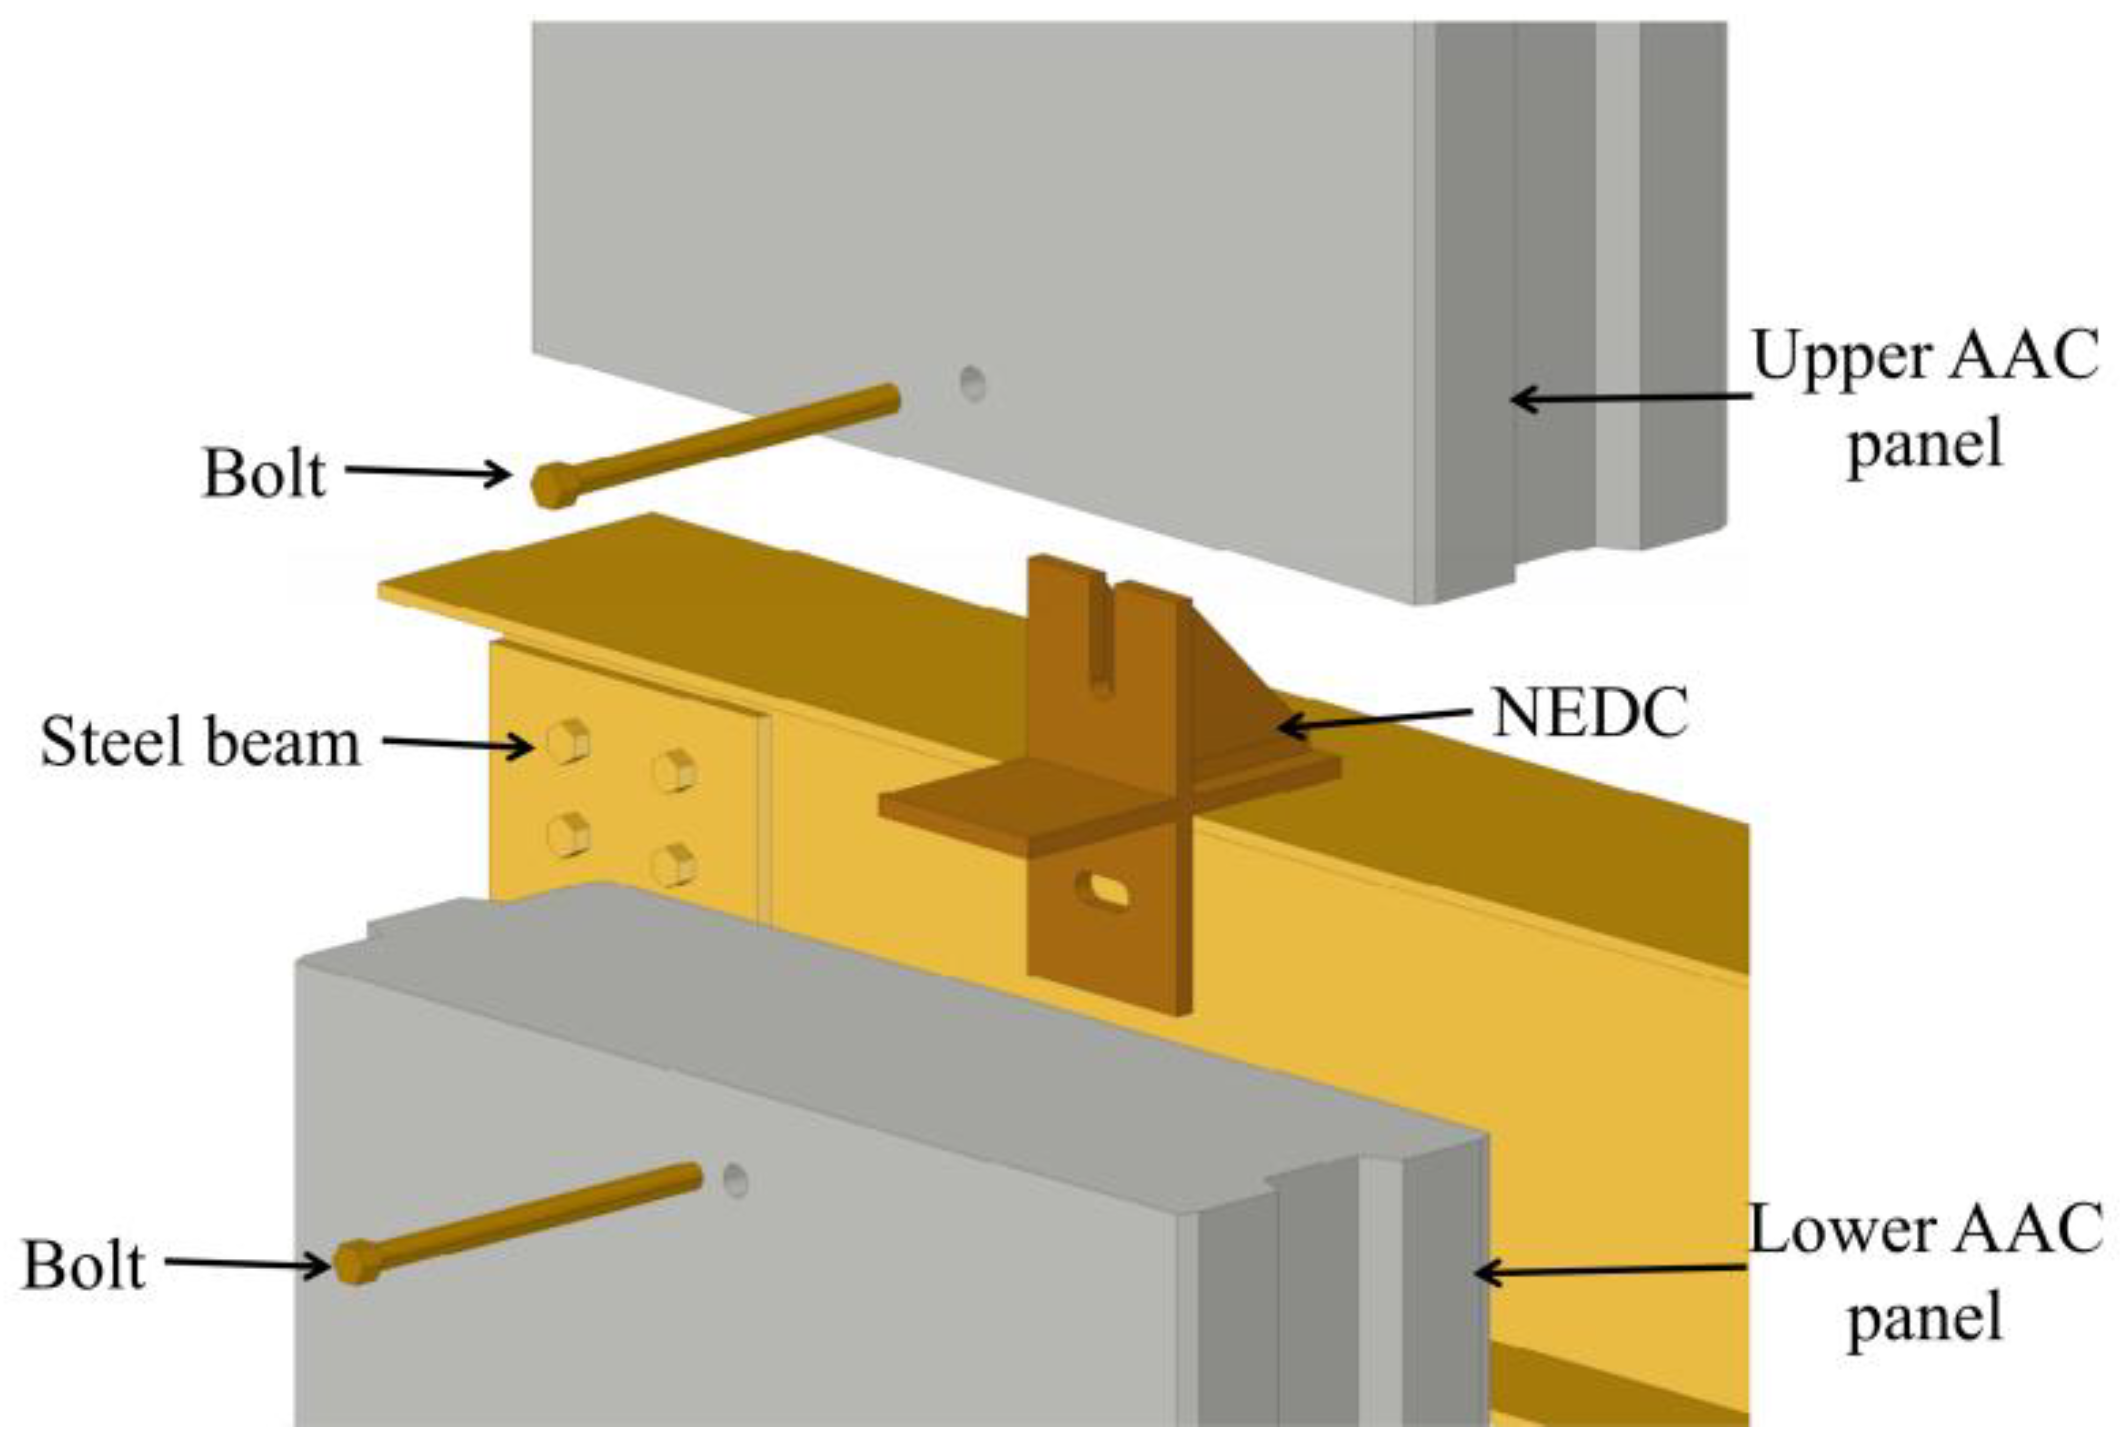
The AAC wall panels are connected to the steel beams by bolts and the NEDC, as shown in Figure 3. The NEDC is flexible and enables the wall panel to slip relative to the main structure with good follow-through performance. It can control the fixation and sliding effects during multiple earthquakes, deformation and energy dissipation effects during fortified earthquakes, and displacement and restraint effects during rare earthquakes using bolt preload and friction coefficients [17].
An AAC wall panel must be attached to a steel beam using bolts at the top and bottom of the wall panel; an NEDC can connect two AAC wall panels simultaneously on the upper and lower levels, as shown in Figure 4.
When the NEDC is used as a limit node in the upper part of the AAC wall panel, the wall panel utilizes the horizontal bolt slot holes. Consequently, the connector is subjected to a horizontal wind load Fy, seismic load Fz, and external load Fe, generated due to eccentricity [18]. When the NEDC is used as the lower load-bearing node of the AAC wall panel, the wall panel is connected to the vertical bolt slot holes. Consequently, the connector bears the vertical load Fx of the upper wall plate, horizontal wind load Fy, seismic load Fz, and out-of-plane load Fe, generated due to eccentricity. The force diagrams of the NEDC and the AAC wall panel are shown in Figure 5.
Under seismic action, transverse seismic waves produce shear forces in the horizontal direction in the steel frame structure, and the shear forces affect the wall panels through the NEDC. When the shear force affects the AAC wall panel, the NEDC bolts slip into the slotted holes of NEDC-RP to dissipate the transmitted shear force and displacement and protect the wall panel from damage. Considering the errors made in the processing and installation of components, the bolt holes in the NEDC are slightly larger than the bolt diameter to facilitate the smooth passage of bolts through the AAC wall panel and connectors during installation. This creates a reliable connection between the steel frame and the AAC wall panel. Furthermore, there is a gap between the AAC wall panel and the steel beam at the node connector, which ensures that the panel and the steel frame are not in contact and, thus, do not participate in force transmission and affect the overall energy dissipation capacity of the frame structure [19].

2.2. Experimental Program

2.2.1. Experimental Design

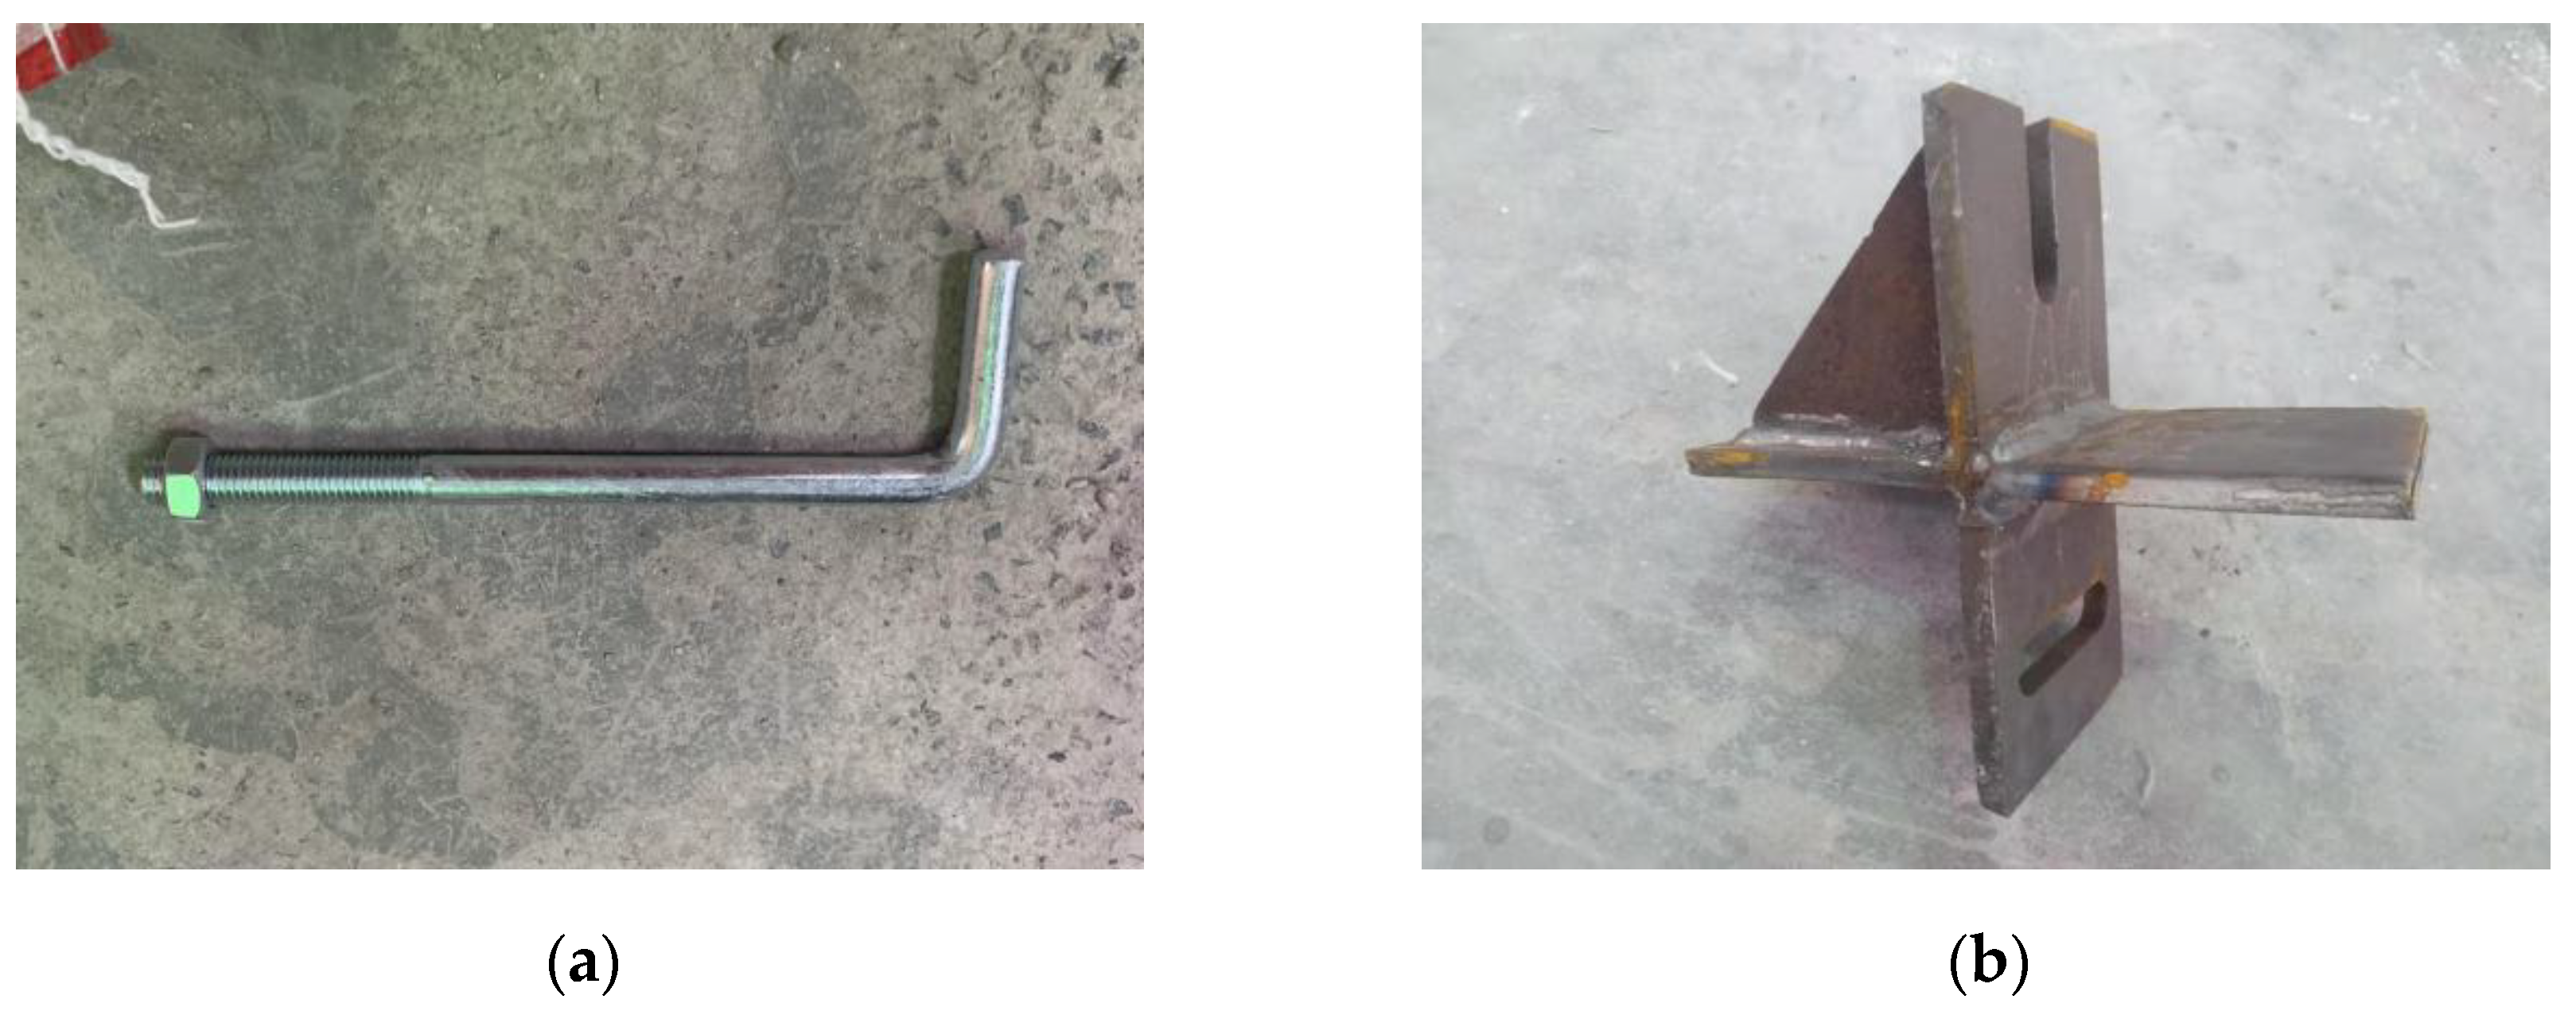
The test was conducted in the Key Laboratory of Building Structures and Underground Engineering in Anhui Province, China. To study the seismic performance of the NEDC, two sets of specimens (SF-1 and SF-2) were prepared for conducting comparison tests. The test groups are shown in Table 1; SF-1 uses hook head bolts as AAC wall panel connectors, and SF-2 uses the NEDC. Figure 6 shows the two connectors used to connect the AAC wall panels with the assembled steel frames.
According to GB 50011-2010 [20], the design of a single-story single-span planar steel frame was tested statically. The test piece was designed as a steel frame with a floor height of 3000 mm and a span of 3400 mm. The beams, columns, and footings used for the test were made of Q235 steel, and Q345 steel was used in the NEDC. Before the test, based on GB/T 228.1-2010 [21], tensile tests were performed on each part of the steel with different thicknesses. The properties of the steel used are shown in Table 2.
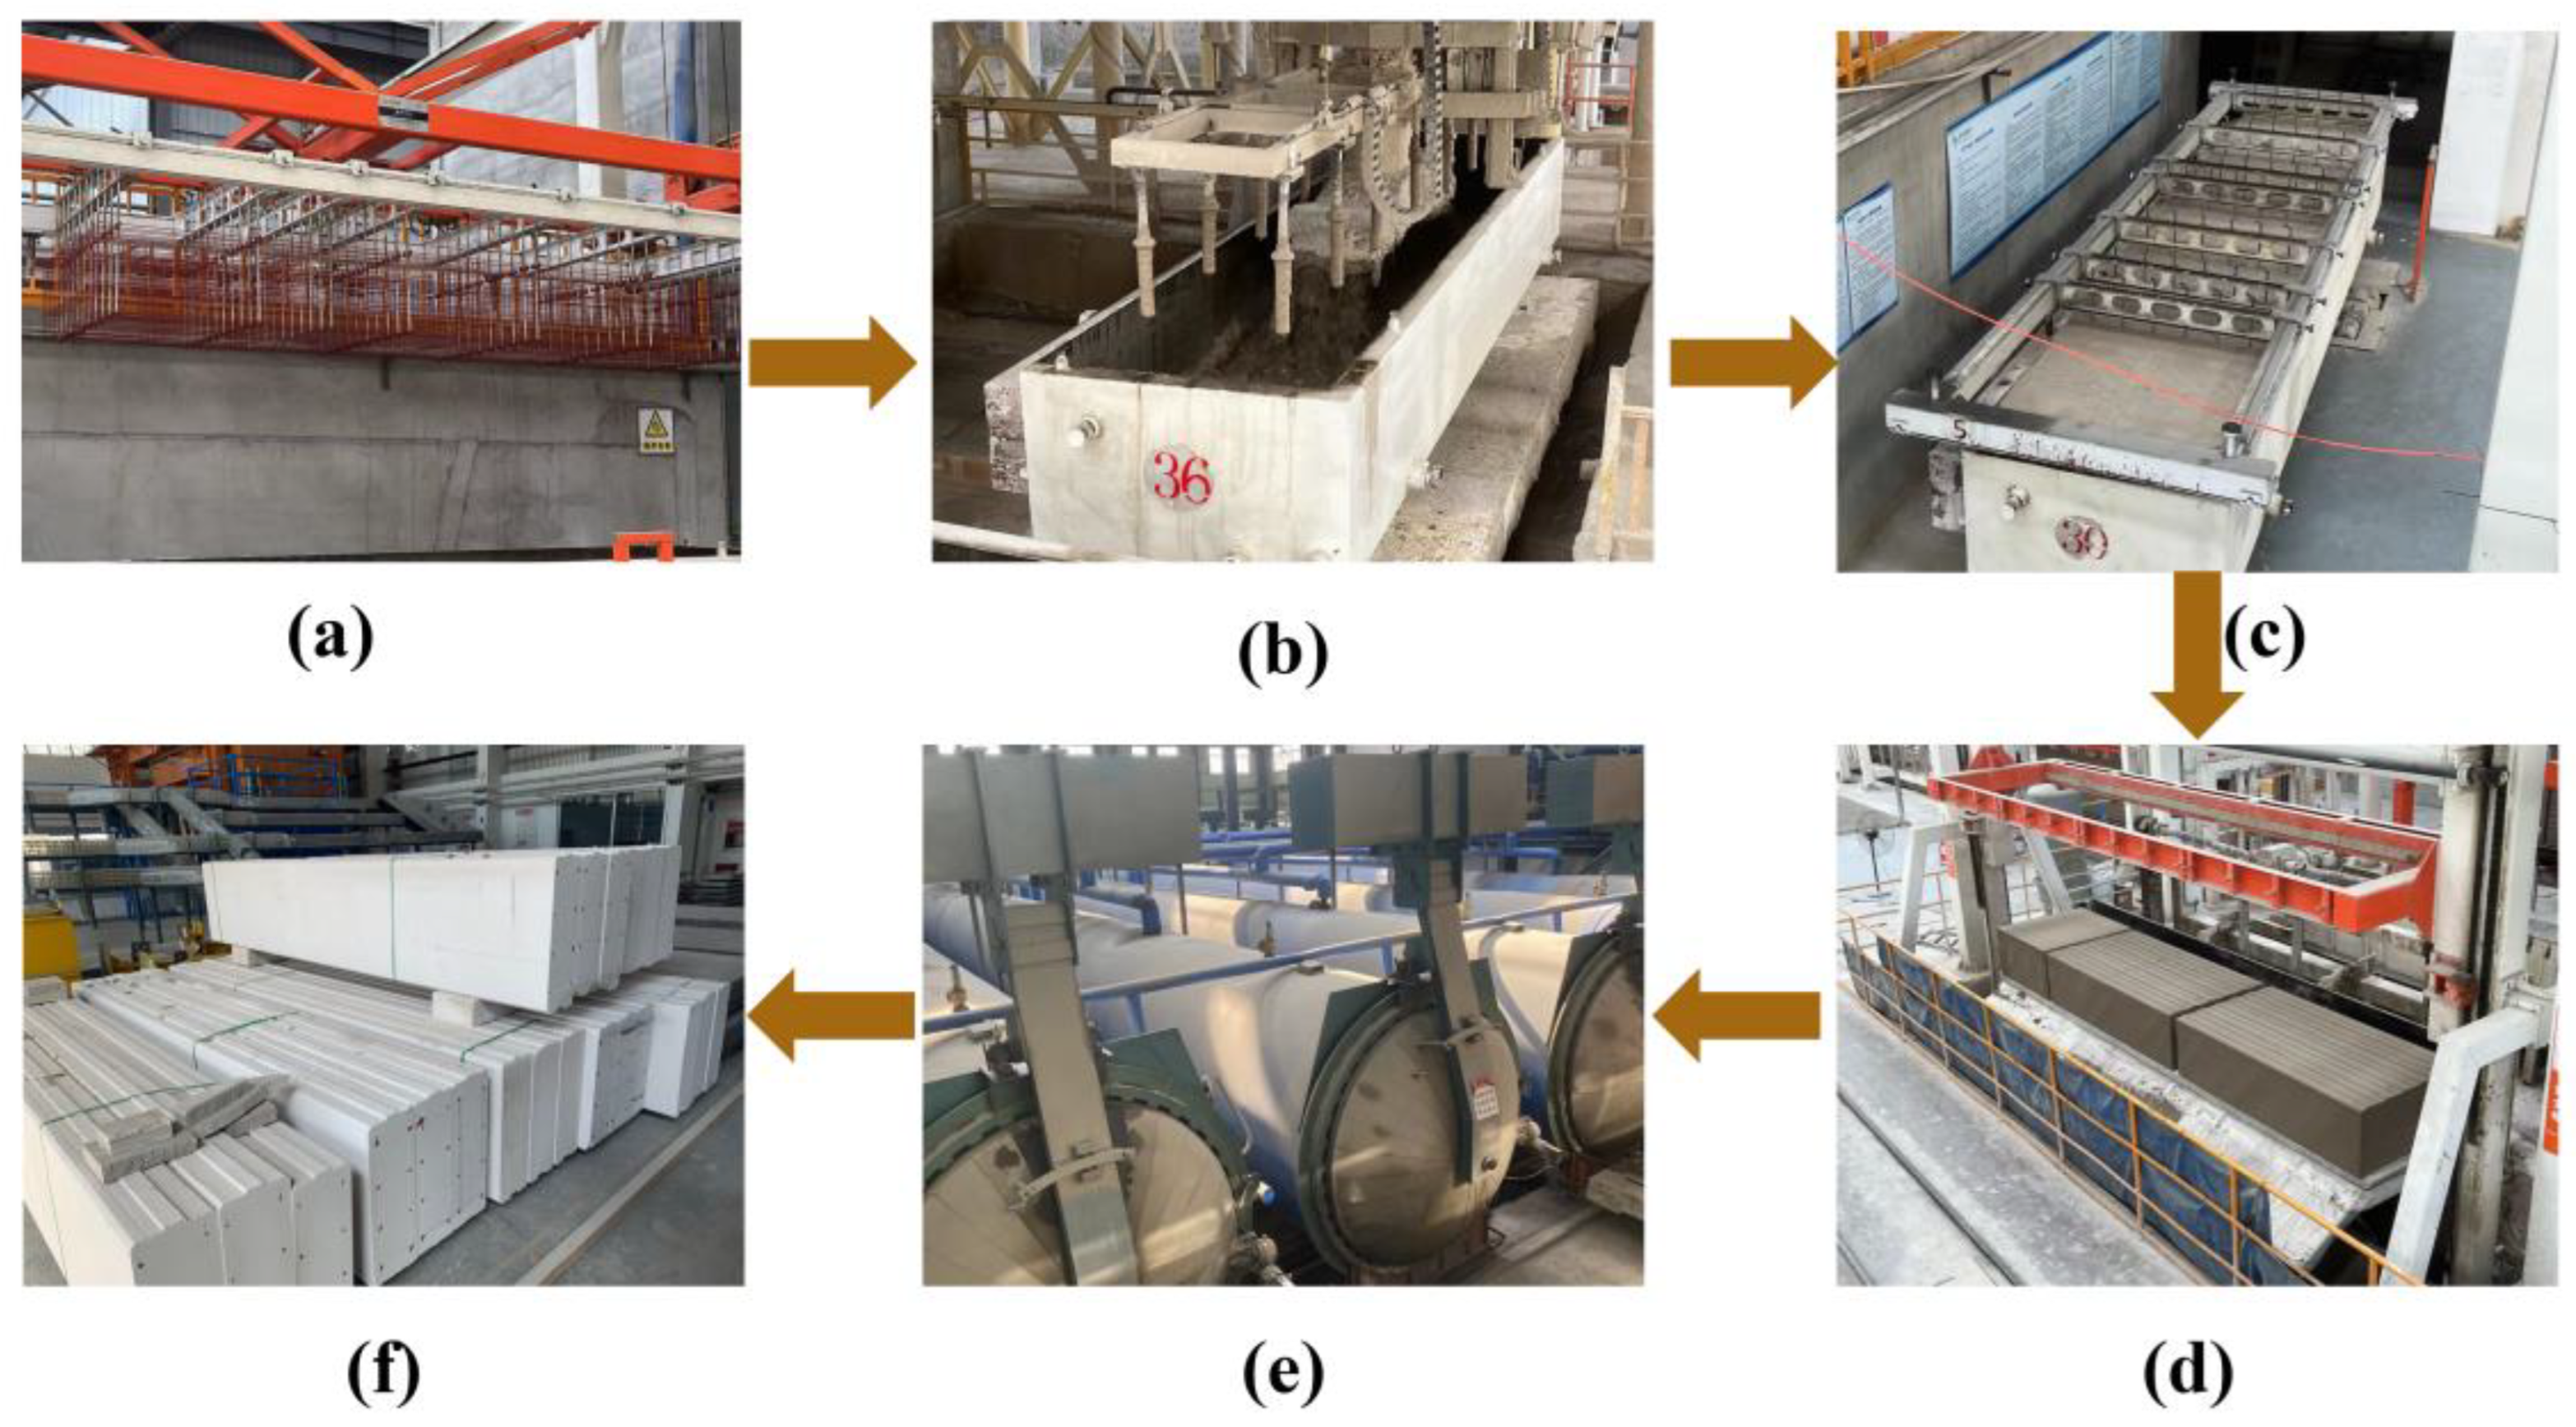
The AAC wall panels used in the test were produced by Anhui Gaudi Environmental Protection Co. Ltd. The width, height, and thickness of the wall panel were 600, 3000, and 200 mm, respectively. The production process of the AAC wall panel is shown in Figure 7: First, the rebar is tied according to the design size, and the tied rebar is placed in a preservative liquid before being subjected to air-drying. Second, the surface of the molds used for wall panel production are coated with an anti-adhesive oil to facilitate the release of the molds after concrete formation. Subsequently, the air-dried steel mesh is placed inside the mold, and one-third of the concrete grout is injected into the mold to complete the pouring process. The main components of the concrete grout are cement, slag, river sand, and fly ash. Third, the formwork and concrete slurry are maintained in a curing room at 45 °C for three h. The concrete slurry can react, produce gas, and expand to reach the initial setting strength. The concrete sample that reached its initial setting strength is molded, and the concrete is transported to the cutting station after demolding is completed. The concrete is surface finished and cut to custom sizes. The remaining trimmings from cutting can be recycled to make a new concrete slurry that can be put back into production. Then, the cut concrete is numbered and transferred to the reactor and subjected to oxygenation and pre-culture in the reaction kettle for 3 h. Finally, after the finished concrete is formed by controlling the reactor’s temperature, humidity, and pressure (Figure 7f), it is inspected, passed, and put into use. The basic properties of the AAC wall panel after material testing are shown in Table 3 [22].

2.2.2. Specimen Assembly

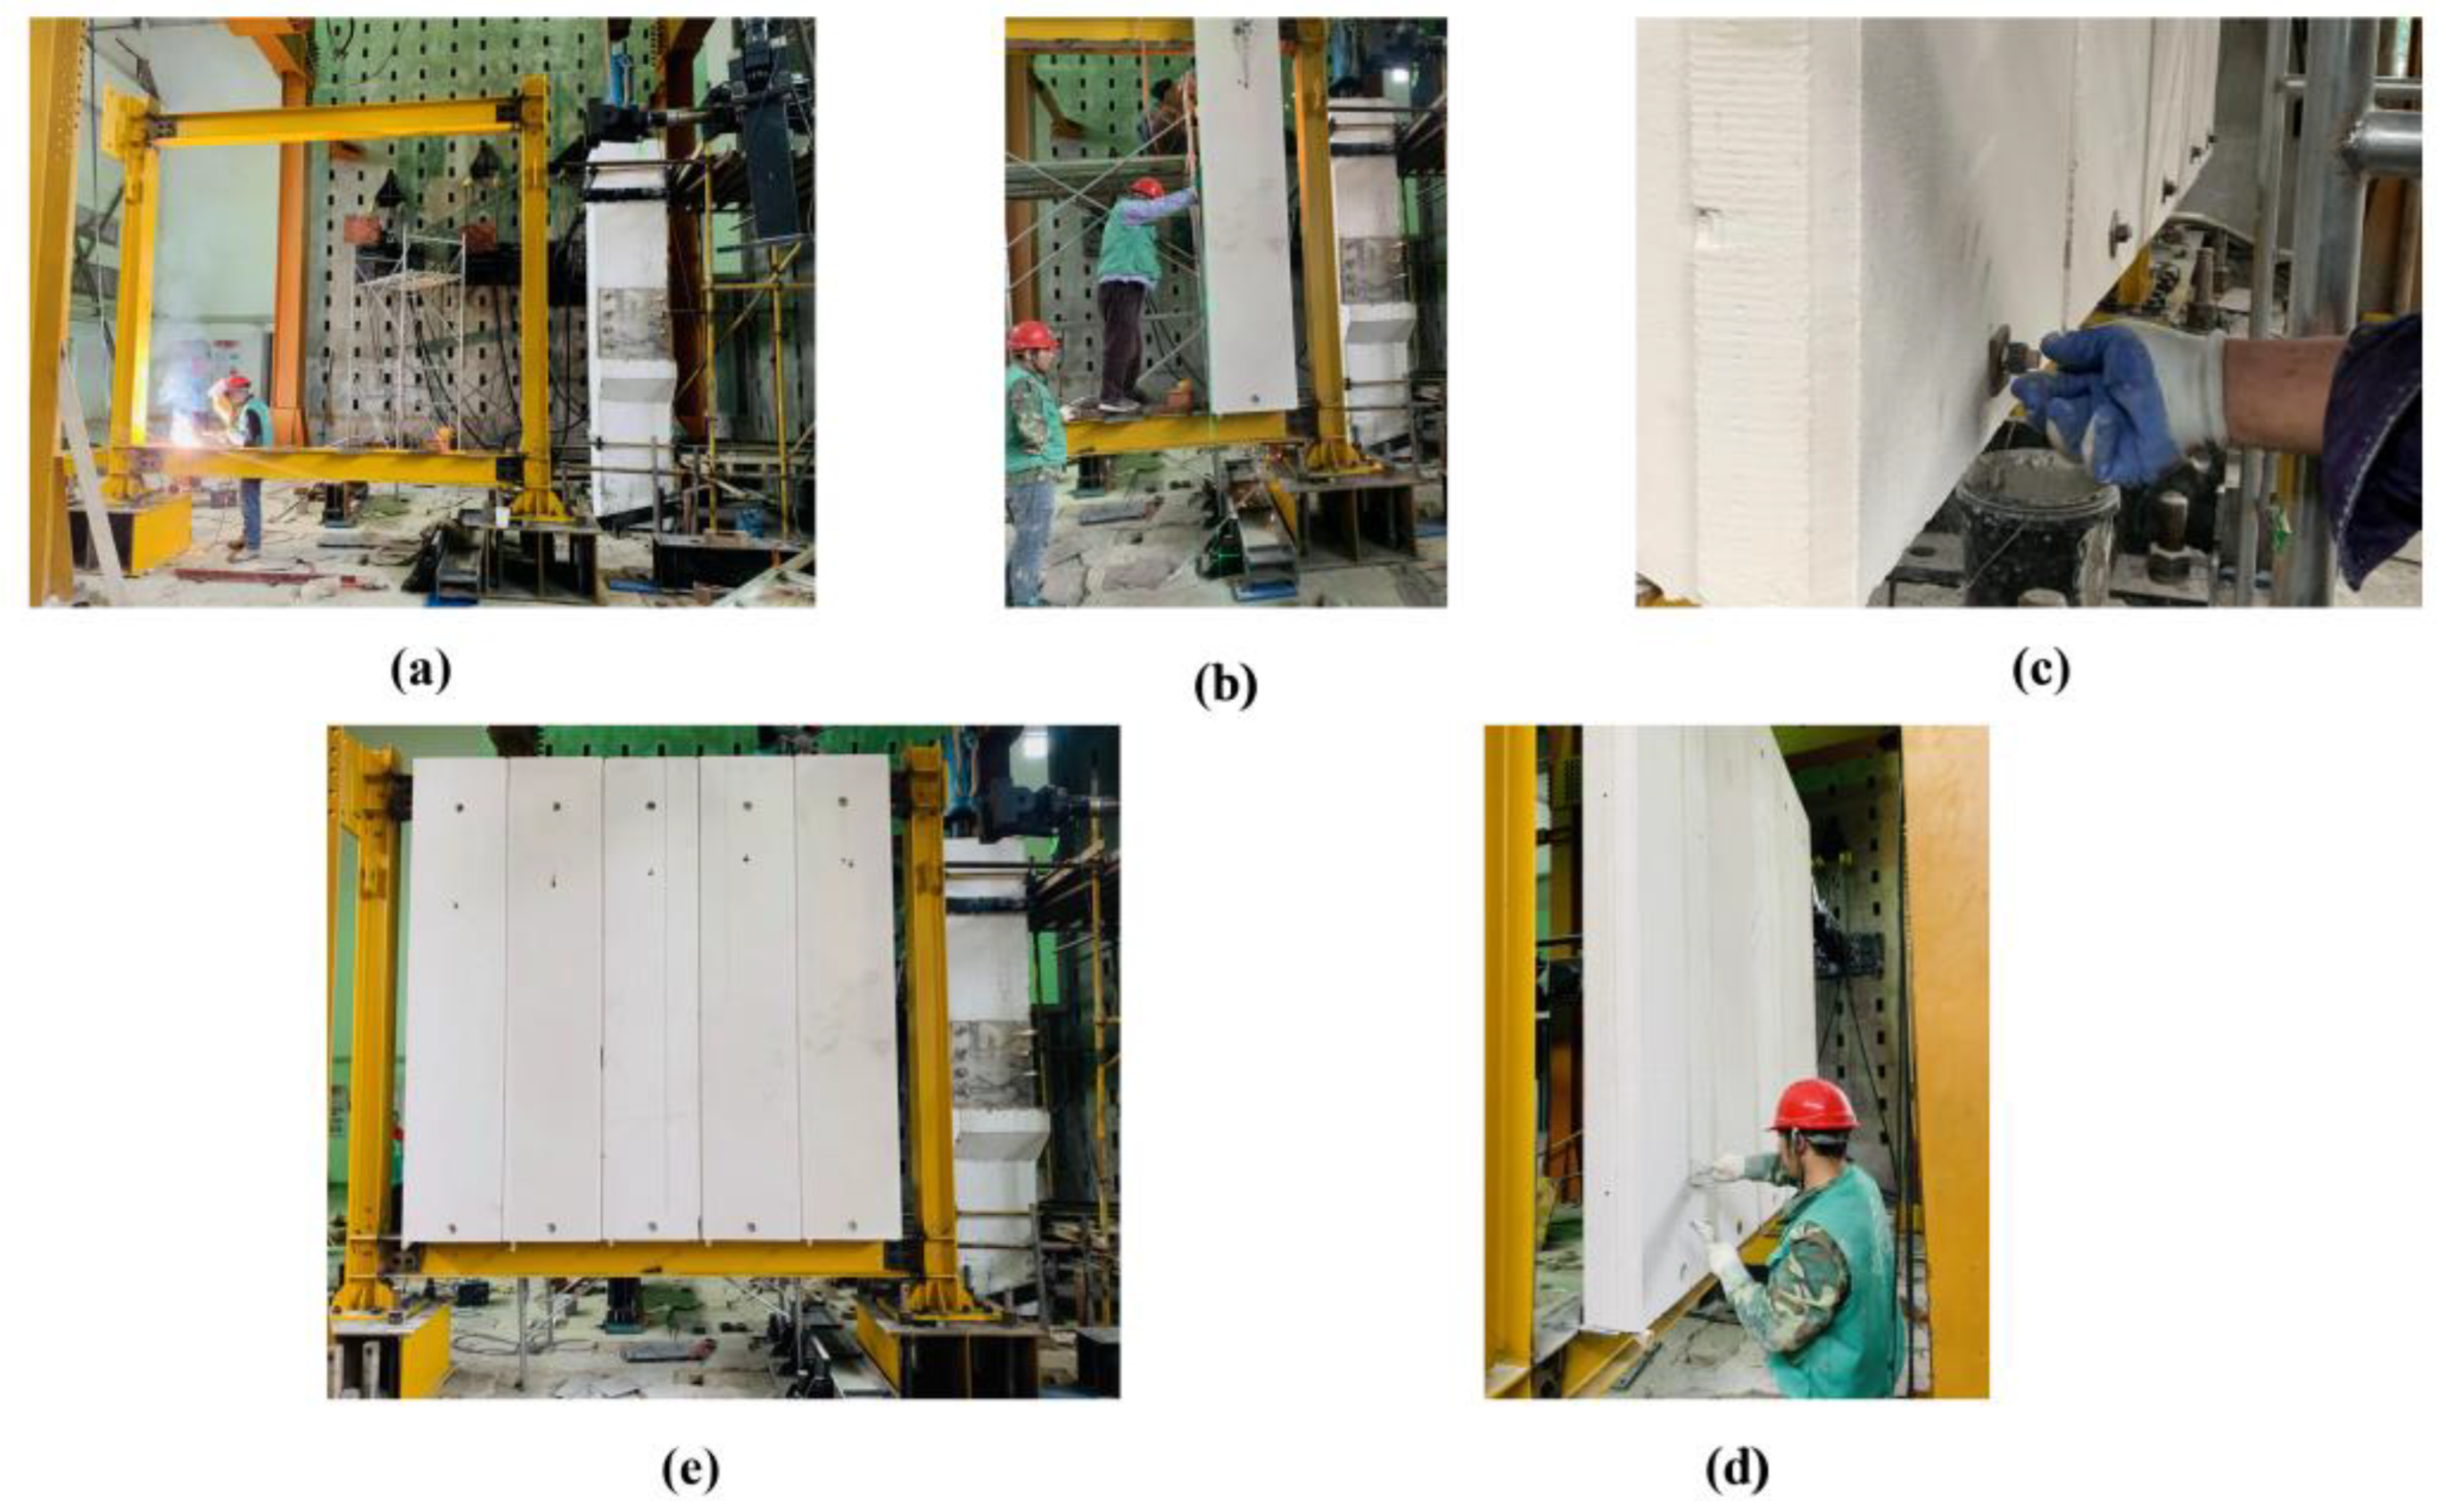
All steel components, such as beams, columns, and ground beams, were produced and processed at the factory according to design dimensions. The components were machined and transported to the laboratory, where they were assembled. The steel beams were connected to the steel columns using a combination of bolts and welding. The AAC wall panels were installed after the steel frame assembly was completed. The installation steps are shown in Figure 8: First, the hook bolt or NEDC is placed at the appropriate location in the steel beam design. Second, holes are cut in the wall panel at the designed location according to the bolt size. Third, the wall plate is lifted, and the bolts are installed. Finally, a mortar joint is applied to the AAC wallboard joints. After using AAC wall panel joint mortar, the connection is maintained for 24 h until the mortar is dry. Only then can the test be carried out.

2.2.3. Loading Scheme and Test Equipment

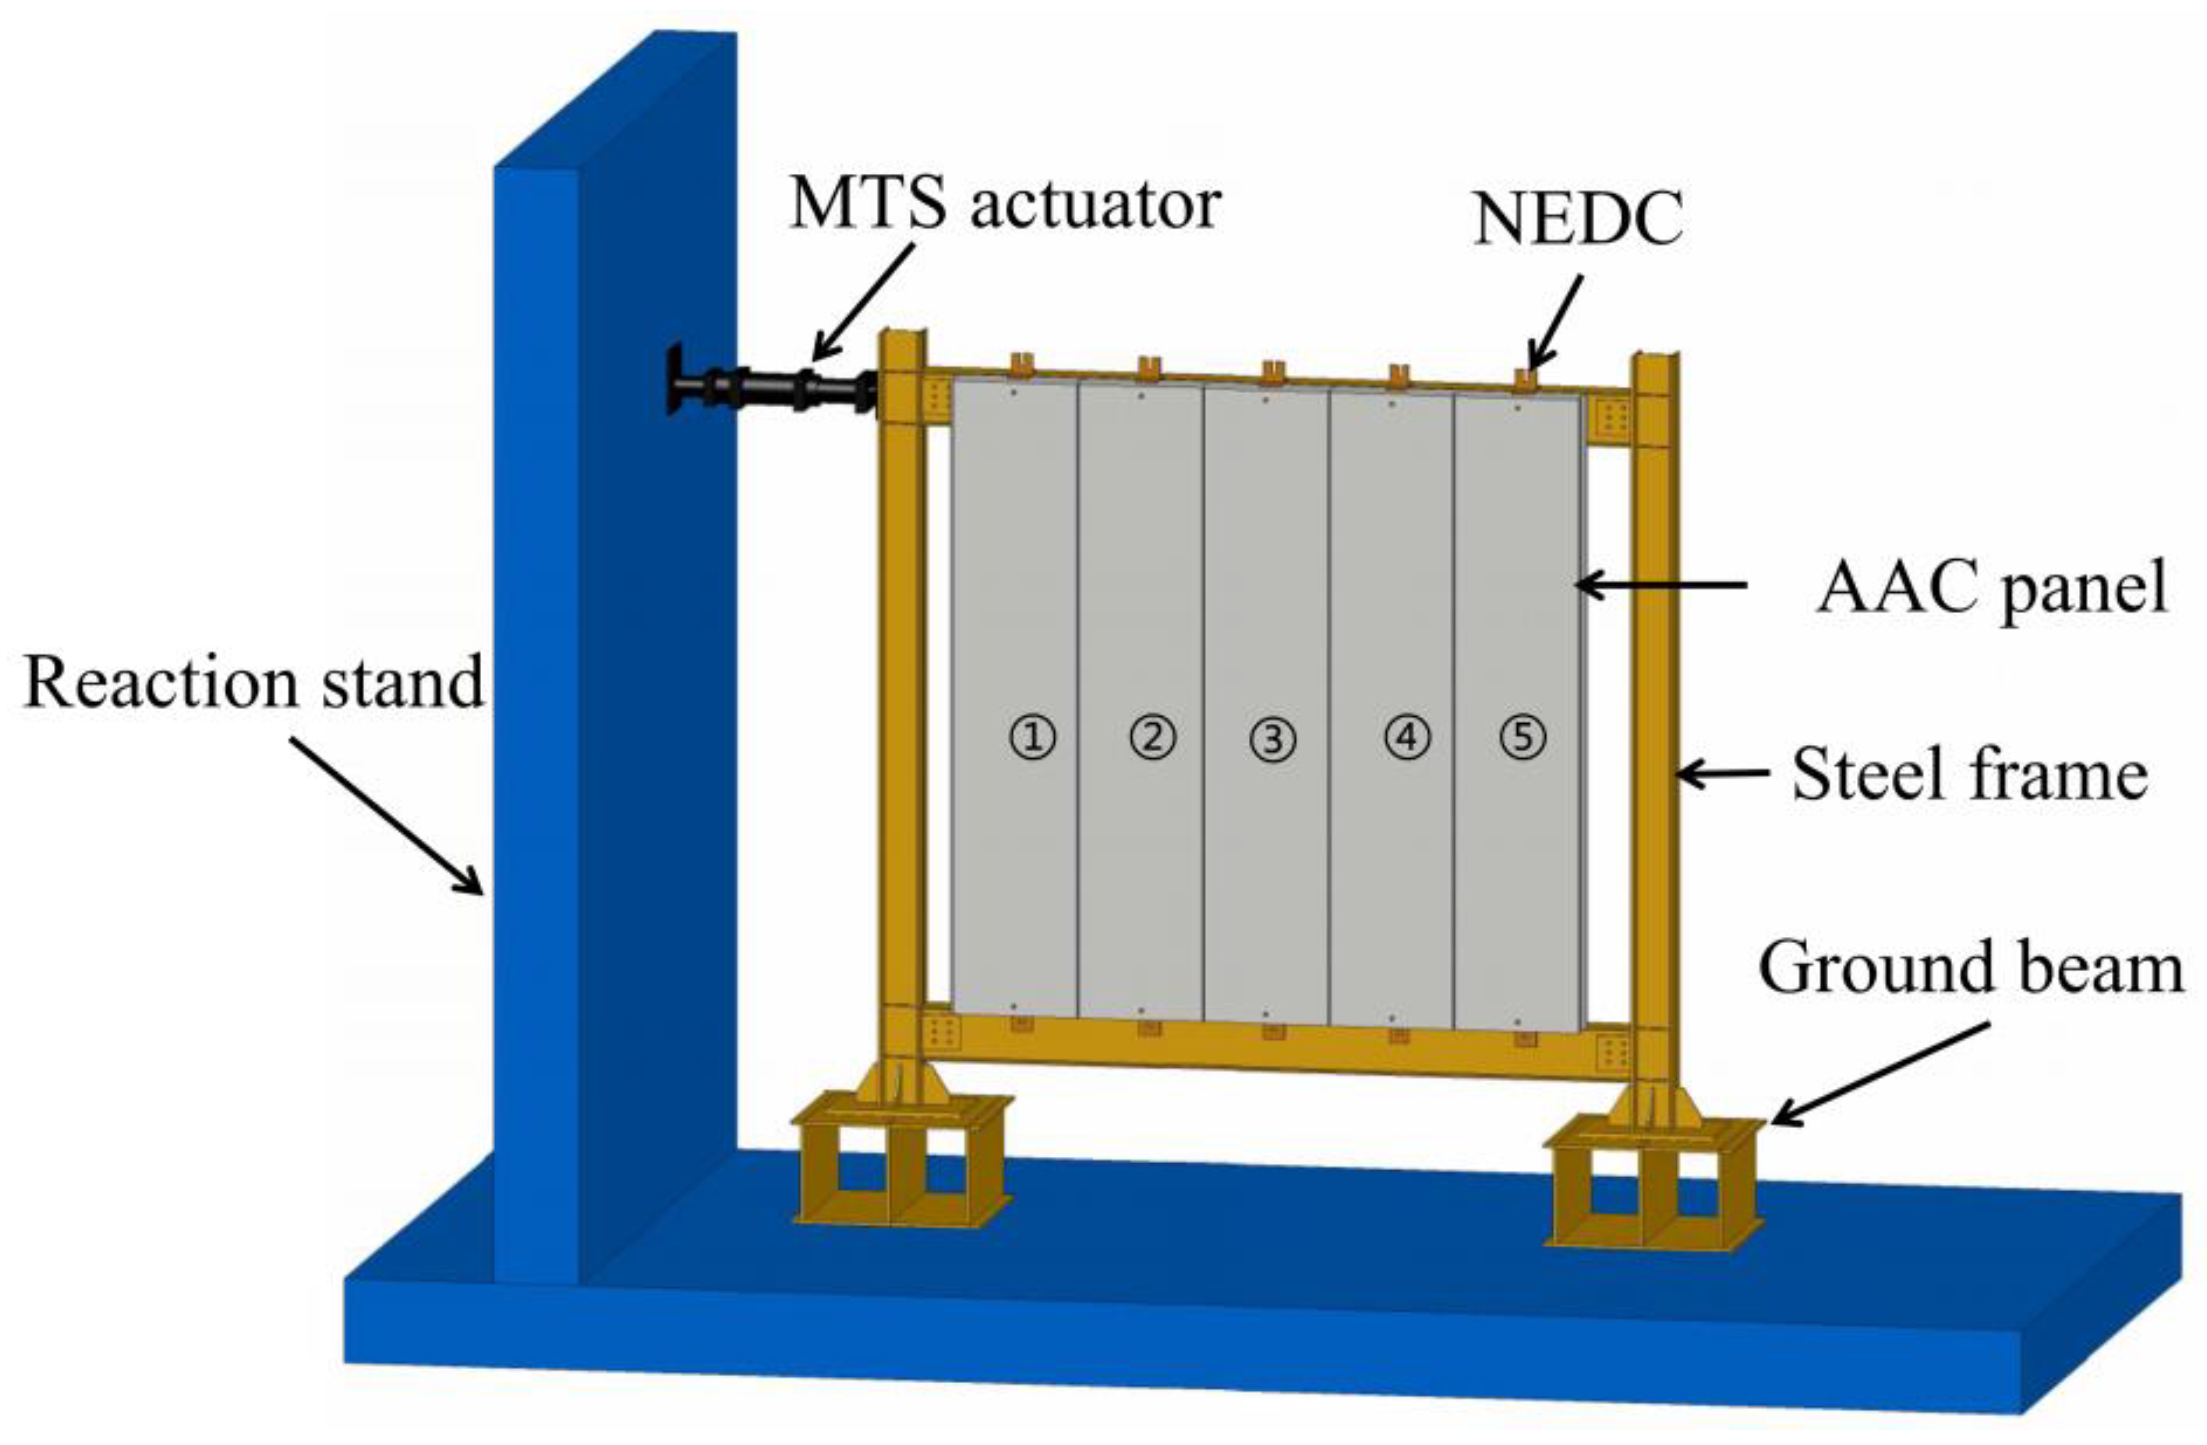
The test loading device is shown in Figure 9. The proposed static test was performed under horizontal low-cyclic reciprocating loading by using the MTS servo loading system. The MTS actuator has a displacement stroke of 500 mm and a loading rate of 0.5 mm/s. A quasistatic loading system was also used for this test. The column’s highest point was subjected to horizontal and low-cyclic reciprocating loading. The actuator was designed to ensure that the structure was loaded and unloaded repeatedly in the positive direction (PD) and negative direction (ND) to simulate the structural forces and deformations under reciprocal shaking during earthquakes [23].
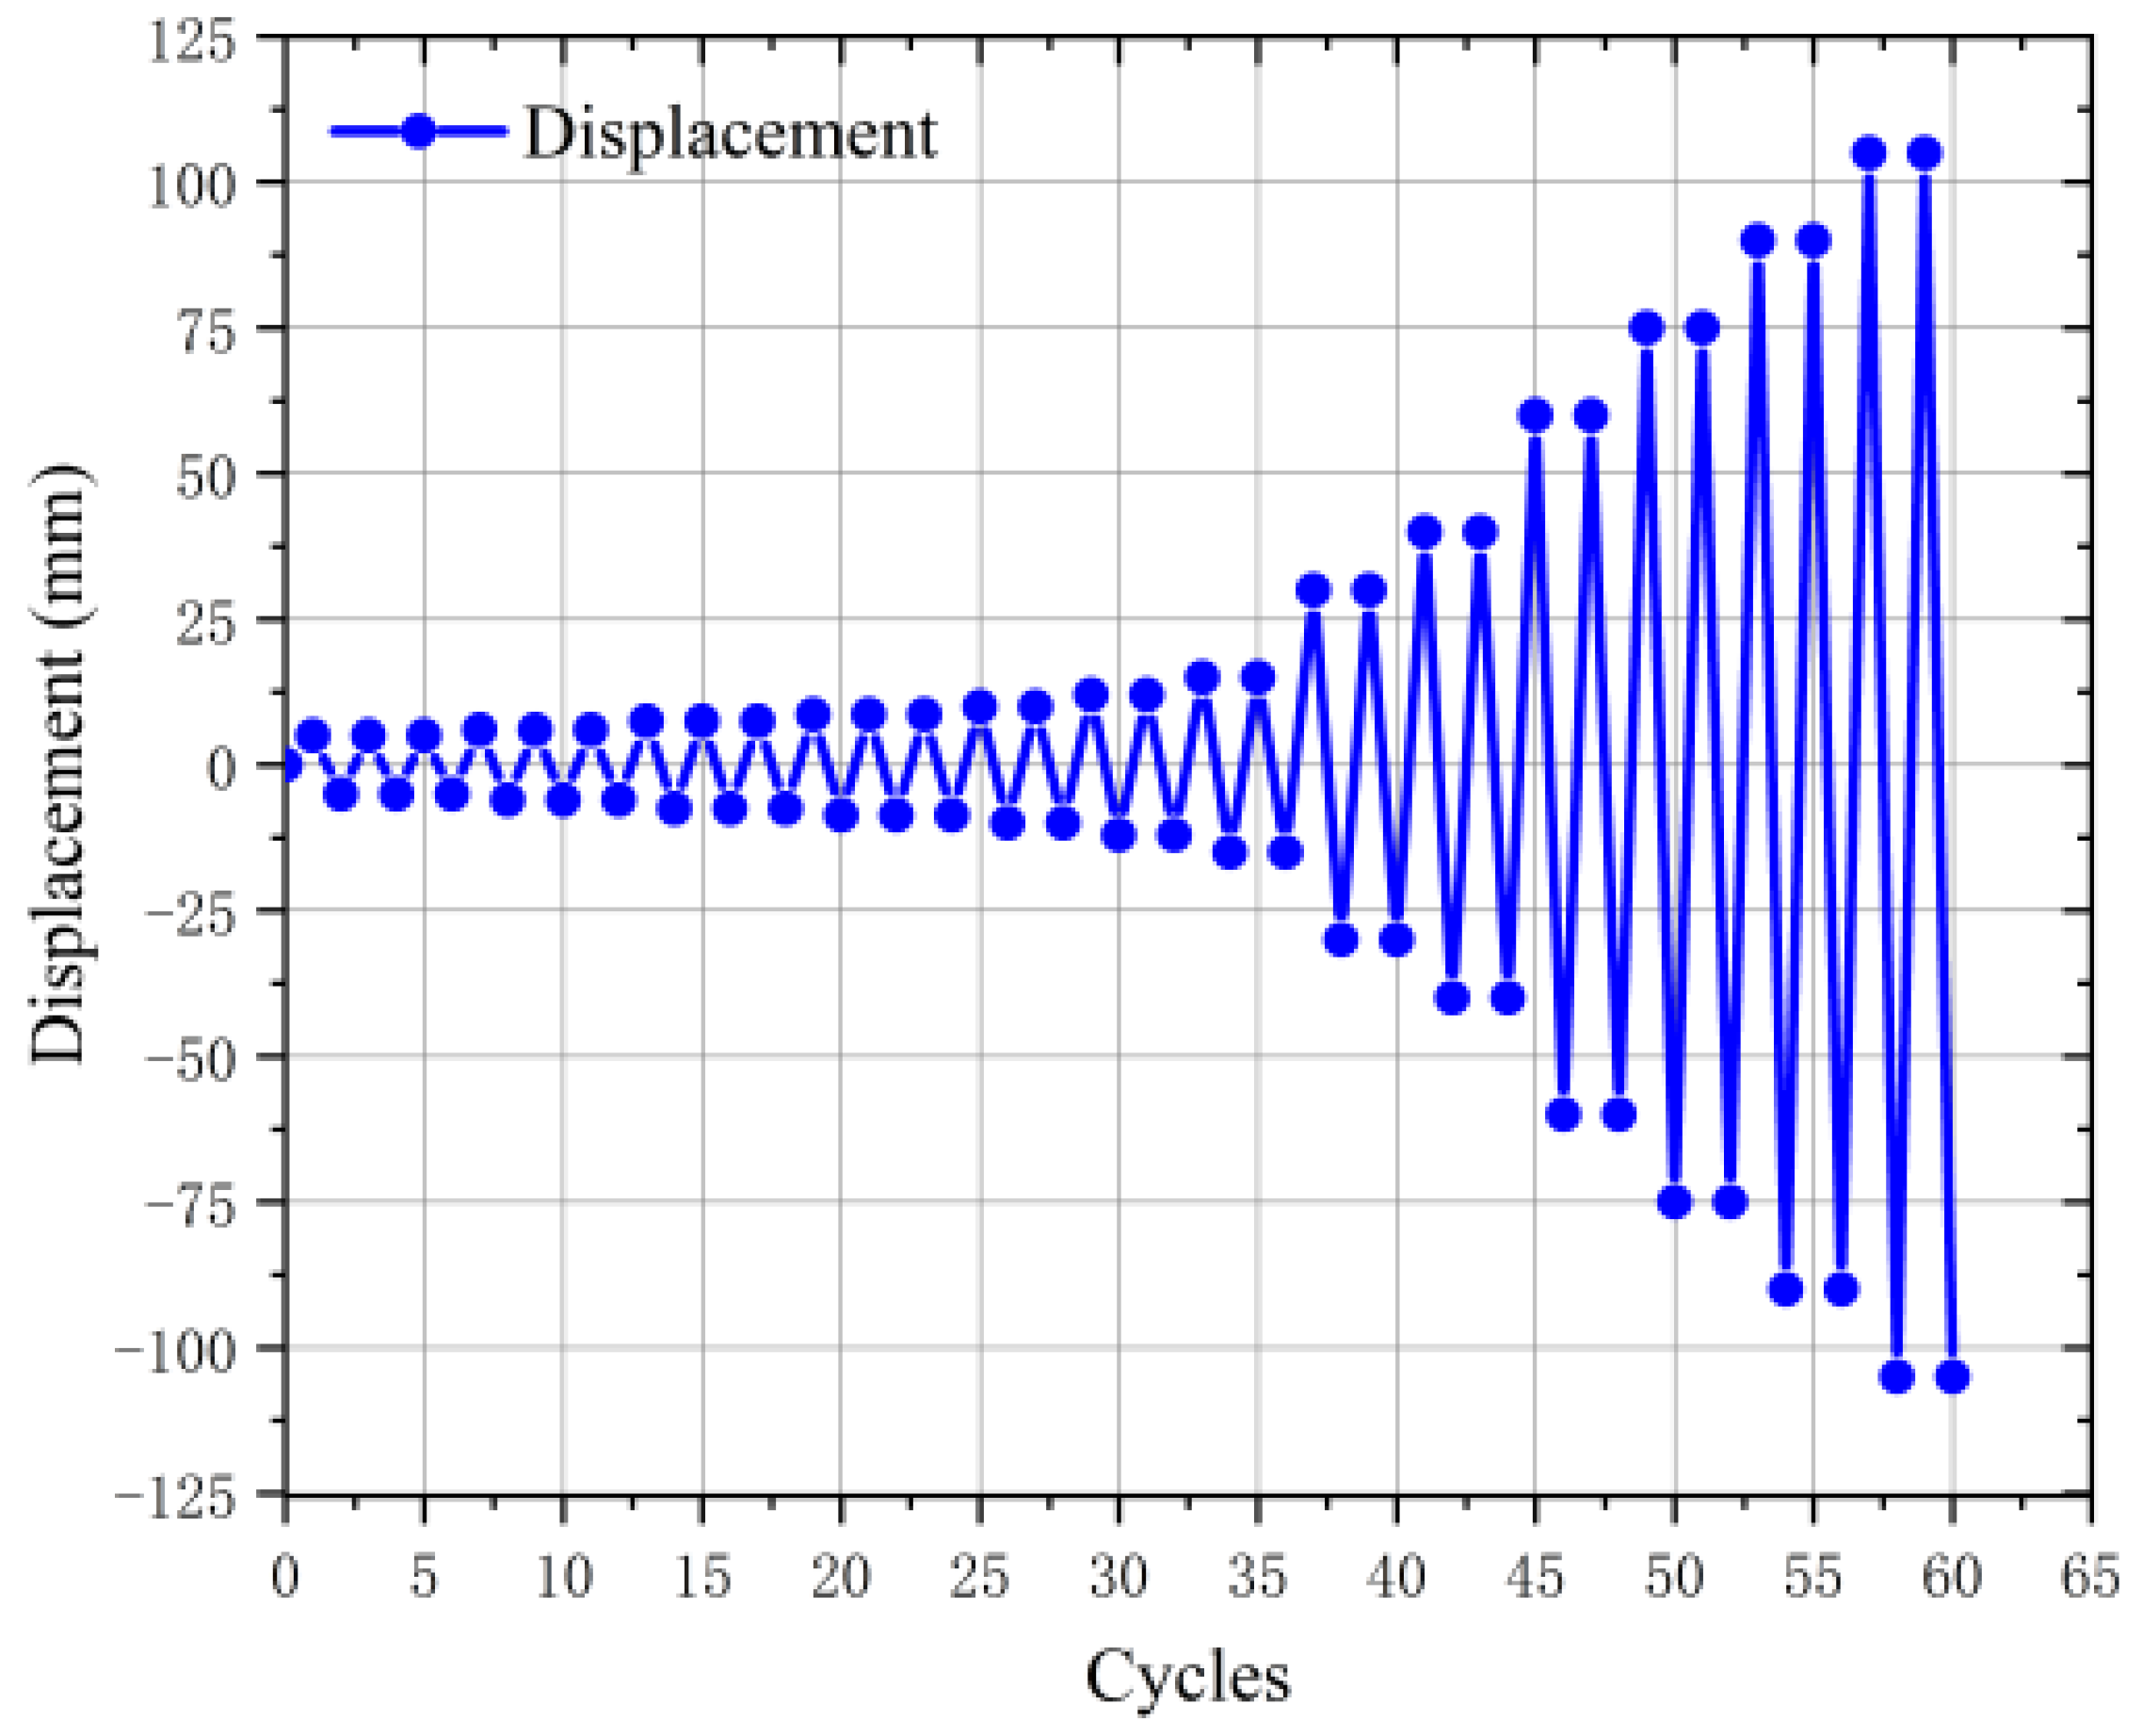
The test employed a slow and continuous loading method. According to the provisions in the GB 50011-2010, three joints with a thickness of 2 mm were preloaded to ensure that there was no gap between the actuator and the steel frame. Consequently, the frame was installed, and the components were connected successfully. The interlayer displacement angles of 1/600, 1/500, 1/400, 1/200, 1/100, and 1/50 were used to control the loading. The test ended when key parts, such as the beam-column joints, were damaged or when the structural load carrying capacity was reduced to less than 85% of the ultimate load [24]. The test loading regime is shown in Figure 10.
Displacement gauges were arranged symmetrically at both ends of the steel beam to measure the displacement of the beam ends. Similarly, displacement gauges were arranged symmetrically at both ends of the lower end plate of the steel beam to measure the normal phase displacement, from which the relative turning angle was calculated. Displacement meters were arranged at the ground beam to determine whether relative sliding occurred during specimen loading [25]. As shown in Figure 11a, the displacement was measured using a spring-loaded self-resetting linear displacement sensor. As shown in Figure 11b, the strain and displacement data were collected using the DH3818Y LCD static strain test system produced by Donghua Test Corporation. As shown in Figure 11c, a crack width tester was used to observe cracks.
During the installation of the steel frame, the AAC wall panel and steel frame were connected to the MTS servo loading system in the same manner as in Figure 9. Preloading is performed after the connection is completed to ensure that the MTS servo loading is firmly connected to the steel frame. Before the test starts, the test apparatuses shown in Figure 11a,b are installed at the foot of the column and at the end of the beam according to the test design position. The purpose of using displacement meters is to measure and determine if there is out-of-plane displacement and rotation as a way to ensure that the MTS is loaded on the same level. After the test preloading was completed, the loading regime was carried out slowly and smoothly according to Figure 10. Throughout the test, Figure 11c was used to observe the cracks produced by the wall panels. The crack observer measures the width of the cracks. It is recorded and labeled during the test.

3. Test Damage Form and Characteristics

3.1. Damage Mechanism of Specimen SF-1

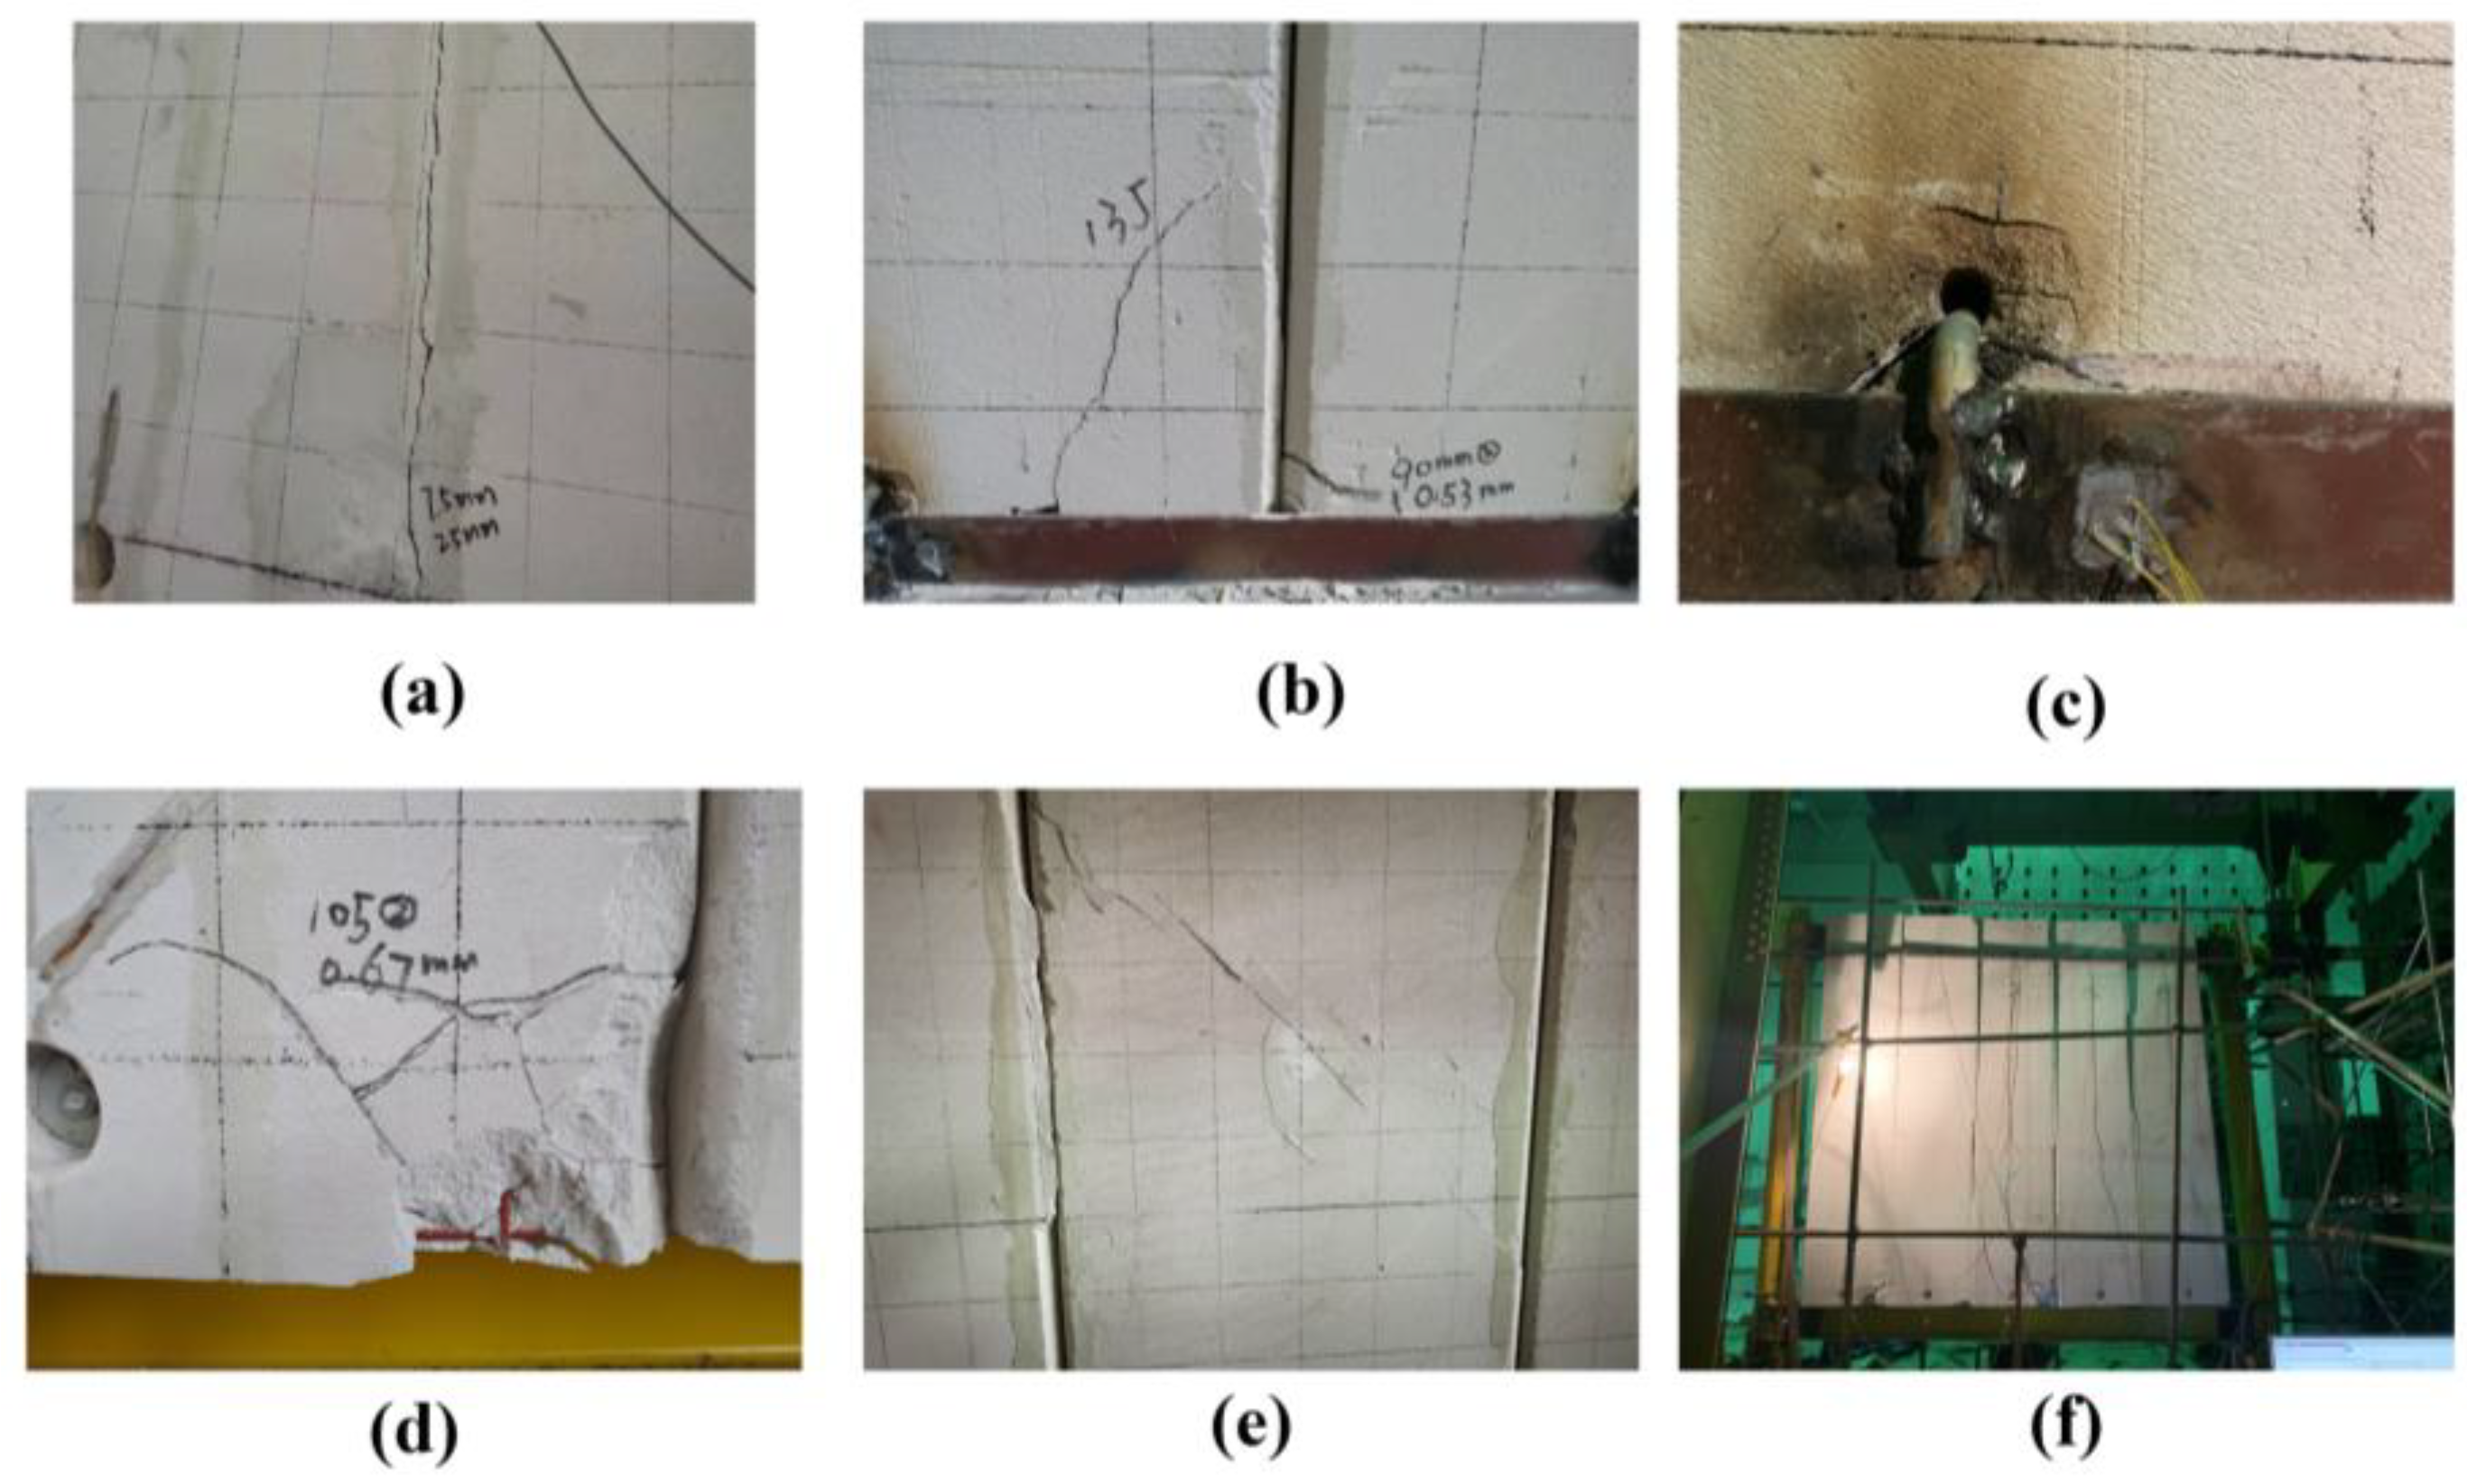
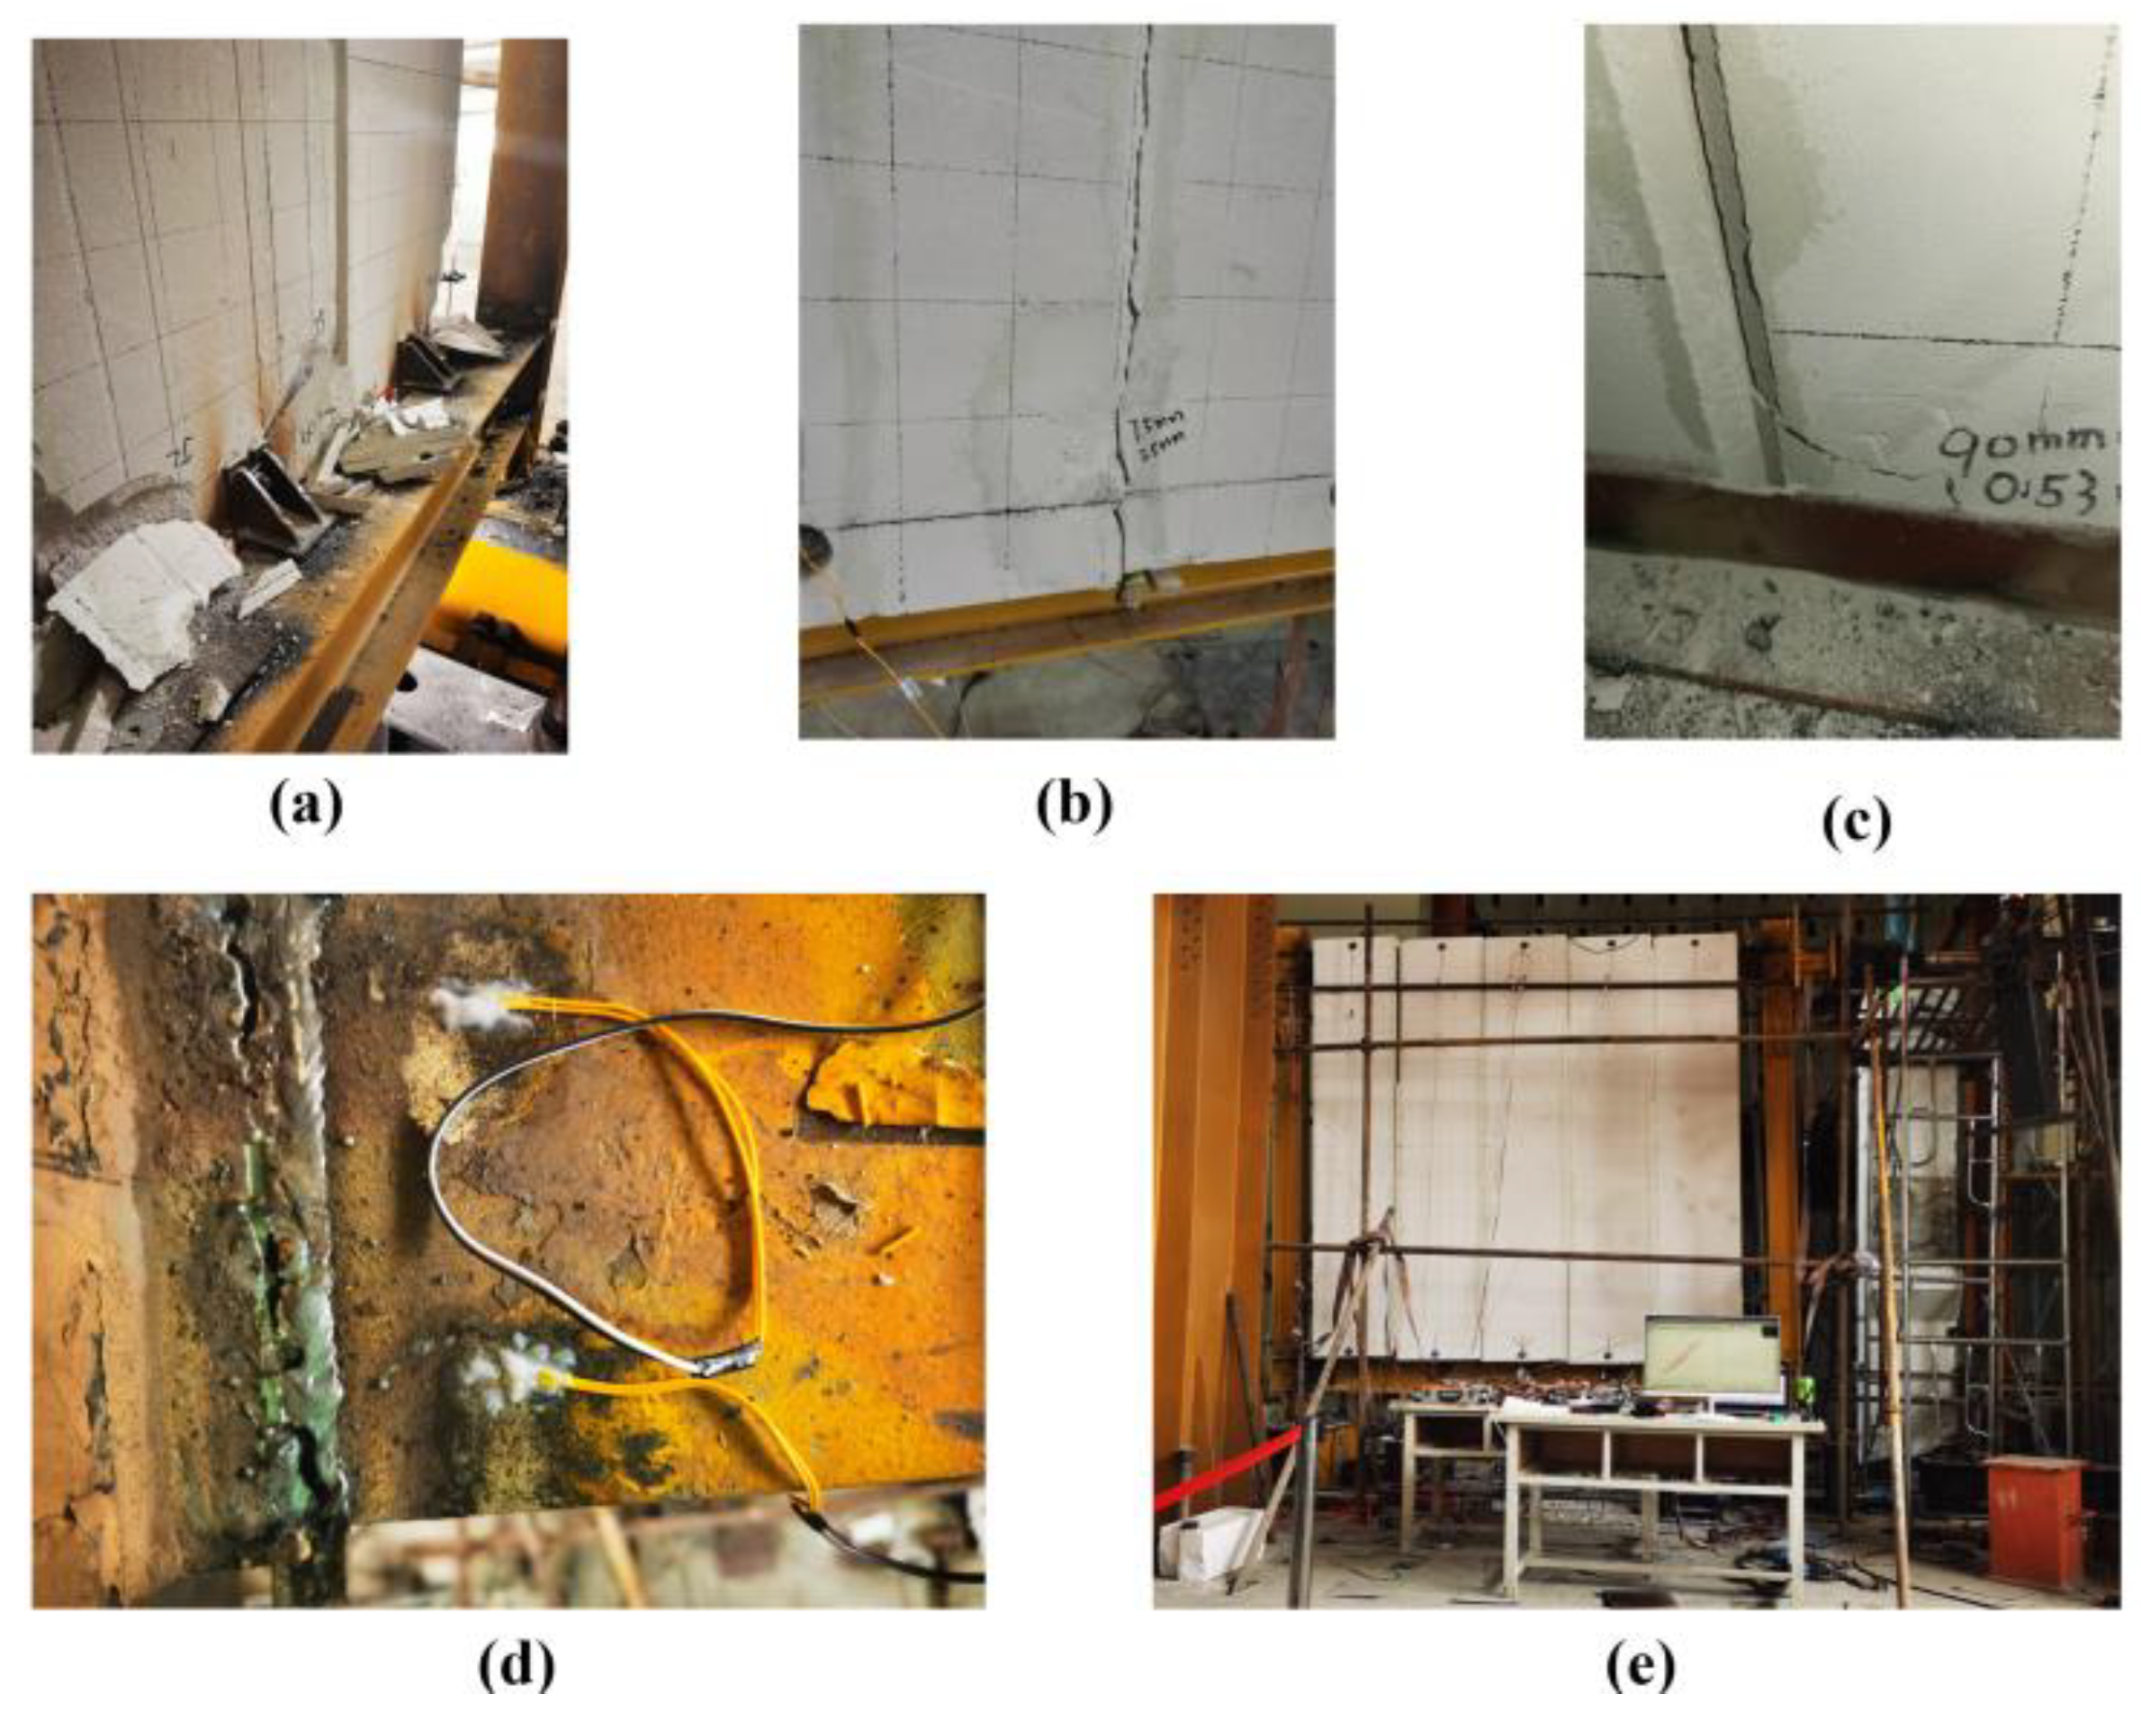
The damage form of specimen SF-1 is shown in Figure 12. At an interlayer displacement angle of 1/500, cracks appear in the mortar joints below wall panels No. 1 and No. 2. As the loading displacement increased, the length, width, and number of cracks increased. When the interlayer displacement angle was 1/350, there was a noticeable extrusion sound between the panels, and the mortar of the joints between panels No. 1 and No. 2 began to fall off. When the interlayer displacement angle was 1/200, each panel’s mortar fell off and the misalignment between the slabs was apparent. Cracks appeared in the bolted hole slab joints of plate No. 3 when the interlayer displacement angle was 1/75. The cracks in the bolt holes continued to extend as the displacement loading increased. When the interlayer displacement angle was 1/40, extensive crushing occurred in each panel corner, and cracks appeared in the lower bolt holes of the No. 4 and No. 5 panels. The cracks continued to extend as the displacement loading increased. Oblique cracks appeared in wall panel No. 3 when the interlayer displacement angle was 1/25. At this point, the beam-column weld was fractured, and the test was concluded.

3.2. Damage Mechanism of Specimen SF-2

The damage form of specimen SF-2 is shown in Figure 13. A small number of broken pieces of the AAC panel came off when the interlayer displacement angle was 1/75. Micro cracks were produced at the corner of panel No. 5. When the interlayer displacement angle was 1/50, the mortar of the joints between panels No. 1 and No. 2 was broken, and cracks appeared at the corners of these panels. When the interlayer displacement angle was 1/40, cracks appeared at the upper bolt holes of panels No. 2 and No. 3, and the lower node of the second panel was loose due to apparent transverse relative displacement. At a displacement loading of 90 mm, the mortar between panels No. 2 and No. 3, as well as between No. 3 and No. 4, fractured one after another; consequently, cracks continued to extend. At a displacement angle of 1/25, all the mortars between the joints fell off. When the interlayer displacement angle was 1/20, the bearing capacity dropped below 85% of the ultimate load, and the test ended with the connector undeformed.
For specimens SF-1 and SF-2, damage occurred first at the corners of the wall panels and mortars of the joints. Since specimen SF-1 used rigid connection nodes, the wall panel could not release the effect of harmful displacement. Therefore, specimen SF-1 was damaged more than specimen SF-2. With increasing displacement loading, cracks appeared between the panels and around the bolt holes in both specimens SF-1 and SF-2, and the cracks extended continuously with the increase in loading. Since the bolt holes of the NEDC used in specimen SF-2 reduce the crush damage caused to the wall panel by sliding when subjected to horizontal in-plane loading, the damage caused to the AAC wall panel of specimen SF-2 was less than that of specimen SF-1.

3.3. Crack Distribution

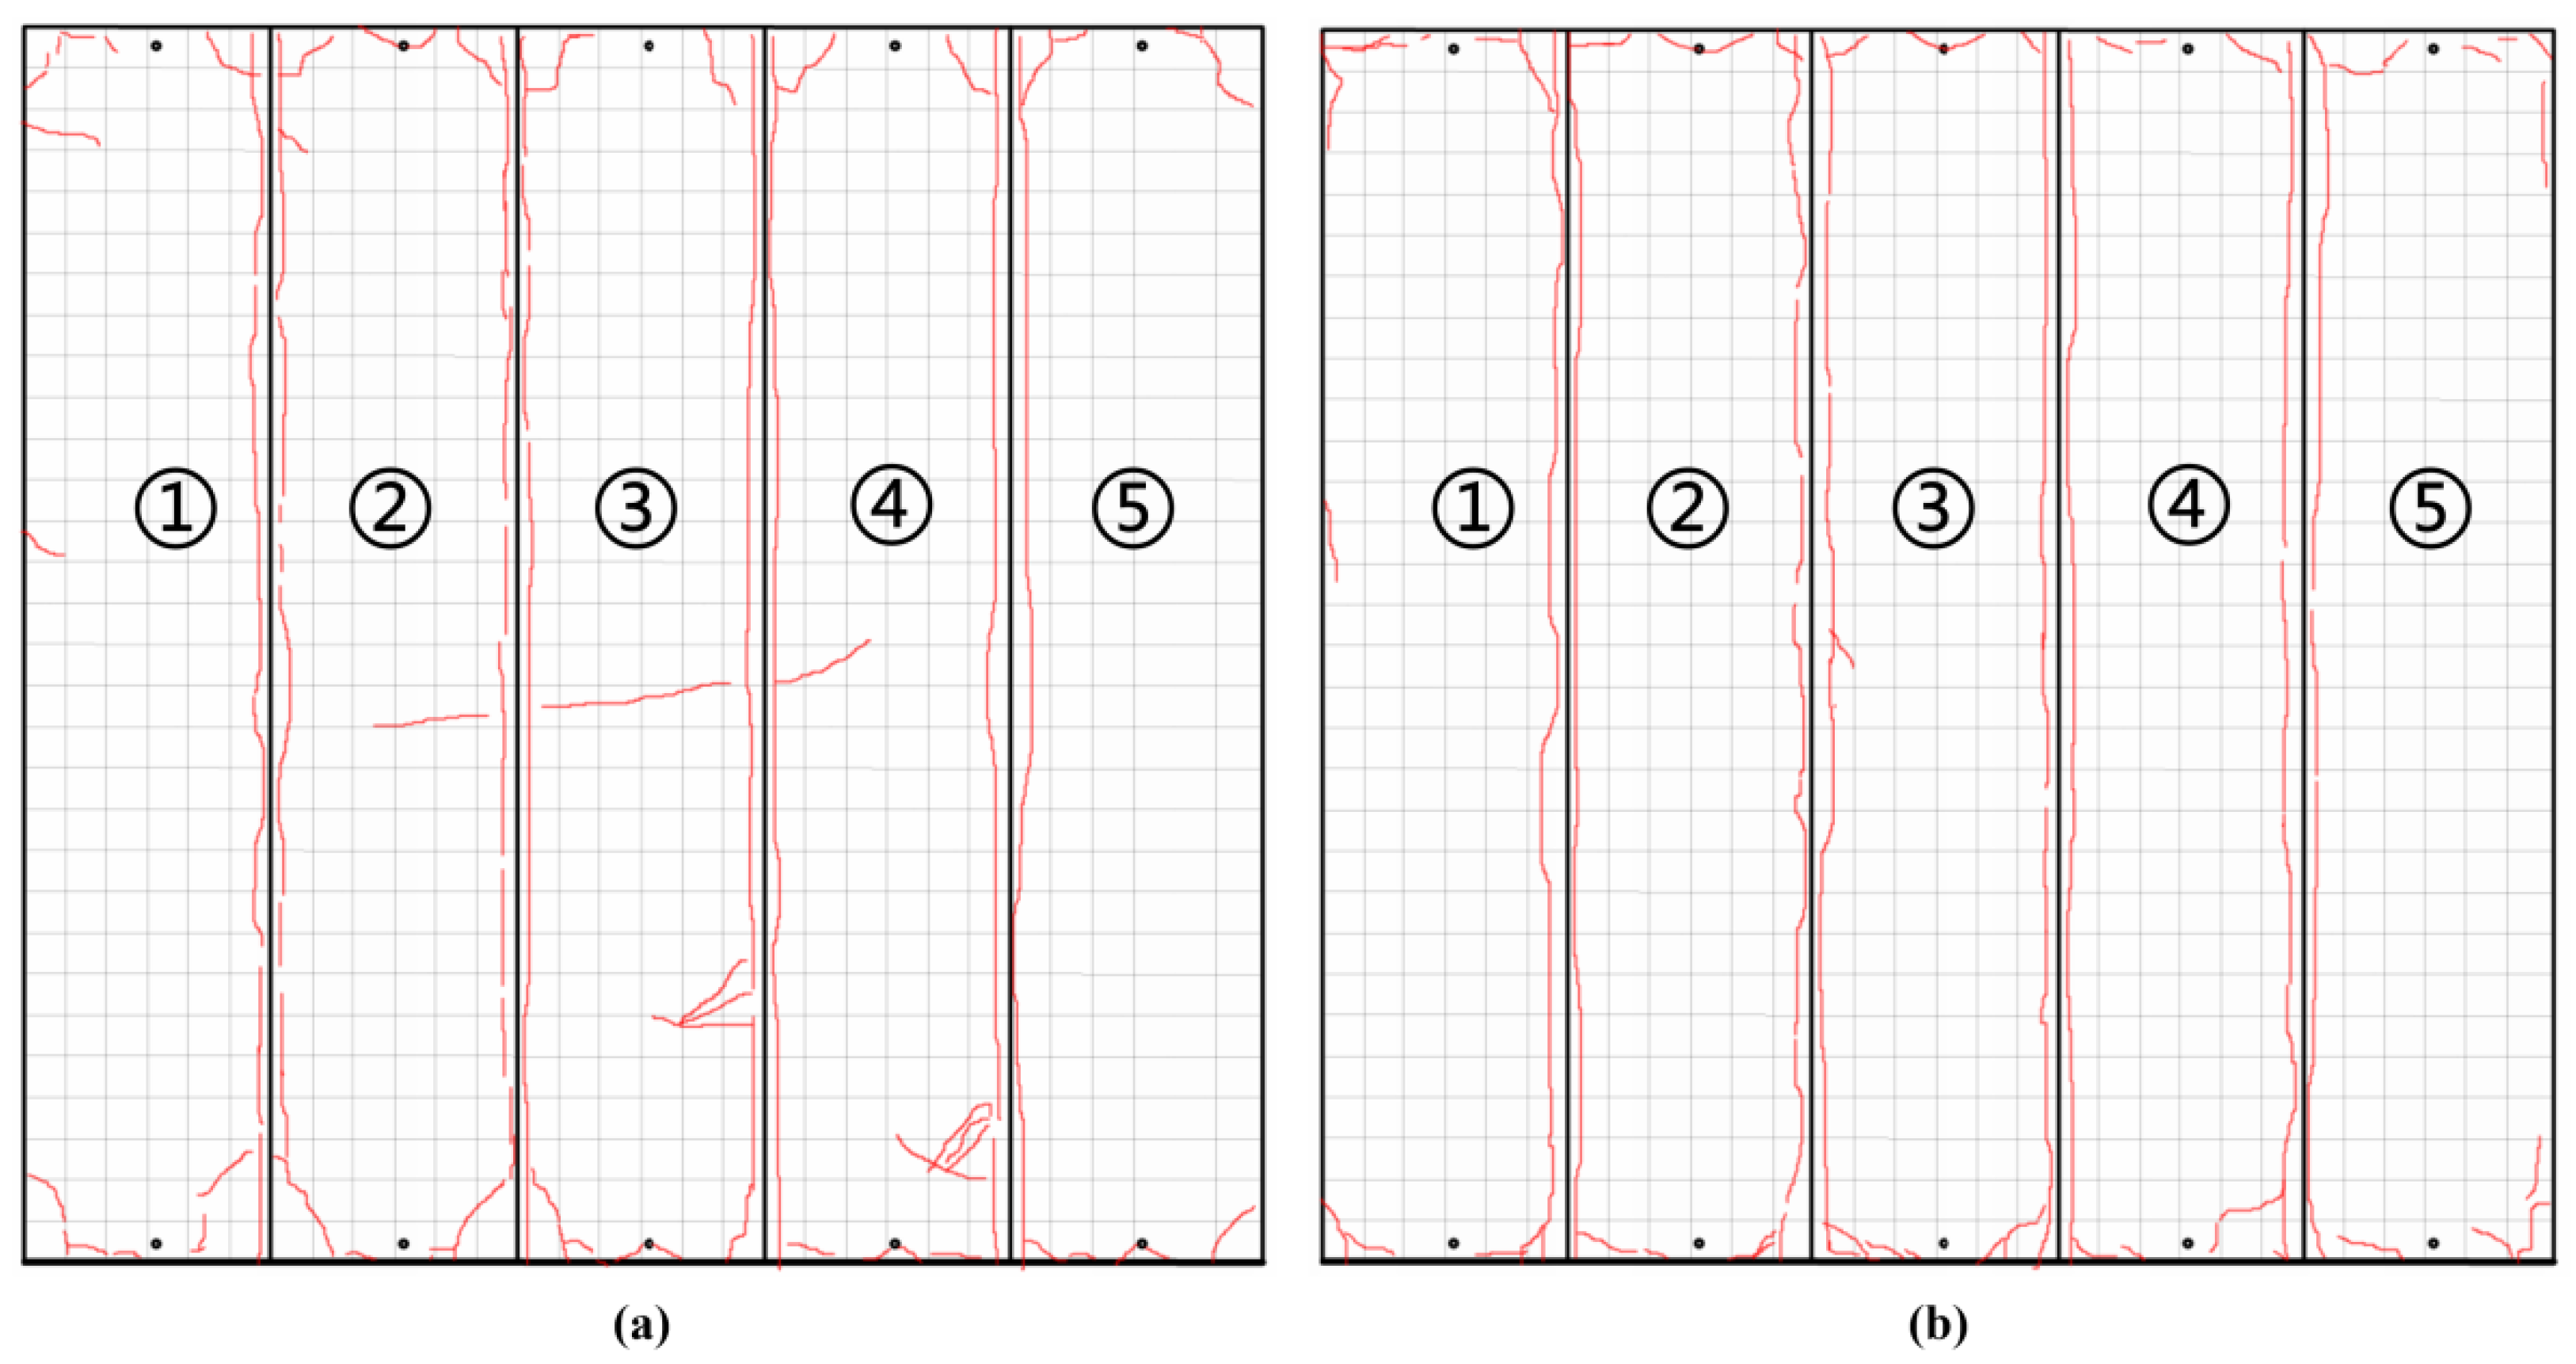
The crack distribution in the AAC wall panel of specimen SF-1 is shown in Figure 14a. It can be observed that the wall damage is mainly concentrated at the joints and corners of each panel. As the load increased, the cracks kept extending and increasing. Dramatic breakage occurred at the corners of the panel, thus exposing the reinforcement inside the wall panel. Cracks were observed at the lower bolt holes of panels No. 3, No. 4, and No. 5. Oblique cracks were observed at the middle of panels No. 2, No. 3, and No. 4. The lower and middle parts of panels No. 3 and No. 4 appeared broken.
The crack distribution of the wall panel in specimen SF-2 is shown in Figure 14b. Similar to SF-1, the damage was concentrated at the joints and corners of each wall panel. As the load increased, the cracks continued to extend and increase. Dramatic breakage was observed at the corners of the panel, which exposed the reinforcement inside the panel. Cracks appeared in the upper bolt holes of panels No. 2 and No. 3. The central part of the wall panels did not show diagonal cracks and remained relatively intact. Overall, SF-1 had more cracks than SF-2, which reveals that using NEDC can effectively reduce the damage caused to AAC wall panels.

4. Test Results and Analysis

4.1. Hysteresis Curves

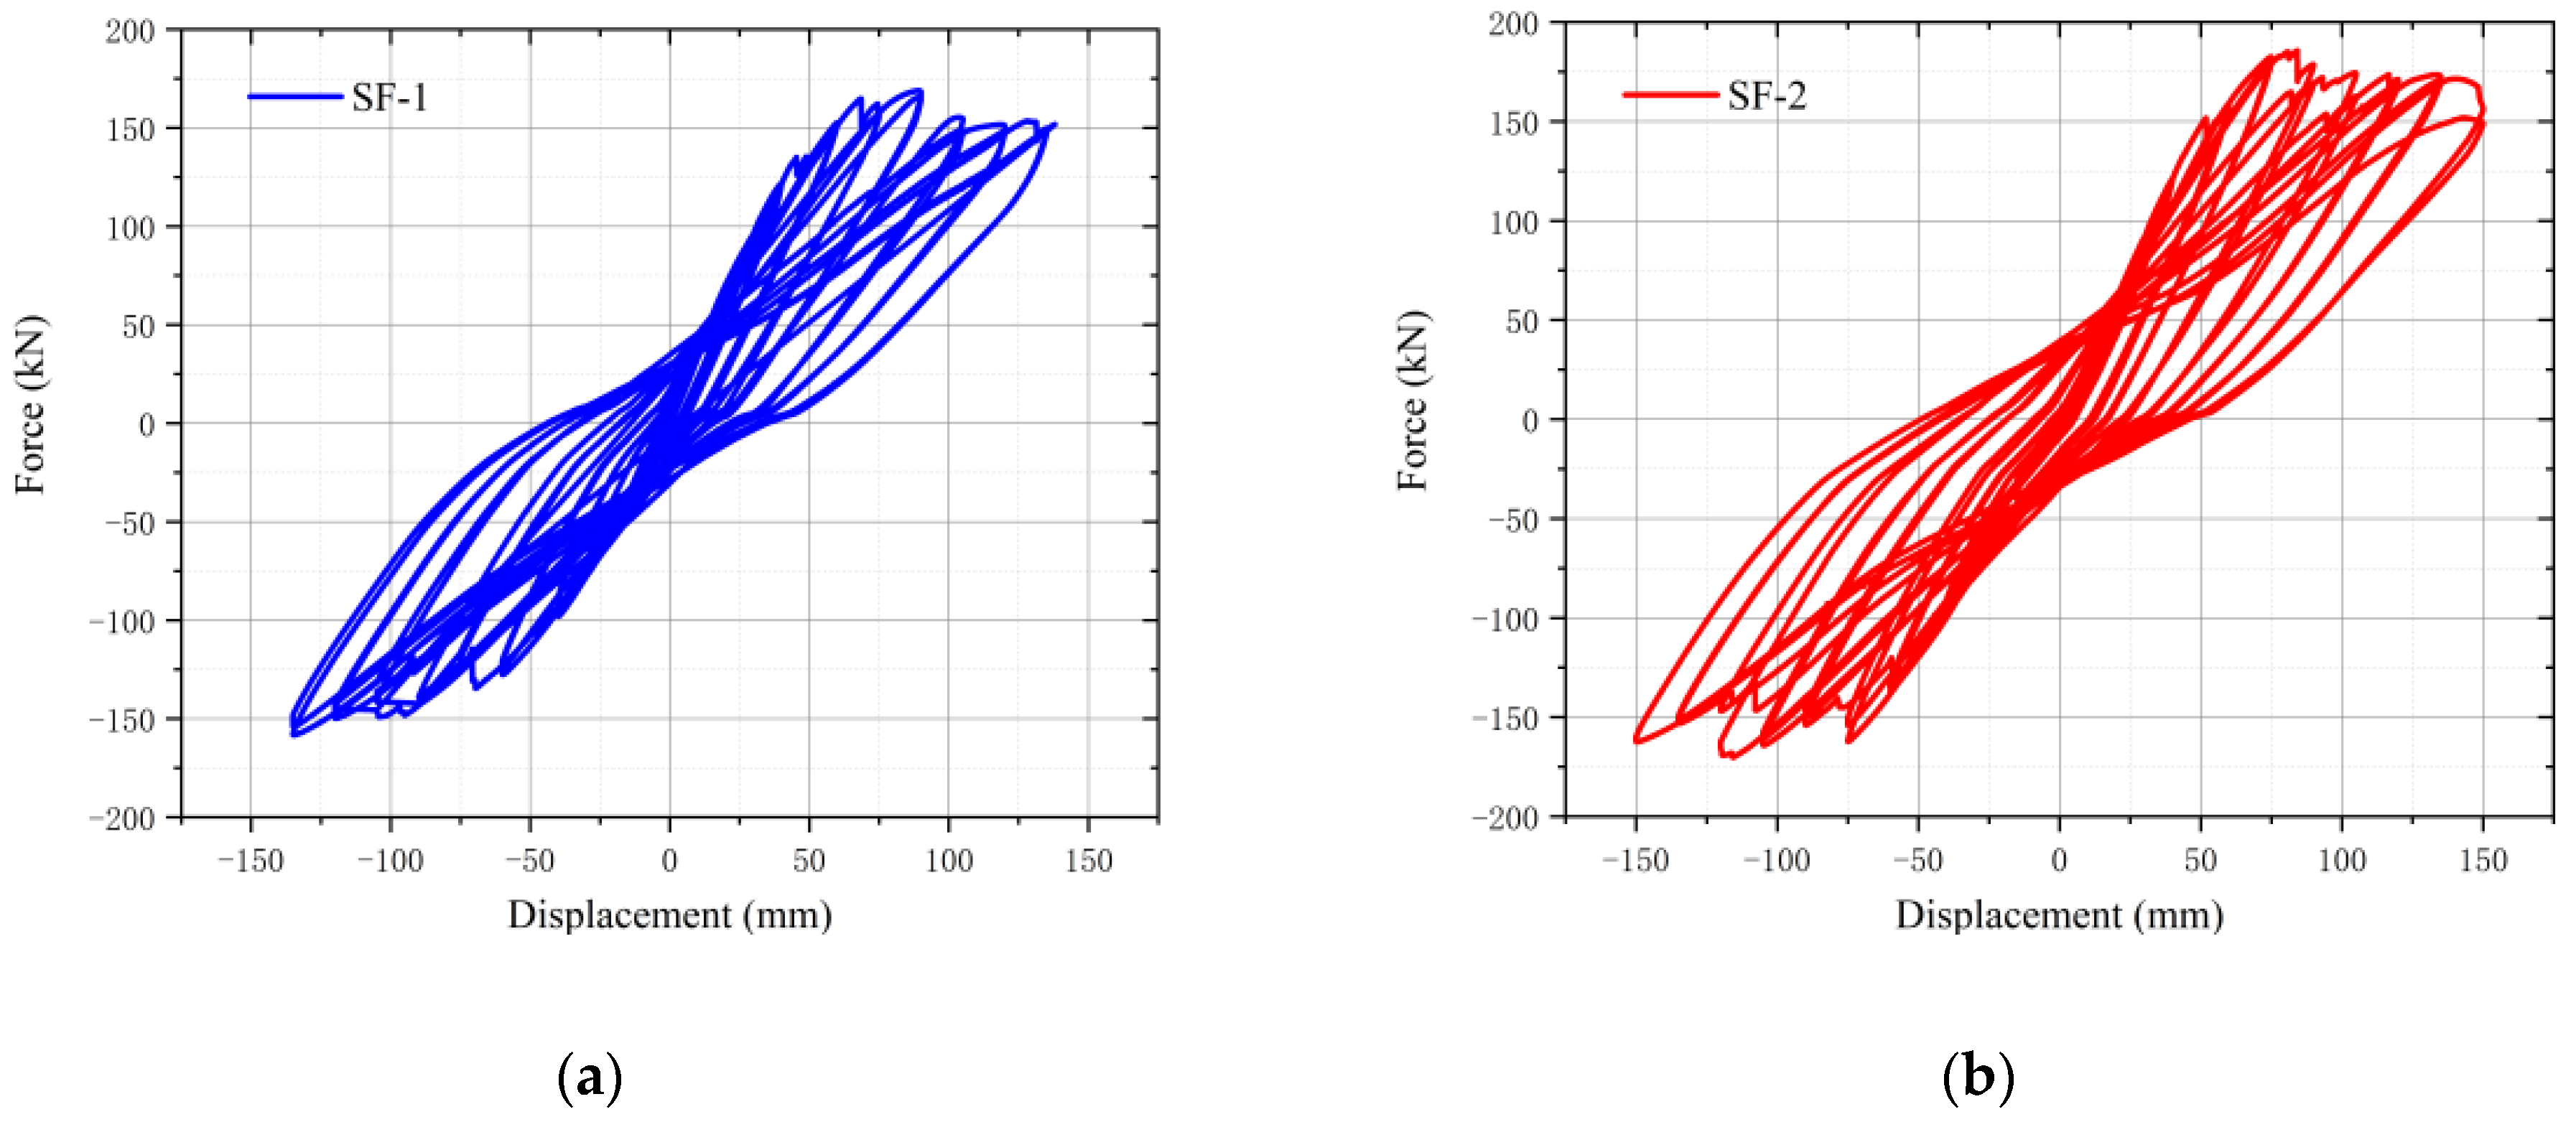
The load-displacement curves of the NEDC connector and the hook bolt connector are shown in Figure 15 and reveal that each specimen exhibits stable hysteresis performance. The member exhibits stable stiffness under cyclic loading [26].
At the beginning of loading, the horizontal displacement was small; both sets of hysteresis curves are linear, the slope is large, and residual deformation is small. As the test proceeded, the slopes of the two sets of curves continued to flatten with an increase in the number of load cycles; consequently, the hysteresis loop area of the envelope gradually increased, stiffness of the structure degraded, and residual deformation increased. The main reasons behind structural stiffness degradation are the loss of mortar between the wall panels, severe damage to the corners of the panels, and the fracture of the welds at the beam-column nodes.
Stiffness and strength degradation were observed in both sets of specimens during loading. However, the stiffness and strength degradation of the SF-1 specimens were more noticeable because during the loading process, the steel frame gradually changed from the elastic phase to the elastoplastic stage and plastic phase. Consequently, the AAC wall panels were crushed and began cracking, which led to stress concentrations in the wall plate at the bolt holes. Specimen SF-1 used a rigidly connected hook bolt as the connector, which is more likely to lead to cracks at the bolt holes. Meanwhile, specimen SF-2 used NEDCs, in which bolts can slip during the crushing of the AAC wall panel, thus offsetting this adverse effect and reducing the degree of wall panel damage. This slip releases more energy and facilitates structural seismic resistance. Therefore, the hysteresis loop of specimen SF-2 is more extensive and fuller than the envelope area of specimen SF-1.

4.2. Skeleton Curves

The skeleton curve of each specimen was obtained by connecting the peak points of the first cycle in the PD and ND for each displacement amplitude of the hysteresis curve. Figure 16 shows that when the frame structure yields, the curve exhibits an obvious inflexion point and the stiffness decreases; however, the bearing capacity significantly increases. Specimens SF-1 and SF-2 reached their pole points in the PD at the same time; however, the pole point of specimen SF-1 in the negative direction was attained before that of specimen SF-2. The ultimate load capacity of specimen SF-2 in both the PD and ND was higher than that of specimen SF-1. Furthermore, the ultimate horizontal load capacity of the combined frame with NEDC was higher than that of the hook bolt connectors for the same steel frame and AAC wall panel. The system with NEDCs showed better synergy since NEDCs can release the harmful displacement and delay the structural damage, thus improving the stiffness and load capacity of AAC panel systems [27].

4.3. Characteristic Points of the Skeleton Curve

Based on the “Regulations for Seismic Test Methods for Buildings” (JGJ 101-2015), the values of vertical and horizontal coordinates corresponding to the peak points of the P-Δ curve have been defined as ultimate load Pm.t and ultimate displacement Δm.t, respectively. The vertical and horizontal coordinates corresponding to 0.85 times of Pm.t are defined as the damage load Pf.t and damage displacement Δf.t, respectively. Meanwhile, Py.t is the yielding load value and Δy.t is the yielding displacement. The characteristic values of specimens SF-1 and SF-2 are shown in Table 4.
Table 4 summarizes the three special points on the skeleton curve, which indicate the yielding load and the yielding displacement, the ultimate load and the ultimate displacement, and the damage load and the damage displacement of SF-1 and SF-2 at PD and ND, respectively. In the PD direction, the yielding load of SF-2 is increased by 8.38% compared to SF-1. The yielding displacement of SF-2 is increased by 2.53 mm compared to SF-1. In the ND direction, the yielding load of SF-2 is 11.65% higher than that of SF-1, and the yielding displacement of SF-2 is 0.23 mm greater than that of SF-1. In the ultimate case, the bearing capacity of specimen SF-2 in the PD direction increased by 14.18 kN and the displacement increased by 14.34 mm compared with that of SF-1. In the ND direction, the ultimate bearing capacity of SF-2 increased by 16.53 kN and the displacement increased by 0.33 mm compared with SF-1. The damage load capacity of specimen SF-2 in the PD direction increased by 12.06 kN and the displacement increased by 24.72 mm compared with SF-1. In the ND direction, the damage load capacity of SF-2 increased by 14.04 kN and the damage displacement increased by 24.87 mm compared with SF-1.
The ultimate bearing capacity and yield bearing capacity of specimen SF-2 are greater than those of specimen SF-1 because, under the same conditions, NEDCs can reduce the impact that frame deformation has on the AAC panels and alleviate the damage caused to the frame and panel. Therefore, the ultimate horizontal load capacity of the composite frame with NEDCs is higher than that of the composite frame using rigid connection nodes (hook bolts) under low-cyclic loading [28].

4.4. Strength Degradation

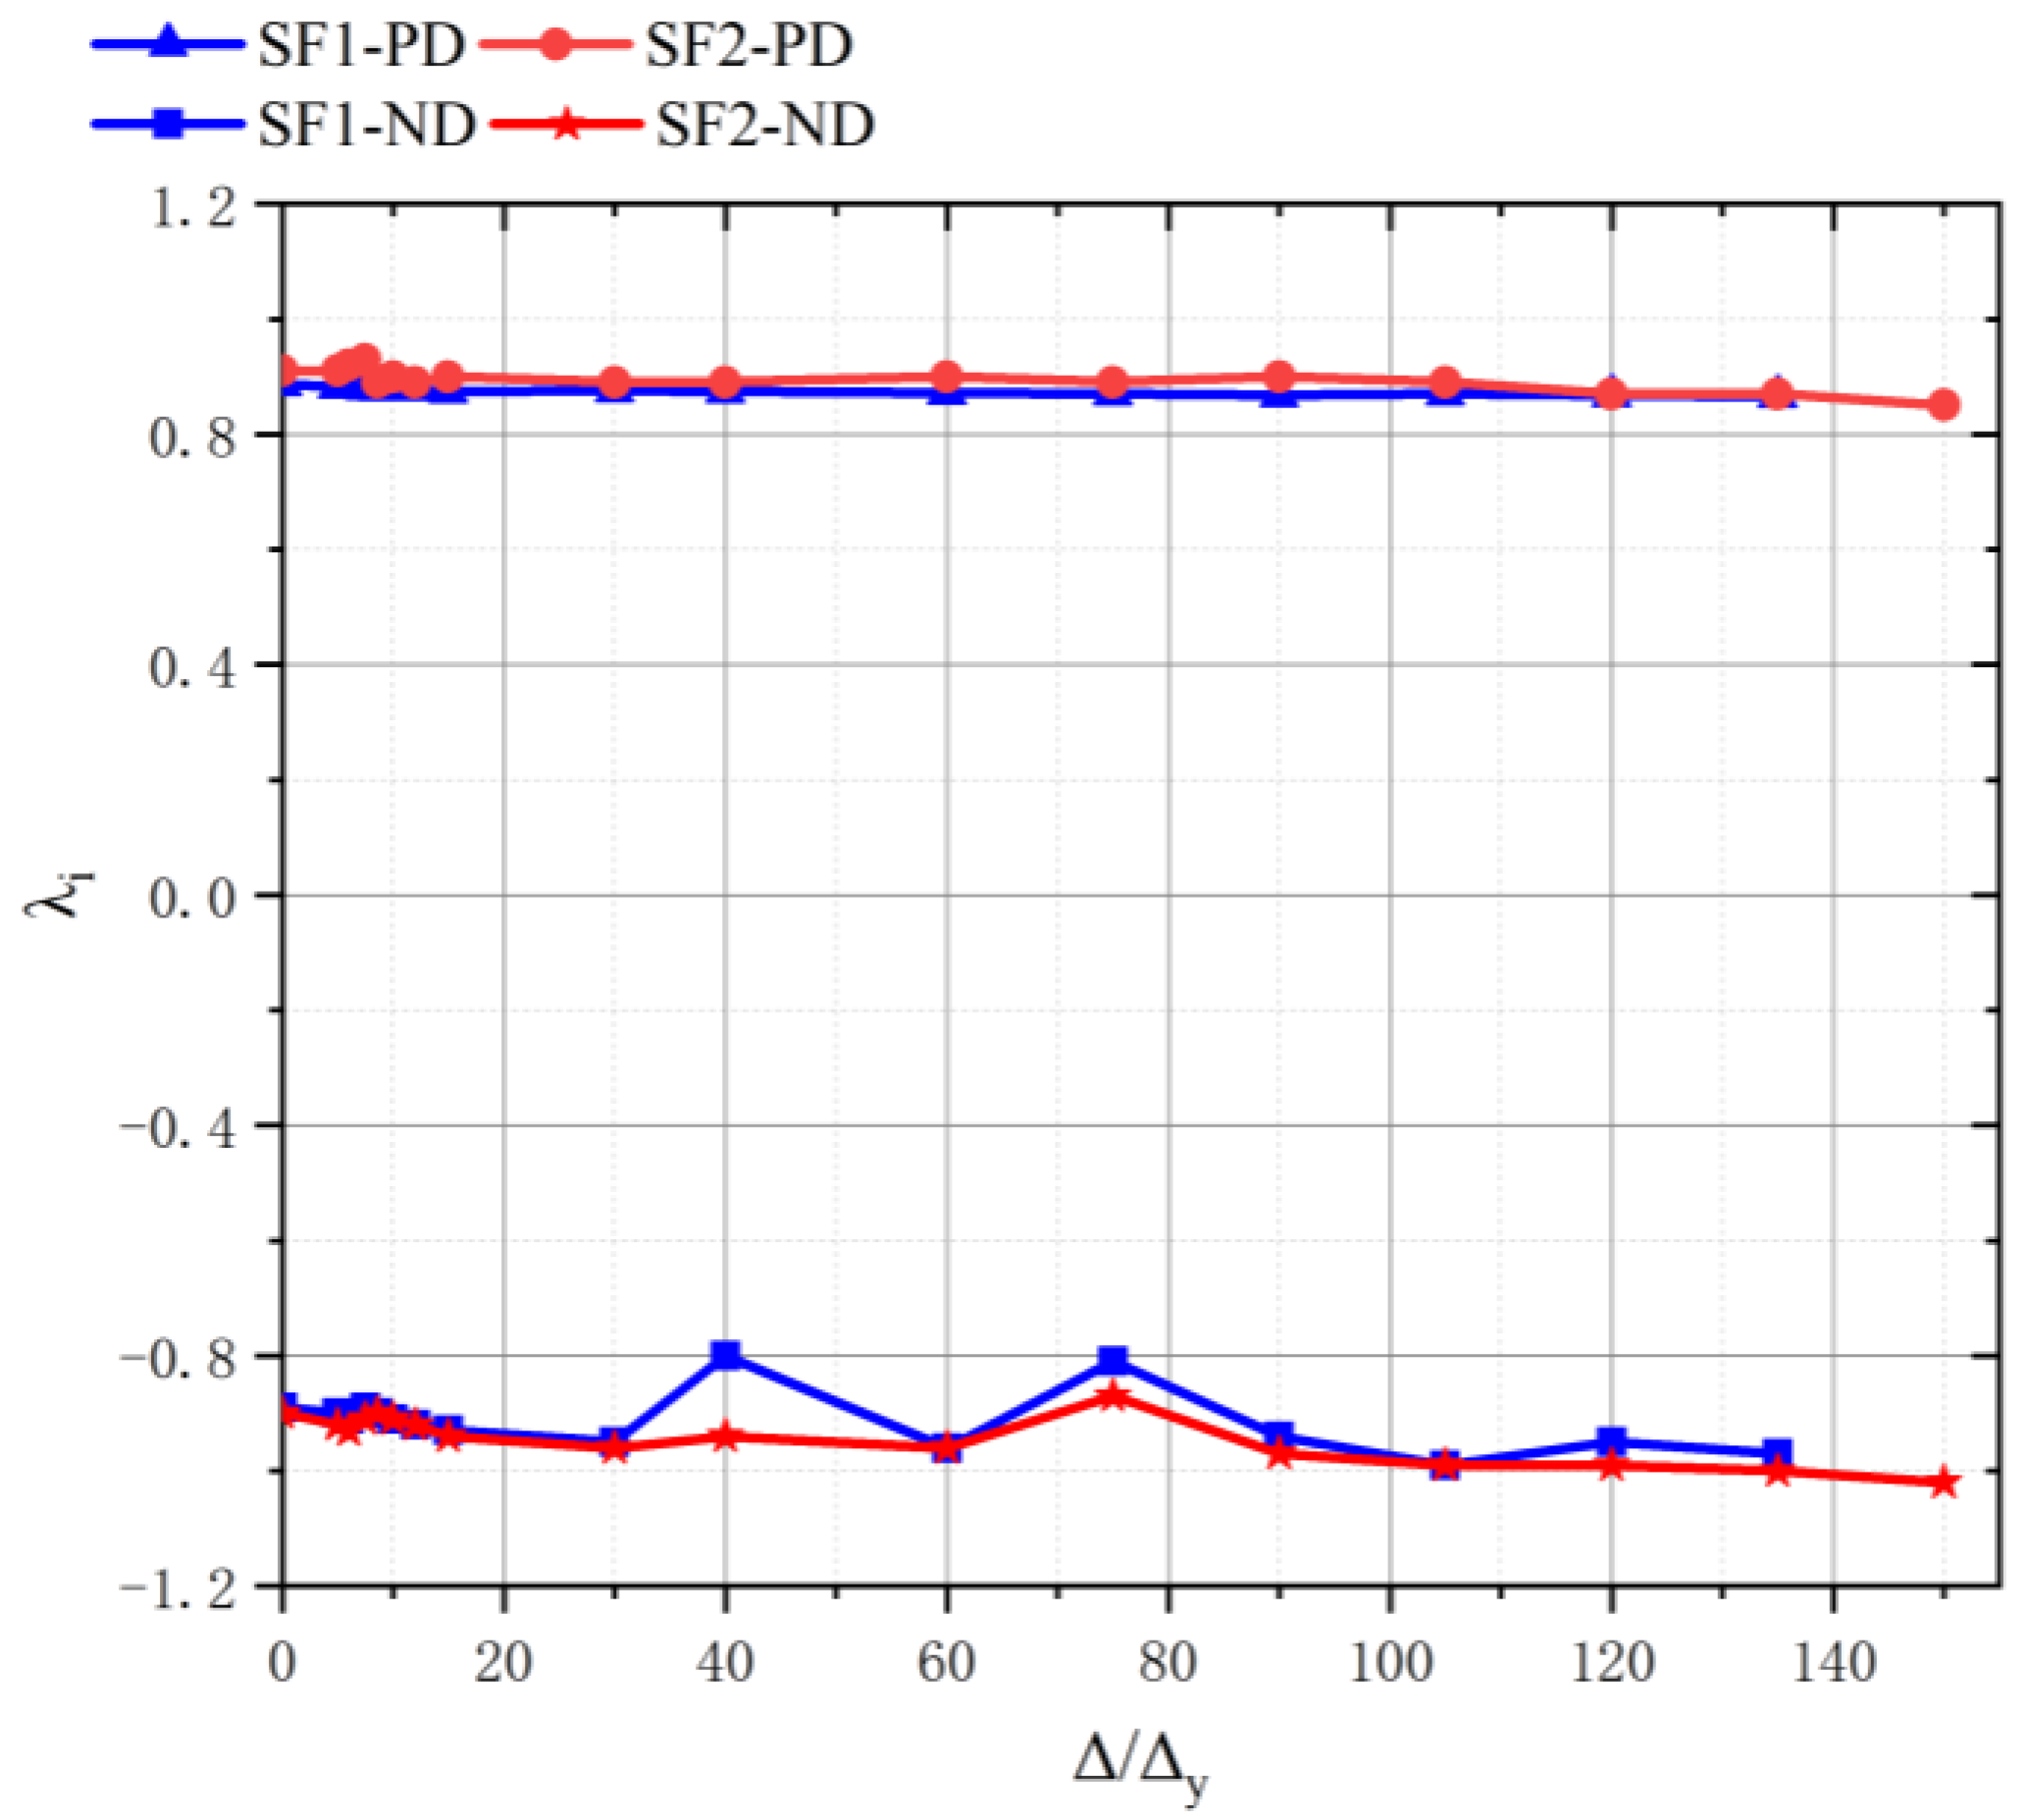
Strength degradation is a process by which the load carrying capacity of a structural member decreases due to an increase in loading under constant displacement amplitude. “The Code of Practice for Seismic Test Methods for Buildings” (JGJ 101-2015) recommends that the strength degradation of structural members can be expressed in terms of a coefficient λi by using the following expression:
λ i = P j i / P j l ,
where P j i is the jth level of loading displacement (Δ/Δy = j) and represents the peak point load of the ith loading cycle. Similarly, P j l is the jth level of loading displacement (Δ/Δy = j) and represents the peak point load of the first loading cycle.
To elucidate the variations in the load carrying capacity of the monolithic steel frame composite structure with increasing load cycles when using NEDCs, the variations in the strength degradation coefficient with loading level for all specimens are given in Figure 17.
The figure shows that the strengths of specimens SF-2 and SF-1 in the PD and ND are extremely stable, with the strength of specimen SF-1 being stable until a displacement of 40 mm. For the same displacement magnitude, the maximum load value corresponding to the final cyclic loading and the load ratio corresponding to the first cyclic loading is above 0.88. This indicates that the specimens undergo less strength degradation and exhibit better workability under low-cyclic loading. The maximum load values corresponding to the second cycle for specimen SF-1 at the vertex displacements of 40 and 75 mm and for specimen SF-2 at the vertex displacement of 75 mm were significantly lower than those corresponding to the first cycle. This is due to the crush damage received at the bolt holes in the wall plate connectors during the second loading.

4.5. Stiffness Degradation

The secant stiffness was used to evaluate the stiffness degradation of two sets of specimens under low-cyclic reciprocal loading, and the corresponding expression is:
K j = i = 1 n P j i / i = 1 n U j i ,
where P j i is the peak point load of the ith loading cycle at the jth loading displacement (Δ/Δy = j), U j i is the peak point displacement of the ith loading cycle at the jth loading displacement (Δ/Δy = j), and n is the number of cycles.
A comparative analysis of the stiffness degradation of the two groups of specimens has been shown in Figure 18.
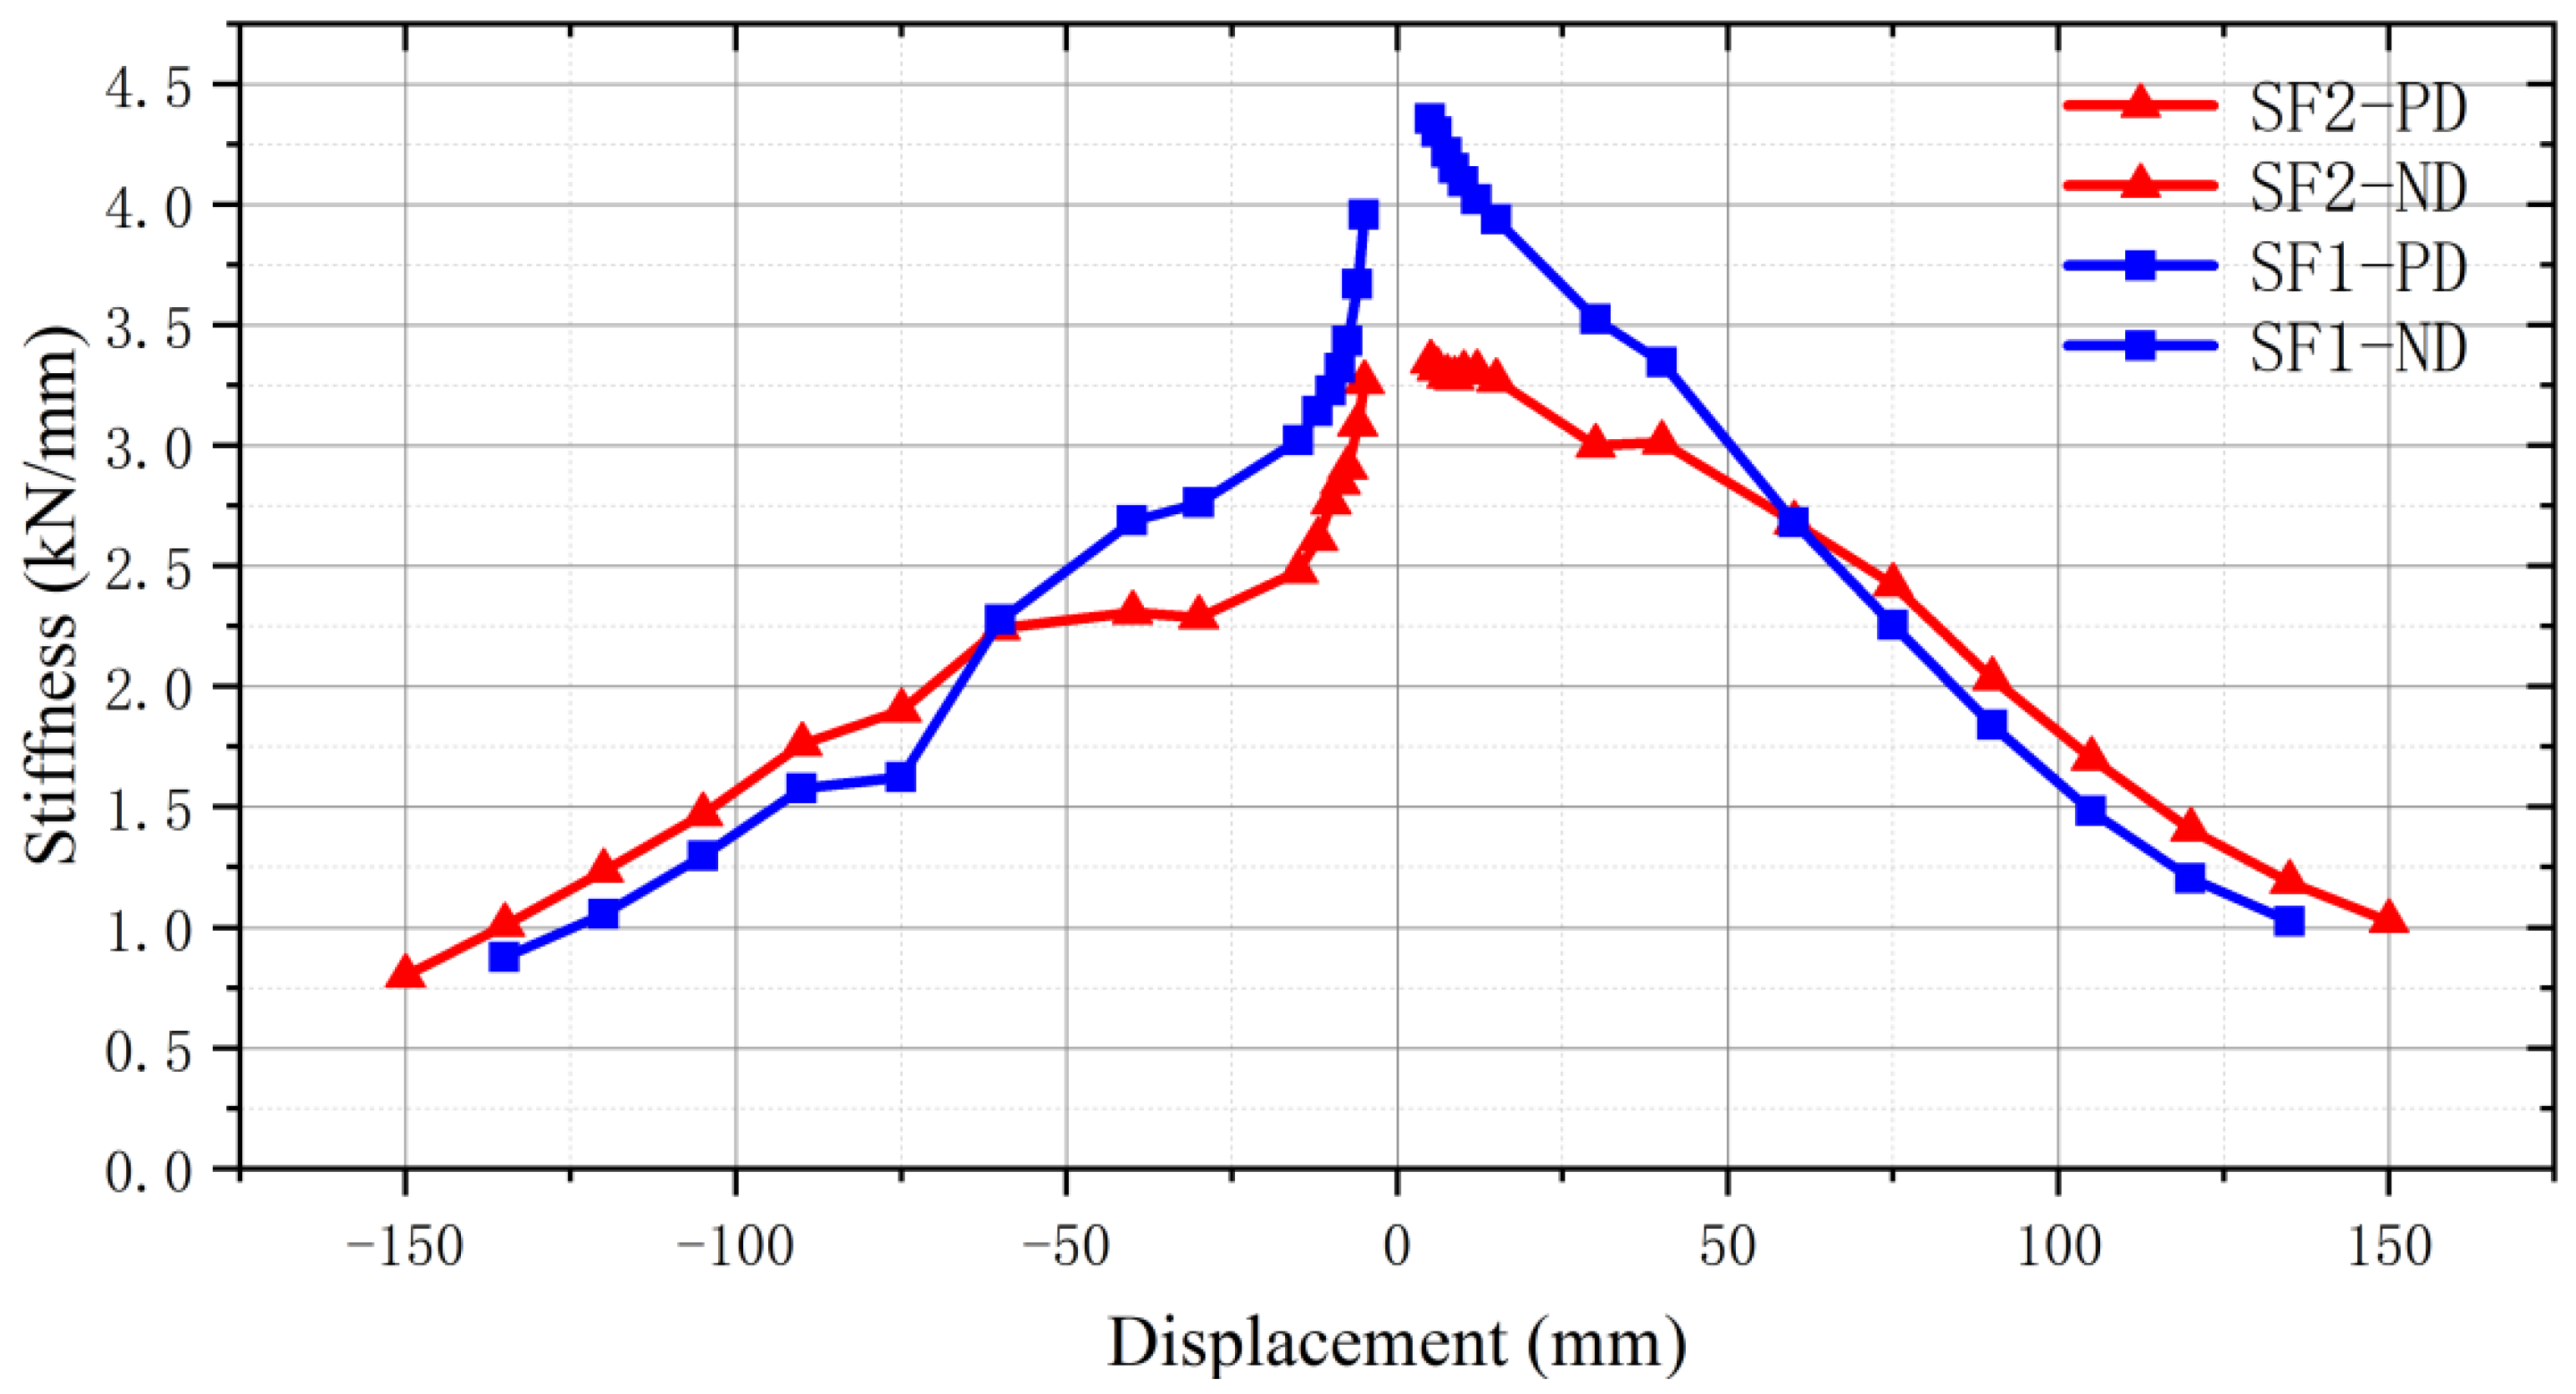
Figure 18 shows that the slopes of the two sets of members are constant and linear at the early stage of loading. The value of the SF-1 set is slightly higher than that of SF-2 after the line bouncing stage, which is due to the slip of the specimen at the long circular hole, effectively releasing the energy and avoiding damage to the wall plate. At the end of the loading period, the slope of SF-2 decreased significantly less than that of SF-1, indicating that the joint could provide good stiffness after the bolts reached the limit. The damage stiffness values of specimens SF-1 and SF-2 are approximately 25.55–27.62% and 26.36–30.36% of their initial stiffness, respectively. At smaller displacements, the stiffness degradation is more minor. The stiffness degradation of SF-1 is significantly accelerated after the loading displacement exceeds 30 mm. After displacement loading exceeds 60 mm, the stiffness of SF-1 becomes lower than that of SF-2. The hook bolts only allow the AAC wall panel to rotate at the nodes, while the NEDC allows relative displacement of the nodes and the AAC wall panel. This reduces the damage caused to the AAC wall panels under more significant displacement and stabilizes structural stiffness. Overall, although the initial stiffness of specimen SF-1 is greater than that of specimen SF-2, the residual stiffness of SF-2 is significantly higher than that of SF-1 after loading.

4.6. Ductility Coefficient

Ductility is an essential feature in the seismic design of structures. The displacement ductility factor μ was used to study the ductility properties of the structure. Two coefficients, μΔ and μθ, were used to evaluate the ductility performance of the structure; μΔ denotes the displacement ductility factor, and μθ denotes the rotation ductility factor. Their expressions are as follows:
μΔ = Δuy
μθ = θu/θy
where Δu is the yield displacement of the structure, Δy is the damage displacement of the structure, θu is the yield angle of the structure, and θy is the damage angle of the structure.
Each value is derived from the skeleton curve, and the ductility coefficients of the specimens are shown in Table 5.
“Seismic Design of Buildings” (GB 50011-2010) specifies the limits of interlayer displacement angles for verifying the seismic deformation of steel structures. For the multilayer and high-rise steel structure, the elastic interlayer displacement limit [θe] = 1/250 and the elastoplastic interlayer displacement angle limit [θp] = 1/50. Table 5 shows the ductility coefficients (μ = 2.84 − 3.07 for SF-1 and μ = 3.34 − 3.47 for SF-2), elastic limit displacement angles (θy = (3.29 − 3.51)θe for SF-1 and θy = (3.52 − 3.62)θe for SF-2), and elastoplastic limit displacement angles (θu = 2θp for SF-1 and θu = 2.38θp for SF-2) of both specimens. Both specimens exhibit good ductility, but the ductility coefficient of SF-2 is approximately 13–17% higher than that of SF-1. Moreover, both elastic and elastoplastic displacement angles are higher for SF-1. Overall, the NEDC can retard the damage caused to structures and meet seismic requirements more effectively.

4.7. Energy Dissipation

To determine the energy dissipation capacity of the structure, the equivalent viscous damping coefficient ξ and the energy dissipation coefficient E were used in this study. Taking Figure 19 as an example, the equivalent damping factor ξ expression for the hysteresis loop is determined as follows:
ξ = 1 2 π S A B C + S C D A S O B E + S O D F ,
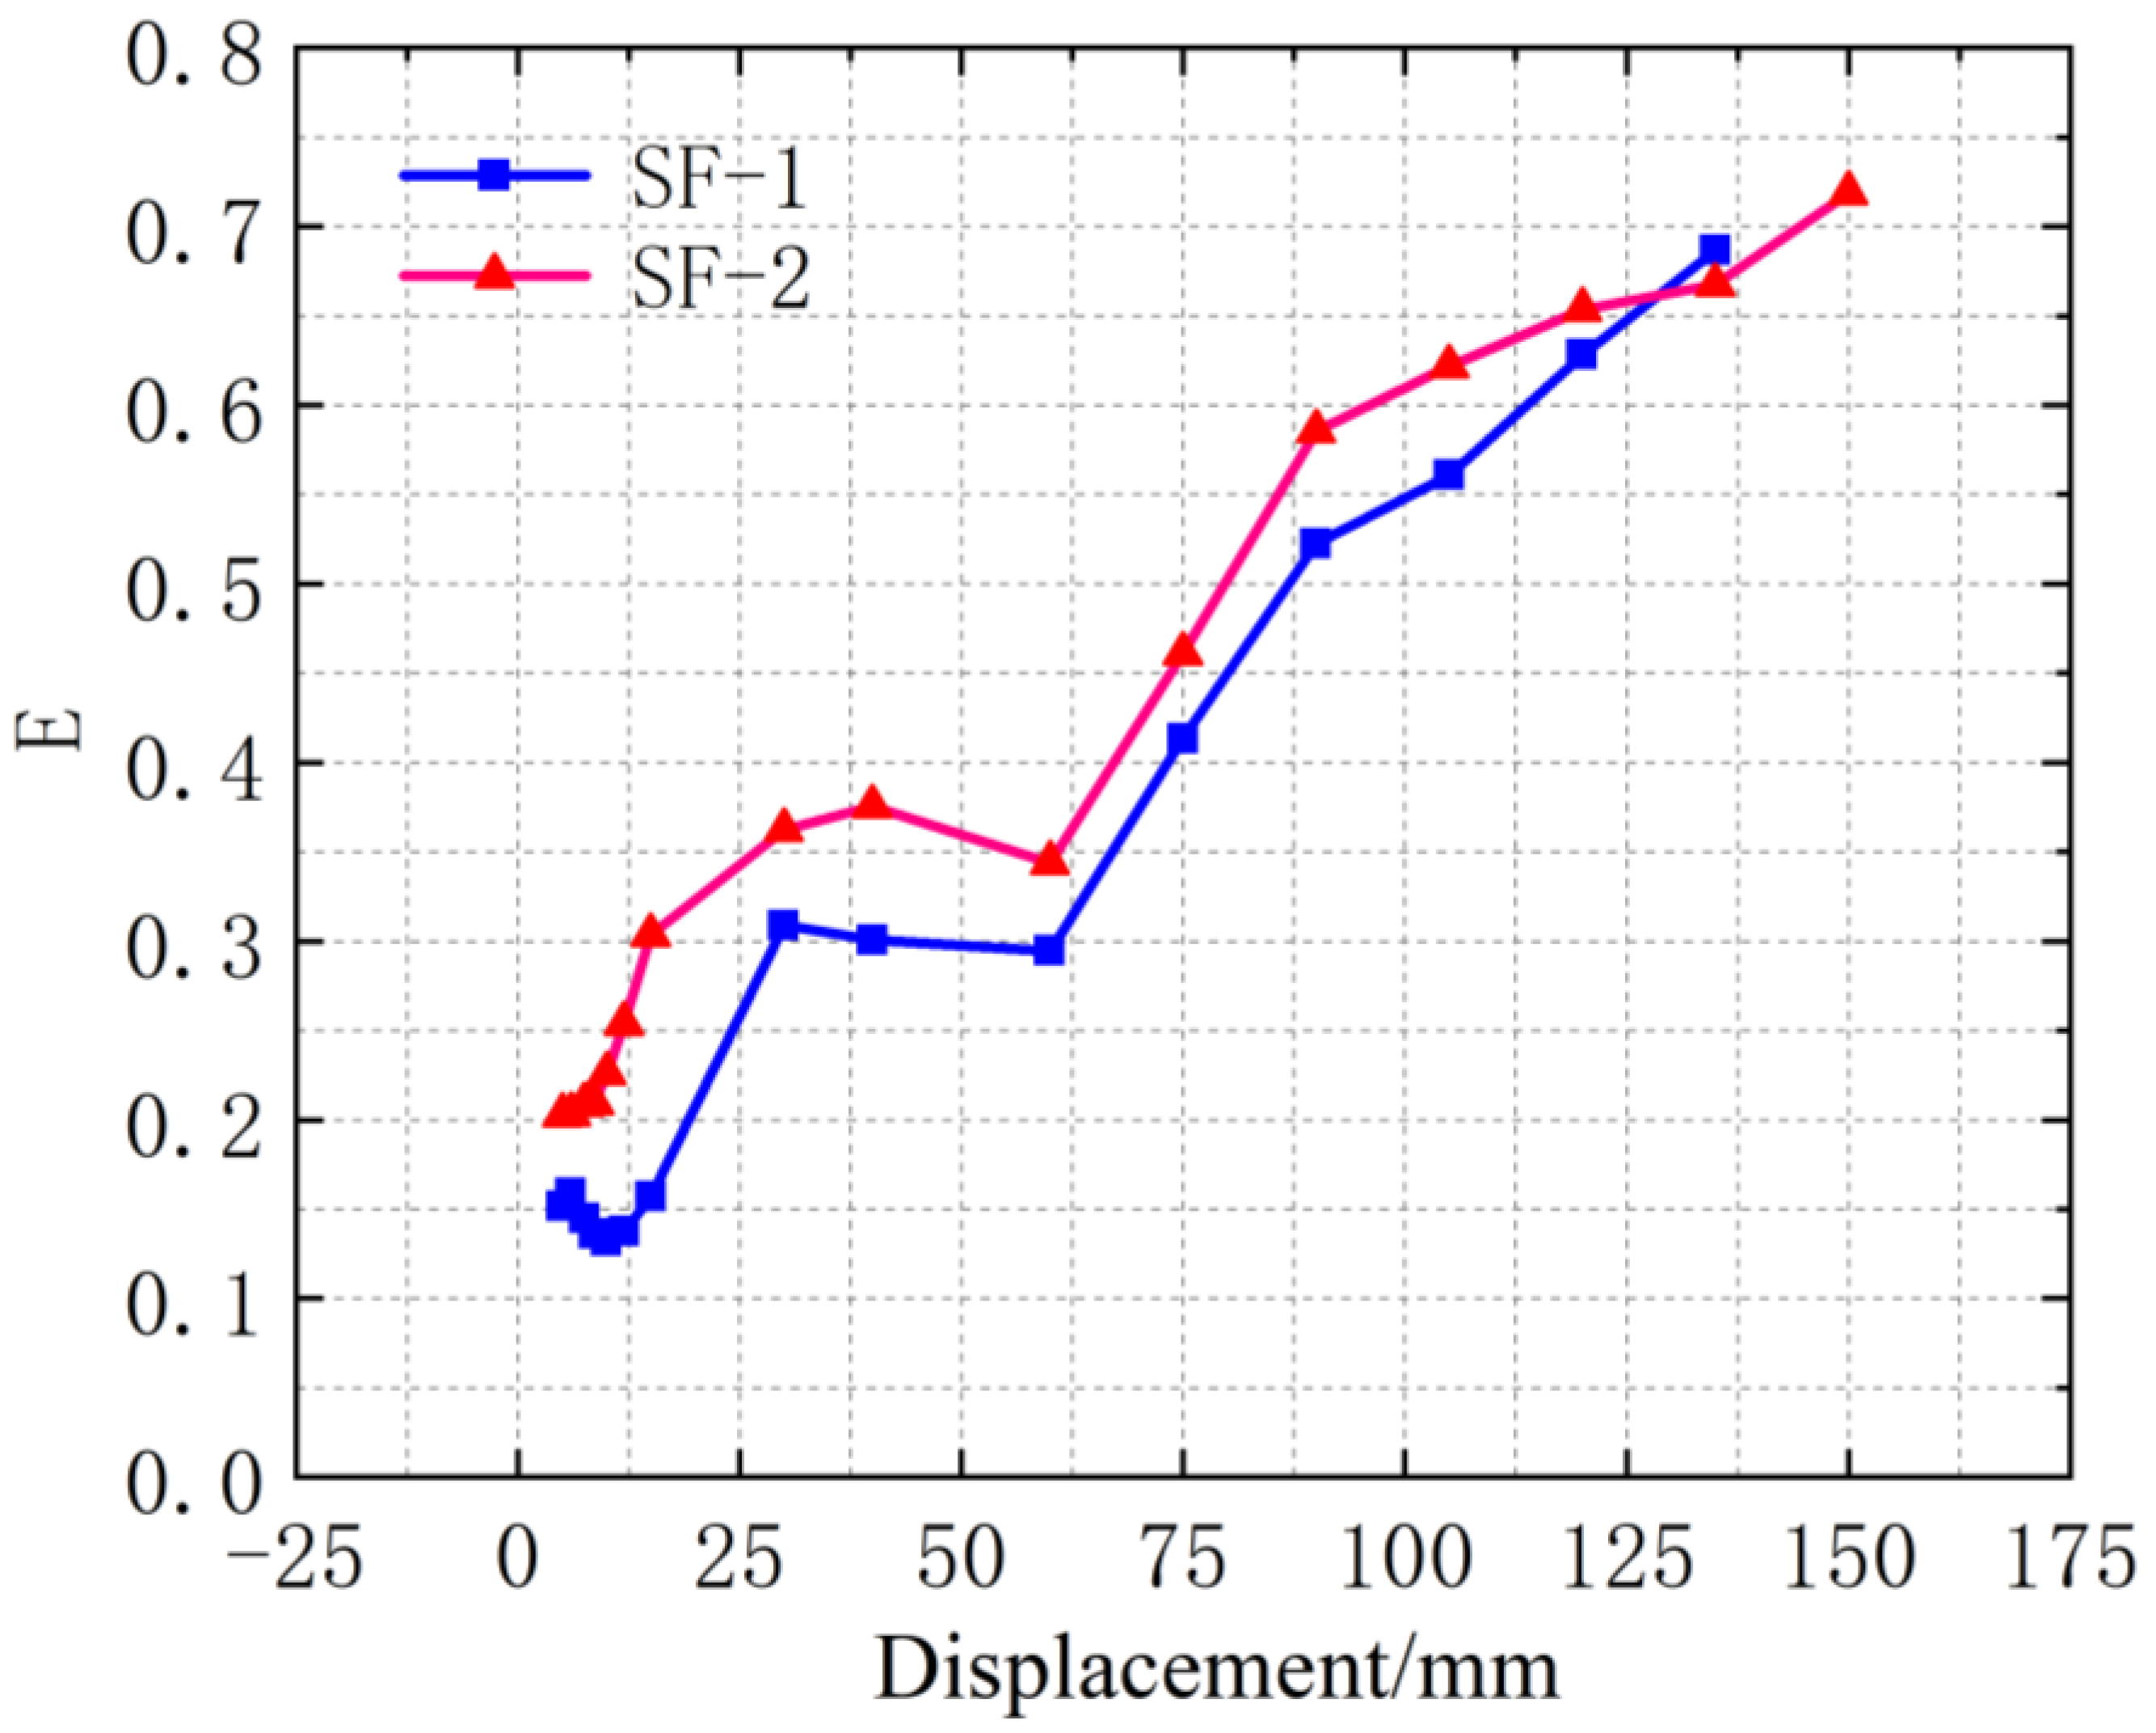
The energy dissipation capacity indexes of specimens SF-1 and SF-2 under ultimate load and damage conditions are shown in Table 6. The energy dissipation coefficient E for each level of cyclic loading is shown in Figure 20.
Table 6 shows that the total energy dissipation, which is equivalent to the viscous damping coefficient, and the energy dissipation coefficient of the frame using NEDC are greater than those of the frame using standard hook bolt connectors.
The following conclusions can be obtained from the variations in the energy dissipation coefficient E in Figure 20. When the horizontal displacement is between 0 and 25 mm and the horizontal displacement exceeds 60 mm, the energy dissipation coefficient E increases with displacement. When horizontal displacement ranges from 25 to 60 mm, the energy dissipation coefficient E decreases with an increase in displacement. The energy dissipation coefficients E of specimens SF-1 and SF-2 exhibit the same curve trend with increasing displacement. The increase in the isoenergetic dissipation coefficient of SF-2 is more significant than that of SF-1.
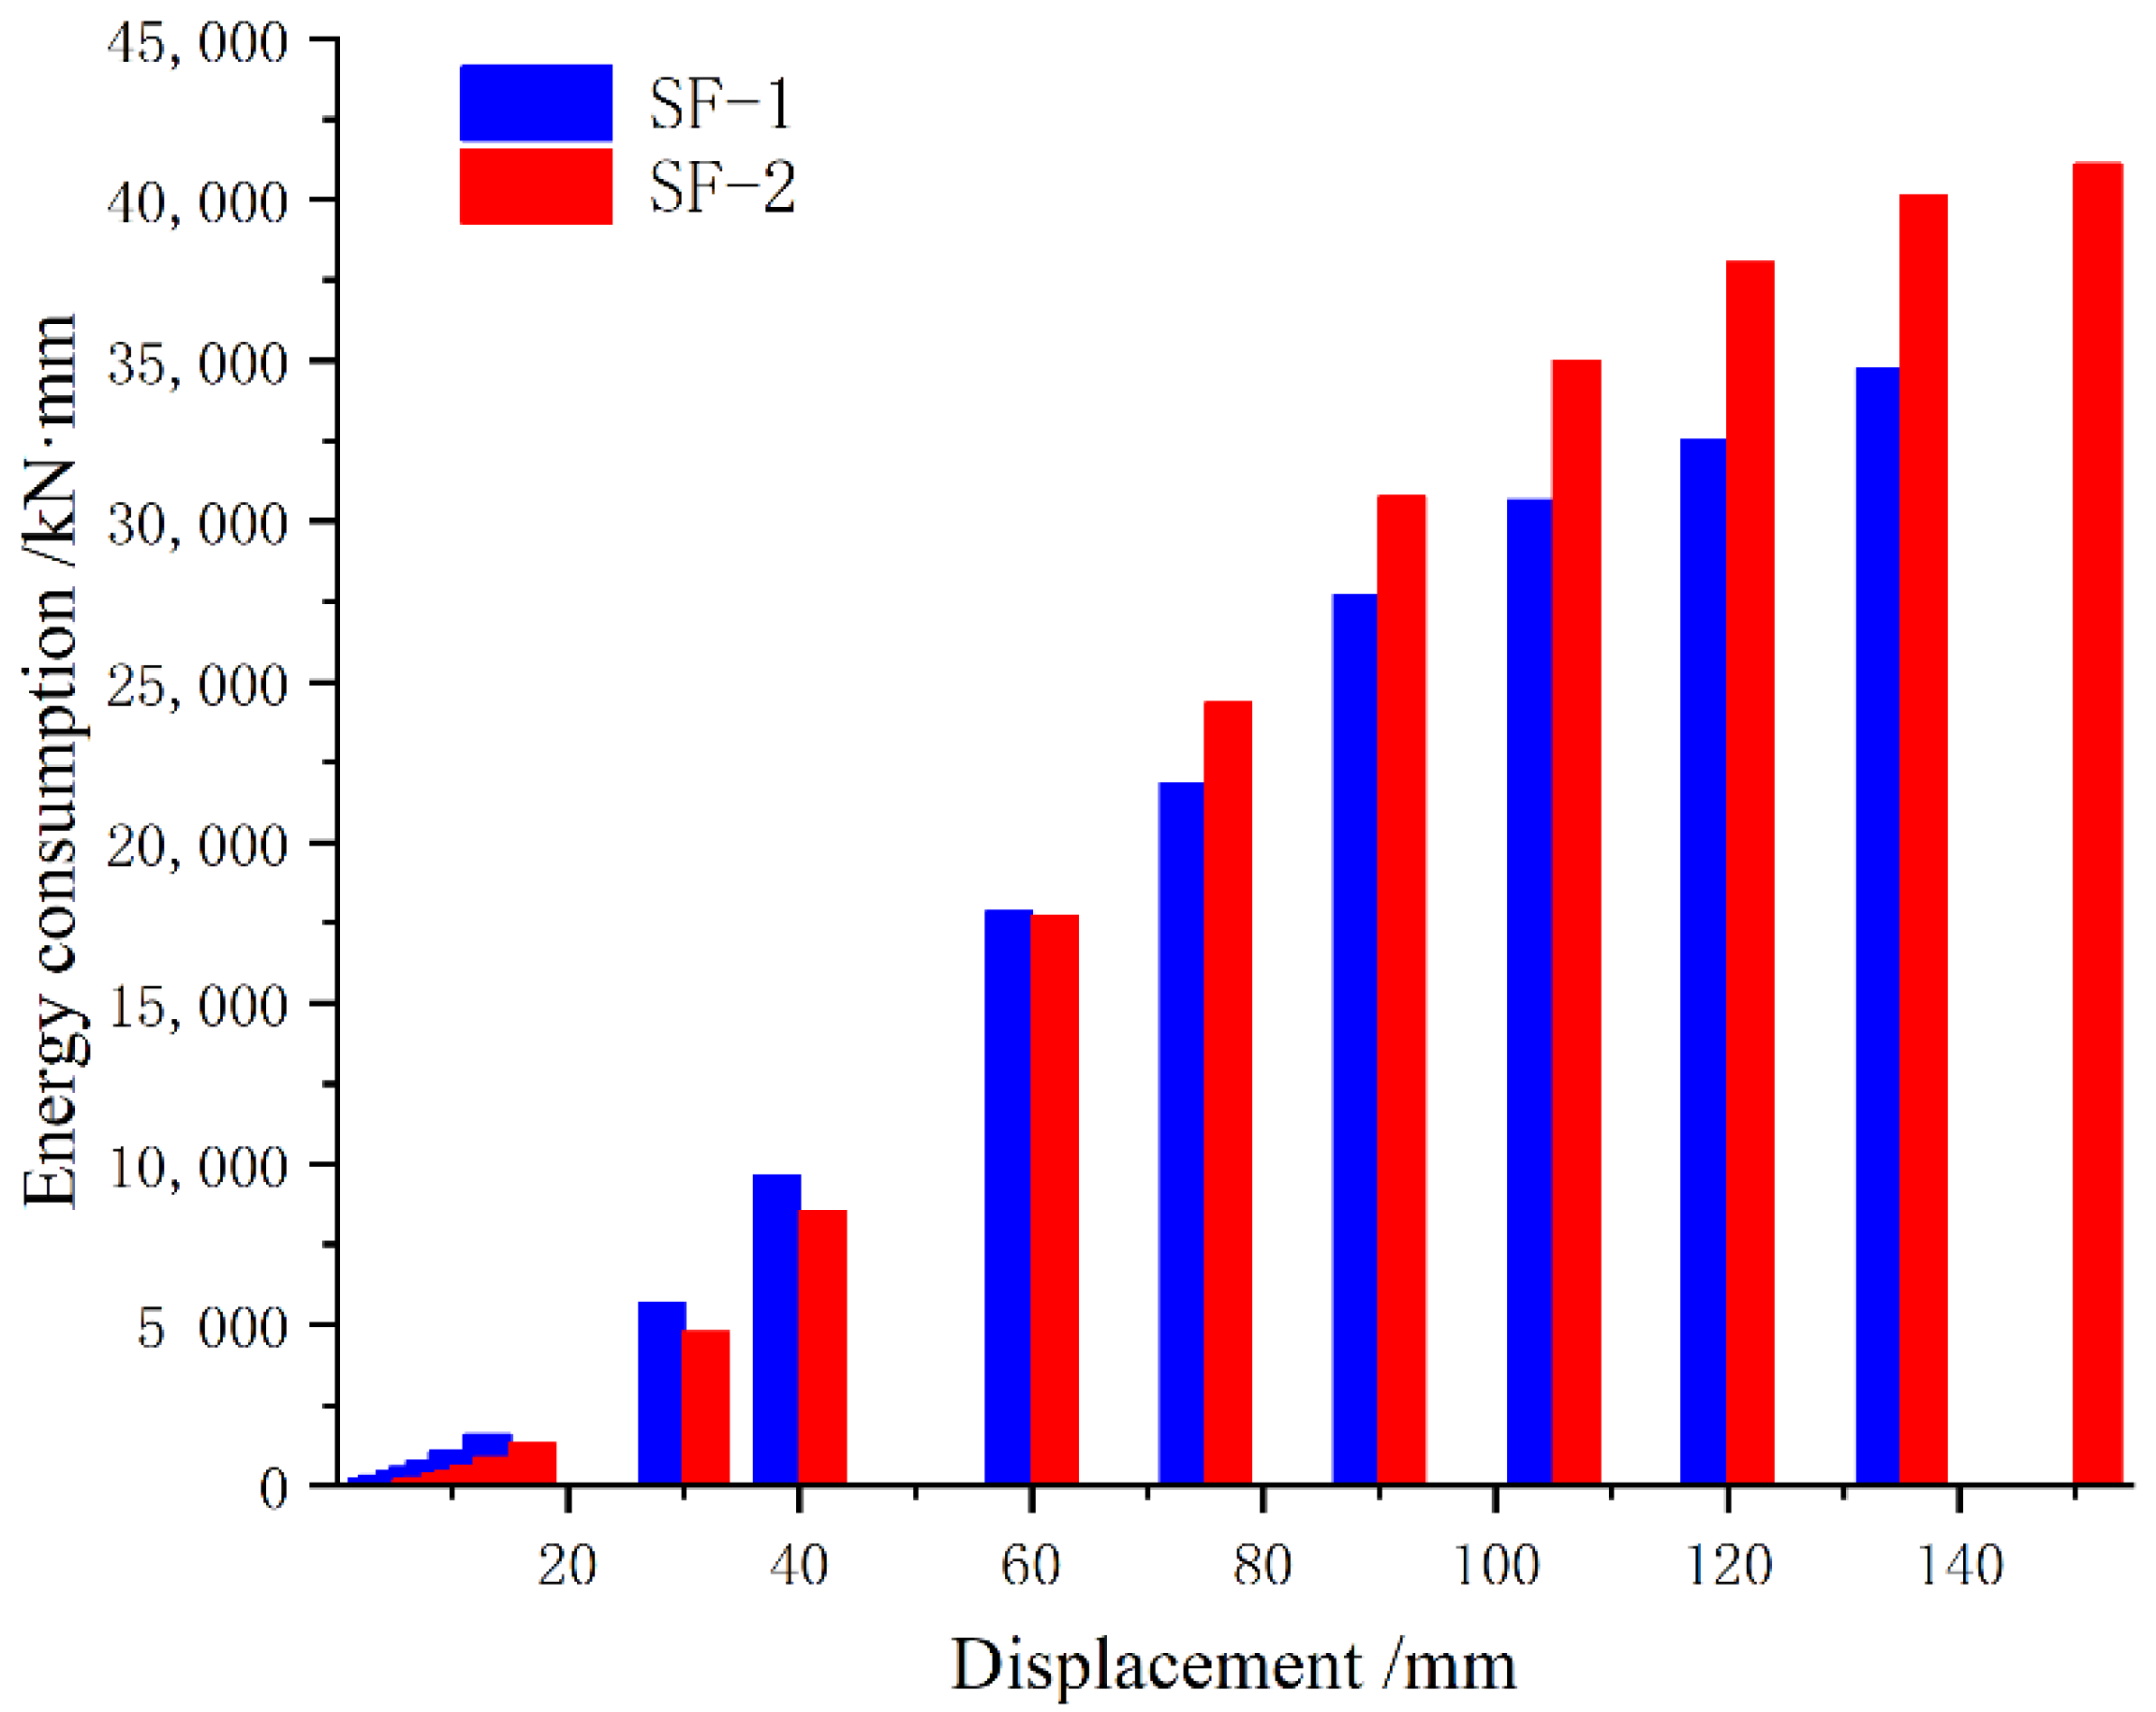
The energy consumption statistics of both specimens for each loading cycle are shown in Figure 21. The energy dissipated in a single cycle of SF-1 is slightly greater than that of SF-2, up to a horizontal displacement of 75 mm. After the horizontal displacement exceeds 75 mm, the energy consumption capacity of SF-2 for a single cycle becomes significantly higher than that of SF-1. This indicates that hook bolts exhibit a slightly better energy dissipation performance under minor earthquake action than that obtained with the NEDC. However, the energy consumption of NEDC is significantly higher than that of hook bolt connectors under solid vibrations.

5. Conclusions

In this study, two sets of low-cyclic loading tests were performed on assembled steel frames with AAC wall panels. The following observations were made:
  • This study proposes an NEDC. The results show that the NEDC can adapt to large deformations between floors and improve the seismic performance of the overall structure. The effectiveness of using this NEDC has been proven through tests, which were conducted to reduce the damage caused to external AAC wall panels under earthquake action.
  • Under the same conditions, the yield and ultimate load capacity of the composite frame with NEDCs was greater by 8.38%–11.65% when compared to those of the composite frame with conventional hook bolt connectors.
  • For the composite frame with NEDCs, the displacement ductility coefficient was 3.34 to 3.47, the elastic limit displacement angle was θy = (3.52 to 3.62)θe, and the elastoplastic limit displacement angle was θu = 2.38θp. Thus, the NEDC led to a greater ductility of assembled steel frames when compared to that obtained using standard hook bolt connectors. Better ductility allows the structure to meet the necessary seismic design requirements.
  • The energy consumption capacity of the composite frame with NEDCs is greater than that of the composite frame with conventional hook bolt connectors. The total energy consumption of assembled steel frames with NEDCs is 1.01 times higher than that observed with assembled steel frames comprising conventional hook bolt connectors. After the horizontal displacement exceeds 75 mm, the energy consumption capacity of the composite frame with NEDCs for a single cycle becomes significantly higher. AAC wall panels are a brittle building material. General connectors can easily cause damage to the wall panels during installation, making the overall performance of AAC wall panels degrade. AAC wall panels are installed in two ways: inline and outline. NEDC is the connection piece that connects the external AAC wall panel to the steel frame. In the case of an earthquake, the NEDCs reduce the effect of the seismic transverse waves by allowing the bolts to move through the transverse bolt holes in the lower part. The seismic longitudinal waves cause the bolts to move in the vertical bolt holes in the upper part of the NEDC to reduce the effect of vertical seismic waves. This achieves the purpose of reducing earthquake energy and protecting the integrity of the building. Loading is significantly higher than that obtained with hook bolt connectors. The study findings revealed that NEDCs can be used to improve the seismic performance of assembled steel structures with AAC exterior wall panels and provide improved safety.

Author Contributions

Conceptualization, K.D.; methodology, K.D.; software, K.D. and K.W.; investigation, K.D. and K.W.; resources, K.D.; data curation, K.W. and T.Y.; writing—original draft preparation, K.D. and K.W.; writing—review and editing, K.D. and T.Y.; visualization, K.W.; supervision, K.D. and T.Y.; project administration, K.D.; funding acquisition, K.D. All authors have read and agreed to the published version of the manuscript.

Funding

This research was funded by the University Synergy Innovation Program of Anhui Province (GXXT-2019-005); First-class undergraduate major in Anhui Province (2020ylzyx04); University-level key discipline-Structural engineering in Anhui Xinhua University (ZDXK201701); Provincial Natural Science Key Research Project of Anhui Higher Education Institution (KJ2019A0883); Scientific Research Project of Key Laboratory of Building Structure in Anhui Province General Universities (KLBSZD202104); Natural Science Research Projects in Anhui Universities (KJ2020A0794).

Institutional Review Board Statement

Not applicable.

Informed Consent Statement

Not applicable.

Data Availability Statement

Not applicable.

Acknowledgments

This research was financially supported by the University Synergy Innovation Program of Anhui Province (GXXT-2019-005).

Conflicts of Interest

The authors declare no conflict of interest.

References

  1. Kalpana, M.; Mohith, S. Study on autoclaved aerated concrete. Mater. Today Proc. 2020, 22, 894–896. [Google Scholar] [CrossRef]
  2. Cao, Z.; Du, P.; Fan, F.; Fang, M. Cyclic testing and parametric analyses of the fabricated steel frames infilled with autoclaved aerated concrete panels. Adv. Struct. Eng. 2017, 20, 1–12. [Google Scholar]
  3. Ding, K.; Zhang, Y. Experimental study on seismic performance of fabricated bolted joint under low-cycle reciprocating loads. Results Eng. 2021, 9, 100208. [Google Scholar] [CrossRef]
  4. Okazaki, T.; Nakashima, M.; Suita, K.; Matusmiya, T. Interaction between cladding and structural frame observed in a full-scale steel building test. Earthq. Eng. Struct. Dyn. 2010, 36, 35–53. [Google Scholar] [CrossRef]
  5. Ravichandran, S.S.; Klingner, R.E. Behavior of Steel Moment Frames with Autoclaved Aerated Concrete Infills. ACI Struct. J. 2012, 109, 83–90. [Google Scholar]
  6. Du, D.; Wang, S.; Li, W.; Xu, F.; Liu, W. Seismic Performance of the Pre-Fabricated Steel Frame Infilled with AAC Wall Panels and their Joint Connection: Full-Scale Shaking Table Test. J. Earthq. Tsunami 2019, 13, 1940004. [Google Scholar] [CrossRef]
  7. Cao, X.Y.; Shen, D.; Feng, D.C.; Wang, C.L.; Qu, Z.; Wu, G. Seismic retrofitting of existing frame buildings through externally attached sub-structures: State of the art review and future perspectives. J. Build. Eng. 2022, 57, 104904. [Google Scholar] [CrossRef]
  8. Bergmans, J.; Nielsen, P.; Snellings, R.; Broos, K. Recycling of autoclaved aerated concrete in floor screeds: Sulfate leaching reduction by ettringite formation. Constr. Build. Mater. 2016, 111, 9–14. [Google Scholar] [CrossRef] [Green Version]
  9. Zhang, G.; Xiao, W.; Chen, S.; Miao, Q.; Wu, H. Study of seismic behavior of autoclaved lightweight concrete wallboard. Ind. Build. 2016, 46, 86–92. [Google Scholar]
  10. Zhang, G.; Xiao, W.; Chen, B.; Lu, Q. Experimental study on aseismic performance of aerated lightweight concrete wall panel swing node. Archit. Technol. 2016, 47, 261–265. [Google Scholar]
  11. Getz, D.R.; Memari, A.M. Static and Cyclic Racking Performance of Autoclaved Aerated Concrete Cladding Panels. J. Archit. Eng. 2006, 12, 12–23. [Google Scholar] [CrossRef]
  12. Wang, B.; Wang, J.; Wang, X.; Gong, X.; Wan, H. Experimental study on seismic behavior of concrete-filled steel tubular frames with ALC wall panels. J. Build. Struct. 2013, 34, 147–153. [Google Scholar] [CrossRef]
  13. Özkılıç, Y. The effects of stiffener configuration on stiffened T stubs. Steel and Composite Structures. Steel Compos. Struct. 2022, 44, 475–488. [Google Scholar]
  14. Özkılıç, Y.O. The capacities of unstiffened T-stubs with thin plates and large bolts. J. Constr. Steel Res. 2021, 186, 106908. [Google Scholar] [CrossRef]
  15. Özkılıç, Y.O. The capacities of thin plated stiffened T-stubs. J. Constr. Steel Res. 2021, 186, 106912. [Google Scholar] [CrossRef]
  16. Özkılıç, Y.O.; Topkaya, C. The plastic and the ultimate resistance of four-bolt extended end-plate connections. J. Constr. Steel Res. 2021, 181, 106614. [Google Scholar] [CrossRef]
  17. Gokmen, F.; Binici, B.; Aldemir, A.; Taghipour, A.; Canbay, E. Seismic behavior of autoclaved aerated concrete low rise buildings with reinforced wall panels. Bull. Earthq. Eng. 2019, 17, 3933–3957. [Google Scholar] [CrossRef]
  18. Cao, X.Y.; Feng, D.C.; Li, Y. Assessment of various seismic fragility analysis approaches for structures excited by non-stationary stochastic ground motions. Mech. Syst. Signal Process. 2023, 186, 109838. [Google Scholar] [CrossRef]
  19. Binici, B.; Canbay, E.; Aldemir, A.; Demirel, I.O.; Uzgan, U.; Eryurtlu, Z.; Bulbul, K.; Yakut, A. Seismic behavior and improvement of autoclaved aerated concrete infill walls. Eng. Struct. 2019, 193, 68–81. [Google Scholar] [CrossRef]
  20. Wang, J.; Li, B. Cyclic testing of square CFST frames with ALC panel or block walls. J. Constr. Steel Res. 2017, 130, 264–279. [Google Scholar] [CrossRef]
  21. PRC. Code for Seismic Design of Buildings GB 50011-2010; China Building Industry Press: Beijing, China, 2010. [Google Scholar]
  22. PRC. Metallic Materials-Tensile Testing GB/T 228.1-2010; China Building Industry Press: Beijing, China, 2010. [Google Scholar]
  23. Lu, H.; Zhang, H.; Ma, K.; Wu, Q.; Jiang, L. Experimental study and numerical study on shear bearing capacity of shear key joints of reinforced concrete open-web sandwich plates. Adv. Mater. Sci. Eng. 2021, 22, 6197472. [Google Scholar] [CrossRef]
  24. Ding, K.; Chen, D.; Liu, Y.; Xia, S. Theoretical and experimental study on mechanical, behavior of laminated slabs with new type joints. China Civ. Eng. J. 2015, 48, 64–69. (In Chinese) [Google Scholar]
  25. Ding, K.; Liu, J.; Ren, J.W.; Ma, W. Dynamic Responses of Cellular Metal-Filled Steel Beam-Column Joint Under Impact Loading. J. Shanghai Jiaotong Univ. 2020, 25, 384–393. [Google Scholar] [CrossRef]
  26. Cao, X.Y.; Feng, D.C.; Wang, Z.; Wu, G. Parametric investigation of the assembled bolt-connected buckling-restrained brace and performance evaluation of its application into structural retrofit. J. Build. Eng. 2022, 48, 103988. [Google Scholar] [CrossRef]
  27. Özkılıç, Y. A new replaceable fuse for moment resisting frames: Replaceable bolted reduced beam section connections. Steel Compos. Struct. 2020, 35, 353–370. [Google Scholar]
  28. Özkılıç, Y.O.; Bozkurt, M.B.; Topkaya, C. Mid-spliced end-plated replaceable links for eccentrically braced frames. Eng. Struct. 2021, 237, 112225. [Google Scholar] [CrossRef]
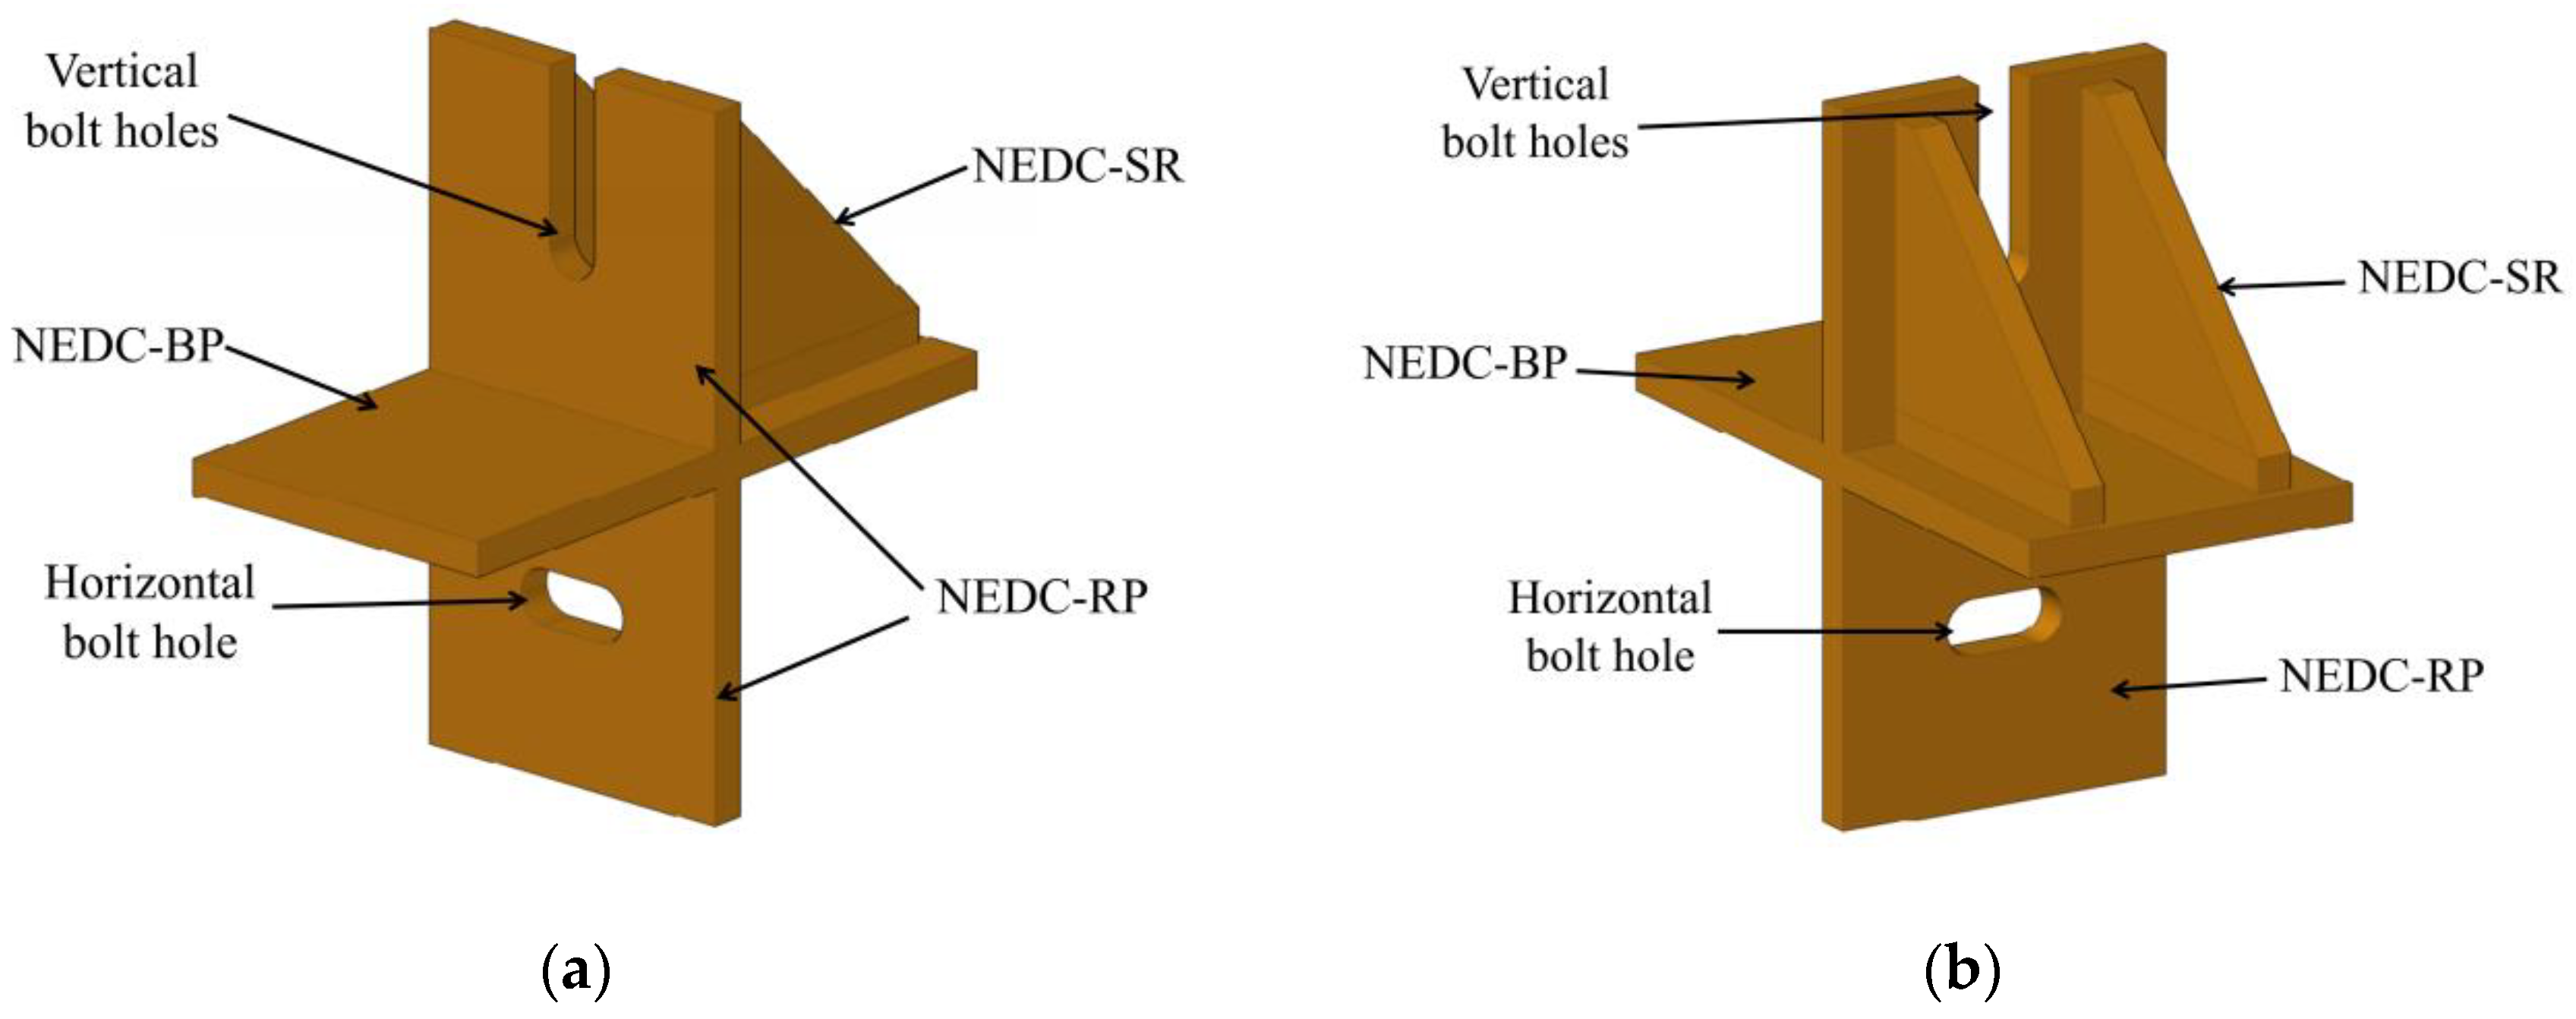
Figure 1. Schematic depicting the structure of the new energy dissipation connector (NEDC): (a) front view; (b) rear view.
Applsci 12 13035 g001
Figure 2. Dimensional drawing of the new energy dissipation connector: (a) Front View; (b) Overhead view; (c) Side view.
Applsci 12 13035 g002
Figure 3. Schematic of the connections between NEDC and the AAC wall panel frame: (a) upper connection; (b) lower connection.
Applsci 12 13035 g003
Figure 4. Schematic of NEDC connecting the upper and lower AAC wall panels.
Applsci 12 13035 g004
Figure 5. Force diagrams of NEDC and AAC wall panel.
Applsci 12 13035 g005
Figure 6. Pictures of the connectors used: (a) hook bolts; (b) NEDC.
Applsci 12 13035 g006
Figure 7. Images showing the production process of AAC wall panels: (a) tied rebar is coated with anti-corrosion solution; (b) concrete filling; (c) concrete setting; (d) concrete cutting; (e) concrete subjected to pressurized aeration; (f) formation of the AAC panel.
Applsci 12 13035 g007
Figure 8. Images depicting the different stages of test piece installation: (a) installation of the steel frame; (b) installation of AAC wall panels; (c) installation of bolts; (d) application of mortar in AAC joints; (e) completed installation.
Applsci 12 13035 g008
Figure 9. Diagram of the loading device used.
Applsci 12 13035 g009
Figure 10. Loading system.
Applsci 12 13035 g010
Figure 11. Equipment used for the test: (a) Displacement meter; (b) data collector; (c) crack observer.
Applsci 12 13035 g011
Figure 12. Images depicting the results of the loading test used for specimen SF-1: (a) splicing of the AAC wall panel due to mortar cracking; (b) mortar falling off from the spliced AAC wall panel; (c) cracks in bolt holes; (d) AAC wall panels damaged at the corners; (e) oblique cracks in the middle of the AAC wall panel; (f) overall view of the wall panel frame after the test.
Applsci 12 13035 g012
Figure 13. Images depicting the results of the loading test used for specimen SF-2: (a) fragments of the AAC wallboard fall off; (b) splicing of the AAC wall panel due to mortar cracking; (c) damaged corners of the AAC wall panel; (d) weld fracture of the steel frame; (e) overall view of the wall panel frame after the test.
Applsci 12 13035 g013
Figure 14. Diagrams depicting the wall panel cracks in specimens SF-1 (a) and SF-2 (b).
Applsci 12 13035 g014
Figure 15. Hysteresis curves of SF-1 (a) and SF-2 (b).
Applsci 12 13035 g015
Figure 16. Skeleton curves of SF-1 and SF-2.
Applsci 12 13035 g016
Figure 17. Strength degradation curves of SF-1 and SF-2.
Applsci 12 13035 g017
Figure 18. Stiffness degradation curves of SF-1 and SF-2.
Applsci 12 13035 g018
Figure 19. Dissipation capacity area.
Applsci 12 13035 g019
Figure 20. Energy dissipation coefficients of specimens SF-1 and SF-2.
Applsci 12 13035 g020
Figure 21. Energy consumption of specimens SF-1 and SF-2 per loading cycle.
Applsci 12 13035 g021
Table 1. Specimens used for the test and their characteristics.
SpecimenConnection TypeBolt Performance Grade
SF-1Hook bolts8.8
SF-2NEDC8.8
Table 2. Mechanical properties of steel.
SpecimenSectional Dimension
(mm)
Thickness
(mm)
Yield Stress
(N/mm²)
Ultimate Stress
(N/mm²)
Elongation
Steel beam flangeHM 244 × 175 × 7 × 1111263.4401.625.2%
Steel beam webHM 244 × 175 × 7 × 117275.3411.322.3%
Steel column flangeHW 200 × 200 × 8 × 1212289.5435.424.7%
Steel column webHW 200 × 200 × 8 × 128278.2409.820.8%
Q345 10376.6510.119.6%
Table 3. Technical specifications of the AAC panel.
Comprehensive StrengthDry DensityModulus of ElasticityDrying Shrinkage ValueCoefficient of Heat ConductivityFreezing Resistance
3.5 MPa508 kg/m³1700 MPa0.33 mm/m0.128 W/(m·K)3.6 MPa
Table 4. Characteristic points in the skeleton curves of SF-1 and SF-2.
SpecimensDirectionPy.t/kNΔy.t/mmPm.t/kNΔm.t/mmPf.t/kNΔf.t/mm
SF-1(+)131.9739.53169.1975.35143.81121.51
(−)110.7142.41141.9490.35120.65120.34
SF-2(+)143.0342.19183.3789.69155.87146.23
(−)123.6143.37158.4790.68134.69145.21
Table 5. Ductility coefficients of specimens SF-1 and SF-2.
SpecimenDirectionΔy/mmΔu/mmθyθuμ
SF-1+39.53121.511/761/253.07
42.41120.341/711/252.84
SF-2+42.19146.231/711/213.47
43.37145.211/691/213.34
Table 6. Factors associated with energy consumption for specimens SF-1 and SF-2.
SpecimenDisplacementTotal Energy ConsumptionEnergy Consumption FactorEquivalent Damping Factor
SF-112079,879.920.6281330.09997
SF-2150160,672.3920.7188370.114406
Publisher’s Note: MDPI stays neutral with regard to jurisdictional claims in published maps and institutional affiliations.