
Multivariate ERP Analysis of Neural Activations Underlying Processing of Aesthetically Manipulated Self-Face

Abstract
1. Introduction
2. Method
2.1. Participants
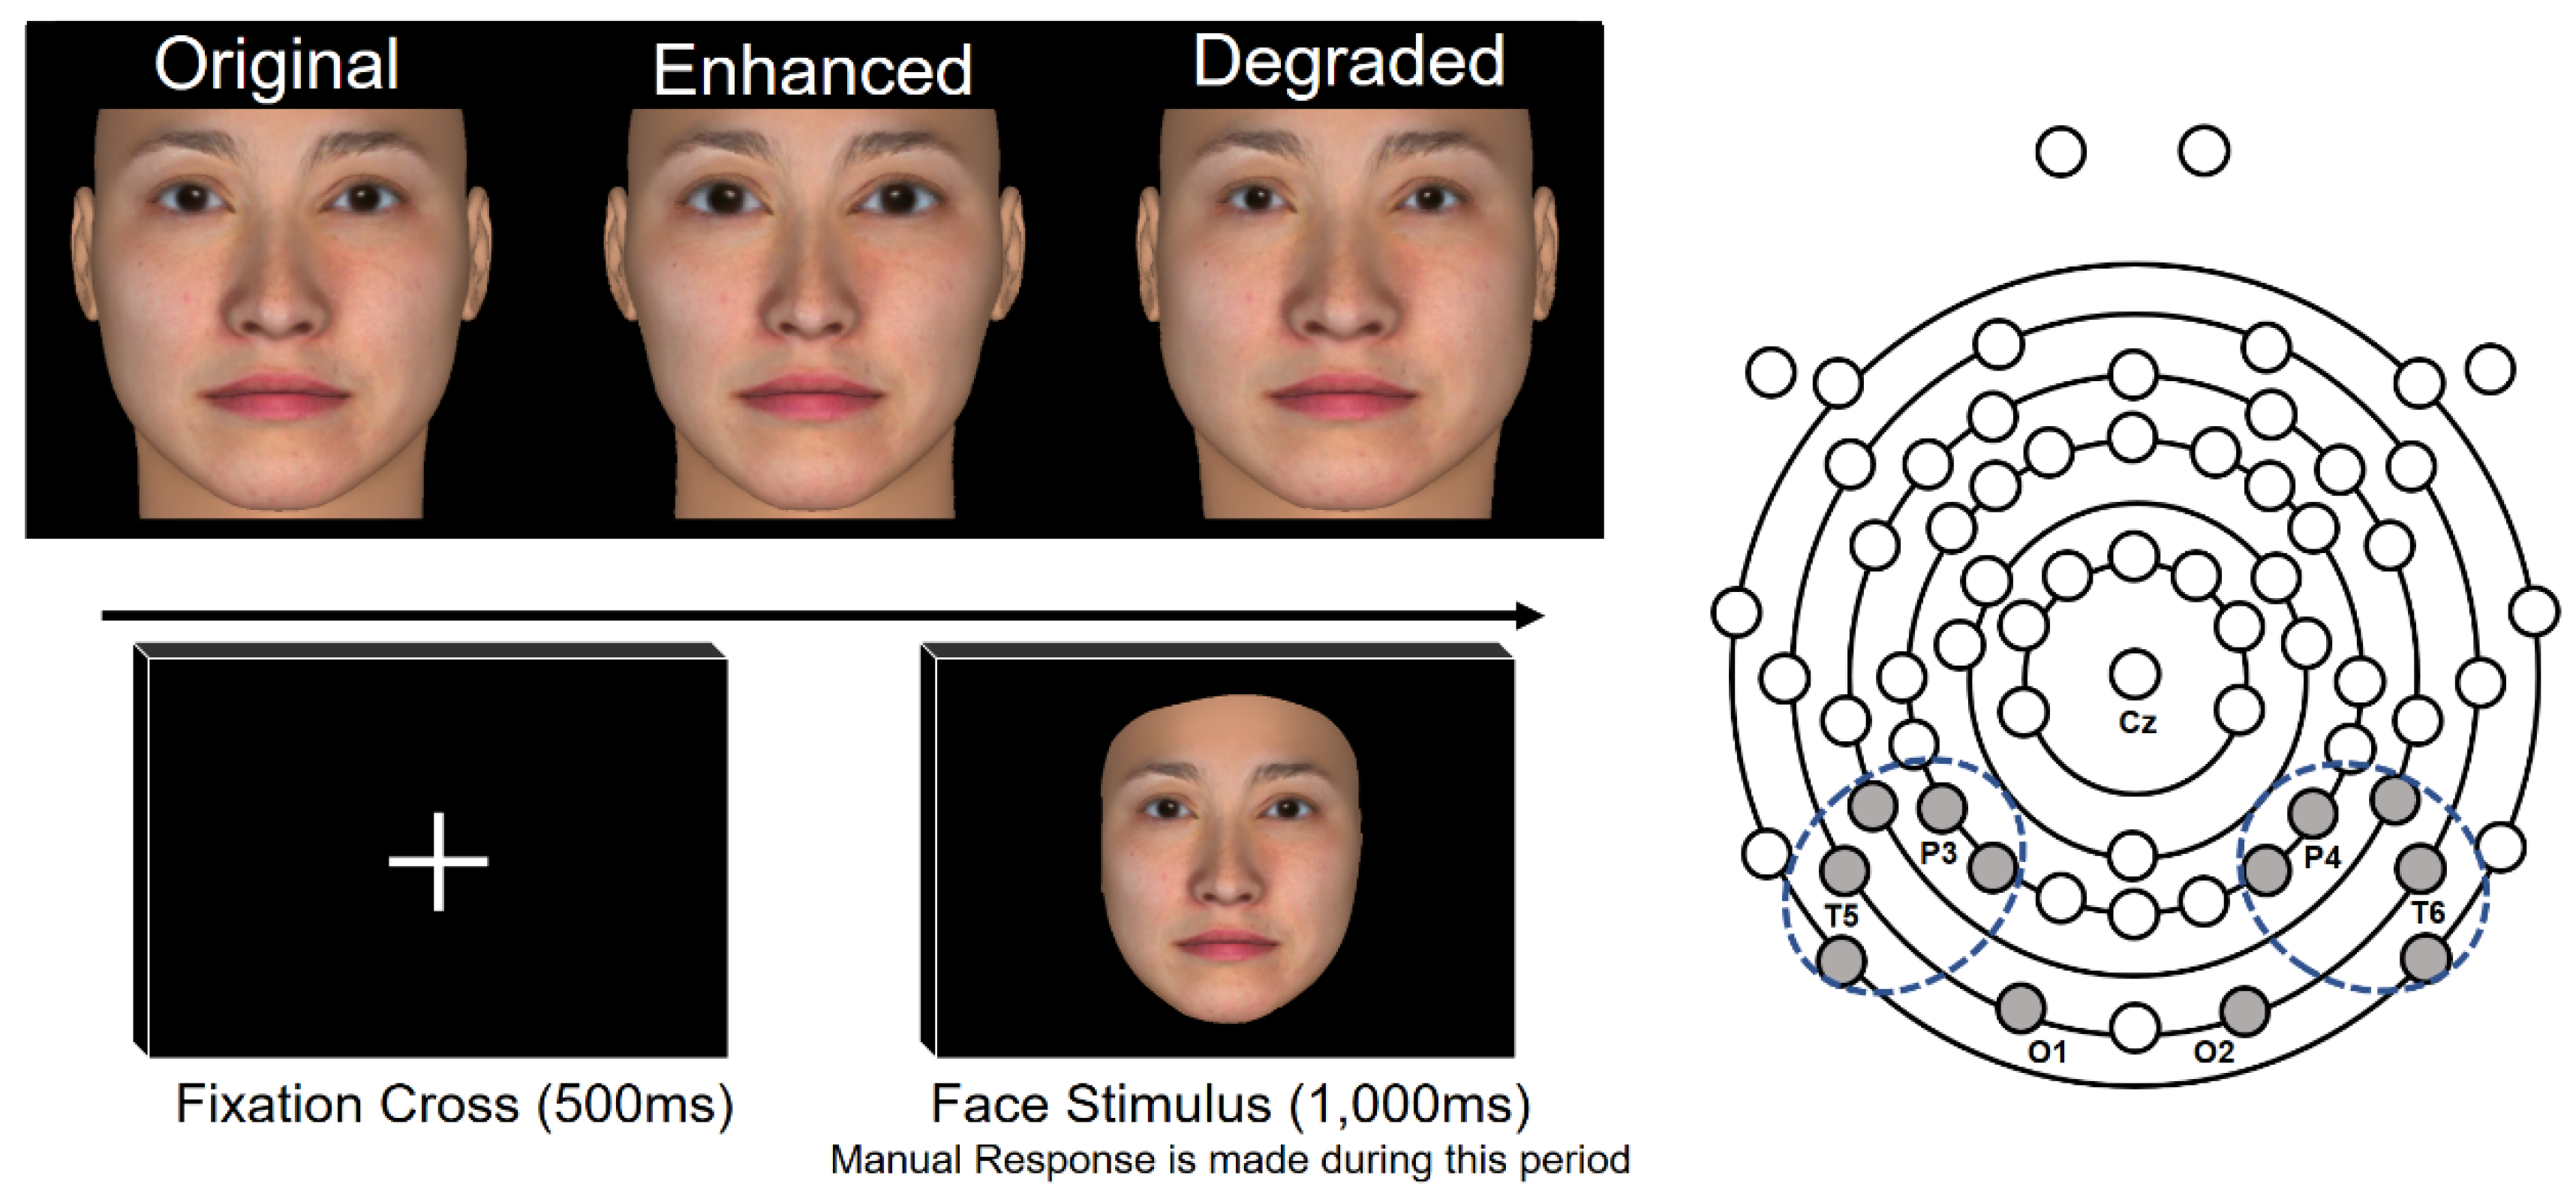
2.2. Stimulus
2.3. Procedure
2.3.1. EEG Measurement
2.3.2. Post ERP Measurement Experiment
2.4. Analysis
2.4.1. Behaviour
2.4.2. ERP
Conventional ERP Analysis
Time Series Analysis by Cluster Permutation Statistics
Diagonal Decoding in Multivariate Analysis
Temporal Generalization Analysis
3. Results
3.1. RT and Accuracy Rate
3.2. ERP Results
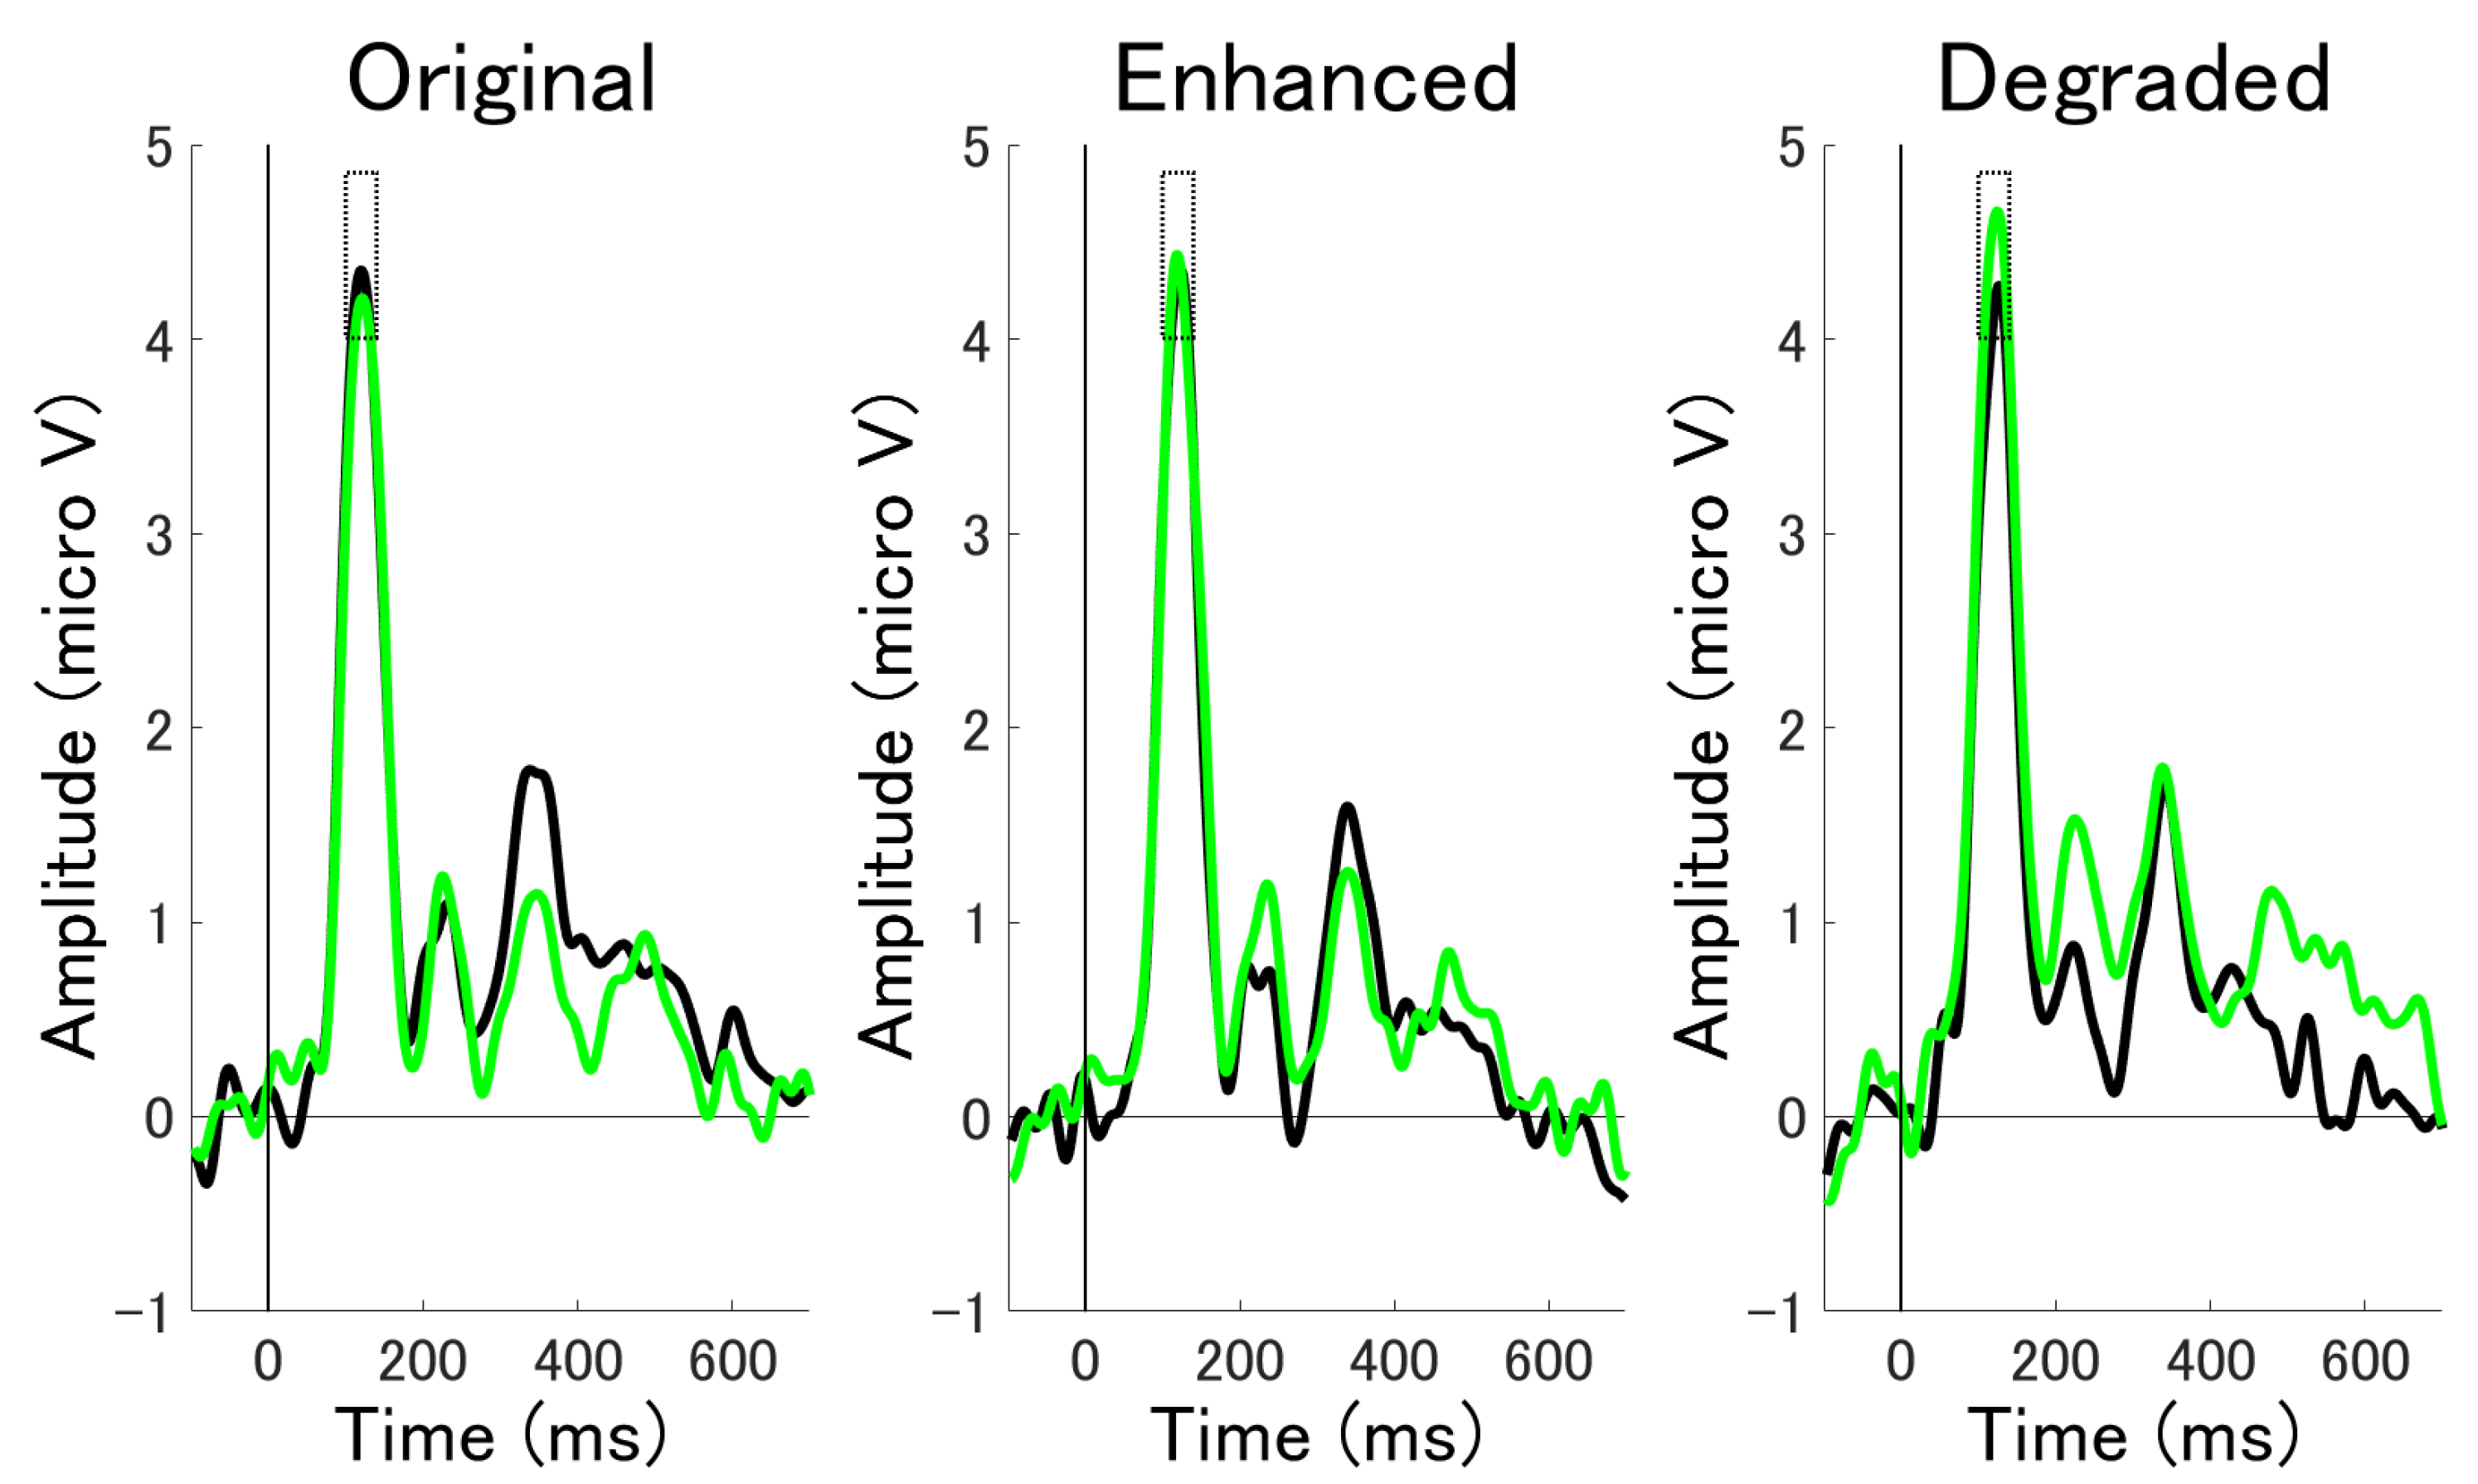
3.2.1. ERP Mean Amplitude Analysis at Occipital Electrodes
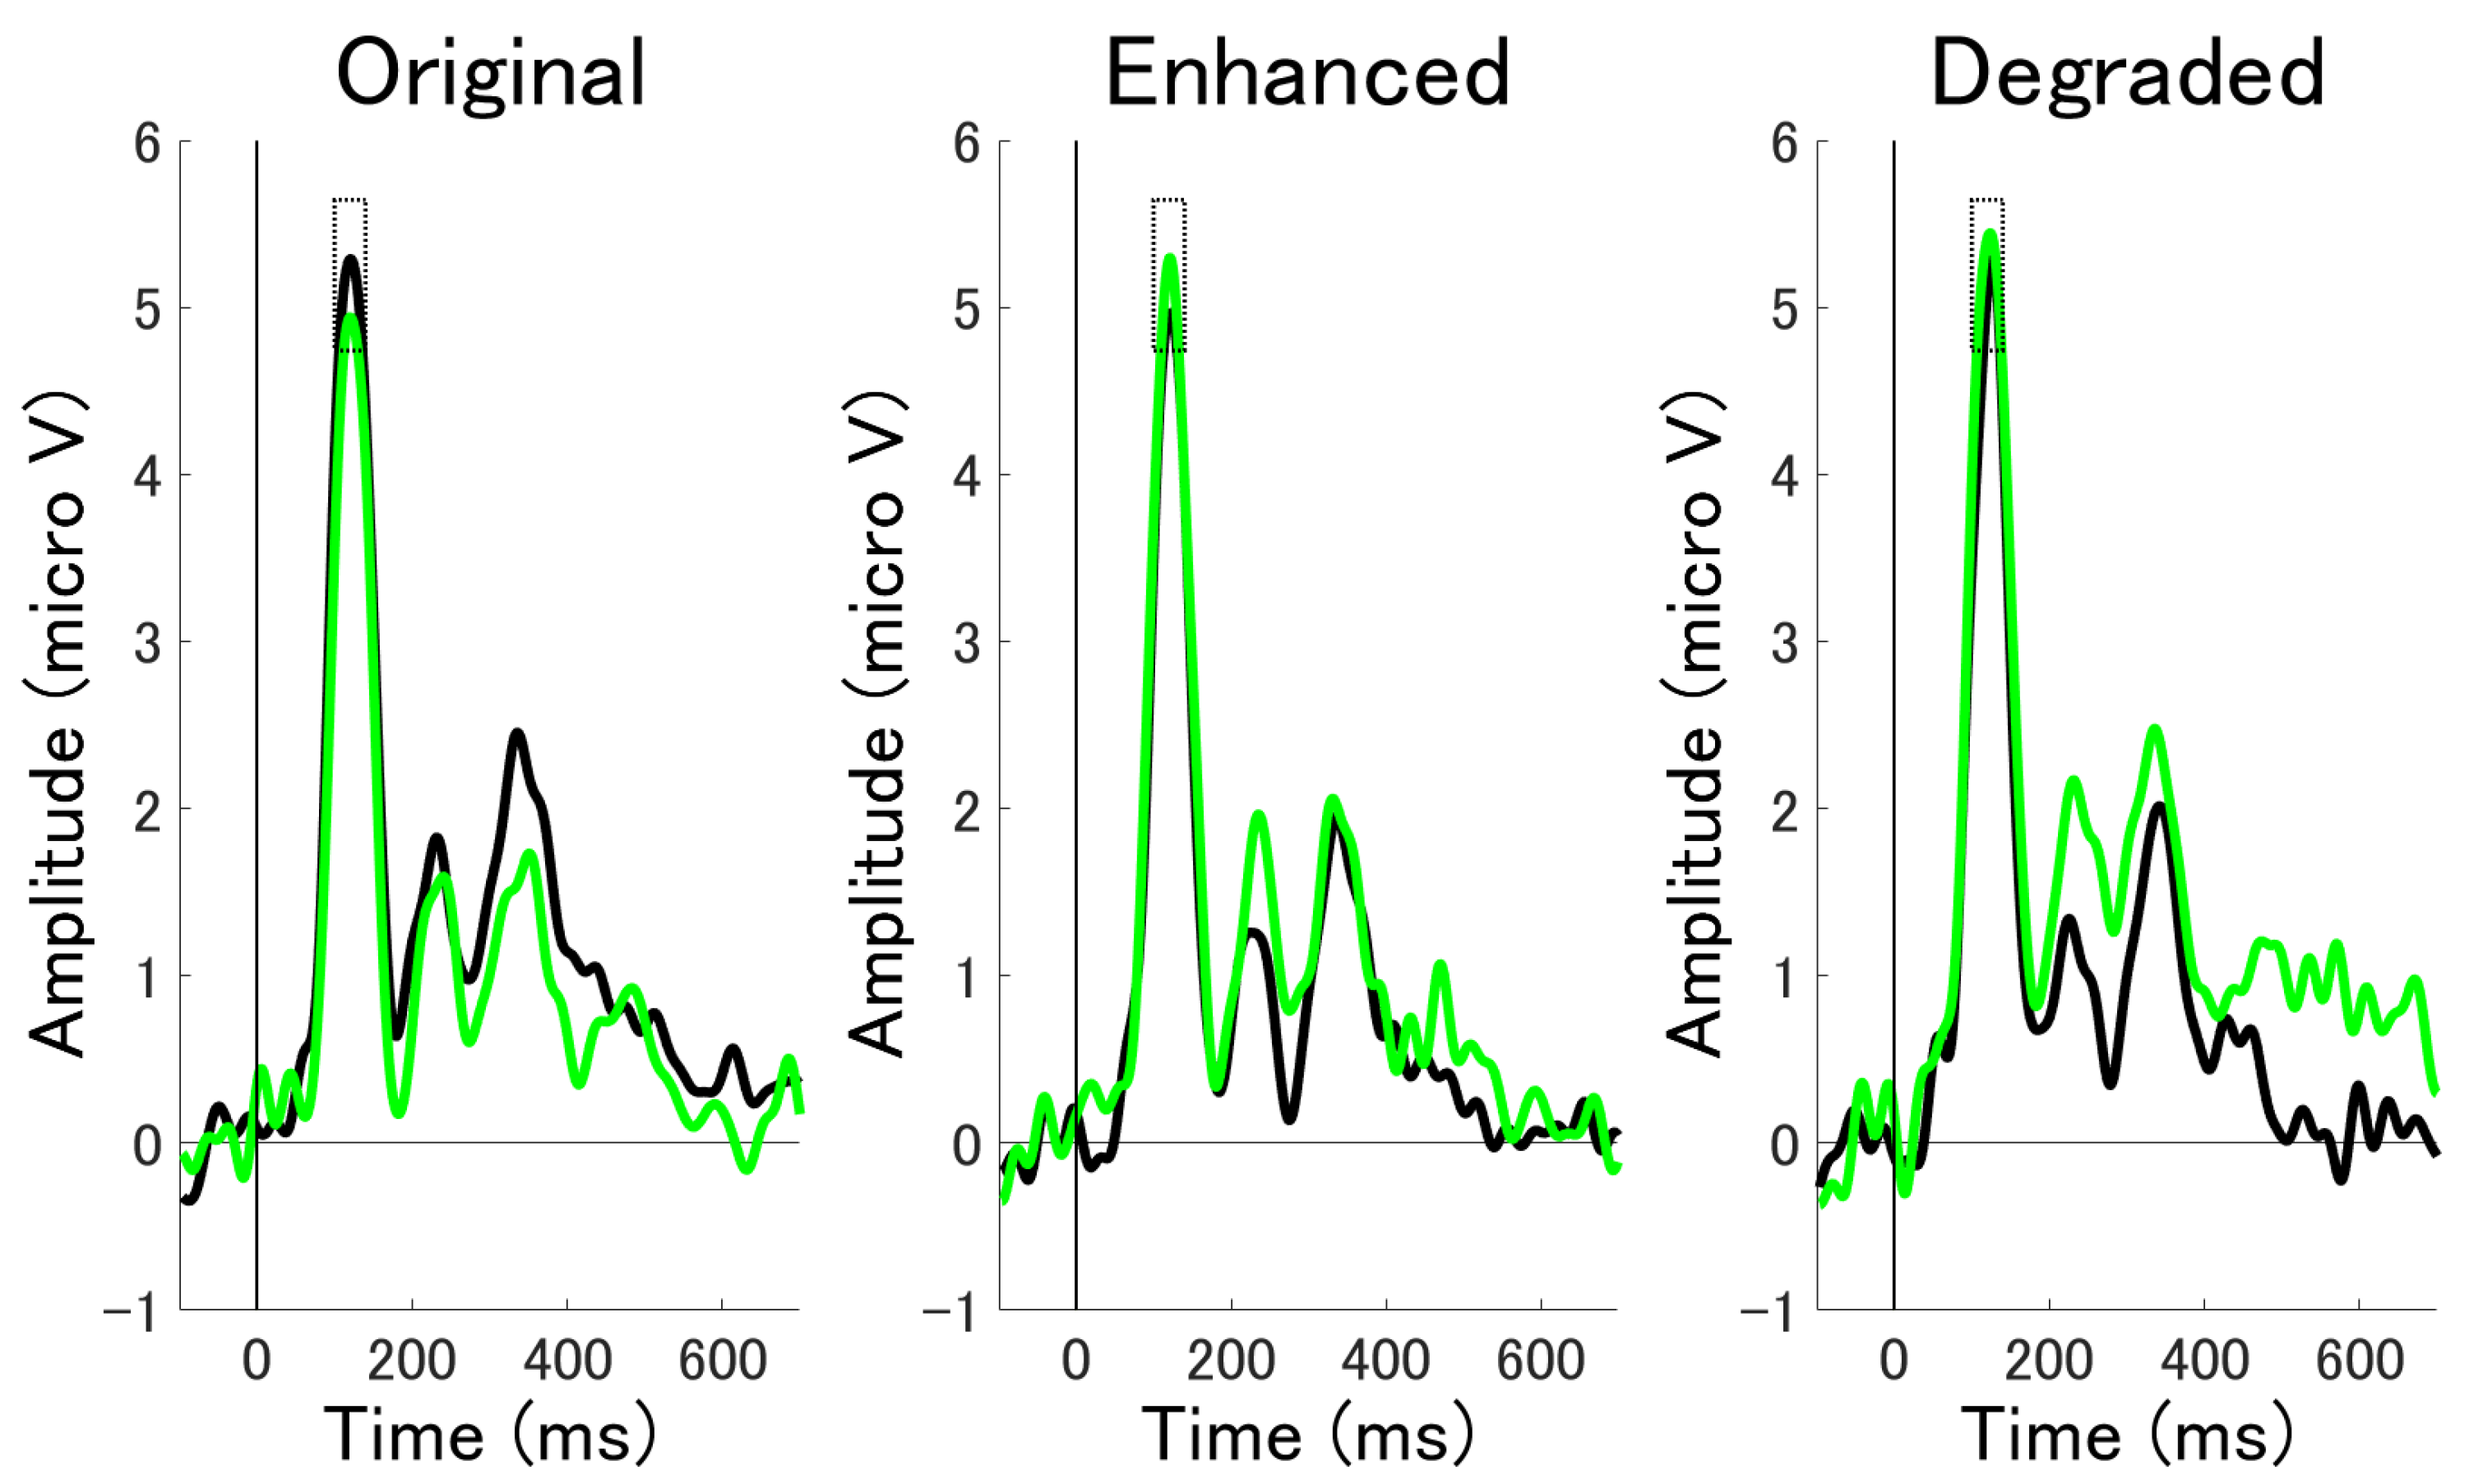
3.2.2. ERP Mean Amplitude Analysis at Occipito-Temporal Electrode Clusters
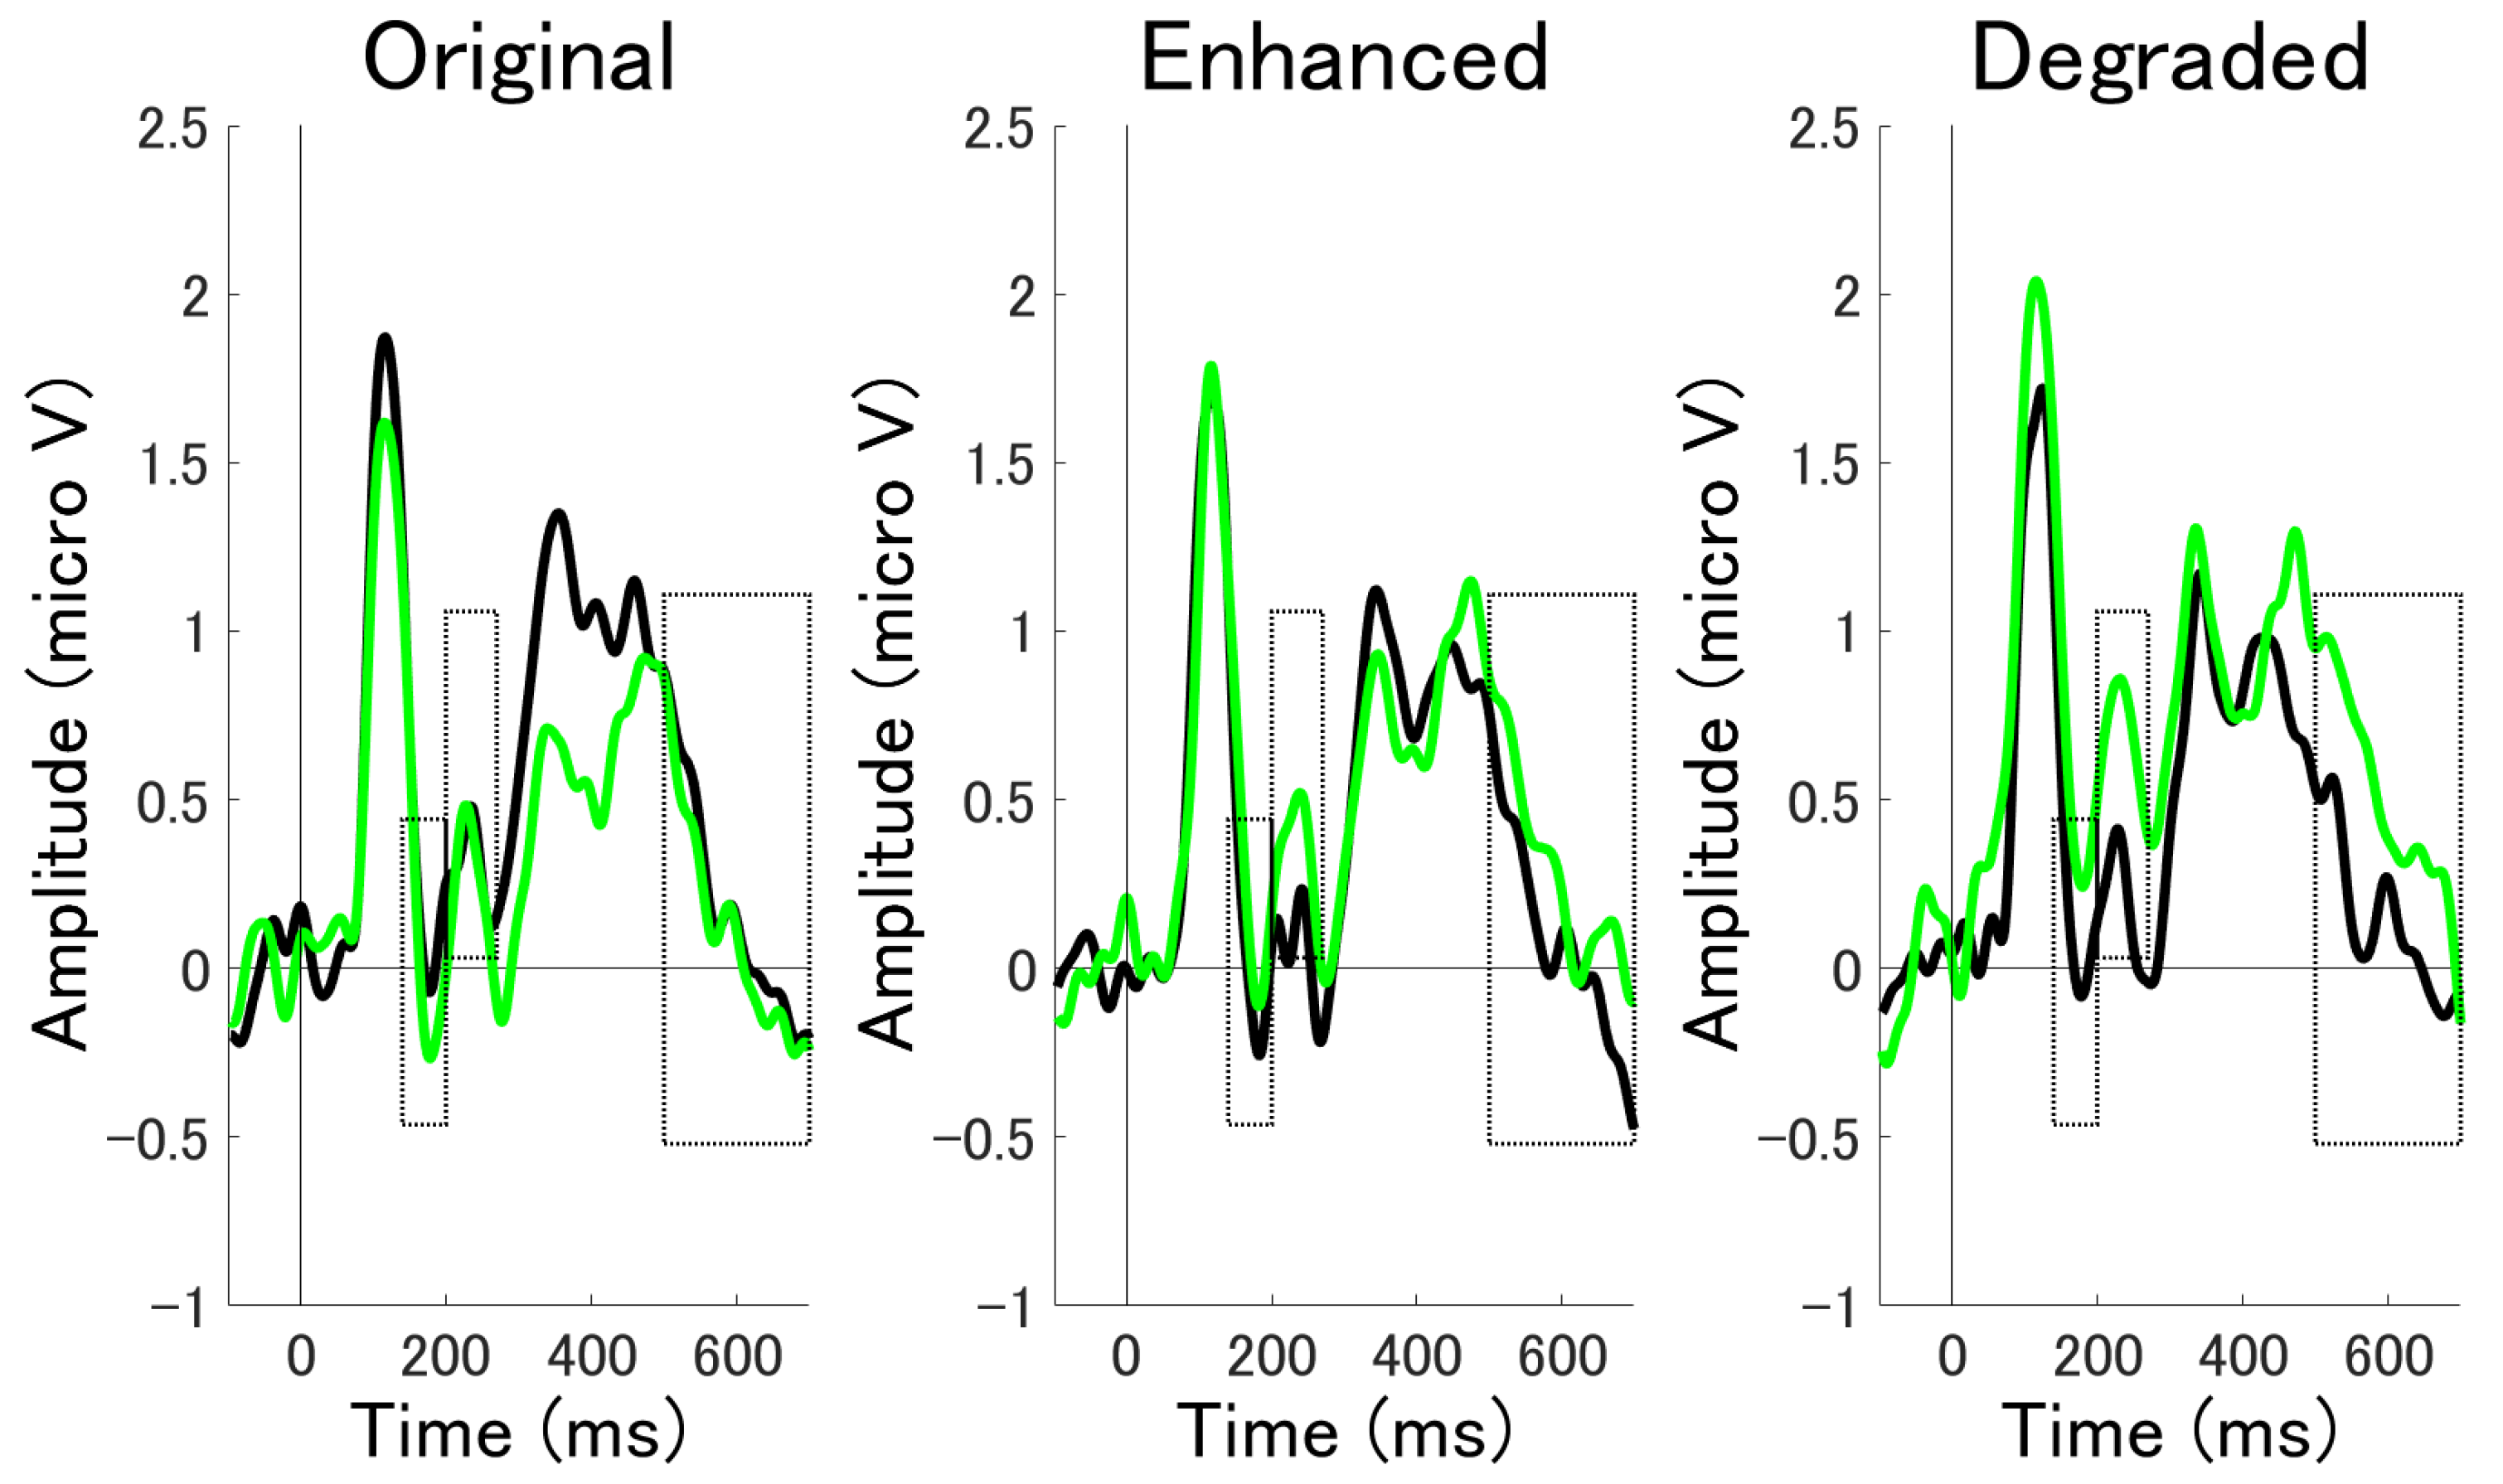
3.2.3. Time Series Analysis by Cluster Permutation Statistics
3.3. Diagonal Decoding Results in Multivariate Analysis
3.4. Temporal Generalization Analysis Results
3.5. Subjective Evaluation
4. Discussion and Conclusions
Funding
Institutional Review Board Statement
Informed Consent Statement
Data Availability Statement
Acknowledgments
Conflicts of Interest
References
- Horton, R.S. Similarity and Attractiveness in Social Perception: Differentiating Between Biases for the Self and the Beautiful. Self Identity 2003, 2, 137–152. [Google Scholar] [CrossRef]
- Huang, C. Self-concept and academic achievement: A meta-analysis of longitudinal relations. J. Sch. Psychol. 2011, 49, 505–528. [Google Scholar] [CrossRef] [PubMed]
- Sharot, T.; Garrett, N. Forming Beliefs: Why Valence Matters. Trends Cogn. Sci. 2016, 20, 25–33. [Google Scholar] [CrossRef]
- Hoorens, V. Self-enhancement and Superiority Biases in Social Comparison. Eur. Rev. Soc. Psychol. 1993, 4, 113–139. [Google Scholar] [CrossRef]
- Zuckerman, E.W.; Jost, J.T. What Makes You Think You’re so Popular? Self-Evaluation Maintenance and the Subjective Side of the “Friendship Paradox”. Soc. Psychol. Q. 2001, 64, 207–223. [Google Scholar] [CrossRef]
- Schwinghammer, S.A.; Stapel, D.A.; Blanton, H. Different Selves Have Different Effects: Self-Activation and Defensive Social Comparison. Pers. Soc. Psychol. Bull. 2006, 32, 27–39. [Google Scholar] [CrossRef]
- Osman, S.; Cooper, M.; Hackmann, A.; Veale, D. Spontaneously occurring images and early memories in people with body dysmorphic disorder. Memory 2004, 12, 428–436. [Google Scholar] [CrossRef]
- Epley, N.; Whitchurch, E. Mirror, Mirror on the Wall: Enhancement in Self-Recognition. Pers. Soc. Psychol. Bull. 2008, 34, 1159–1170. [Google Scholar] [CrossRef]
- Bola, M.; Paź, M.; Doradzińska, L.; Nowicka, A. The self-face captures attention without consciousness: Evidence from the N2pc ERP component analysis. Psychophysiology 2020, 58, e13759. [Google Scholar] [CrossRef]
- Kedia, G.; Mussweiler, T.; Adam, R.; Ischebeck, A.; Ihssen, N.; Linden, D.E.J. So pretty! The neural correlates of self-other vs familiar-other attractiveness comparisons. Soc. Neurosci. 2017, 14, 41–52. [Google Scholar] [CrossRef]
- Uddin, L.Q.; Kaplan, J.T.; Molnar-Szakacs, I.; Zaidel, E.; Iacoboni, M. Self-face recognition activates a frontoparietal “mirror” network in the right hemisphere: An event-related fMRI study. Neuroimage 2005, 25, 926–935. [Google Scholar] [CrossRef] [PubMed]
- Platek, S.M.; Keenan, J.P.; Gallup, G.G.; Mohamed, F.B. Where am I? The neurological correlates of self and other. Cogn. Brain Res. 2004, 19, 114–122. [Google Scholar] [CrossRef] [PubMed]
- Tacikowski, P.; Nowicka, A. Allocation of attention to self-name and self-face: An ERP study. Biol. Psychol. 2010, 84, 318–324. [Google Scholar] [CrossRef] [PubMed]
- Ota, C.; Nakano, T. Self-Face Activates the Dopamine Reward Pathway without Awareness. Cereb. Cortex 2021, 31, 4420–4426. [Google Scholar] [CrossRef]
- Ota, C.; Nakano, T. Neural correlates of beauty retouching to enhance attractiveness of self-depictions in women. Soc. Neurosci. 2021, 16, 121–133. [Google Scholar] [CrossRef]
- Wiederman, M.W. Women’s body image self-consciousness during physical intimacy with a partner. J. Sex Res. 2000, 37, 60–68. [Google Scholar] [CrossRef]
- John, D.H.; Ebbeck, V. Gender-Differentiated Associations among Objectified Body Consciousness, Self-Conceptions and Physical Activity. Sex Roles 2008, 59, 623–632. [Google Scholar] [CrossRef]
- Oranges, C.M.; Schaefer, K.M.; Gohritz, A.; Haug, M.; Schaefer, D.J. The Mirror Effect on Social Media Self-perceived Beauty and Its Implications for Cosmetic Surgery. Plast. Reconstr. Surg. Glob. Open 2016, 4, e1088. [Google Scholar] [CrossRef]
- Keyes, H.; Brady, N.; Reilly, R.B.; Foxe, J.J. My face or yours? Event-related potential correlates of self-face processing. Brain Cogn. 2010, 72, 244–254. [Google Scholar] [CrossRef]
- Caharel, S.; Poiroux, S.; Bernard, C.; Thibaut, F.; LaLonde, R.; Rebai, M. ERPs Associated with Familiarity and Degree of Familiarity during Face Recognition. Int. J. Neurosci. 2002, 112, 1499–1512. [Google Scholar] [CrossRef]
- Luck, S.J. An Introduction to The Event-Related Potential Technique, 2nd ed.; MIT Press: Cambridge, MA, USA, 2014. [Google Scholar]
- Kayser, J.; Tenke, C. Optimizing PCA methodology for ERP component identification and measurement: Theoretical rationale and empirical evaluation. Clin. Neurophysiol. 2003, 114, 2307–2325. [Google Scholar] [CrossRef]
- Scharf, F.; Widmann, A.; Bonmassar, C.; Wetzel, N. A tutorial on the use of temporal principal component analysis in developmental ERP research–Opportunities and challenges. Dev. Cogn. Neurosci. 2022, 54, 101072. [Google Scholar] [CrossRef]
- Oostenveld, R.; Fries, P.; Maris, E.; Schoffelen, J.-M. FieldTrip: Open Source Software for Advanced Analysis of MEG, EEG, and Invasive Electrophysiological Data. Comput. Intell. Neurosci. 2011, 156869. [Google Scholar] [CrossRef]
- Brunet, D.; Murray, M.M.; Michel, C.M. Spatiotemporal Analysis of Multichannel EEG: CARTOOL. Comput. Intell. Neurosci. 2011, 813870. [Google Scholar] [CrossRef] [PubMed]
- Nagasawa, T.; Masui, K.; Doi, H.; Ogawa-Ochiai, K.; Tsumura, N. Continuous estimation of emotional change using multimodal responses from remotely measured biological information. Artif. Life Robot. 2022, 27, 19–28. [Google Scholar] [CrossRef]
- Shestyuk, A.Y.; Kasinathan, K.; Karapoondinott, V.; Knight, R.T.; Gurumoorthy, R. Individual EEG measures of attention, memory, and motivation predict population level TV viewership and Twitter engagement. PLoS ONE 2019, 14, e0214507. [Google Scholar] [CrossRef]
- Cecotti, H. Convolutional neural networks for event-related potential detection: Impact of the architecture. In Proceedings of the 2017 39th Annual International Conference of the IEEE Engineering in Medicine and Biology Society (EMBC), Jeju, Korea, 11–15 July 2017; pp. 2031–2034. [Google Scholar] [CrossRef]
- Febles, E.S.; Ortega, M.O.; Sosa, M.V.; Sahli, H. Machine Learning Techniques for the Diagnosis of Schizophrenia Based on Event-Related Potentials. Front. Neuroinformatics 2022, 16, 893788. [Google Scholar] [CrossRef]
- Vahid, A.; Mückschel, M.; Neuhaus, A.; Stock, A.-K.; Beste, C. Machine learning provides novel neurophysiological features that predict performance to inhibit automated responses. Sci. Rep. 2018, 8, 1–15. [Google Scholar] [CrossRef]
- Hong, X.; Bo, K.; Meyyappan, S.; Tong, S.; Ding, M. Decoding attention control and selection in visual spatial attention. Hum. Brain Mapp. 2020, 41, 3900–3921. [Google Scholar] [CrossRef] [PubMed]
- Bode, S.; Feuerriegel, D.; Bennett, D.; Alday, P.M. The Decision Decoding ToolBOX (DDTBOX)–A Multivariate Pattern Analysis Toolbox for Event-Related Potentials. Neuroinformatics 2019, 17, 27–42. [Google Scholar] [CrossRef]
- Grootswagers, T.; Wardle, S.G.; Carlson, T.A. Decoding Dynamic Brain Patterns from Evoked Responses: A Tutorial on Multivariate Pattern Analysis Applied to Time Series Neuroimaging Data. J. Cogn. Neurosci. 2017, 29, 677–697. [Google Scholar] [CrossRef]
- Fahrenfort, J.J.; van Driel, J.; Van Gaal, S.; Olivers, C.N. From ERPs to MVPA Using the Amsterdam Decoding and Modeling Toolbox (ADAM). Front. Neurosci. 2018, 12, 368. [Google Scholar] [CrossRef]
- Edelman, S.; Grill-Spector, K.; Kushnir, T.; Malach, R. Toward direct visualization of the internal shape representation space by fMRI. Psychobiology 1998, 26, 309–321. [Google Scholar] [CrossRef]
- Haxby, J.V.; Gobbini, M.I.; Furey, M.L.; Ishai, A.; Schouten, J.L.; Pietrini, P. Distributed and Overlapping Representations of Faces and Objects in Ventral Temporal Cortex. Science 2001, 293, 2425–2430. [Google Scholar] [CrossRef]
- Mares, I.; Ewing, L.; Farran, E.K.; Smith, F.W.; Smith, M.L. Developmental changes in the processing of faces as revealed by EEG decoding. Neuroimage 2020, 211, 116660. [Google Scholar] [CrossRef]
- Farran, E.K.; Mares, I.; Papasavva, M.; Smith, F.W.; Ewing, L.; Smith, M.L. Characterizing the neural signature of face processing in Williams syndrome via multivariate pattern analysis and event related potentials. Neuropsychologia 2020, 142, 107440. [Google Scholar] [CrossRef]
- Dalski, A.; Kovács, G.; Ambrus, G.G. Evidence for a General Neural Signature of Face Familiarity. Cereb. Cortex 2022, 32, 2590–2601. [Google Scholar] [CrossRef]
- Doi, H.; Shinohara, K. Attention allocation towards own face is pronounced during middle adolescence: An eye-tracking study. Dev. Sci. 2016, 21, e12490. [Google Scholar] [CrossRef]
- Doi, H.; Shinohara, K. Low Salivary Testosterone Level Is Associated with Efficient Attention Holding by Self Face in Women. Front. Behav. Neurosci. 2019, 13, 261. [Google Scholar] [CrossRef]
- Brainard, D.H. The Psychophysics Toolbox. Spat. Vis. 1997, 10, 433–436. [Google Scholar] [CrossRef]
- Ujigawa, M. How the Kawaii Emotion had been Expressed in Japanese-Analysis of Ancient Language and Japanese Dictionaries. Trans. Jpn. Soc. Kansei Eng. 2021, 20, 249–256. (In Japanese) [Google Scholar] [CrossRef]
- Delorme, A.; Makeig, S. EEGLAB: An open-source toolbox for analysis of single-trial EEG dynamics. J. Neurosci. Methods 2004, 134, 9–21. [Google Scholar] [CrossRef] [PubMed]
- Miyakoshi, M.; Kanayama, N.; Iidaka, T.; Ohira, H. EEG evidence of face-specific visual self-representation. NeuroImage 2010, 50, 1666–1675. [Google Scholar] [CrossRef]
- Maris, E.; Oostenveld, R. Nonparametric statistical testing of EEG- and MEG-data. J. Neurosci. Methods 2007, 164, 177–190. [Google Scholar] [CrossRef]
- Skrandies, W. Global field power and topographic similarity. Brain Topogr. 1990, 3, 137–141. [Google Scholar] [CrossRef] [PubMed]
- Dehaene, S.; King, J.-R. Decoding the dynamics of conscious perception: The temporal generalization method. In Micro-, Meso- and Macro-Dynamics of The Brain; Buzsáki, G., Christen, Y., Eds.; Springer International Publishing: New York, NY, USA, 2016; pp. 85–97. [Google Scholar]
- King, J.-R.; Dehaene, S. Characterizing the dynamics of mental representations: The temporal generalization method. Trends Cogn. Sci. 2014, 18, 203–210. [Google Scholar] [CrossRef]
- Keenan, J.P.; Gallup, G.G.; Falk, D. The Face in The Mirror: The Search for The Origins of Consciousness; HarperCollins Publishers: New York, NY, USA, 2003. [Google Scholar]
- Tong, F.; Nakayama, K. Robust representations for faces: Evidence from visual search. J. Exp. Psychol. Hum. Percept. Perform. 1999, 25, 1016–1035. [Google Scholar] [CrossRef]
- van Leeuwen, M.L.; Veling, H.; van Baaren, R.B.; Dijksterhuis, A. The influence of facial attractiveness on imitation. J. Exp. Soc. Psychol. 2009, 45, 1295–1298. [Google Scholar] [CrossRef]
- Felisberti, F.M.; Musholt, K. Self-face perception: Individual differences and discrepancies associated with mental self-face representation, attractiveness and self-esteem. Psychol. Neurosci. 2014, 7, 65–72. [Google Scholar] [CrossRef]
- Li, Z.; Lei, X.; Yan, X.; Hu, Z.; Liu, H. Attractiveness Evaluation and Identity of Self-face: The Effect of Sexual Dimorphism. i-Perception 2021, 12. [Google Scholar] [CrossRef]
- Doi, H.; Sawada, R.; Masataka, N. The effects of eye and face inversion on the early stages of gaze direction perception—An ERP study. Brain Res. 2007, 1183, 83–90. [Google Scholar] [CrossRef] [PubMed]
- Herrmann, M.J.; Ehlis, A.-C.; Ellgring, H.; Fallgatter, A.J. Early stages (P100) of face perception in humans as measured with event-related potentials (ERPs). J. Neural Transm. 2004, 112, 1073–1081. [Google Scholar] [CrossRef]
- Rossion, B.; Lochy, A. Is human face recognition lateralized to the right hemisphere due to neural competition with left-lateralized visual word recognition? A critical review. Brain Struct. Funct. 2021, 227, 599–629. [Google Scholar] [CrossRef] [PubMed]
- Markus, H.R.; Kitayama, S. Culture and the self: Implications for cognition, emotion, and motivation. Psycholo. Rev. 1991, 98, 224–253. [Google Scholar] [CrossRef]
- Sui, J.; Liu, C.H.; Han, S. Cultural difference in neural mechanisms of self-recognition. Soc. Neurosci. 2009, 4, 402–411. [Google Scholar] [CrossRef]
- Turbett, K.; Jeffery, L.; Bell, J.; Digges, A.; Zheng, Y.; Hsiao, J.; Palermo, R. Serial dependence of facial identity for own- and other-race faces. Q. J. Exp. Psychol. 2022, 75, 1711–1726. [Google Scholar] [CrossRef]
- Turbett, K.; Palermo, R.; Bell, J.; Hanran-Smith, D.A.; Jeffery, L. Serial dependence of facial identity reflects high-level face coding. Vis. Res. 2021, 182, 9–19. [Google Scholar] [CrossRef]
- Eimer, M. The face-specific N170 component reflects late stages in the structural encoding of faces. Neuroreport 2000, 11, 2319–2324. [Google Scholar] [CrossRef]
- Benjamini, Y.; Yekutieli, D. The control of the false discovery rate in multiple testing under dependency. Ann. Stat. 2001, 29, 1165–1188. [Google Scholar] [CrossRef]
- Wójcik, M.J.; Nowicka, M.; Kotlewska, I.; Nowicka, A. Self-face Captures, Holds, and Biases Attention. Front. Psychol. 2018, 8, 2371. [Google Scholar] [CrossRef]
- Mingoia, J.; Hutchinson, A.; Gleaves, D.H.; Wilson, C. The Relationship Between Posting and Photo Manipulation Activities on Social Networking Sites and Internalization of a Tanned Ideal Among Australian Adolescents and Young Adults. Soc. Media Soc. 2019, 5. [Google Scholar] [CrossRef]
- Doi, H.; Shinohara, K. Event-related potentials elicited in mothers by their own and unfamiliar infants’ faces with crying and smiling expression. Neuropsychologia 2012, 50, 1297–1307. [Google Scholar] [CrossRef] [PubMed]
- Doi, H.; Morikawa, M.; Inadomi, N.; Aikawa, K.; Uetani, M.; Shinohara, K. Neural correlates of babyish adult face processing in men. Neuropsychologia 2017, 97, 9–17. [Google Scholar] [CrossRef] [PubMed]
- Zebrowitz, L.A.; Luevano, V.X.; Bronstad, P.M.; Aharon, I. Neural activation to babyfaced men matches activation to babies. Soc. Neurosci. 2009, 4, 1–10. [Google Scholar] [CrossRef] [PubMed]
- Rhodes, G. The Evolutionary Psychology of Facial Beauty. Annu. Rev. Psychol. 2006, 57, 199–226. [Google Scholar] [CrossRef]
- Little, A.C.; Jones, B.; DeBruine, L. Facial attractiveness: Evolutionary based research. Philos. Trans. R. Soc. B Biol. Sci. 2011, 366, 1638–1659. [Google Scholar] [CrossRef]


| Self | Other Familiar | |||||
|---|---|---|---|---|---|---|
| Original | Enhanced | Degraded | Original | Enhanced | Degraded | |
| RT (ms) | 494.1 | 505.8 | 513.3 | 493.3 | 484.4 | 492.2 |
| (73.7) | (87.0) | (104.8) | (68.9) | (84.1) | (68.3) | |
| Accuracy (%) | 93.6 | 93.7 | 93.7 | 95.1 | 93.6 | 94.9 |
| (4.9) | (4.5) | (5.9) | (4.7) | (5.4) | (5.4) | |
| Self | Other Familiar | |||||
|---|---|---|---|---|---|---|
| Original | Enhanced | Degraded | Original | Enhanced | Degraded | |
| Attractiveness | 9.4 | 10.5 | 5.5 | 13.2 | 14.3 | 9.1 |
| (3.9) | (3.3) | (3.1) | (1.5) | (2.6) | (1.9) | |
| Prettiness | 8.9 | 11.1 | 5.9 | 12.4 | 14.6 | 9.3 |
| (3.4) | (3.7) | (3.1) | (1.4) | (2.5) | (2.1) | |
| Similarity | 18.6 | 15.3 | 14.8 | 4.8 | 4.9 | 5.1 |
| (3.3) | (3.4) | (2.9) | (3.1) | (3.1) | (3.0) | |
Publisher’s Note: MDPI stays neutral with regard to jurisdictional claims in published maps and institutional affiliations. |
© 2022 by the author. Licensee MDPI, Basel, Switzerland. This article is an open access article distributed under the terms and conditions of the Creative Commons Attribution (CC BY) license (https://creativecommons.org/licenses/by/4.0/).
Share and Cite
Doi, H. Multivariate ERP Analysis of Neural Activations Underlying Processing of Aesthetically Manipulated Self-Face. Appl. Sci. 2022, 12, 13007. https://doi.org/10.3390/app122413007
Doi H. Multivariate ERP Analysis of Neural Activations Underlying Processing of Aesthetically Manipulated Self-Face. Applied Sciences. 2022; 12(24):13007. https://doi.org/10.3390/app122413007
Chicago/Turabian StyleDoi, Hirokazu. 2022. "Multivariate ERP Analysis of Neural Activations Underlying Processing of Aesthetically Manipulated Self-Face" Applied Sciences 12, no. 24: 13007. https://doi.org/10.3390/app122413007
APA StyleDoi, H. (2022). Multivariate ERP Analysis of Neural Activations Underlying Processing of Aesthetically Manipulated Self-Face. Applied Sciences, 12(24), 13007. https://doi.org/10.3390/app122413007