1. Introduction
Micronutrient deficiencies (MND) in diet are recognized as one of the most important nutritional problems in public health in various populations around the world. MNDs are also concerning because they may be a risk factor for different diseases and may influence the high rates of morbidity and even mortality [
1].
Iron is one of those essential nutrients of which a deficiency causes anemia and immune system disorders [
2]. An insufficient level of this element most often is detected among infants, small children under 5 years of age, women of childbearing age, pregnant and lactating women, as well as the elderly over 60 years of age. The main reason for the abnormal concentration of iron and hemoglobin in the blood serum of a given population is the lack of iron-rich foods in the diet or its improper absorption in the gastrointestinal tract [
3,
4,
5].
One of the strategies aimed at reducing the problem of malnutrition resulting from iron deficiencies is based on the supplementation or food enrichment with this microelement [
3]. Among the existing approaches, food fortification with iron remains one of the cheapest and most effective methods in targeting large-scale population without the introduction of pharmaceutical drugs. The key challenge is, however, the bioavailability of iron in fortified foods.
The selection of most ideal food used as iron carrier include focusing on the target population without making any significant changes in their dietary patterns, it should be regularly consumed, and enable an increase in iron levels in the organism [
5]. Common foods that may be fortified with iron include salt, sugar, cereal based products, milk, and dairy products [
6]. Good examples are fermented dairy products which, by themselves, as well as when enriched with different additives, may reduce the risk of many diseases or even prevent them [
7,
8].
Yoghurt is a valuable source of calcium and protein, although it is deficient in iron. People whose diets are based on dairy products for a long time are at risk of developing so-called “milk anaemia”. The groups most often exposed to this disorder are children at the ages of 1 to 3 years, because the stock of hematopoietic components stored in the liver decreases after infancy [
9,
10]. Yoghurt as a popular dairy product can be an appropriate carrier for iron supplementation due to the properties of the main milk protein, casein, a phosphoprotein with metal ions binding ability.
Casein and its hydrolysates show various biological activities, including the natural ability to chelate metals, positively influencing the immune system [
11,
12]. These properties are determined by strong polar anionic sequences consisting of three phosphoserine residues and two glutamic acid residues. Caseinophosphopeptides (CPPs), formed during the hydrolysis of αs1, αs2, and β casein, help to achieve and maintain mineral homeostasis [
13]. They are resistant to proteolytic enzymes present in the human gastrointestinal tract, keep the chelated minerals dissolved, and prevent their precipitation. Therefore, these elements are better absorbed.
Based on the already known health beneficial properties of yoghurts, as a source of bioactive compounds, it is possible to combine additional enrichment with health-promoting bioactive ingredients and to create additional functionality [
8]. One of the methods of yoghurt enrichment with iron is the addition of natural bioactive substances that do not change the quality characteristics of the final product but constitute an additional source of iron in the daily diet. Application of iron in the form of casein–iron chelate used for the elevation of dry matter, can be an effective way to increase iron intake in the population’s diet. The absorption of iron in the form of a peptide chelate is much higher in comparison to its inorganic salts. Chelates are more resistant to absorption inhibitors. Other aspects that should be taken into account are the smell and taste of a product as some iron compounds may cause a metallic aftertaste in food, deemed unacceptable by consumers. Among various type of iron supplements and food fortification techniques, it is proposed that metal complexes, especially iron–peptide complexes, combat deficiencies with the advantages of high absorbability, good bioavailability, excellent stability and high safety [
14,
15]. Many authors pointed out that among minerals used in food fortification, protein preparations with chelated iron ions have the highest potential [
16]. Hydrolyzed proteins and their peptides often exhibit the ability of bind divalent metals due to the presence of amino acid residues with ionic and electron rich side chains, and due to their conformation, therefore improving the stability, solubility, and bioavailability of such complexes. This property enables their application in the prevention or termination of free-radical-mediated oxidative reactions facilitated by the pro-oxidant activity of divalent metal ions, such as Fe
2+ or Cu
2+ [
17,
18,
19]. The metal-chelating capacity is also relevant into human nutrition because it can facilitate the absorption of chelated divalent ions, such as calcium and iron, in the digestive tract [
18].
Milk proteins, especially casein, are a good vehicle for the delivery of various bioactive compounds, including minerals. It was shown that CPPs enhance calcium, iron, and zinc absorption [
20]. CPPs contain phosphate residues responsible for their good chelating capacity, which also depends on whether they are released from αs1, αs2, or β casein subunits. Such micronutrient-bound protein complexes with increased bioavailability can safely replace inorganic additives in different types of functional food [
21]. Thus, fortification of yoghurt with iron seems to have high potential in the prevention and treatment of iron deficiency in various groups of the population.
The aim of the study was to apply casein-based bioactive additives—hydrolysate and casein–iron chelate—in the production of iron-fortified fermented beverages, and analyze their influence on the physicochemical characteristics of the enriched yoghurts.
2. Material and Methods
2.1. The Preparation of Serine Protease from Yeast Yarrowia lipolytica
Preparation of serine protease was obtained from growth media of Yarrowia lipolytica yeast. The strain was isolated by us from a Polish blue-veined cheese “Rokpol” and deposited in the Fungal Biodiversity Center, Institute of the Royal Netherlands Academy, Acc. no. CBS,140024. The growth medium contained (g/L) yeast extract (1.7), casein (4.0), post-refining fatty acids (10.0), KH2PO4 (0.5), MgSO4·7H2O (0.25), and NH4Cl (1.0). The yeasts were cultured in a 9 L stirred-tank reactor (AK210) at a working volume of 2.0 L at 28 °C, at pH 7.5 (automatic correction with NaOH). The aeration rate was fixed at 1.00 vvm. The stirrer speed was adjusted to 500 rpm. The biomass was then centrifuged at 5000× g for 15 min at 4 °C and the obtained supernatant was subjected to microfiltration, ultrafiltration with diafiltration, followed by dialysis using a polysulfone (PS) membrane with a cut-off of 18 kDa (EuroSep Ltd., Warsaw, Poland) with flow rate 8 mL/min. The obtained concentrate was spray dried with the addition of 3% methylcellulose as a carrier. Conditions of spray drying: inlet temp: 140 °C, chamber temp: 88 °C; flow rate: 2.8 L/h; air output: 1.1 Ba.
2.2. Determination of Enzyme Activity
The buffer pH and concentration were used according to the method of Chrzanowska and Kołaczkowska [
22]. Proteolytic activity of serine proteinase was determined with the use of 2% casein solutions in 0.1 M Tris-HCl at pH 8.0. The substrate was incubated with the enzyme for 10 min at 37 °C. After this time, the reaction was stopped by the addition of 5% trichloroacetic acid (TCA). The sample was then centrifuged for removal of undigested protein for 10 min 5500×
g and the obtained supernatant absorbance was measured at λ = 280 nm. One unit of enzyme activity was defined as the amount of enzyme giving an increase in absorbance of 0.1 under the described conditions.
2.3. Determination of Protein Content
Protein content was determined by the colorimetric method of Lowry et al. [
23], using BSA (Sigma Aldrich, St Louis, MO, USA, P0834) as a standard.
2.4. Determination of Free Amino Groups
Determination of free amino groups (FAG) was performed according to the method of Snyder and Sobociński [
24] and Kuchroo and Ramilly [
25] with modifications: 2 mL of the hydrolysate diluted in 0.1 M borax was mixed with 50 μL of a 0.03 M aqueous TNBS solution (Sigma) and left at room temperature in the dark for 120 min. After the time, 2 mL of 0.1 M NaH
2PO
4 containing 1.5 mM Na
2SO
3 per liter of solution was added and the absorbance was measured at λ = 420 nm against blank with no protein added. The amount of FAG was determined from the standard curve prepared for glycine. The degree of hydrolysis (DH) was calculated using the determination of the FAG’s content, according to the following formula:
N1—content of free amino groups in the hydrolysate [μmol Gly/g].
N2—content of free amino groups in isoelectric casein subjected to acid hydrolysis made with 6M HCl [μmol Gly/g].
2.5. Production of Casein Hydrolysate
The 10% isoelectric casein was suspended in water and conditioned for 10 min at 60 °C, then cooled to 35 °C and the pH of the resulting solution was set to 8.0 with 5 M NaOH. Enzymatic hydrolysis was conducted using serine protease isolated from
Yarrowia lipolytica yeast in a dose of 500 U per gram of casein. The reaction was carried out for 3 h at 37 °C with stirring (120 rpm) and terminated by thermal inactivation: 10 min at 100 °C. The progress of the hydrolysis was monitored by determining the content of FAG’s concentration [
25] and by the DH [
26]. The obtained hydrolysate was spray dried (drying temp 160 ± 5 °C, chamber temp. 85–87 °C, inlet temp. 72–75 °C, pressure 1.5 at., feed 4400 mL/h), part of hydrolysate was subjected to the iron chelation process.
Supplementary Materials Figure S1.
2.6. Production of Casein–Iron Chelate
The obtained casein hydrolysate was subjected to the chelation process with 0.001 M FeCl
2 solution, which was added to the hydrolysate solution. The chelation process was carried out at 4 °C for 12 h and the obtained preparation was spray dried (drying temp 160 ± 5 °C, chamber temp. 85–87 °C, inlet temp. 72–75 °C, pressure 1.5 at., feed 4400 mL/h). In the obtained chelate the iron ions’ chelating capacity was determined.
Supplementary Materials Figure S1.
2.7. Determination of Iron Fe(II) Ion Chelation
Chelation of iron ions was determined according to the method described by Xu et al. [
27] by colorimetric measurement of Fe(II) not bound by hydrolysate in a reaction mixture using ferrozine (3-(2-pyridyl)-5,6-diphenyl-1,2,4-triazine-p,p′-disulfonic acid monosodium salt hydrate). Absorbance measurement was carried out at 562 nm. The ability to chelate iron was determined on the basis of a standard curve for the FeCl
2 solution.
2.8. Yoghurt Production
Milk used for production was commercially available UHT defatted milk, which was processed in the dairy plant (homogenization and high pasteurization). The following additives were used for dry matter elevation by 2%: (1) skim milk powder (control sample); (2) casein hydrolysate; (3) casein–iron chelate. Heating at 85 °C for 5 min was applied for solubilization of additives, then the milk was cooled to 43 °C and inoculated with starter culture. The DVS yoghurt culture YC-180 CHR HANSEN was used to start the in oculum, which was applied in the amount of 2% to the working volume of milk. Incubation was carried out at 43 °C until reaching the pH of 4.6. Yoghurts were stored in under refrigeration at 4–6 °C for further analysis.
In the obtained yoghurts, the dry matter (DM), protein, fat, lactose, as well as iron content were determined. Additionally, the titratable acidity and pH, organoleptic evaluation, rheological tests, and microbiological determinations were performed after the yoghurt production, at 1 and 2 weeks of storage.
2.9. Microbiological Analysis
The microbiological analysis of the yoghurts was carried out on the first day of production and also after a week and two weeks of storage, under refrigerated conditions.
Starter bacteria count was carried out by using selected media.
Streptococcus thermophilus number was analyzed on M-17 (spread plating) and
Lactobacillus delbrueckii subsp.
bulgaricus on MRS agar (pH 5.4, pour plating), according to ISO 7889/IDF 117 as described by Szołtysik et al. [
28]. MRS and M-17 agar were obtained from Merck. The PCA medium was used for total microbial count determination.
2.10. Physicochemical Analysis of Yoghurt
The pH of samples was measured using a WTW InoLab pH-meter. Electrode was calibrated with 2 buffers: pH 7.0 (Lot 1F283D) and pH 4.01 (Lot 1F283c, Mettler Toledo). Titratable acidity was determined according to the Soxhlet–Henkel method and expressed in SH degrees [°SH] defined as the amount of 0.25 M NaOH used for the titration of 100 mL of yoghurt in the presence of phenolphthalein as indicator.
2.11. Protein Content
Protein content was determined by Kjeldahl method, on Kjeltec 9TM Analizer [FOSS], according to norm GB 5009.T for protein level determination in food.
2.12. Fat Content
Fat content was determined by Soxhlet method, on Büchi B811 (Polish Norm PN-EN ISO 1736:2010).
Dry matter was analyzed in laboratory oven at 105 °C.
2.13. Rheological Properties
Yoghurt samples were equilibrated at room temperature for 30 min prior to rheology analysis. Their assessment was carried out using a Haake Rheo Stress 6000 rotational rheometer with a Haake A10 thermostatic bath and UTM Controller (Thermo Electron GmbH, Germany).
The measurement was performed at a constant temperature (20 °C) using a cone/plate (cone C60/1° Ti L no. 222-1868/stainless steel plate TMP60 no. 222-1891) geometry system with a gap of 1 mm for all samples. An amount of 1 ml yoghurt sample was applied at each measurement to the surface of the plate. The viscosity [Pa s] was determined three times for each sample with ramp shear rate in the range of 0 to 1000 s−1 over 3 min. Apparent viscosity was analyzed at a shear rate of 100 s−1.
2.14. Sensory Parameters Assessment
The sensory analysis was performed by a group of 10 trained individuals maintaining gender balance. The training was performed on commercial plain yoghurt samples. During the training, for each of the analysis descriptors (color, aroma, consistency, and taste), the group created a list of adjectives describing the analyzed parameters. The most frequent adjectives (pointed out by at least 5 individuals) were applied in the analysis. The selected characteristics: for color: white, creamy, or odd—i.e., green/grey/other; for consistency: leaky, loose, dense, very dense, compact; for aroma: refreshing, clean, typical, acidic, or odd—i.e., metallic/yeasty/other; for taste: pleasant, refreshing, with aftertaste, acidic. In the analysis, characteristics selected by more than 5 evaluators were used as main feature of the parameter.
Supplementary Materials Table S1.
2.15. Statistical Analysis
The analysis was performed with the use of the “STATISTICA 13 PL” program by StatSoft Inc., Tulusa, OK, USA. All determinations were performed in triplicates and presented as average value (X) with standard deviation (SD). Assessment of the differences significance between average values in analyzed groups was conducted by variance analysis (ANOVA), followed by a Duncan multiple range test. The level of statistical significance was set at p < 0.05.
All determinations were prepared in triplicates.
3. Results and Discussion
In this study, non-commercial extracellular serine protease produced by
Yarrowia lipolytica yeast was applied for casein degradation and production of casein chelate with iron chelating activity. The additives were applied to yoghurts production, and their usefulness as bioactive compounds with pro-health effects in yoghurt fortification was evaluated. In our previous research, the enzyme was also successfully applied for the degradation of proteins and the production of bioactive peptides of different activities [
29,
30,
31,
32,
33].
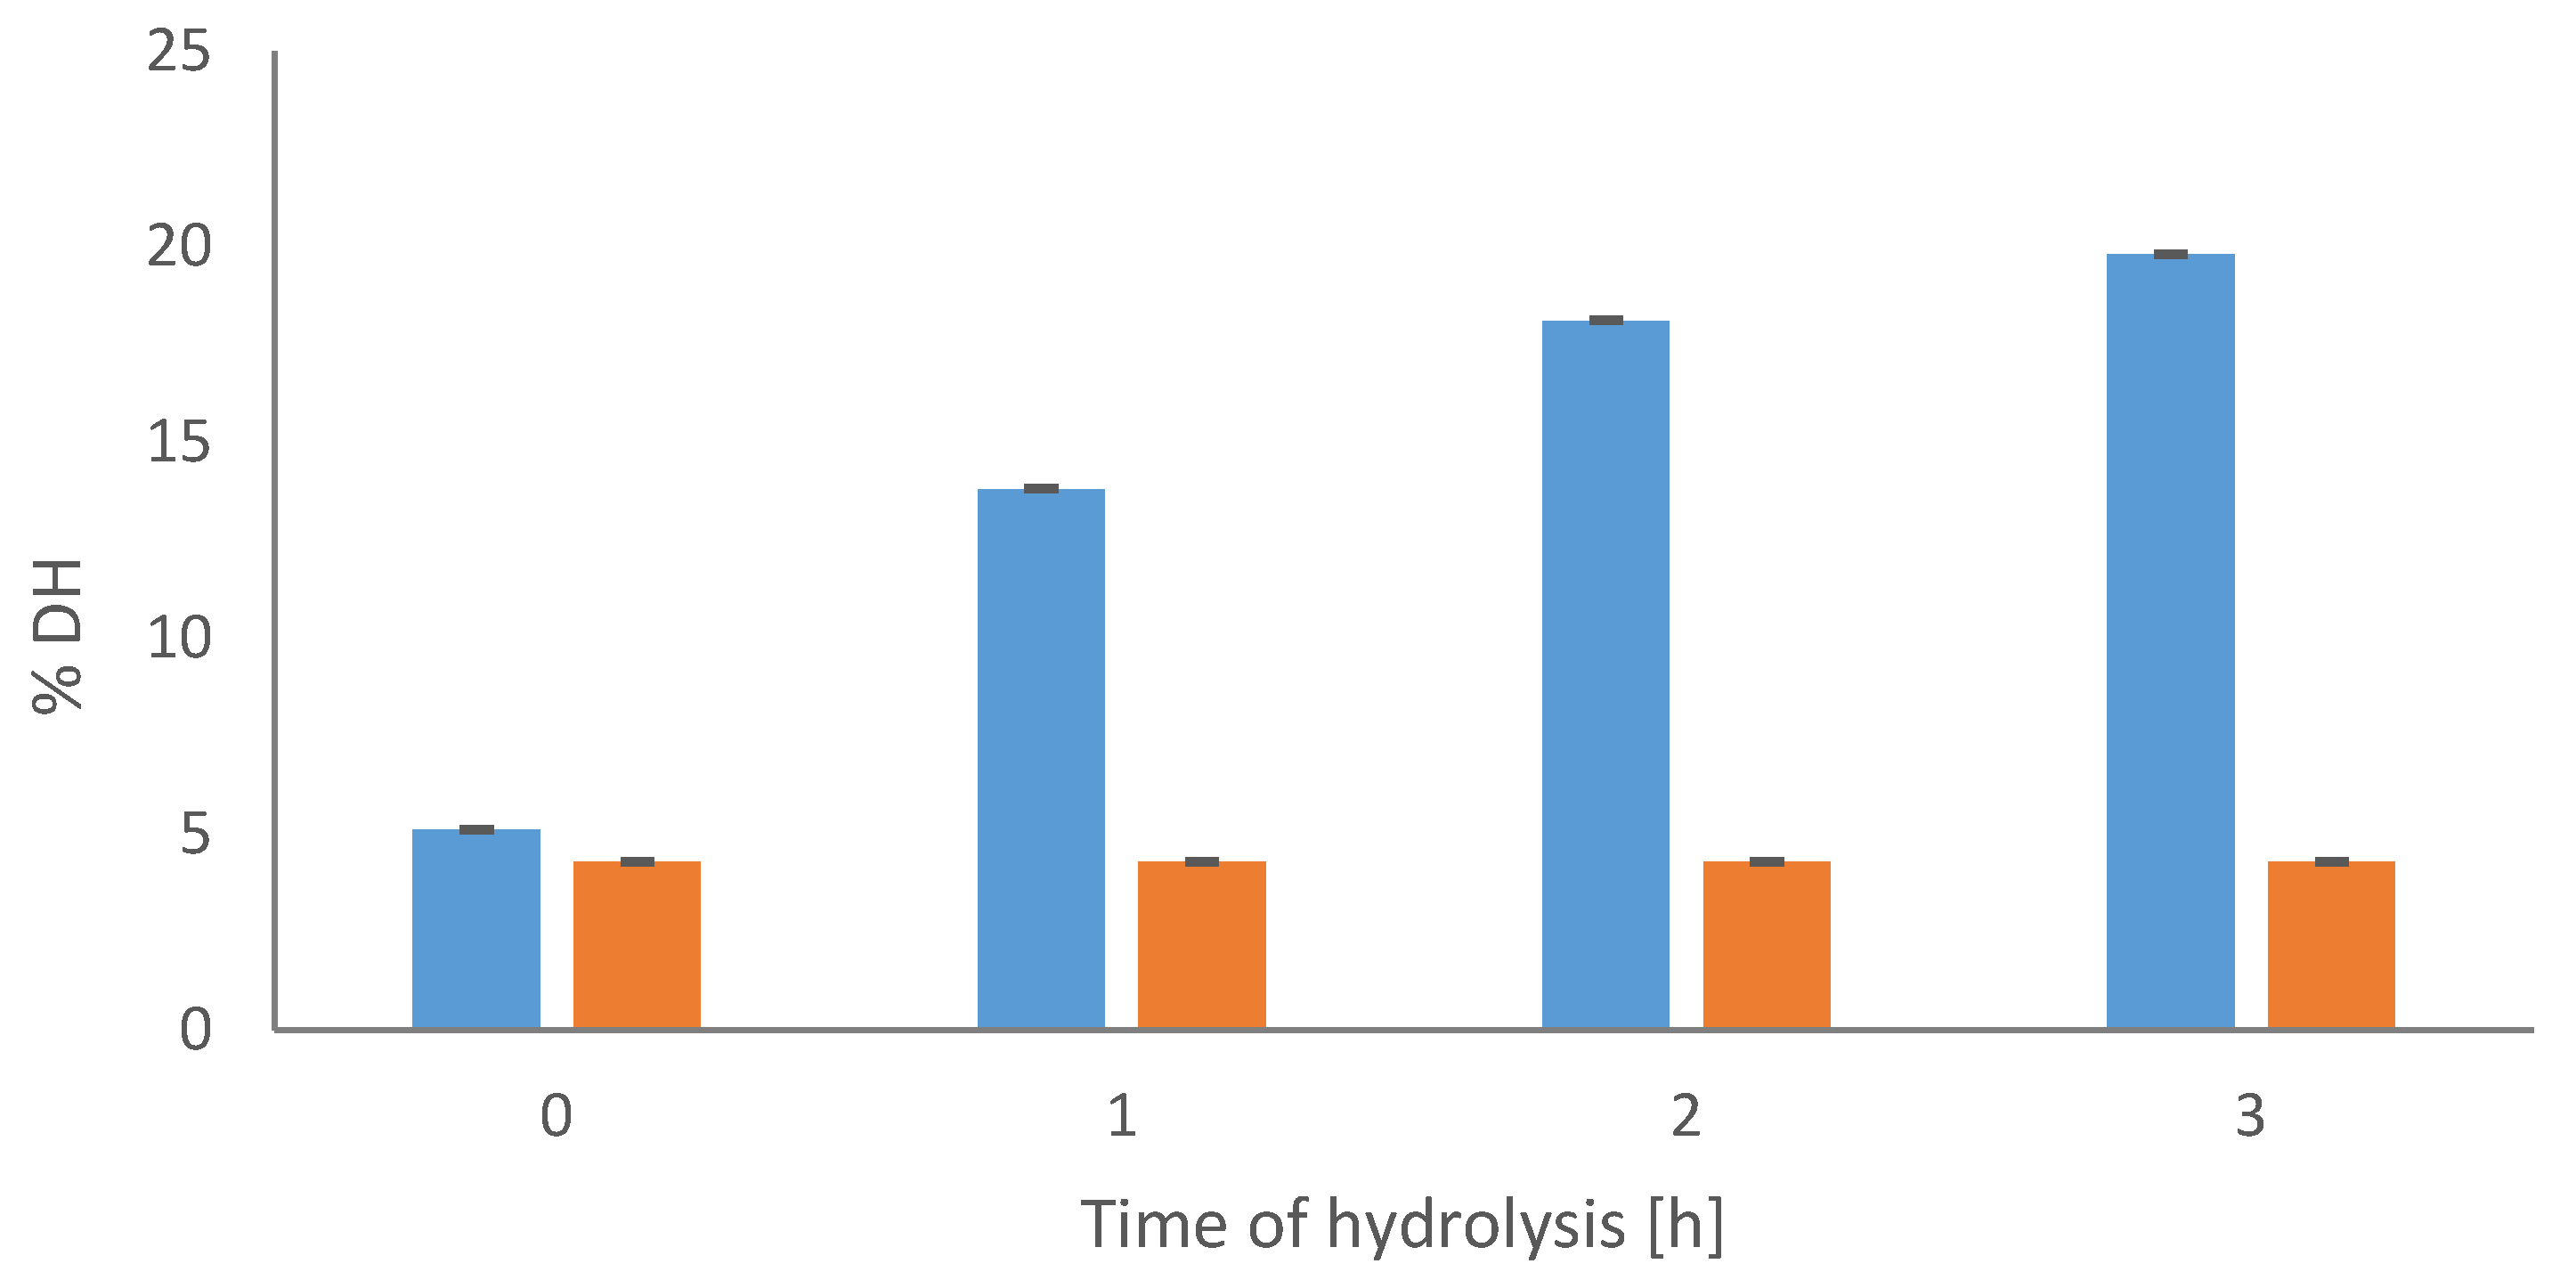
The progress of casein degradation was analyzed by the degree of hydrolysis [DH], which gradually increased with the time of the process (
Figure 1). The highest DH was determined in the hydrolysate after 3 h of the reaction and its level was 19.8%, while in the control sample it remained unchanged at the level of 4.3%. The high susceptibility of casein to serine protease from
Yarrowia lipolytica yeast was also confirmed by Szołtysik et al. [
29], who showed the gradual degradation of the same substrate, starting at the beginning of the process, and correlated with the determined DH increase. Additionally, other authors [
30,
34], who investigated the proteolytic activity of extracellular protease from
Yarrowia lipolytica against other substrates, showed that, among the analyzed proteins, casein, particularly its β fraction, was the most susceptible to degradation with the protease produced by utilized 30
Y. lipolytica strains.
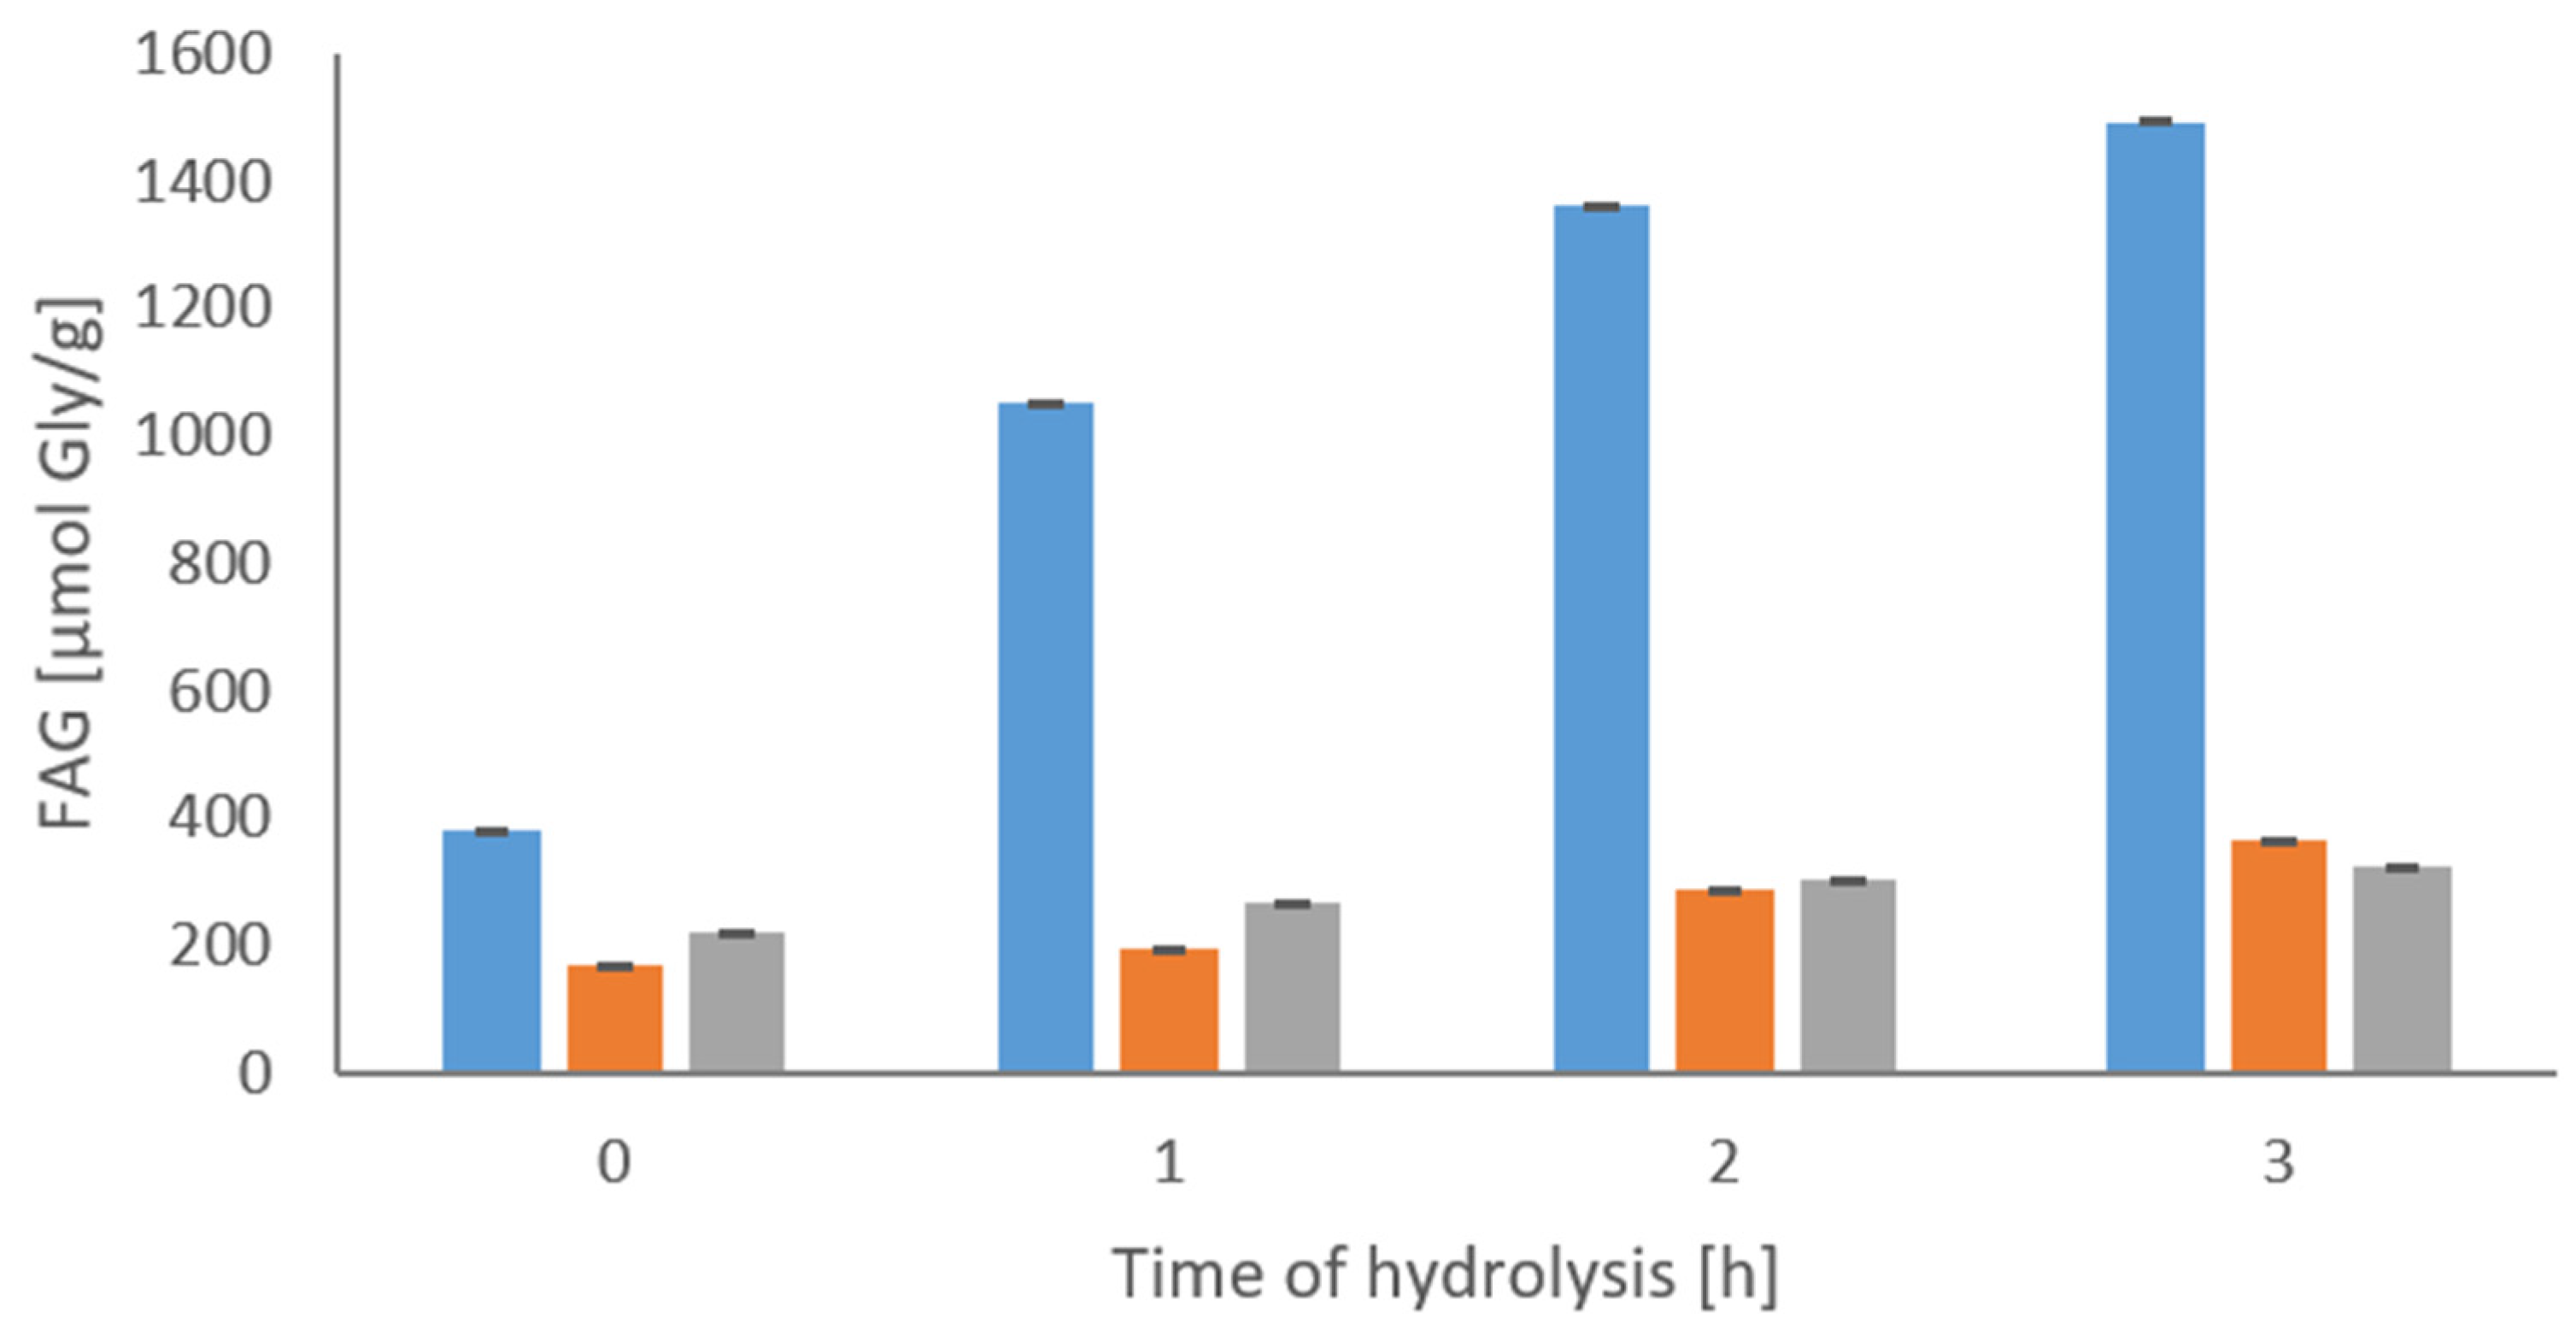
The progress of hydrolysis was also monitored by determining the content of FAG soluble in water and in phosphotungstic acid (PTA) (
Figure 2). It was found that the amount of water-soluble FAG increased during the hydrolysis. The content of low-molecular nitrogen fractions-soluble in PTA pointed to an intensive degradation of the analyzed protein. After 3 h of the process, FAG were determined at the level of 1493.0 µmol Gly/g for water-soluble compounds and 363.0 µmol Gly/g for PTA-soluble compounds, respectively.
Many authors have shown that the enzymatic degradation of casein is an effective way of producing bioactive peptides [
35]. Application of noncommercial protease isolated from
Yarrowia lipolytica may result in the formation of new or enhanced activities, including those with metal ions binding and transporting activity. Therefore, the obtained casein hydrolysates were also characterized by the iron chelating capacity (Fe
2+).
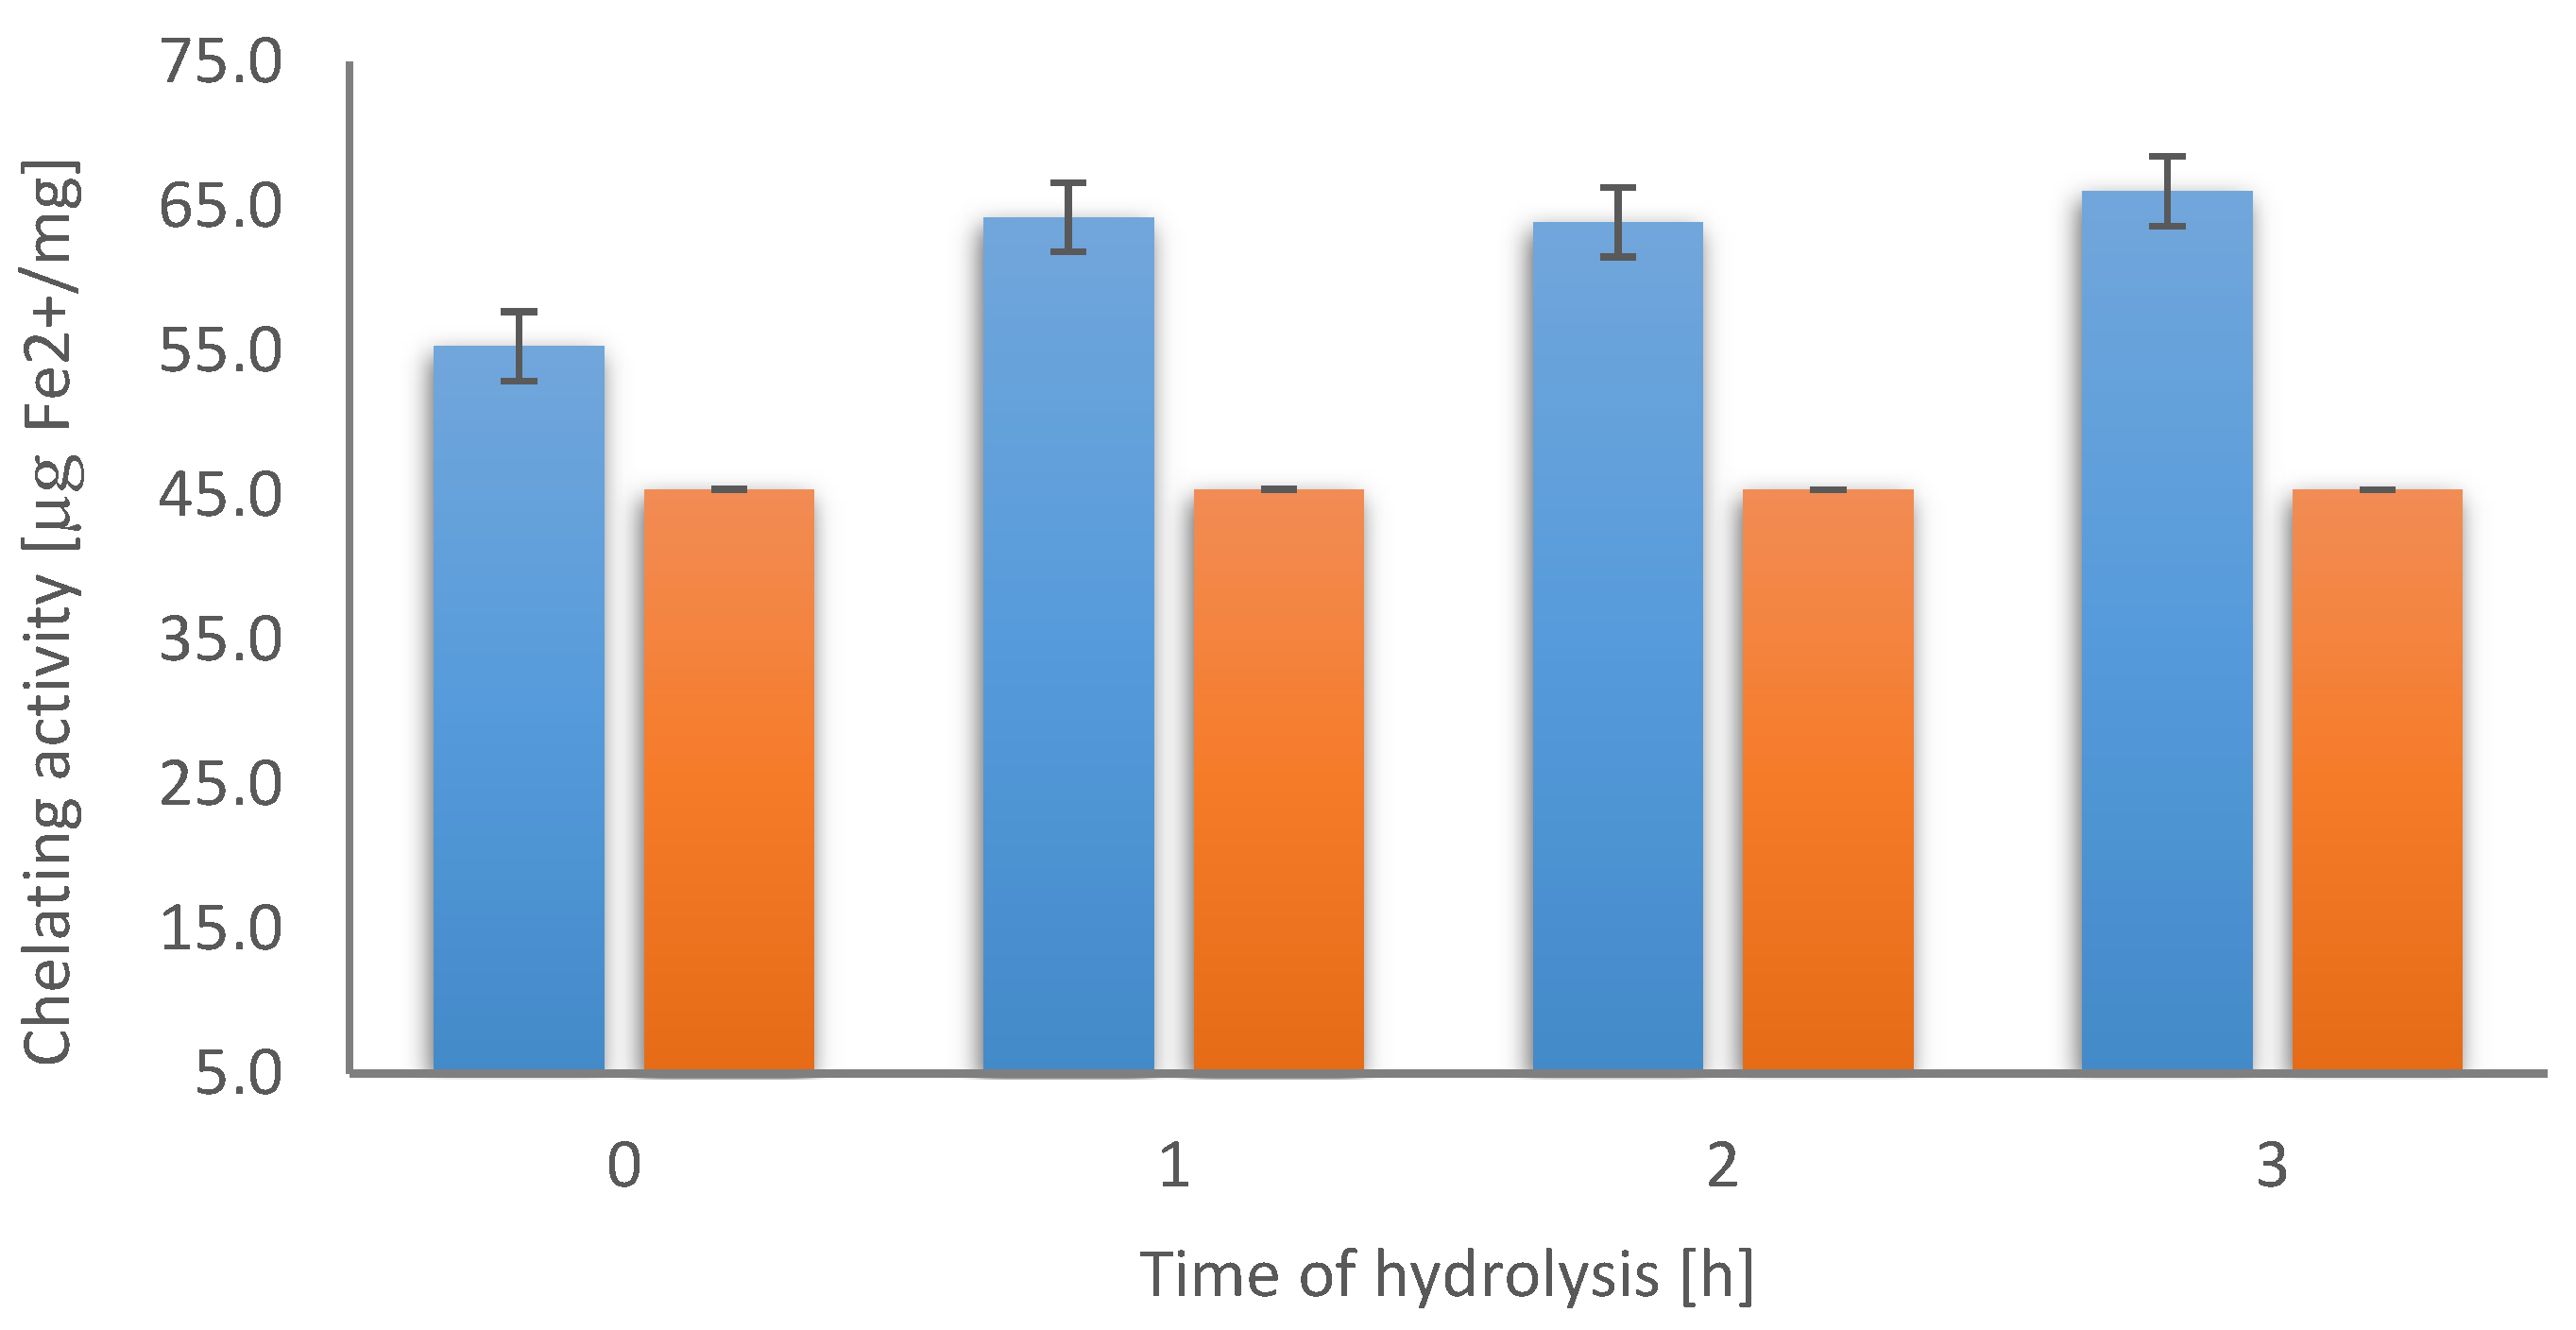
The chelating activity was correlated with the DH and it increased over time, although the highest changes were observed at the beginning of the process (
Figure 3). Increased chelating activity in comparison to casein was detected in the hydrolysates after 1 h of the hydrolysis process (64.4 µg Fe
2+/mg protein), while the highest chelating activity was determined after 3 h of enzymatic degradation (66.1 µg Fe
2+/mg protein,
Figure 3). The hydrolysate obtained after 3 h of hydrolysis and characterized by the highest Fe
2+ chelating activity was further subjected to FeCl
2 chelation. After spray drying both preparations, the 3 h hydrolysate and its chelate, were used as the bioactive additives in yoghurt production for dry matter (DM) elevation.
The characteristics of analyzed additives showed that the levels of main components differed significantly (
Table 1). Each of the added substances was subjected to spray drying to reduce water content, to prevent the development of undesired microbiota, and to slow down the enzymatic processes. The lowest water content was noted for casein–iron chelate, and the determined value differed significantly from values determined for casein and casein hydrolysate (6.03% vs. 10.17%;
p < 0.05). In all analyzed preparations, the DM content was above 90%. A significantly higher DM content was found in casein–iron chelate compared to other variants (90.0% vs. 94.07%; 90.17% vs. 94.1%,
p < 0.05). Casein hydrolysate was characterized by lower acidity compared to the acidity determined for c casein and casein–iron chelate (4.63 °SH vs. 19.55 °SH; 4.63 °SH vs. 14.17 °SH;
p < 0.05). In the preparation, lower protein content was also noted as compared to casein and its iron chelate (78.53% vs. 86.97%; 78.53% vs. 84.17%;
p < 0.05). Differences were also found in fat content, the highest levels were found in casein hydrolysate and casein–iron chelate, compared to casein (0.46% vs. 1.25%; 0.46% vs. 1.23%;
p < 0.05). The iron chelation process resulted in an over 200-fold increase in iron content in the chelate, compared to casein and casein hydrolysate (2.37 mg/kg vs. 683.54 mg/kg; 3.34 mg/kg vs. 683.54 mg/kg;
p < 0.05).
After the fortified yoghurt production their basic chemical composition was analyzed (
Table 2). The DM was determined at a similar level, ranging from 10.13% to 10.92%. Protein content was significantly higher in yoghurts produced with addition of casein hydrolysate and casein–iron chelate as compared to the control variant where skim milk powder was applied (4.61% vs. 6.68%; 4.61% vs. 5.65%;
p < 0.05). It is noteworthy that the qualitative and quantitative standards for fermented milk and yoghurt require that the protein concentration should keep in a range between 2.7% and 10%. The observed differences in the protein content between the variants might be the result of the use of different components for DM elevation, in which their proportion is variable. The fat content did not differ between the variants and was close to the composition of commercially available, natural, defatted yoghurt. In the analyzed variants of the fortified yoghurts the lactose content was also determined. The significantly lowest content of lactose was observed in yoghurt with the addition of casein–iron chelate compared to other variants (4.11% vs. 4.52%; 4.11% vs. 4.48%;
p< 0.05).
The chemical composition of yoghurt fortified with iron in different chemical forms was also analyzed by Ziena et al. [
36]. The researchers found the significant differences between the samples for ash and protein content, depending on the storage time. It was also noted that addition of iron to yoghurt did not affect the fat content, which was also confirmed in our own research.
In the study, the iron content was the parameter characterized by significant variation (
p < 0.05) between the analyzed samples. In yoghurt, with the introduced casein–iron chelate, the level of that element was 61.5–123 times higher than in samples with the addition of skim milk powder and casein hydrolysate. In samples not enriched with iron, its level was 0.13–0.23 mg/100 g of the product. The addition of casein–iron chelate at the level of 2% resulted in the content iron at a level of 12.3 mg per 100 g of yoghurt covering approximately the daily requirement of an adult, which is 10 mg/day for a male and 18 mg/day for an adult female. These values are elevated for pregnant women for whom the iron requirement increases to 26 mg/day, due to the coverage of the needs of the fetal tissues, placenta, and increasing hemoglobin level, especially in the second and third trimesters [
37].
Iron complexes with proteins exhibit better solubility at alkaline pH and thus better digestibility. In the study conducted by Shilpashree et al. [
21], authors found that iron and zinc in the form of caseinates in comparison to their inorganic salts exhibited better mineral absorption and stimulated ferritin synthesis. The reduced bioavailability of minerals in the form of salts may result from their insolubility at intestinal pH 7.0–8.0 [
38]. As it was reported by Cremonesi and Caramazza [
39] iron–casein complexes retain bound iron even during their precipitation at acidic pH 2.0–4.0 in the stomach, therefore, in various food products, they can safely replace inorganic fortifying additives. In that context, the analyzed preparation may show its usefulness.
Yoghurt, as a source of health beneficial probiotic bacteria, is an excellent product for iron fortification also due to its acid pH under which the protein–Fe complexes remain stable. Modulation of the composition of micronutrients in yoghurt may promote an increased absorption in the human gastrointestinal tract, which could increase their health beneficial effect.
In the study, the growth and viability of typical yoghurt microflora were analyzed. The analysis conducted directly after yoghurt production did not show any differences in LAB enumeration among the analyzed variants. Regardless of the additive used, the determined level of
Lactobacilli count was similar, and kept in a range of 7.34 to 7.43 [log10 cfu], while for
Streptococci this was 7.58 to 7.63. With the time of storage, the highest influence on the count of LAB was noted for casein–iron chelate (
Table 3). The statistically significant differences were observed after 1 and 2 weeks of yoghurt storage for
Lactobacilli (1 week: 7.08 vs. 7.25 vs. 7.84;
p < 0.05/2 weeks: 7.2, 7.25 vs. 7.52;
p < 0.05) and
Streptococci (1 week: 7.25, 7.25 vs. 7.48;
p < 0.05/2 weeks: 7.23, 7.28 vs. 7.41;
p < 0.05).
The growth of starter cultures also determines the fermentation activity and the time of milk acidification. Titratable acidity and pH measurement are the main factors in determining the degree of development of the casein network responsible for yogurt structure formation.
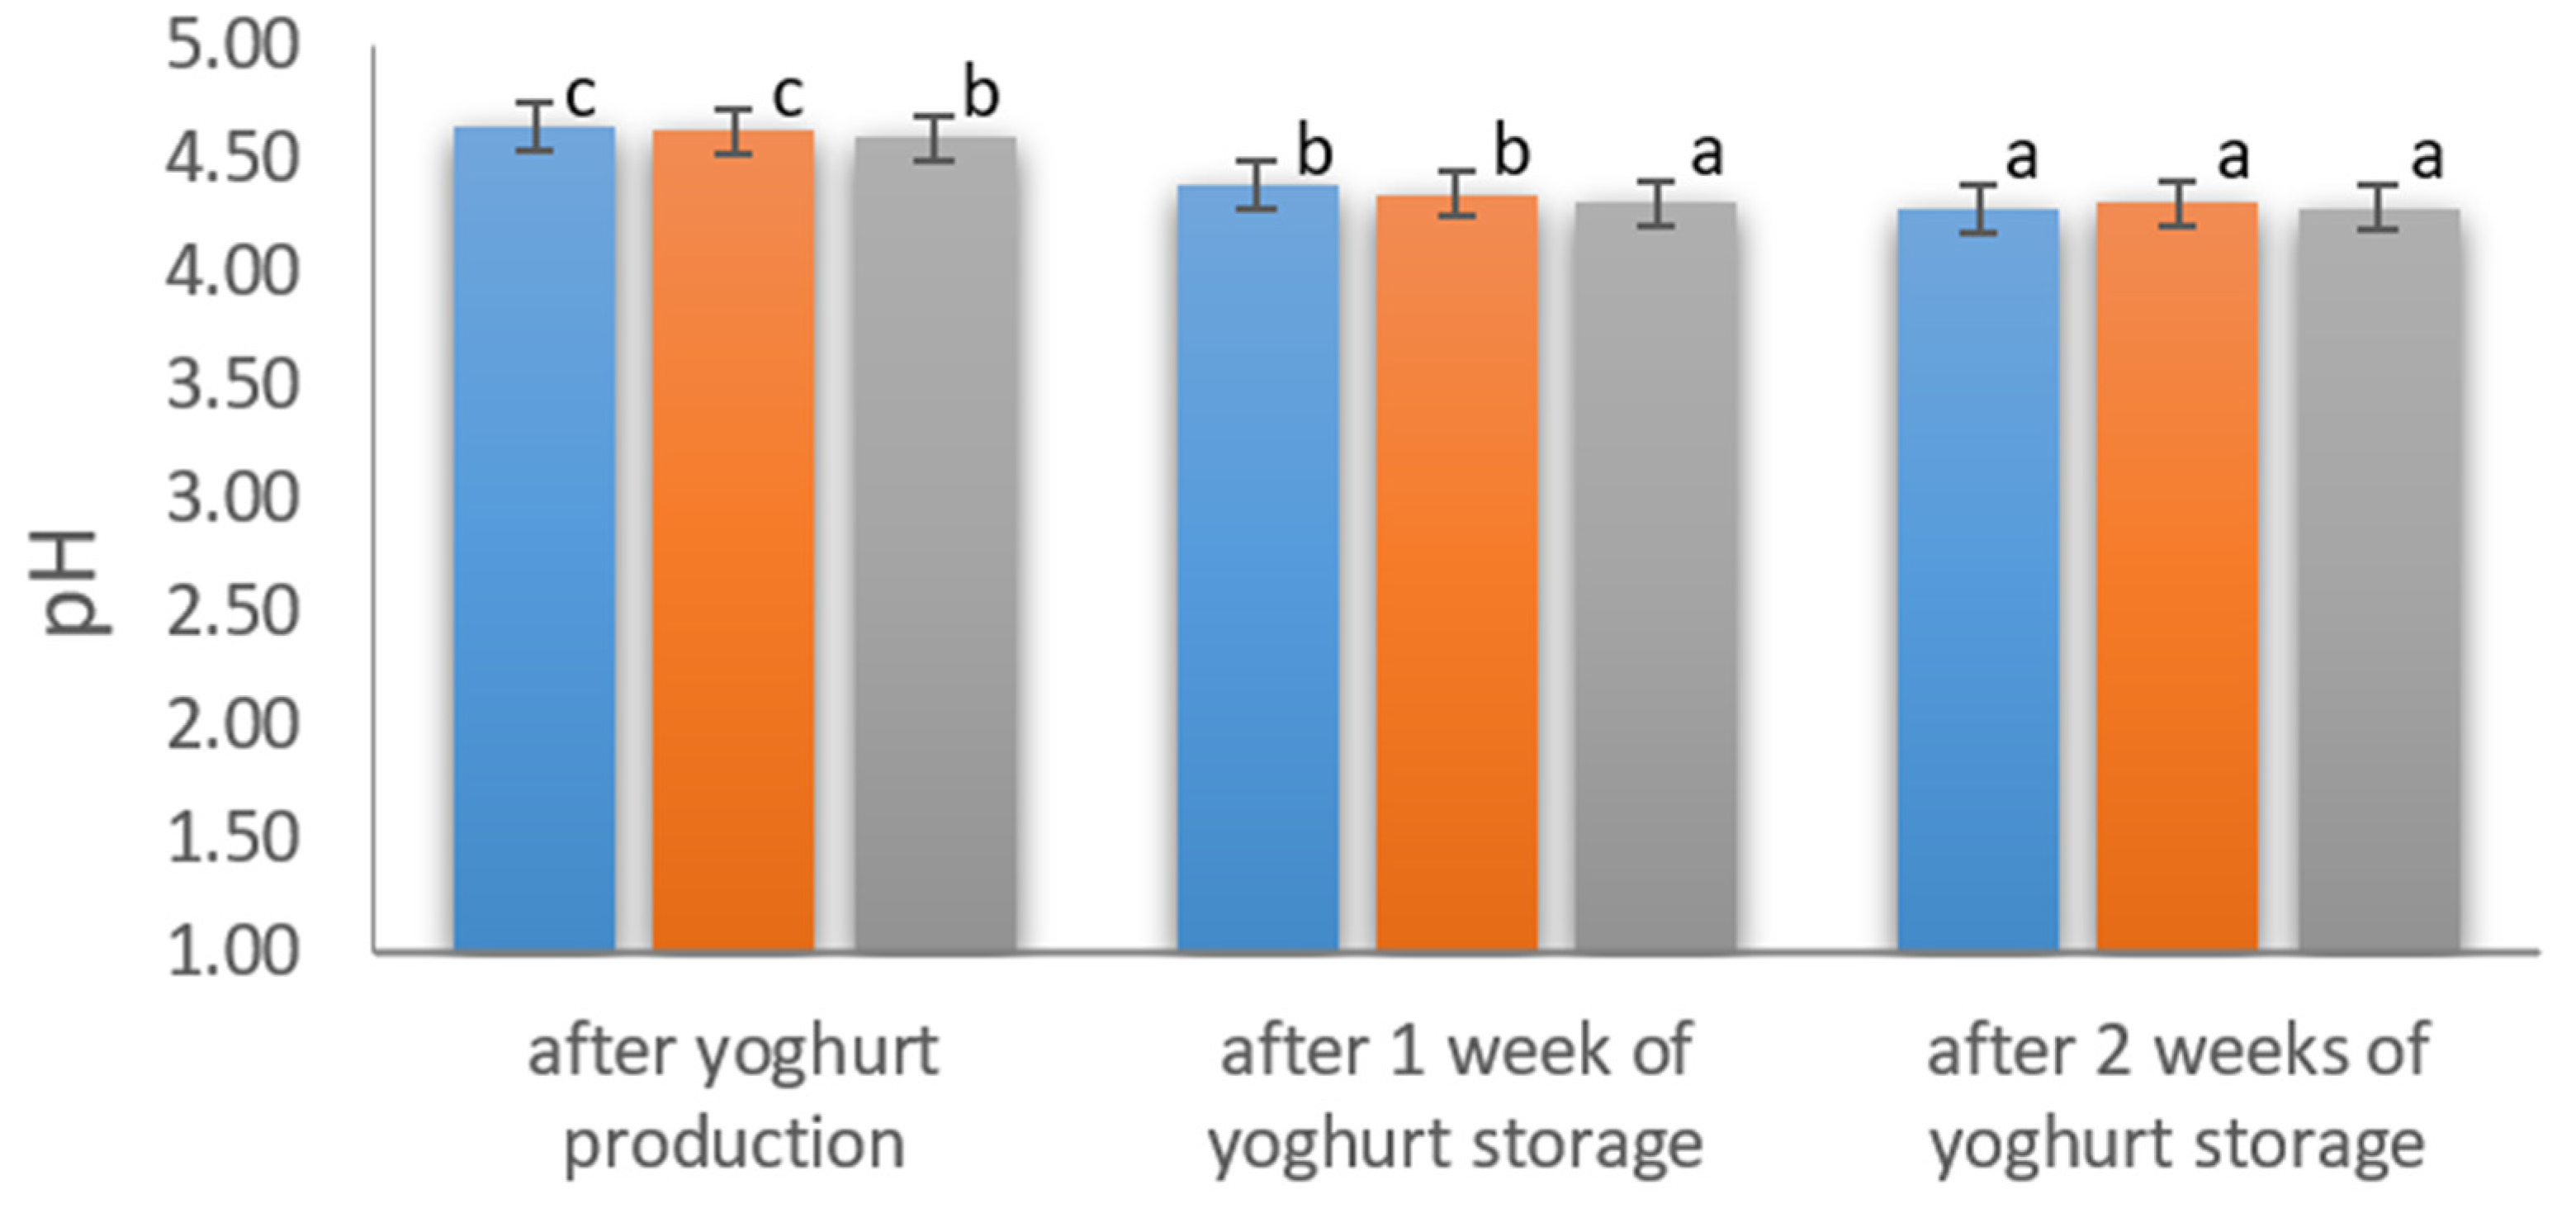
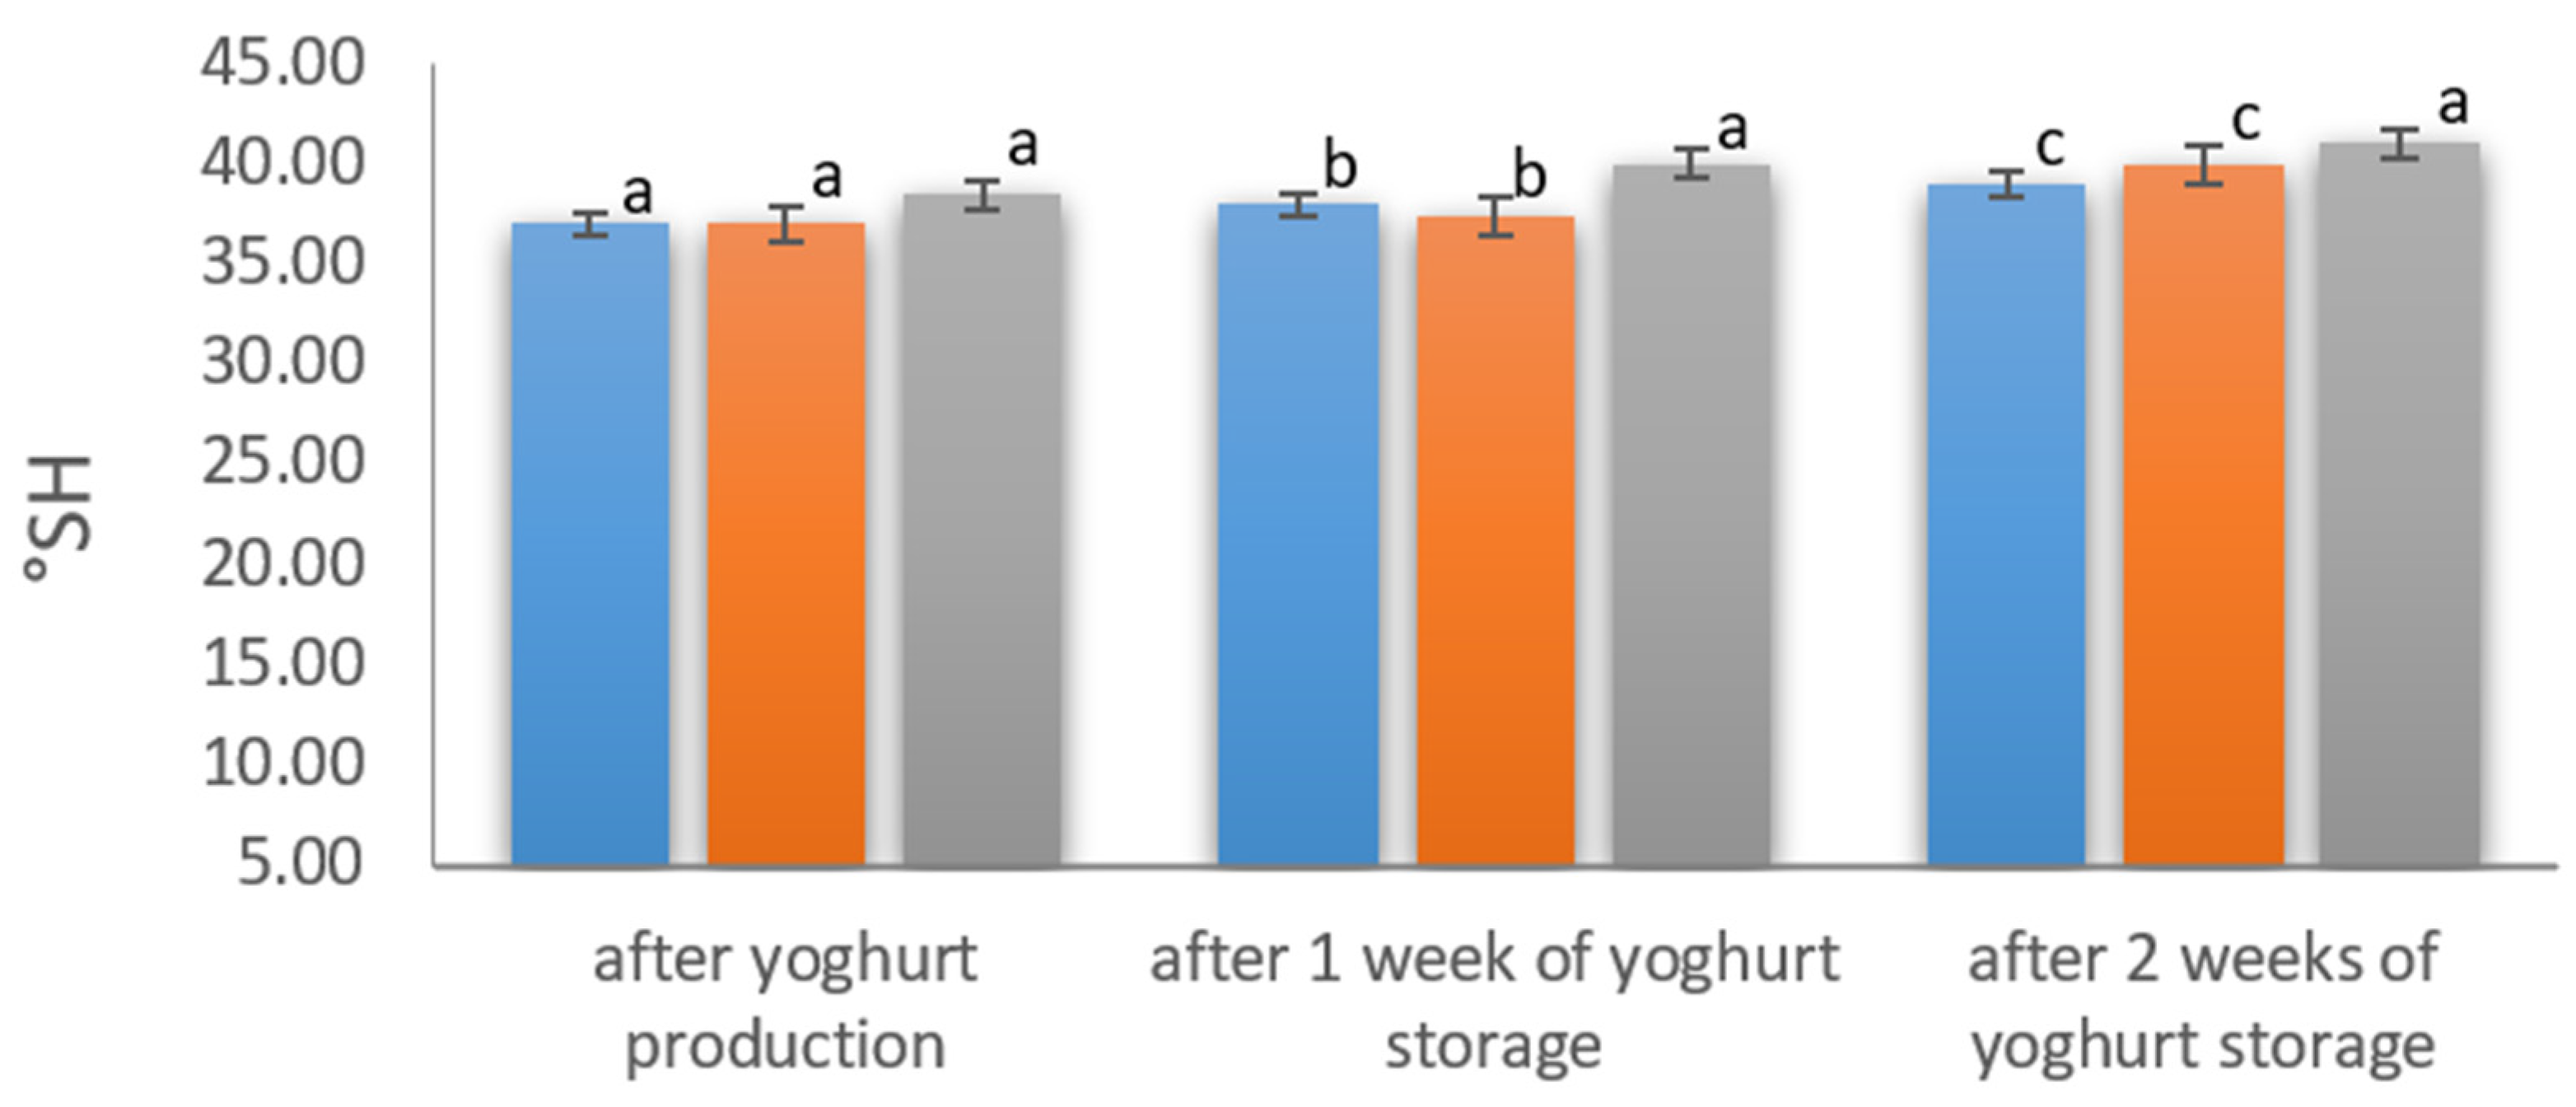
During the production and storage of fortified yoghurt, the acidification process was analyzed by pH (
Figure 4) and by the titratable acidity determination (
Figure 5). During production, all variants reached the pH of 4.6 in the given production time. The titratable acidity of all yoghurts samples during storage increased by 2–3 °SH from 37–38 °SH to 41 °SH. Higher acidity values were determined in the variants with the addition of hydrolysate and chelate, both after production and after 7 days of storage.
Similar results were obtained by Jasim et al. [
40], who enriched yoghurt with iron sulphate and iron chloride and analyzed the usefulness of the additives directly after production and after 21 days of storage at 5 ± 1 °C. In their research, there were no significant differences (
p < 0.05) between the pH values of the control yoghurt and the yoghurt supplemented with iron sulphate. The same authors showed that the addition of the analyzed preparation before and after the heat treatment had no effect on the pH of the yogurt as well as on the starter culture. During storage, the authors observed a gradual decrease in the pH value of all samples.
Yoghurt, with its special structure, is a good example of shear-diluted non-Newtonian fluid, which shows different viscosity with changes in shear rate. The parameter depends upon the size, shape, and chemical nature of molecules and in yoghurt is affected by the strength and number of bonds between casein micelles, their structure and spatial distribution [
41]. It increased with elevated amounts of dissolved solids. Many factors were identified that influence the yoghurt structure and textural properties, such as the source of milk, fat content, starter culture, production process, storage, and applied additives. Their application has a significant impact on the rheological properties, and results from the interaction between additives and yoghurt components, such as protein, fat, carbohydrates, and microorganisms conducting fermentation processes. During fermentation, milk undergoes a series of biochemical changes conducted by starter cultures which transform milk into intermediary products that finally achieve the desired consistency and texture. Rheology analysis plays an important role to understand the gelation process, micro-structure, and flow behavior of the obtained product [
42]. Different authors [
36] analyzed the effect of shear rate on the apparent viscosity of yoghurt and pointed out the inversely proportional correlation between those parameters.
In the analyzed yoghurts, the rheological properties were evaluated by the viscosity analysis (
Table 4). In our study, no statistically significant (
p < 0.05) changes in viscosity were found between the yoghurt variants supplemented with casein hydrolysate and its iron chelate. However, directly after production, their viscosity was about 3 timers lower in comparison to the yoghurt prepared with skim milk powder (0.0659 1/s vs. 0.1889 1/s; 0.0670 1/s vs. 0.1889 1/s;
p < 0.05). In each of the analyzed variants, the apparent viscosity decreased about 3 times during the analyzed storage time, keeping the trend of 3 times lower viscosity in yoghurts with casein hydrolysate and iron chelate in comparison to the control produced with skim milk powder.
Additionally, Izadi et al. [
42] showed that the apparent viscosity of enriched yogurt samples during their 28 days storage at 4 °C was lower in comparison to the control and decreased with time. The authors suggested that the addition of different additives to yoghurt may interrupt the gel structure of the enriched sample. The same results were reported by Supavititpatana et al. [
43] and Lee et al. [
44], who analyzed viscosity changes in fortified yoghurts. Different observations were made by Sahan et al. [
45], who reported that apparent viscosity increased with storage time due to the rearrangement of protein and protein–protein interactions.
In food production, an important element is the assessment of the product sensory parameters. The presence of iron ions may negatively influence the taste causing the metallic taste and greenish color, and therefore negatively impact consumer acceptance. Zeina et al. [
36], who analyzed the effect of the addition of various iron salts on the sensory evaluation of yoghurt during 7 days of their storage at 4 °C ± 1 °C, showed that the product samples evaluated directly after production exhibit a typical color, taste and texture. Authors observed that the storage time had a negative effect on the taste of the final product. Texture and overall acceptability in products assessed directly after production received a higher score compared to those stored for 3 days or 7 days. Different results were obtained by Hekmat and McMahon [
46], who concluded that the assessment by consumer panels did not show a significant difference in the appearance of the iron-fortified yoghurt.
Our results were similar to those presented by Hekmat and McMahon [
46]. The analysis of yoghurt color, consistency, and aroma did not show significant differences between the analyzed samples (
Table 5). Independently of the applied additive, yoghurts exhibit the characteristic yoghurt aroma and taste, with no aftertaste or off-flavors. The only eye-detectable difference was looser consistency in comparison to control produced with the addition of skim milk powder, which correlates with the viscosity analysis.


