Article

Simultaneous Coded Plane-Wave Imaging Using an Advanced Ultrasound Forward Model

1
INSA-Lyon, Université de Lyon, UCBL, UJM-Saint-Etienne, CNRS, Inserm, CREATIS UMR 5220, U1206, 69621 Lyon, France
2
DB-SAS/TPAC, 13 Rue du Bois Briand, 44300 Nantes, France
*
Author to whom correspondence should be addressed.
Appl. Sci. 2022, 12(24), 12809; https://doi.org/10.3390/app122412809
Submission received: 28 October 2022 / Revised: 2 December 2022 / Accepted: 9 December 2022 / Published: 13 December 2022
(This article belongs to the Special Issue Advanced Medical Signal Processing and Visualization)

Abstract

:
In the quest for higher acquisition rates of ultrasound images, the simultaneous emission of encoded waves has the potential to overcome the trade-off between acquisition time and image quality. However, the lack of fully orthogonal codes has led to the use of forward models and inverse problem approaches to estimate the imaged medium. Nonetheless, due to some simplifying assumptions on which these models rely, the previously stated trade-off still appears in these acquisition/reconstruction schemes. In this paper, a forward model for ultrasound wave propagation inside a scattering medium is developed for the simultaneous coded emission of plane waves. The tissue reflectivity function of the imaged medium is estimated by solving an 1 -regularized version of the corresponding inverse problem. The proposed method is evaluated in silico and in vitro. We demonstrate that this method outperforms the conventional technique that consists of successive emissions of plane waves, reconstruction using delay and sum (DAS), and coherent compounding. In silico, the ability to separate close scatterers is improved by a factor of four in the axial direction and by a factor of 2.5 in the lateral direction. In vitro, the spatial resolution at −6 dB is decreased by a factor of seven. These results suggest that the proposed method could be a valuable tool, particularly for ultrasound imaging of sparse mediums such as in ultrasound localization microscopy.

1. Introduction

High frame rate ultrasound imaging has the potential to broaden the already vast application field of medical ultrasonography [1]. Thus, since the introduction of conventional focused ultrasound imaging, researchers have been working on acquisition schemes that allow for increases in frame rates. Studies of multiline acquisition [2,3,4,5] and wide-beam insonification [6,7,8] have converged into three main acquisition schemes that are currently being translated from research to clinical applications: synthetic transmit aperture [9,10,11], plane-wave (PW) [12,13,14], and diverging-wave (DW) methods [15]. By emitting either PWs or DWs and then reconstructing the full images of the medium, these techniques can increase the frame rate of conventional ultrasound by a factor of hundreds, with the only remaining limiting factor being the pulse-echo propagation time. However, the lack of beam focusing in emission considerably impairs the signal-to-noise ratio (SNR) of the recorded data, and results in decreased quality of the reconstructed images. Thus, spatial compounding has been proposed for each of these techniques [9,15,16,17,18,19]. After a succession of insonifications/image reconstructions, a final improved image is obtained by coherently compounding the low-quality images. However, successive emission and reception events result in a drop in the frame rate, which once again yields a trade-off between image quality and frame rate [20].
Parallel with the development of acquisition schemes, the impact of coded excitations on image quality has been studied. It was shown in [21,22,23,24] that excitation signals with higher time bandwidth products increase penetration depth and SNR, which results in images with better overall quality. In these studies, frequency-modulated signals (i.e., chirps) were emitted and backscattered echoes were pulse compressed using a variety of compression filters. Other studies proposed the use of phase-modulated pseudo-random sequences as excitation signals [21,25]. Autocorrelation-based filters were then used to compress the echoes. However, all of these techniques consist of modification of the excitation signals and use of post-processing filters to compress the echoes. The frame acquisition rate remains the same, while the image quality is improved.
Later, the concept of simultaneous emission of ultrasonic waves by several sources was introduced [26,27,28]. The inherent problem of echo separation was solved through the complementarity property of the emission signals (i.e., phase-modulated Golay and Hadamard sequences). As the binary encoded excitation signals carry more energy than classic pulses, the SNR is improved, which again results in better image quality. Simultaneous emission of waves was also addressed by [29], where the total bandwidth of the ultrasound probe was split, with each source emitting in a separate sub-band. However, this technique results in increased SNR without increasing the frame acquisition rate.
One of the first coded schemes to increase the frame rate was proposed by [30]. Based on simultaneous emission of phase-modulated pseudo-random sequences, Ref. [30] built a forward model that associated the received signals with the echoes that would be received if each source was emitting alone. By solving the inverse problem, they reconstructed images of the medium at a higher frame rate than for conventional synthetic transmit aperture. However, due to the lack of orthogonal codes, the method is limited to the use of only two simultaneous transmitters, which limits the gain in frame rate. Later, a similar approach was applied to PWs [31,32]. Once again, the bottleneck was the lack of fully orthogonal codes. The image quality was decreased and the method was limited to two simultaneous PWs. Given that the unknowns in the forward model are the echoes received after each individual source emission, the inverse problem is ill-posed, which leads to decreased image quality without regularization.
Several advanced forward models for ultrasound wave propagation in soft tissues have been proposed [33,34,35,36,37]. In these studies, kernels were built that linked the backscattered echoes to the tissue reflectivity function (TRF) of the imaged medium in the context of PW imaging [33,34,35,36,37] and DW imaging [35,36,37]. Because for one emission/reception the forward models are heavily underdetermined, the data provided by successive emissions/receptions of PWs (or DWs) are used. In this way, the size of the observation space is increased, while the number of unknowns remains constant. These methods make it possible to reduce the number of data needed for reconstruction of high-quality images. However, as previously mentioned, the use of successive emissions decreases the frame acquisition rate.
In this article, we propose to combine the advantages of kernel-based methods and simultaneous emission of coded ultrasound waves to obtain TRF estimations at frame rates as high as those provided by conventional coded approaches. The synopsis of the proposed method is shown in Figure 1.

2. Materials and Methods

2.1. Model Using Two Transducers

Let us define u and v as punctual transducers such that u is the emitter placed in r u = ( x u , z u ) and v the receiver placed in r v = ( x v , z v ) . The pressure variation generated by u inside a medium Ω is tied to its electrical excitation signal a ( t ) through its acousto-electrical impulse response (IR) h u ( t ) [38]. Let us assume that the pressure wave generated by u propagates under free-field conditions until it reaches a scatterer placed at r = ( x , y ) . The pressure wave is partially reflected by the scatterer [39]; consequently, the punctual receiver v receives an electrical radiofrequency (RF) signal y u v ( t ) that depends on its acousto-electrical IR h v ( t ) and on the incident wave pressure [40]. The RF signal, y u v ( t ) , can be written as [41]:
y u v ( t ) = a ( t ) h u ( t ) g u ( r , t ) h v ( t ) g v ( r , t ) γ ( r ) ,
where ∗ is the continuous time convolution product, g u ( r , t ) is the spatial impulse response between the medium point r and the emitter position r u , g v ( r , t ) is the spatial impulse response between the medium point r and the receiver position r v , and γ ( r ) is the TRF value in r. Green’s functions g u ( r , t ) and g v ( r , t ) model the free-field propagation of a pressure wave inside a homogeneous medium [39]. The pulse echo spatial impulse response g u v ( r , t ) between the source u, the medium point r, and the receiver v can be expressed as:
g u v ( r , t ) = g u ( r , t ) g v ( r , t ) = 1 4 π 2 d u ( r ) d v ( r ) δ t d u ( r ) + d v ( r ) c .
where d u ( r ) = r r u 2 is the distance between u and the scatterer, d v ( r ) = r r v 2 is the distance between the scatterer and v, and c is the sound speed in the medium. The term g u v ( t ) is obtained by integrating the contributions of g u v ( r , t ) on the medium Ω such as:
g u v ( t ) = r Ω g u v ( r , t ) γ ( r ) d r .
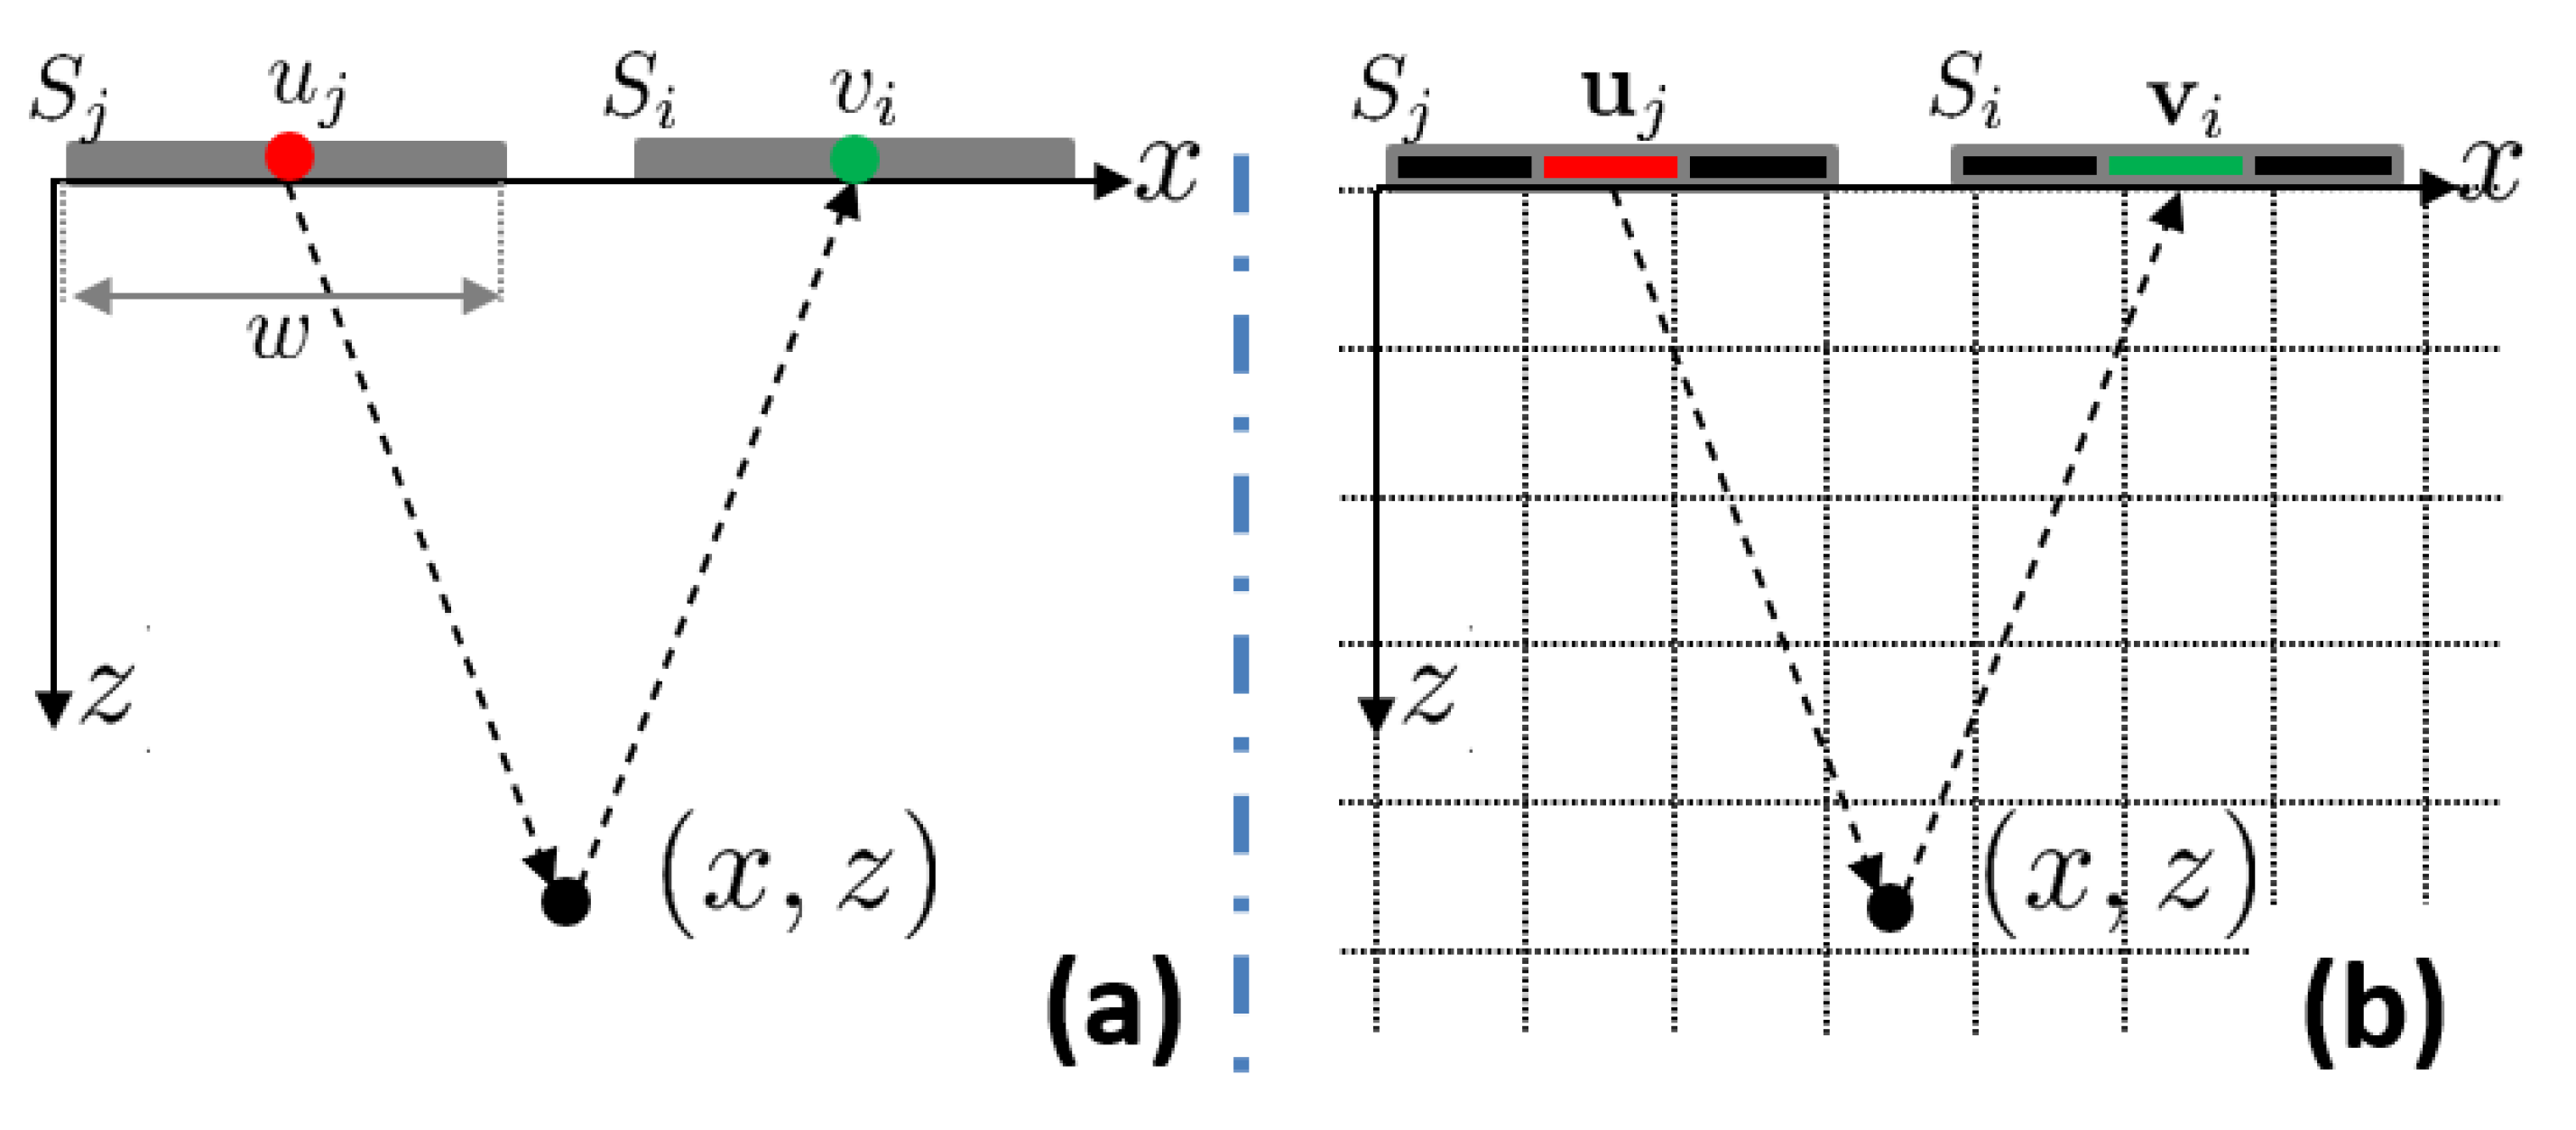
Let us now consider a more realistic case where j and i are planar transducers of surface S j and S i such that j is an emitter and i a receiver. The transducers are of height h (off-axis) and width w (along the x axis) (Figure 2a) with IR h j ( t ) and h i ( t ) , respectively. As shown by [41,42], the total received signal y j i ( t ) can be approximated by applying Huygens’ principle to both the emitting and receiving surfaces S j and S i , in other words, subdividing the surfaces S i and S j in N punctual transducers. Thus, the total signal received by i is equal to the sum of all of the signals generated by the ( u j , v i ) pairs. Assuming that second-order scatterings generates waves with negligible amplitudes (a first-order Born approximation), the signal received by i when j emits is:
y j i ( t ) = a ( t ) h j ( t ) h i ( t ) r i S i r j S j g u j v i ( t ) d r j d r i ,
where g u j v i ( t ) = r Ω g u j v i ( r , t ) γ ( r ) d r is obtained by applying Equation (3) to each pair ( u j , v i ) . Equation (4) can be seen as a convolution product between an emission/reception term and a wave propagation/scattering term, and therefore can be written as:
y j i ( t ) = e ( t ) g j i ( t ) , with : e ( t ) = a ( t ) h j ( t ) h i ( t ) , g j i ( t ) = r i S i r j S j g u j v i ( t ) d r j d r i .
where e ( t ) accounts for the excitation signal a ( t ) and the impulse responses h j ( t ) and h i ( t ) of the transducers. The term g j i ( t ) models the free-field propagation of the pressure wave in the medium Ω . The term g j i ( t ) can be seen as the pulse echo spatial impulse response of the medium when the planar transducer j emits and the planar transducer i receives.

2.2. Discretization of the Model

Let us assume that the signal y j i ( t ) is sampled at frequency f s . Each entry y j i [ n ] corresponds to the value of the respective continuous time signal at time t = t 0 + n / f s , where t 0 is the start time for reception and n = [ 1 N y ] . The medium Ω is partitioned into small cells of size ( Δ x , Δ z ) that form an N z × N x grid Ω (Figure 2b), where each entry γ [ m ] represents the scattering coefficient at the Ω grid cell defined by r = ( x Ω , z Ω ) Ω with:
m = x Ω N x Δ x N z + z Ω Δ z
where is the floor function. Thus, the discretized TRF γ is an N z N x × 1 vector that contains the scattering coefficients at each cell of the medium Ω . From Equation (5), it is possible to write the discrete space–time expression of y j i ( t ) as:
y j i = e v = 1 N u = 1 N g u j v i ,
where ⋆ is the discrete convolution, N is the number of subdivisions for each planar surface S j and S i , and the bold entities are the discrete equivalents (vectors) of the corresponding continuous time/space signals.
The discrete time convolution between e and g u j v i in Equation (7) can be represented as a matrix product between E and C u j v i , where the N y × N y Toeplitz matrix E (constructed using e ) depends on the excitation signal and on the IR of the transducers, and the matrix C u j v i (of size N × N × N y × N x N z ) is related to the forward/backward propagation of the wave inside the medium. Therefore, by applying Equation (A1) of Appendix A to Equation (7), we obtain:
y j i = E v = 1 N u = 1 N C u j v i γ = E C j i γ = Λ j i γ , with : C j i = v = 1 N u = 1 N C u j v i , Λ j i = E C j i .
In Equation (8), matrix E depends on the excitation signal and the IR of the transducers. Matrix C j i depends solely on the geometry of j, i, and Ω . The kernel Λ j i gathers all the properties of E and C j i inside one matrix.

2.3. Derivation of the Model for Plane-Wave Imaging

PWs are unfocused waves emitted using an array composed of N el separate transducers equally spaced by a pitch p. To emit a PW with a tilt angle θ ( k ) , the emission delays for each element j must be computed using the following expression:
t j = ( j 1 ) p sin ( θ ( k ) ) c ,
where j = [ 1 N el ] , p is the pitch, and ( k ) is the k th wave. From Equations (8) and (A3) in Appendix B, the PW equivalent of Equation (8) is given by:
y i = w i E j = 1 N el w j C j i γ = w i E C i γ = Λ i γ , with : Λ i = w i E C j i
where w i are the apodization weights at reception. Considering a uniform spatial apodization w j = w i = 1 , ( j , i ) , we can use Equations (10) and (A6) from Appendix B to write the received signal at the i th element of the array as:
y i ( k ) = E ( k ) j = 1 N el C j i ( k ) γ = E ( k ) C i ( k ) γ = Λ i ( k ) γ , with : C i ( k ) = j = 1 N el C j i ( k ) , Λ i ( k ) = E ( k ) C i ( k ) .
where a ( k ) ( t ) is the excitation signal for the k th PW.
As shown in Section 2.2, E ( k ) is a square matrix of size N y × N y , where N y is the length of the recorded signals y i . The size of the matrix C i ( k ) is N y × N z N x . For a single pair of planar transducers, a good approximation of the recorded signal is achieved when the medium is sampled along the z axis with a step Δ z = c / f s , which implies that N z = N y , and thus N y < < N z N x . The linear system in Equation (11) contains a greater number of unknowns than equations, which yields an ill-posed problem. In order to move closer to a well-posed problem, a simple approach is to increase the number of equations in Equation (11). To achieve this, the N el observation vectors y i ( k ) obtained for each PW with tilt angle θ ( k ) are concatenated. Therefore, similar to in Equation (11), γ is the same i 1 N el , and the new concatenated kernel Λ ( k ) will have the same number of columns as each Λ i ( k ) ; however, it will contain N el times more rows. The new concatenated system can be written as follows:
y ( k ) = Λ ( k ) γ , with : y ( k ) = y 1 ( k ) y 2 ( k ) y N el ( k ) , Λ ( k ) = Λ 1 ( k ) Λ 2 ( k ) Λ N el ( k ) .
where ‖ represents the vector concatenation along the rows. y ( k ) and Λ ( k ) are of size N el N y × 1 and N el N y × N z N x , respectively. As for the discretization of the medium Ω , we have Δ x < p (i.e., the spatial resolution along the x axis is smaller than the pitch of the linear array), which results in N x > N el . In other words, the concatenated kernel Λ ( k ) is still underdetermined.

2.4. Temporal Encoding for Simultaneous Emission of Plane Waves

A straightforward method that further increases the dimension of the observation space ( y ( k ) ) consists of the following:
(a) 
Emit a PW in the direction θ ( k ) and receive its backscattered echoes y ( k ) ;
(b) 
Build the corresponding concatenated kernel Λ ( k ) using Equation (12);
(c) 
Repeat steps (a) and (b) N pw times with a different angle θ ( k ) ;
(d) 
Build the total observation vector y ˜ of size N pw N el N y × 1 using:
y ˜ = y ( 1 ) y ( 2 ) y ( N pw ) ,
where each y ( k ) is computed using Equation (12);
(e) 
Build the enhanced kernel Λ ˜ of size N pw N el N y × N z N x using:
Λ ˜ = Λ ( 1 ) Λ ( 2 ) Λ ( N pw ) ,
where each Λ ( k ) is computed using Equation (12).
In Equation (14), it can be seen that there is a value of N pw = ( N z N x ) / N el N y for which the system given by Equation (15) stops being underdetermined, and the number of equations matches the number of unknowns.
y ˜ = Λ ˜ γ .
However, the acquisition time needed to record echoes from N pw observations is N pw times greater than the time needed from one PW emission. The unwanted effect of the increase in acquisition time is that for fast events, the TRF changes so quickly that for N pw successive emissions the TRF is not the same. Under these conditions, Equation (15) becomes less accurate. This drawback can be fixed by increasing the frame acquisition rate or by compensating the tissue displacement [43].
To overcome the previously stated problem, we propose to emit N pw PWs simultaneously using quasi-orthogonal codes a ( k ) ( t ) associated with each k t h PW. Using the principle of linear propagation of PWs, we can write the total received signal y ˇ i ( t ) at the element i as follows:
y ˇ i ( t ) = k = 1 N pw y i ( k ) ( t ) = k = 1 N pw e ( k ) ( t ) g i ( k ) ( t ) ,
where g i ( k ) ( t ) is the impulse response of the medium seen by the i t h element, when insonified with the k t h PW. From Equation (16), it can be seen that the received signals y ˇ i ( t ) contain a mix of echoes associated with each simultaneously emitted PW k. To separate the contributions of each PW, we propose to use filters f ( k ) ( t ) adapted to the typical e ( k ) ( t ) echo waveform of the of k t h wave. We can write the expression of the filtered backscattered echoes for each emitted PW k as follows:
g ^ i ( k ) ( t ) = f ( k ) ( t ) y ˇ i ( t ) ,
where g ^ i ( k ) ( t ) can be seen as an estimation of g i ( k ) ( t ) .
As we assume that all of the excitations a ( k ) ( t ) occupy the same frequency bandwidth, in Equation (17) the signal g ^ i ( k ) ( t ) contains some unwanted residual signal related to the waveforms e l ( t ) ( l k ), also known as the crosstalk noise. This noise can be evaluated by considering the case where all of the N pw PWs that carry the codes a ( k ) ( t ) are emitted successively. In this case, the received signals y i ( k ) ( t ) are not subject to crosstalk. Let us call g ¯ i ( k ) ( t ) the corresponding estimation of g i ( k ) ( t ) ; we then have:
y i ( k ) ( t ) = e ( k ) ( t ) g i ( k ) ( t ) , g ¯ i ( k ) ( t ) = f ( k ) ( t ) y i ( k ) ( t ) .
Using Equations (16)–(18), we can deduce the expression of the crosstalk noise ζ ( k ) ( t ) :
ζ ( k ) ( t ) = g ^ i ( k ) ( t ) g ¯ i ( k ) ( t ) = l = 1 , l k N pw f ( k ) ( t ) e l ( t ) g i l ( t ) .
To minimize ζ ( k ) ( t ) , there is the need to find the optimal filters f ( k ) ( t ) given the excitation signals a l ( t ) . Directly minimizing Equation (19) is a complex problem, and most importantly, its solution depends directly on the imaged medium (through g i l ( t ) ). Instead, we propose to minimize the following expression that is TRF invariant:
ζ r ( k ) ( t ) = l = 1 , l k N pw f ( k ) ( t ) e l ( t ) .
The optimal filters f ( k ) ( t ) that minimize Equation (20) are Wiener filters empirically adapted to the waveforms e ( k ) ( t ) as follows:
F ( k ) ( ν ) = E ( k ) ( ν ) | E ( k ) ( ν ) | 2 + S ( ν ) ,
where F ( k ) ( ν ) and E ( k ) ( ν ) are the Fourier transforms of the corresponding temporal signals, ( ) is the complex conjugate, and S ( ν ) is the spectral density of the crosstalk noise.
From Equation (21), it can be seen that the signals e ( k ) ( t ) (and the corresponding compression filters f ( k ) ( t ) ) that yield the lowest level of crosstalk need to be orthogonal or quasi-orthogonal (i.e., high, pronounced main lobe for the convolution f ( k ) ( t ) e ( k ) ( t ) , and low values of the product f l ( t ) e ( k ) ( t ) , l k ). The choice of the specific excitation signals used in this study is detailed in Section 2.10.

2.5. Discretization of the Coded Excitation PW Forward Model

For simultaneous PW imaging, the discrete time/space equivalent of the signal received by the i t h element of the array can be deduced by applying Equation (11) to Equation (16):
y ˇ i = k = 1 N pw Λ i ( k ) γ = Λ ̲ i γ , with : Λ ̲ i = k = 1 N pw Λ i ( k ) .
The discrete expressions of the impulse responses estimation g ^ i ( k ) ( t ) can be computed as follows:
g ^ i ( k ) = F ( k ) y ˇ i = F ( k ) Λ ̲ i γ ,
where F ( k ) are Toeplitz matrices computed using the waveforms of the filters f ( k ) . From Equation (23), it can be deduced that each matrix F ( k ) has N y columns, with the number of rows set by the relation N y + N f 1 with N f —the length of the vectors f ( k ) .
As g ^ i ( k ) depends only on the interaction between the PW k and the medium (leaving out the crosstalk ζ ( k ) ( t ) ), the observation space can be built by concatenation of the vectors g ^ i ( k ) for all of the receiving elements N el and all of the PWs N pw :
g ˜ = g ^ 1 1 g ^ 2 1 g ^ N el 1 g ^ 1 N pw g ^ 2 N pw g ^ N el N pw .
Under these conditions, using Equation (23), we can write the total kernel and the corresponding linear system as follows:
Ψ = F 1 Λ ̲ 1 F 1 Λ ̲ N el F N pw Λ ̲ 1 F N pw Λ ̲ N el , g ˜ = Ψ γ .

2.6. Inverse Problem Statement

In this section, the inverse problem is established and a gradient-based solver is implemented to estimate the TRF.
In the presence of noise b , which refers to modeling and acquisition noise, Equation (A3) becomes:
g ˜ = Ψ γ + b .
A straightforward way to solve the problem of Equation (26) would be to minimize in a least squares sense: Ψ γ g ˜ 2 2 , where 2 represents the l 2 norm. Under the condition that Ψ is well-conditioned, the solution would be γ ^ = Ψ g ˜ , where Ψ is the Moore–Penrose pseudo-inverse of Ψ .
As shown in Appendix C, Ψ is ill-conditioned. Thus, the use of the pseudo-inverse would provide a degraded TRF estimation due to the amplification of the noise b . This problem can be overcome by constraining the solution space through a regularization [44]. The TRF can then be estimated as:
γ ^ SPW - FM - Lp = argmin γ { Ψ γ g ˜ 2 2 + λ γ p } ,
where p is the p norm, and the scalar λ allows for a trade-off between the data fitting and the regularization term.
Finding a general regularization term in Equation (27) is an open problem in the ultrasound domain. The norm l p and the weight λ are usually adapted as a function of the TRF [33,35,36]. In this article, the TRF is obtained using l p = l 1 ; thus, the weight λ always remains between 0 and 1. If the expected solution is sparse, λ is set high, otherwise smaller values are used [45]. Here, λ is adapted on a trial-and-error basis.
The estimation of the TRF γ is obtained using the fast iterative shrinkage-thresholding algorithm (FISTA) [46]. A detailed implementation of FISTA is presented in [37]. Similar to [37], the FISTA stopping criterion was set to be a drop in the relative difference (between successive estimations) of the TRF of under 10 3 . A final step of log-compression is applied to the TRF.

2.7. Experiment Parameters

For the simulations and the experiments, a numerical model of the probe was used (LA523E; Esaote, Florence, Italy). The probe consists of 64 elements spaced by 245 µm, resulting in an aperture of 1.565 cm. The central frequency is 8.5 MHz. The IR of the probe corresponds to the estimation given by the manufacturer. The assumption that the IR is the same for all of the elements of the probe in emission and reception was made in the model. The elements were subdivided by using N = 10 in the forward model.
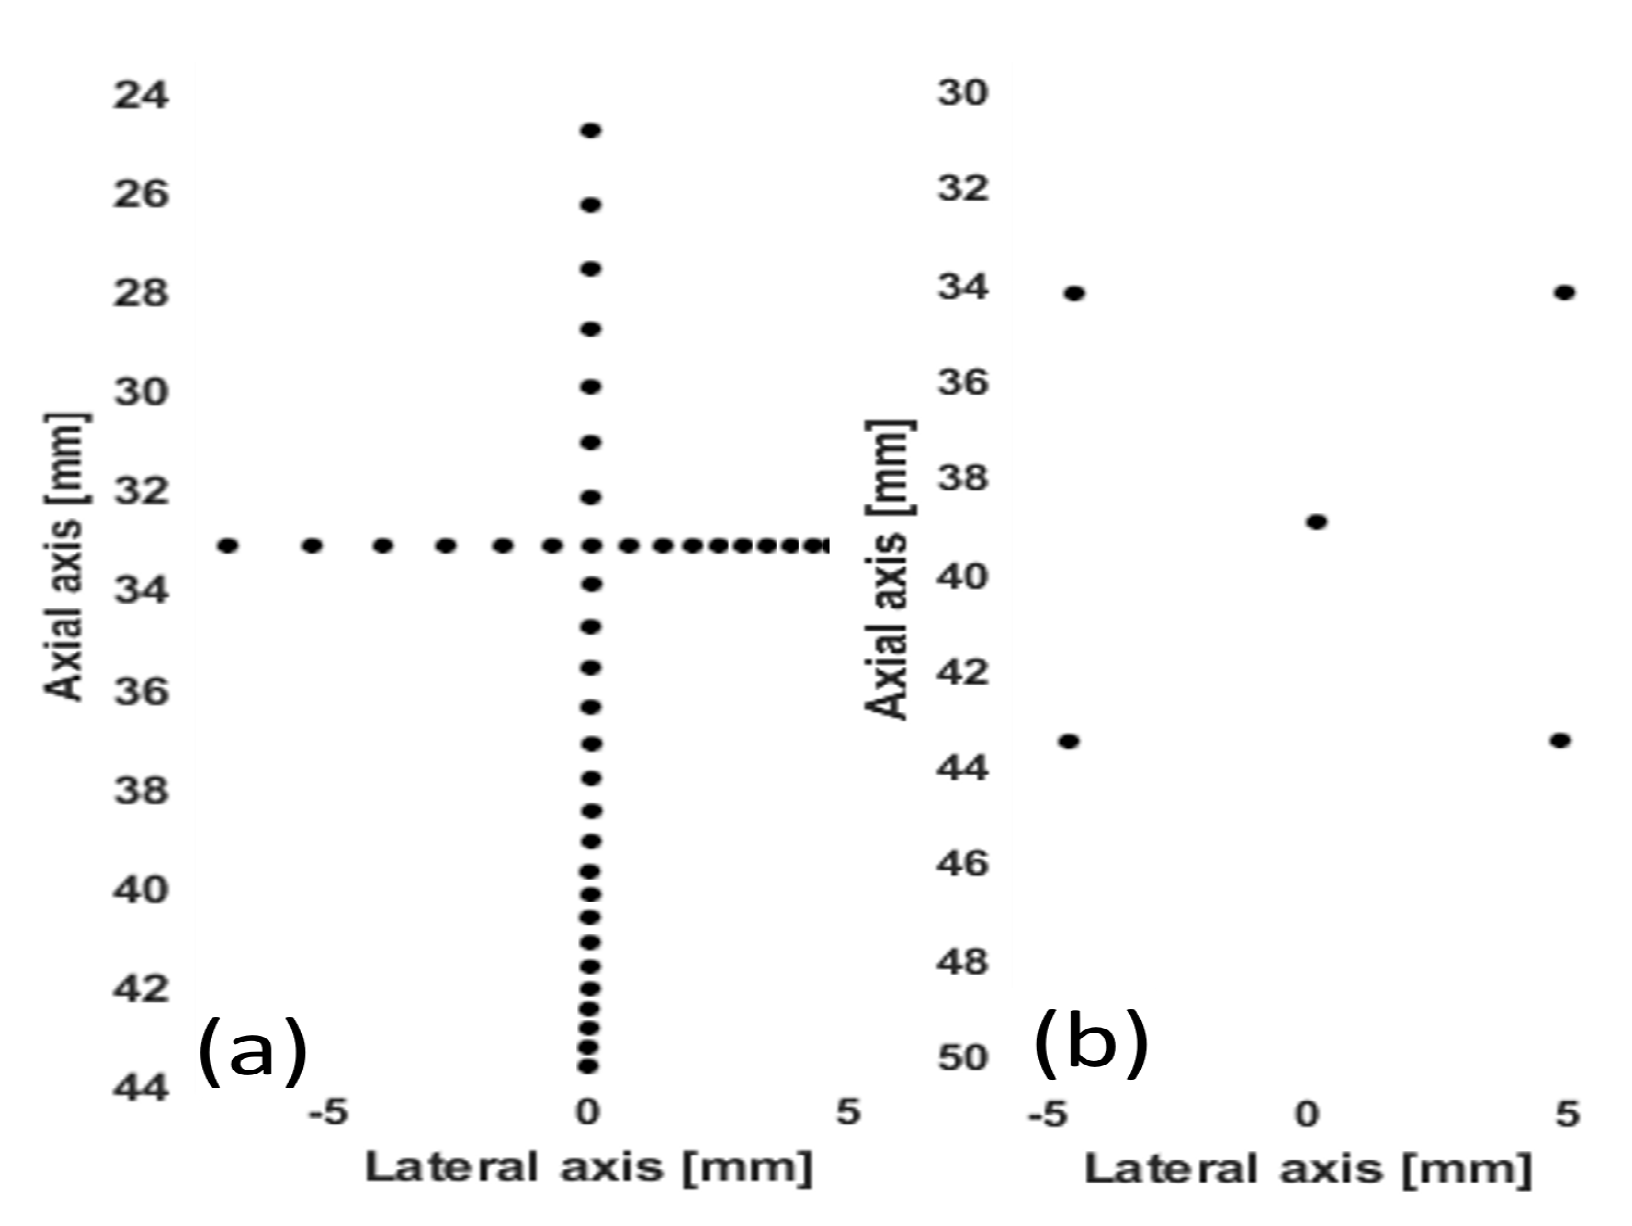
The proposed method was simulated using Field II [38,47] on a synthetic sparse medium (Figure 3a), which contains 35 scatterers. The distance between scatterers varies linearly from 1.25 mm to 50 µm on the vertical axis, and from 1 mm to 120 µm on the horizontal axis. The proposed method was also evaluated experimentally on a sparse medium composed of five wires in a water tank (Figure 3b). This phantom was made by uniformly stretching the wires inside a custom PVC mold. For the numerical simulations, the Field II sampling rate f s was set to 200 MHz, and then decimated to 50 MHz. For the experiment, f s was set to 50 MHz. The images are reconstructed on a grid with a pixel size equal to 25 µm in the axial direction and 61.25 µm in the lateral direction.

2.8. Reconstruction Using Delay and Sum

The results obtained are compared with those provided by the classic reconstruction algorithm DAS [18], using successive PWs. The excitation signal is two periods of sine waves at the central frequency of the probe (8.5 MHz). The received signals y DAS i ( k ) are apodized in reception using a Tukey window with cosine fraction of 0.75. The f-number is set to 1.75. Note that the DAS acquisitions are performed with only 64 elements and three PWs, which is the same for the proposed method. An estimation of the TRF ( γ ^ 3 PW - DAS ( k ) ) is obtained after each PW emission/reception. Finally, γ ^ 3 PW - DAS is obtained by coherently adding the N pw estimations. A post-processing step of envelope extraction and log-compression is applied to γ ^ 3 PW - DAS to obtain the final TRF estimation (B-mode).
For comparison purposes, a second denoised-DAS image is created by applying 1 denoising on γ ^ 3 PW - DAS , such that γ ^ 3 PW - DAS - L 1 = argmin x { x γ ^ 3 PW - DAS 2 2 + μ x 1 } , where x represents the targeted sparse output image. This enables a comparison with γ ^ SPW - FM - L 1 , which is intrinsically constrained to a sparse solution through the 1 regularization term (Equation (27)). The μ parameter is set as high as possible, while ensuring that all scatterers remains visible on the reconstructed image.

2.9. Image Quality Metrics

To evaluate the image quality provided by the proposed method, the following metrics are used:
  • Spatial resolution—quantifies the main lobe width of a point scatterer. The spatial resolution is quantified by the full width at half maximum (FWHM), which measures the spatial spreading of a point scatterer in the −6 dB interval. The spatial resolution FWHM is measured both axially and laterally.
  • Peak-to-center intensity difference (PCID)—quantifies the ability to separate two scatterers in the reconstructed image [48,49]. PCID is a measurement of the minimum value of intensity in the pixels that separate two maxima corresponding to the scatterers. We consider that two scatterers are separate if PCID is at least -6 dB. PCID is computed both axially and laterally for the TRF estimations γ ^ SPW - FM - L 1 , γ ^ 3 PW - DAS , and γ ^ 3 PW - DAS - L 1 .

2.10. Temporal Plane-Wave Encoding

As Δ x < p , the forward model for one PW insonification is underdetermined Section 2.3. To increase the size of the observation space, coded PWs are emitted simultaneously. For the kernel Ψ , the number of observations is equal to the number of unknowns when N pw = 3 PWs are emitted simultaneously inside the medium. The chosen emission angles θ ( k ) are the following: θ ( 1 ) = −10 , θ ( 2 ) = 0 , and θ ( 3 ) = 10 , which ensures that each angle provides new information about the TRF [18,50].
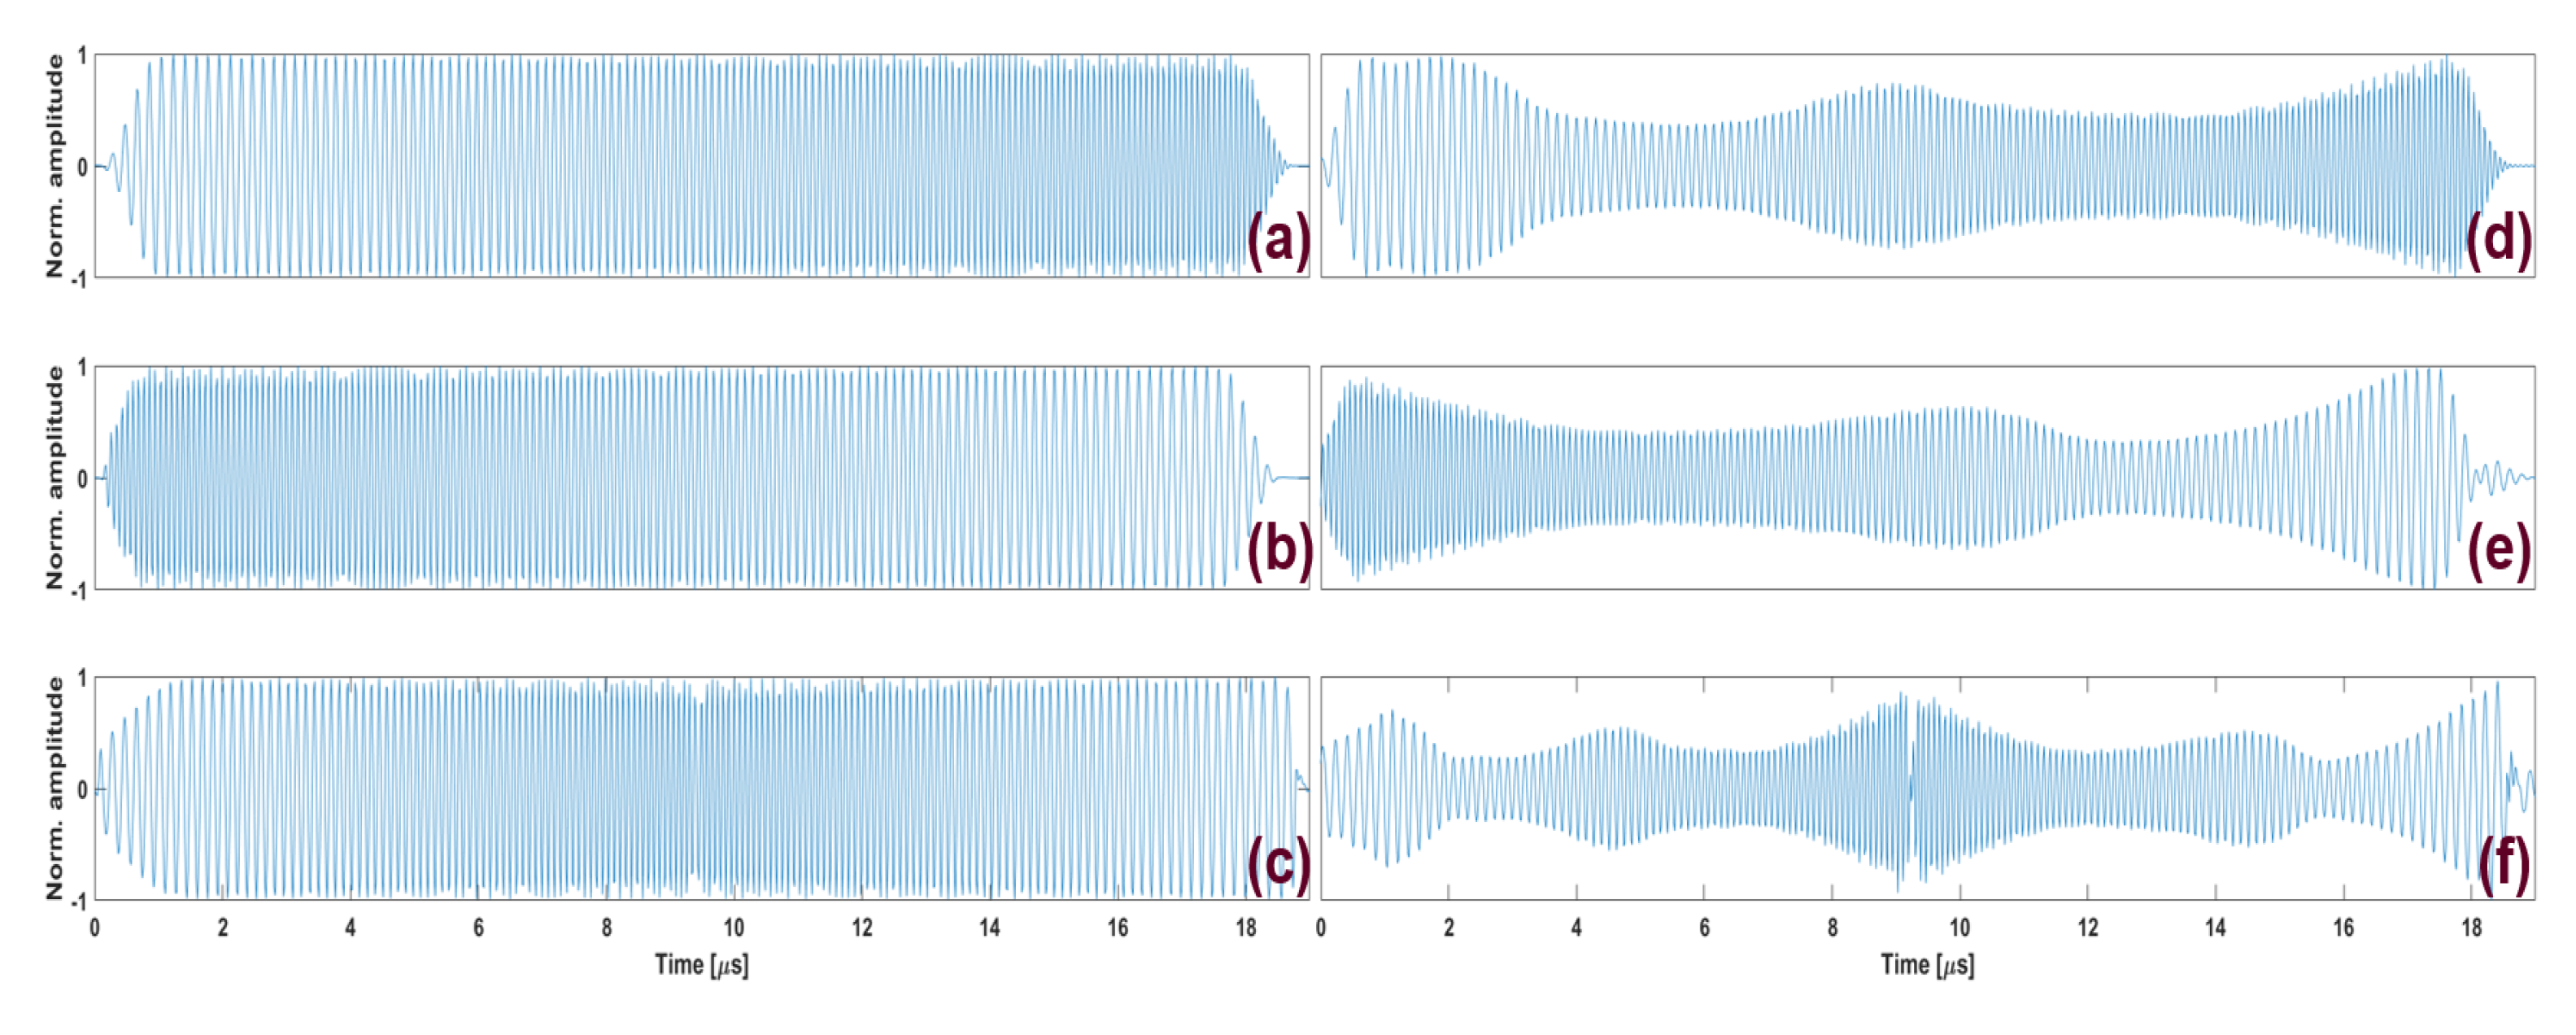
Extensive research, which we cannot detail here for the sake of brevity, shows that the waveforms e ( k ) ( t ) and the corresponding filters f ( k ) ( t ) that minimize the crosstalk (see Equation (18)) in accordance with the technical specifications of the ultrasonic emission system consist of a mix between chirps (Figure 4a–c) [24]. To compute a ( k ) ( t ) , we propose the following pipeline:
(a)
e 1 ( t ) is designed as a chirp waveform emitted with an angle θ ( 1 ) :
e ( 1 ) ( t ) = η ( t ) cos 2 π f 0 t + π B T t 2 ,
where B = 5.1 MHz is the bandwidth of the ultrasound probe, T = 18.55 μ s is the waveform duration, f 0 is the central frequency of the probe, and η ( t ) is a 20% Tukey window of duration T. The instantaneous frequency of the signal grows with time and thus e 1 ( t ) is called an ‘up’ chirp.
(b)
In the same way as e ( 1 ) ( t ) , e ( 2 ) ( t ) is designed as a ‘down’ chirp waveform emitted with an angle θ ( 2 ) :
e ( 2 ) ( t ) = η ( t ) cos 2 π f 0 t π B T t 2 ,
(c)
e ( 3 ) ( t ) is designed as a ’up–down’ chirp, with slopes twice as steep as e ( 1 ) ( t ) and e ( 2 ) ( t ) , emitted with an angle θ ( 3 ) :
e ( 3 ) ( t ) = η ( t ) cos 2 π f 0 t + π 2 B T t 2 , f o r 0 < t < T 2 ; e ( 3 ) ( t ) = η ( t ) cos 2 π f 0 t π 2 B T t 2 , f o r T 2 < t < T ;
(d)
The excitation signals a ( k ) ( t ) are deduced from the relation e ( k ) ( t ) = a ( k ) ( t ) h ( t ) , using the following Wiener filter:
Ψ ( k ) ( ν ) = H ( k ) ( ν ) | H ( ν ) | 2 + ς , A ( k ) ( ν ) = Ψ ( ν ) E ( k ) ( ν ) ,
where the parameter ς can be empirically tuned to bypass zero division (outside the bandwidth of h ( t ) ) [51], and A ( ν ) and E ( ν ) are the Fourier transforms of a ( t ) and e ( t ) , respectively.
The resulting excitation signals a ( k ) ( t ) that allow the generation of echoes of shape e ( k ) ( t ) (Figure 4a–c) are shown in Figure 4d–f. These excitation signals allow the negative effects to be overcome (i.e., main autocorrelation lobe broadening, compression side lobe level increased [52,53]), and they were successfully implemented on chirps by [54,55,56].
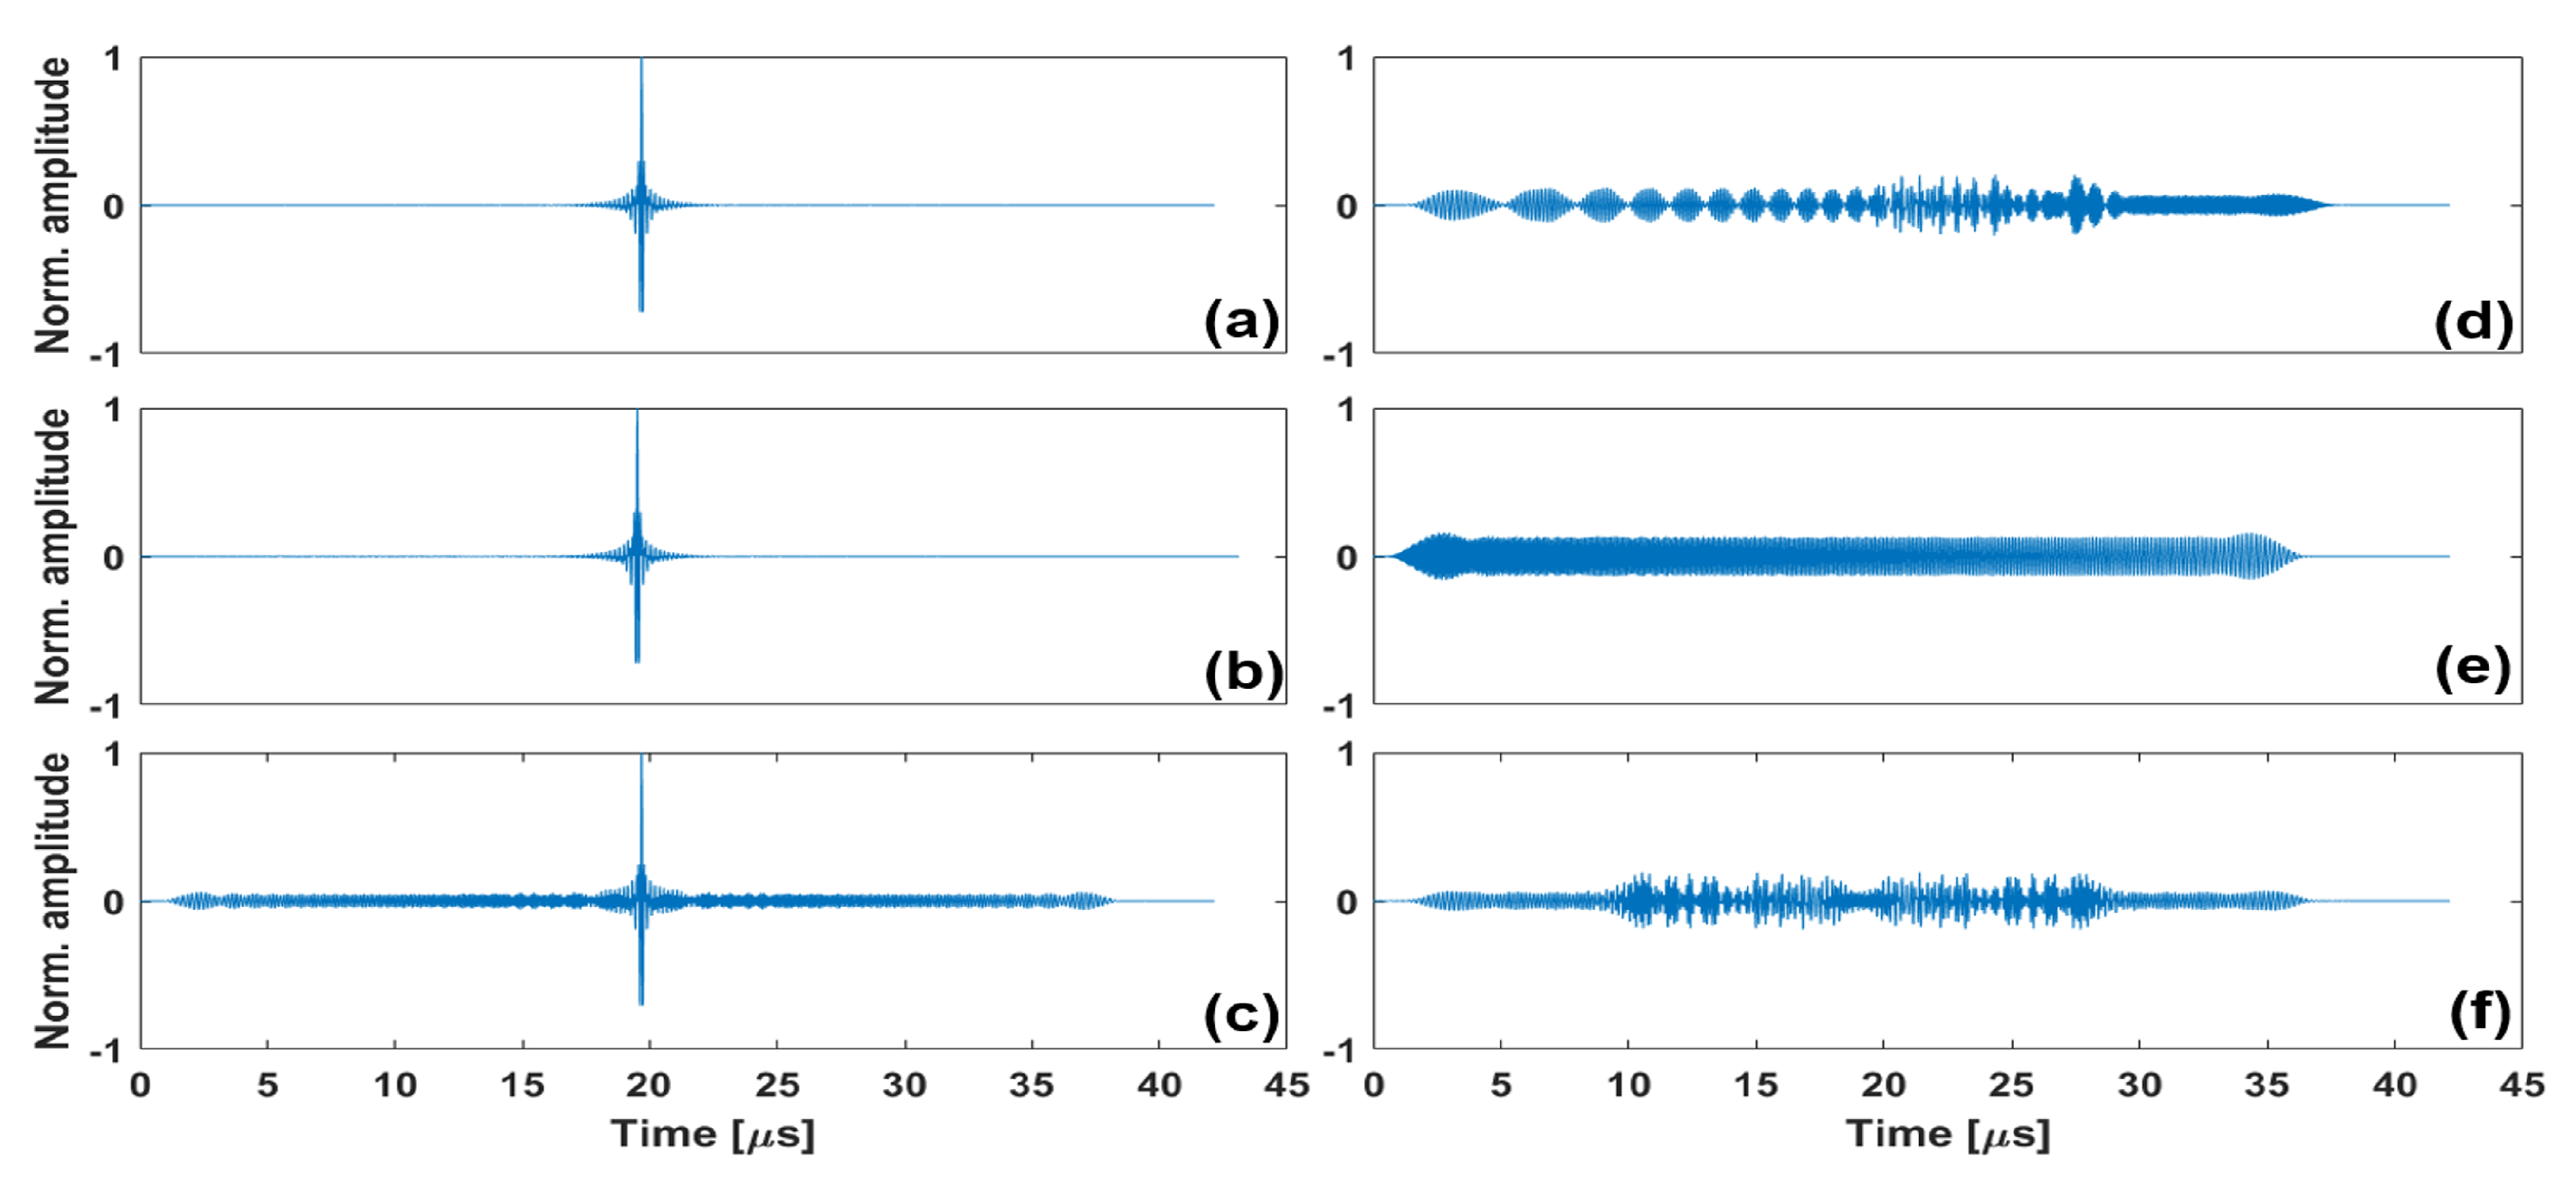
The optimal filters f ( k ) ( t ) are computed using Equation (21). The filtering results of the e ( k ) ( t ) waveforms with the corresponding f ( k ) ( t ) filters are shown in Figure 5a–c. Each crosstalk ζ r ( k ) ( t ) , computed using Equation (20), is illustrated in Figure 5d–f. The amplitude of the crosstalk noise is lower than the amplitude of the compressed pulse by more than 14 dB.

2.11. On the Gain in Acquisition Time

For a conventional emission/reception of three PWs, the total acquisition time can be approximated by:
t 3 PW = 3 ( t s + t Ω + t SW ) + k = 1 3 t ( k ) ,
where t s is the duration of the excitation signal, and t Ω is the total time needed for the ultrasound wave to propagate forward and backward inside the medium Ω . t SW < < t s < < t Ω is a buffer time that most ultrasound scanners require to switch between an emission event and a reception event, and t ( k ) is the maximal emission delay for each PW k. Indeed, for the proposed method, the excitation signals are longer than for a conventional acquisition scheme ( t a > t s ); however, as all three PWs are emitted simultaneously, the total acquisition time can be approximated by:
t SPW = t a + t Ω + t SW + max k [ 1 . . 3 ] t ( k ) .
Thus, using Equations (32) and (33), we can deduce the gain in acquisition time as:
η 3 PW = t 3 PW t SPW t 3 PW 2 t Ω + 3 t s t a 3 t Ω + 3 t s .
In Equation (34), it can be seen that if t Ω > > t a then η 3 PW 2 / 3 ; in other words, if the imaged medium is very large, the time gain provided by the proposed method is 66%. In this study, the value of t Ω = 53.6 μ s is not much higher than that of t a = 18 μ s. Thus, the time gain provided for this configuration is η 3 PW = 55.57%.

3. Results

In this section, the results obtained using the described mediums (Section 2.10) are detailed. First, the performance of the forward model is evaluated using numerical simulations on point scatterers. Then, the method is applied experimentally on a sparse medium using a commercial scanner (Pioneer, TPAC, Nantes, France). This ultrasonic system has an arbitrary waveform generator that enables emission of the coded waveforms described in Section 2.10.

3.1. Wire Phantom Simulation

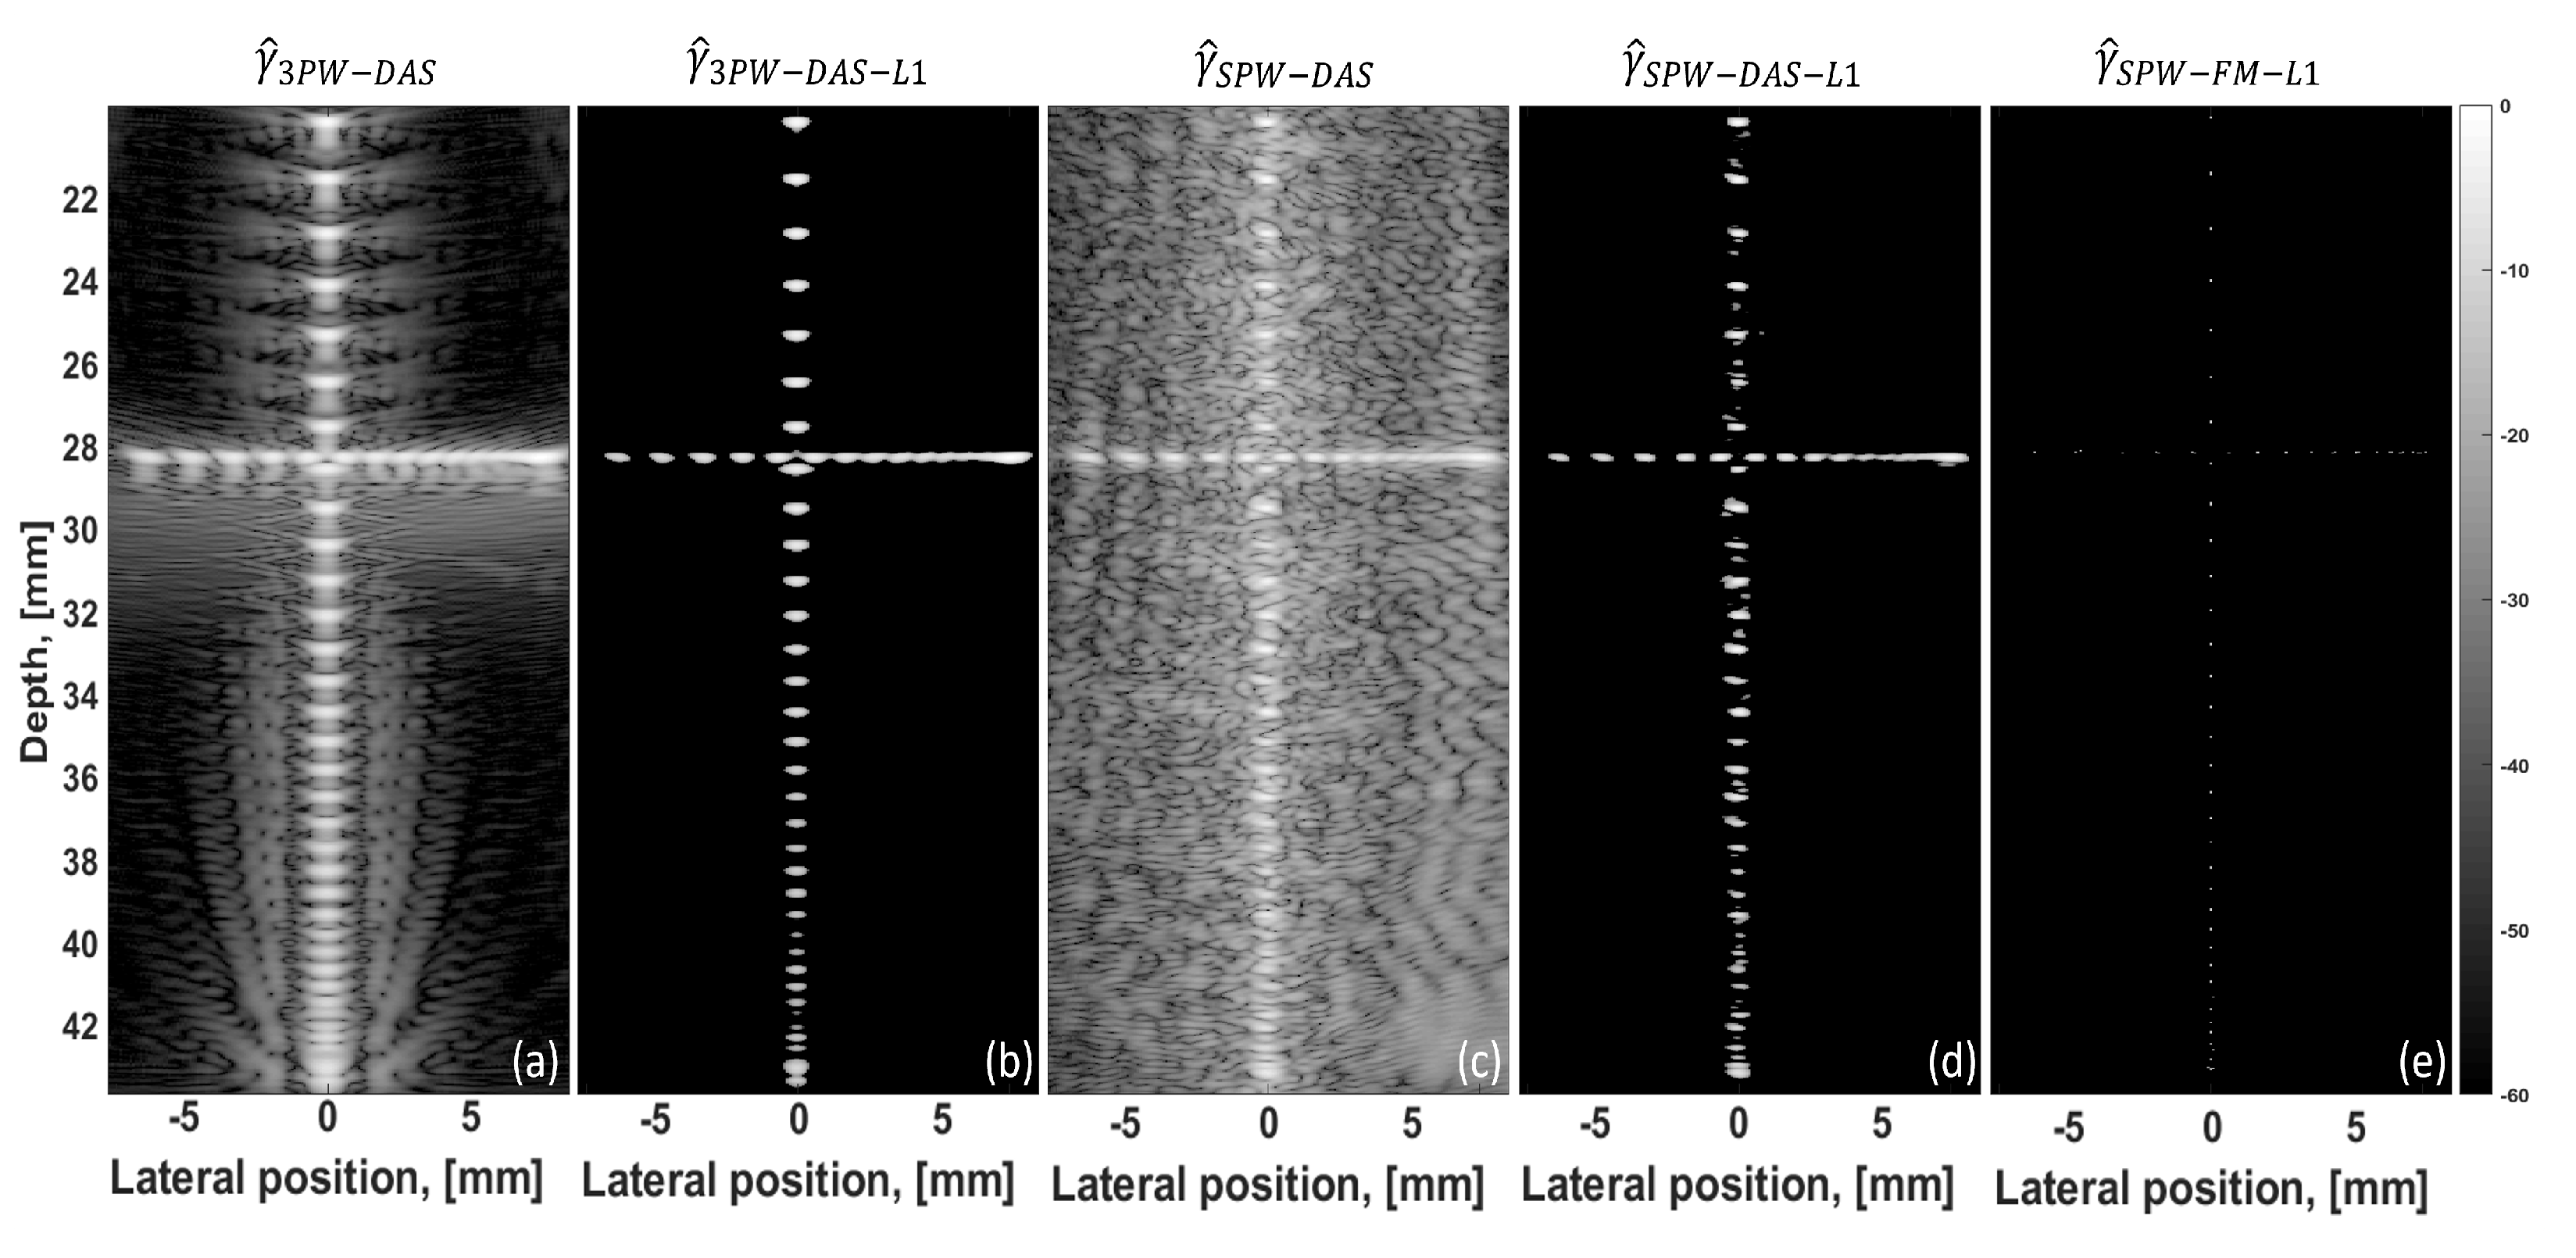
Here, the method is evaluated in simulation using the phantom described in Figure 3a. Figure 6 (left to right) shows the TRF estimations γ ^ 3 PW - DAS obtained using DAS on successive PW acquisitions. γ ^ 3 PW - DAS - L 1 is obtained by 1 denoising of γ ^ 3 PW - DAS , as described in Section 2.8). The TRF estimation γ ^ SPW - DAS is obtained by applying DAS to the g ^ ( k ) compressed echoes obtained after Wiener filtering. The TRF estimation γ ^ SPW - DAS - L 1 is an 1 denoised version of γ ^ SPW - DAS , with the same denoising process described in Section 2.8. Finally, the estimated TRF with the proposed method γ ^ SPW - FM - L 1 is shown using λ = 0.01.
First, it can be seen that the point scatterers are correctly localized whatever the reconstruction method. However, image quality varies greatly between the techniques. It is noted that γ ^ SPW - DAS is a poor-quality image with a very high amount of noise. In other words, since the excitation sequences e ( k ) are not perfectly orthogonal (as described in Figure 5), the RF estimations g ^ ( k ) are corrupted with crosstalk noise that affects the image negatively. Nevertheless, when applying 1 denoising, the TRF is relatively similar to the one of γ ^ 3 PW - DAS - L 1 .
The TRF-estimated γ ^ 3 PW - DAS contains artifacts that affect the final image negatively. From Table 1, it can be seen that the scatterers are reconstructed with a broader spatial resolution than for the proposed method. As the scatterers are punctual, thinner spatial resolution means a better reconstruction. When applying 1 denoising ( γ ^ 3 PW - DAS - L 1 ), the DAS artifacts are suppressed and the spatial resolution decreases both axially and laterally. However, it can be seen that the TRF estimation is better with the proposed method as the spatial resolution is point-like. This effect is clearly noted on the closely placed wires (e.g., at 31 mm, the rightmost points are not distinguishable), while the proposed method separates these targets.
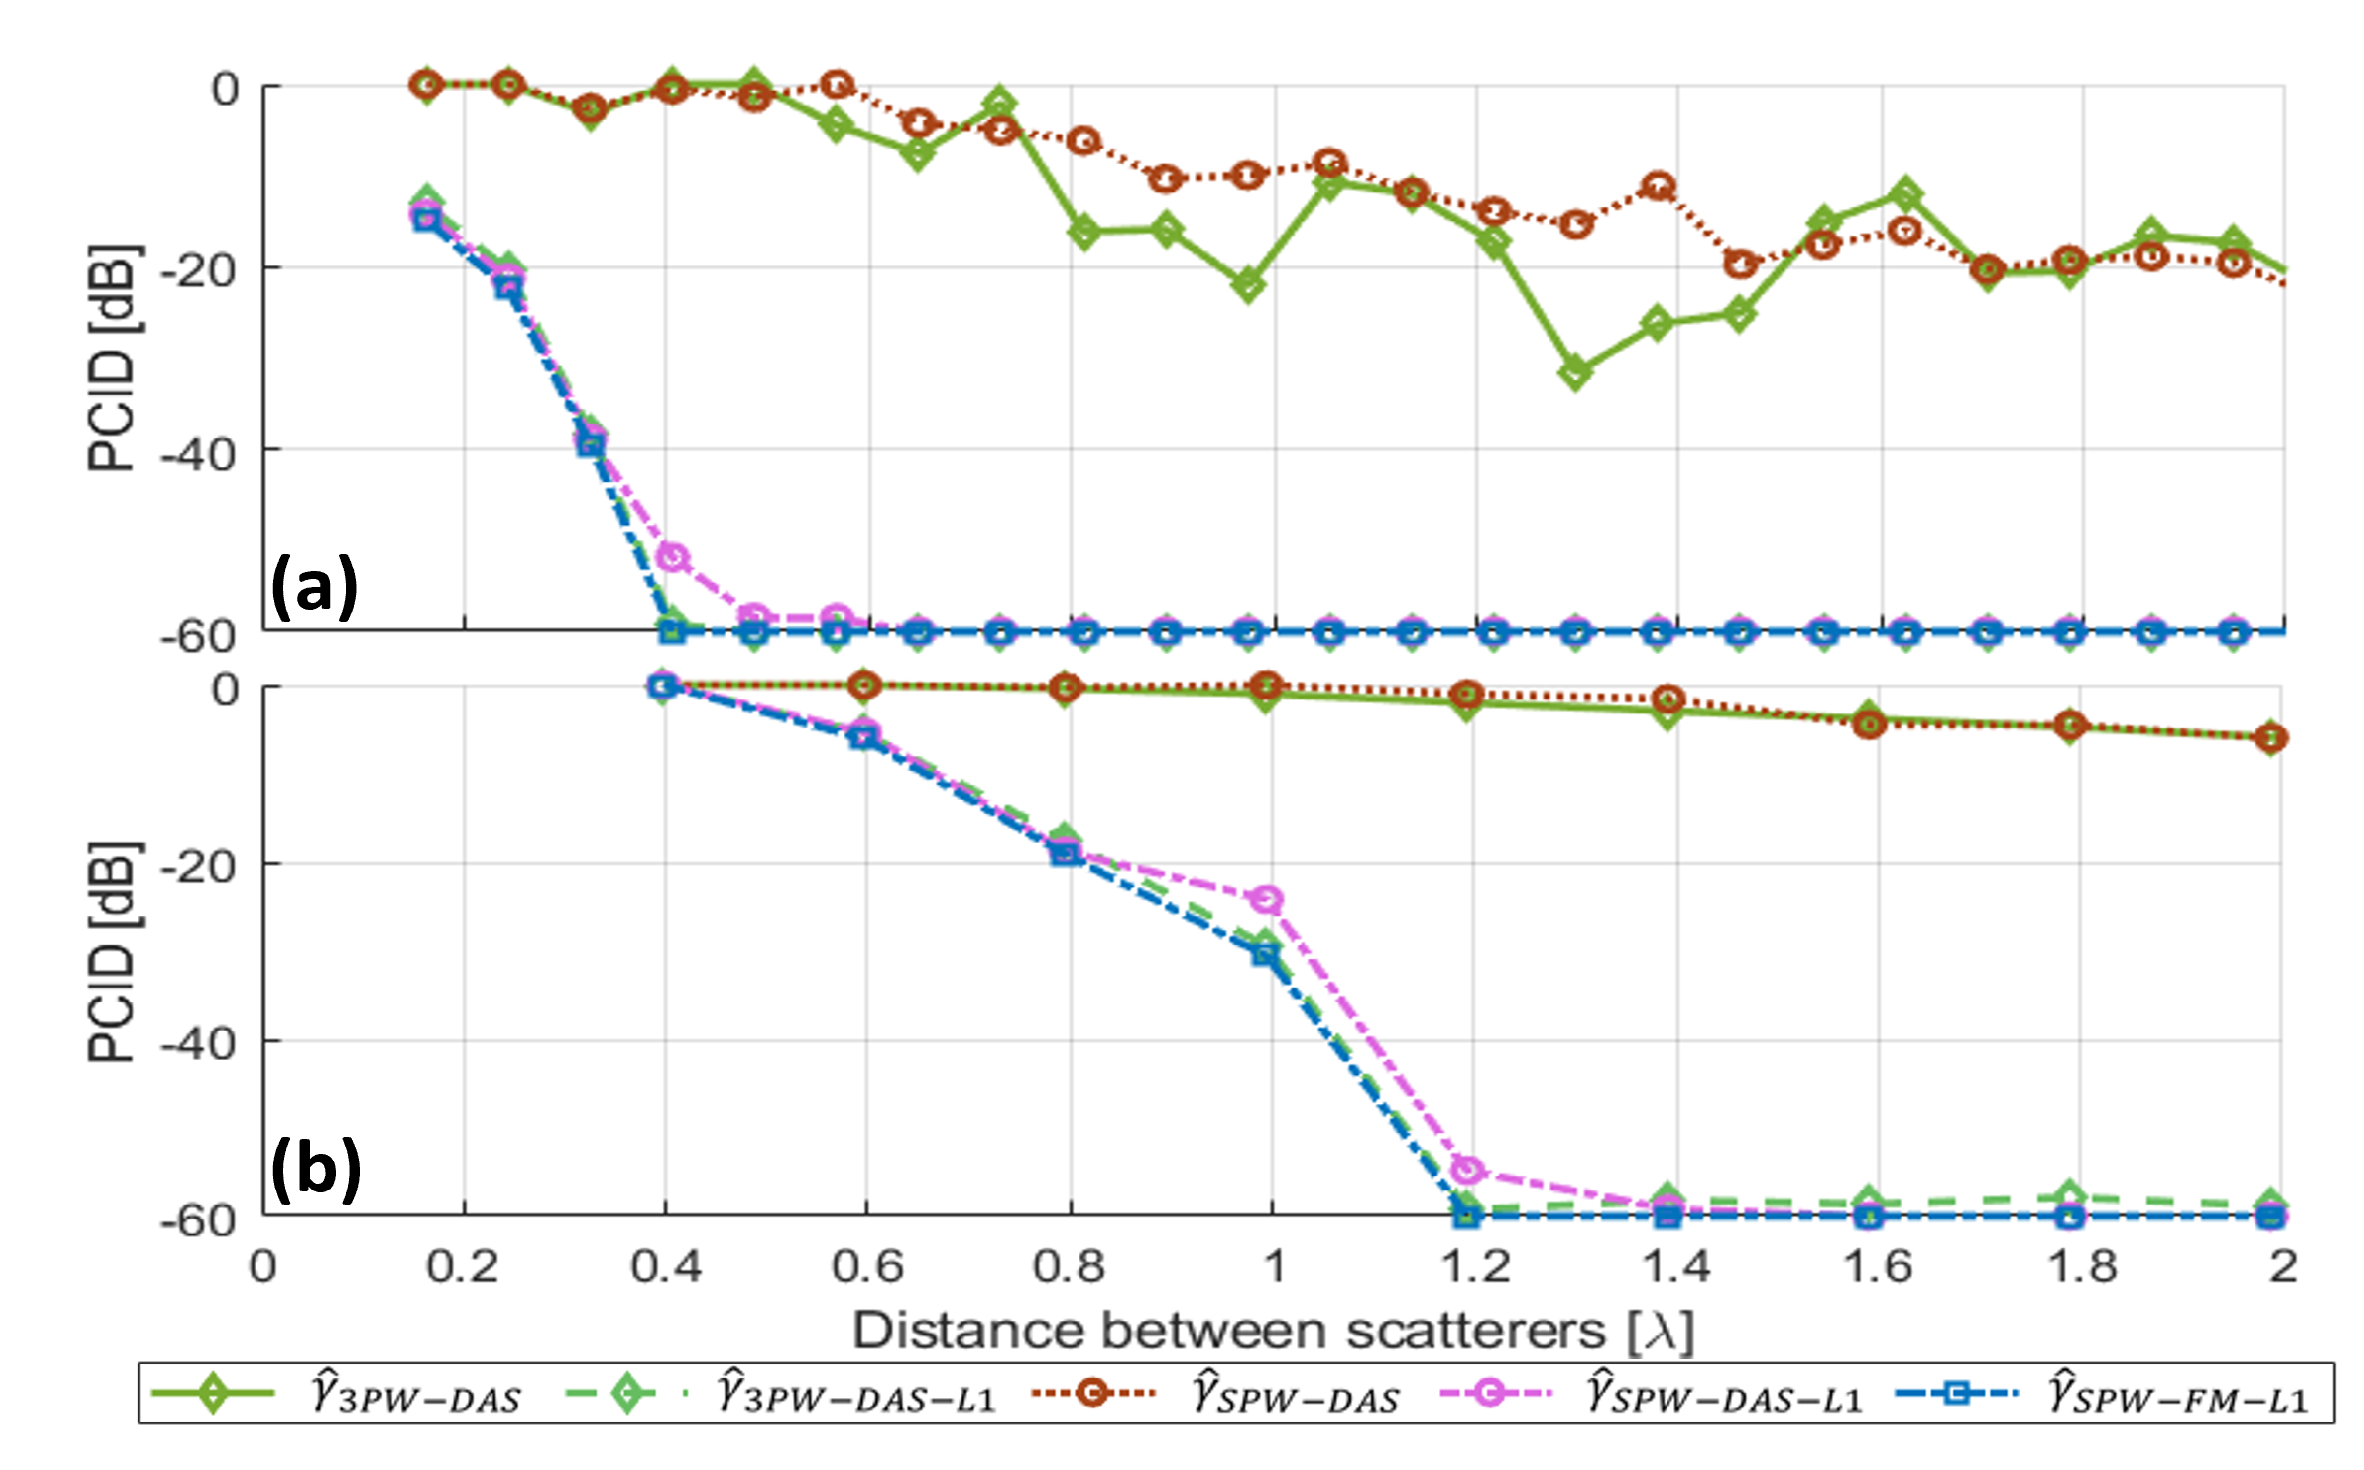
The performance of all the methods is evaluated using the PCID (Section 2.9) from 0.16 λ to 2 λ in both the axial and lateral directions. The results are presented in Figure 7. For the axial direction, scatterers spaced more than 0.16 λ are separated by the proposed method, γ ^ 3 PW - DAS - L 1 and γ ^ SPW - DAS - L 1 , while γ ^ 3 PW - DAS allows us to separate scatterers spaced more than 0.81 λ and γ ^ SPW - DAS more than 0.89 λ . For the lateral direction, scatterers spaced more than 0.6 λ are separated by the proposed method, γ ^ 3 PW - DAS - L 1 and γ ^ SPW - DAS - L 1 , while γ ^ 3 PW - DAS allows us to separate scatterers spaced more than 2 λ . Thus, the proposed method outperforms conventional DAS reconstruction in terms of spatial resolution in the simulated sparse medium. The performance is similar with γ ^ 3 PW - DAS - L 1 and γ ^ SPW - DAS - L 1 ; however, γ ^ SPW - DAS - L 1 contains a significant amount of noise even with few scatterers and will therefore be discarded for the rest of the study.

3.2. Wire Phantom Experiment

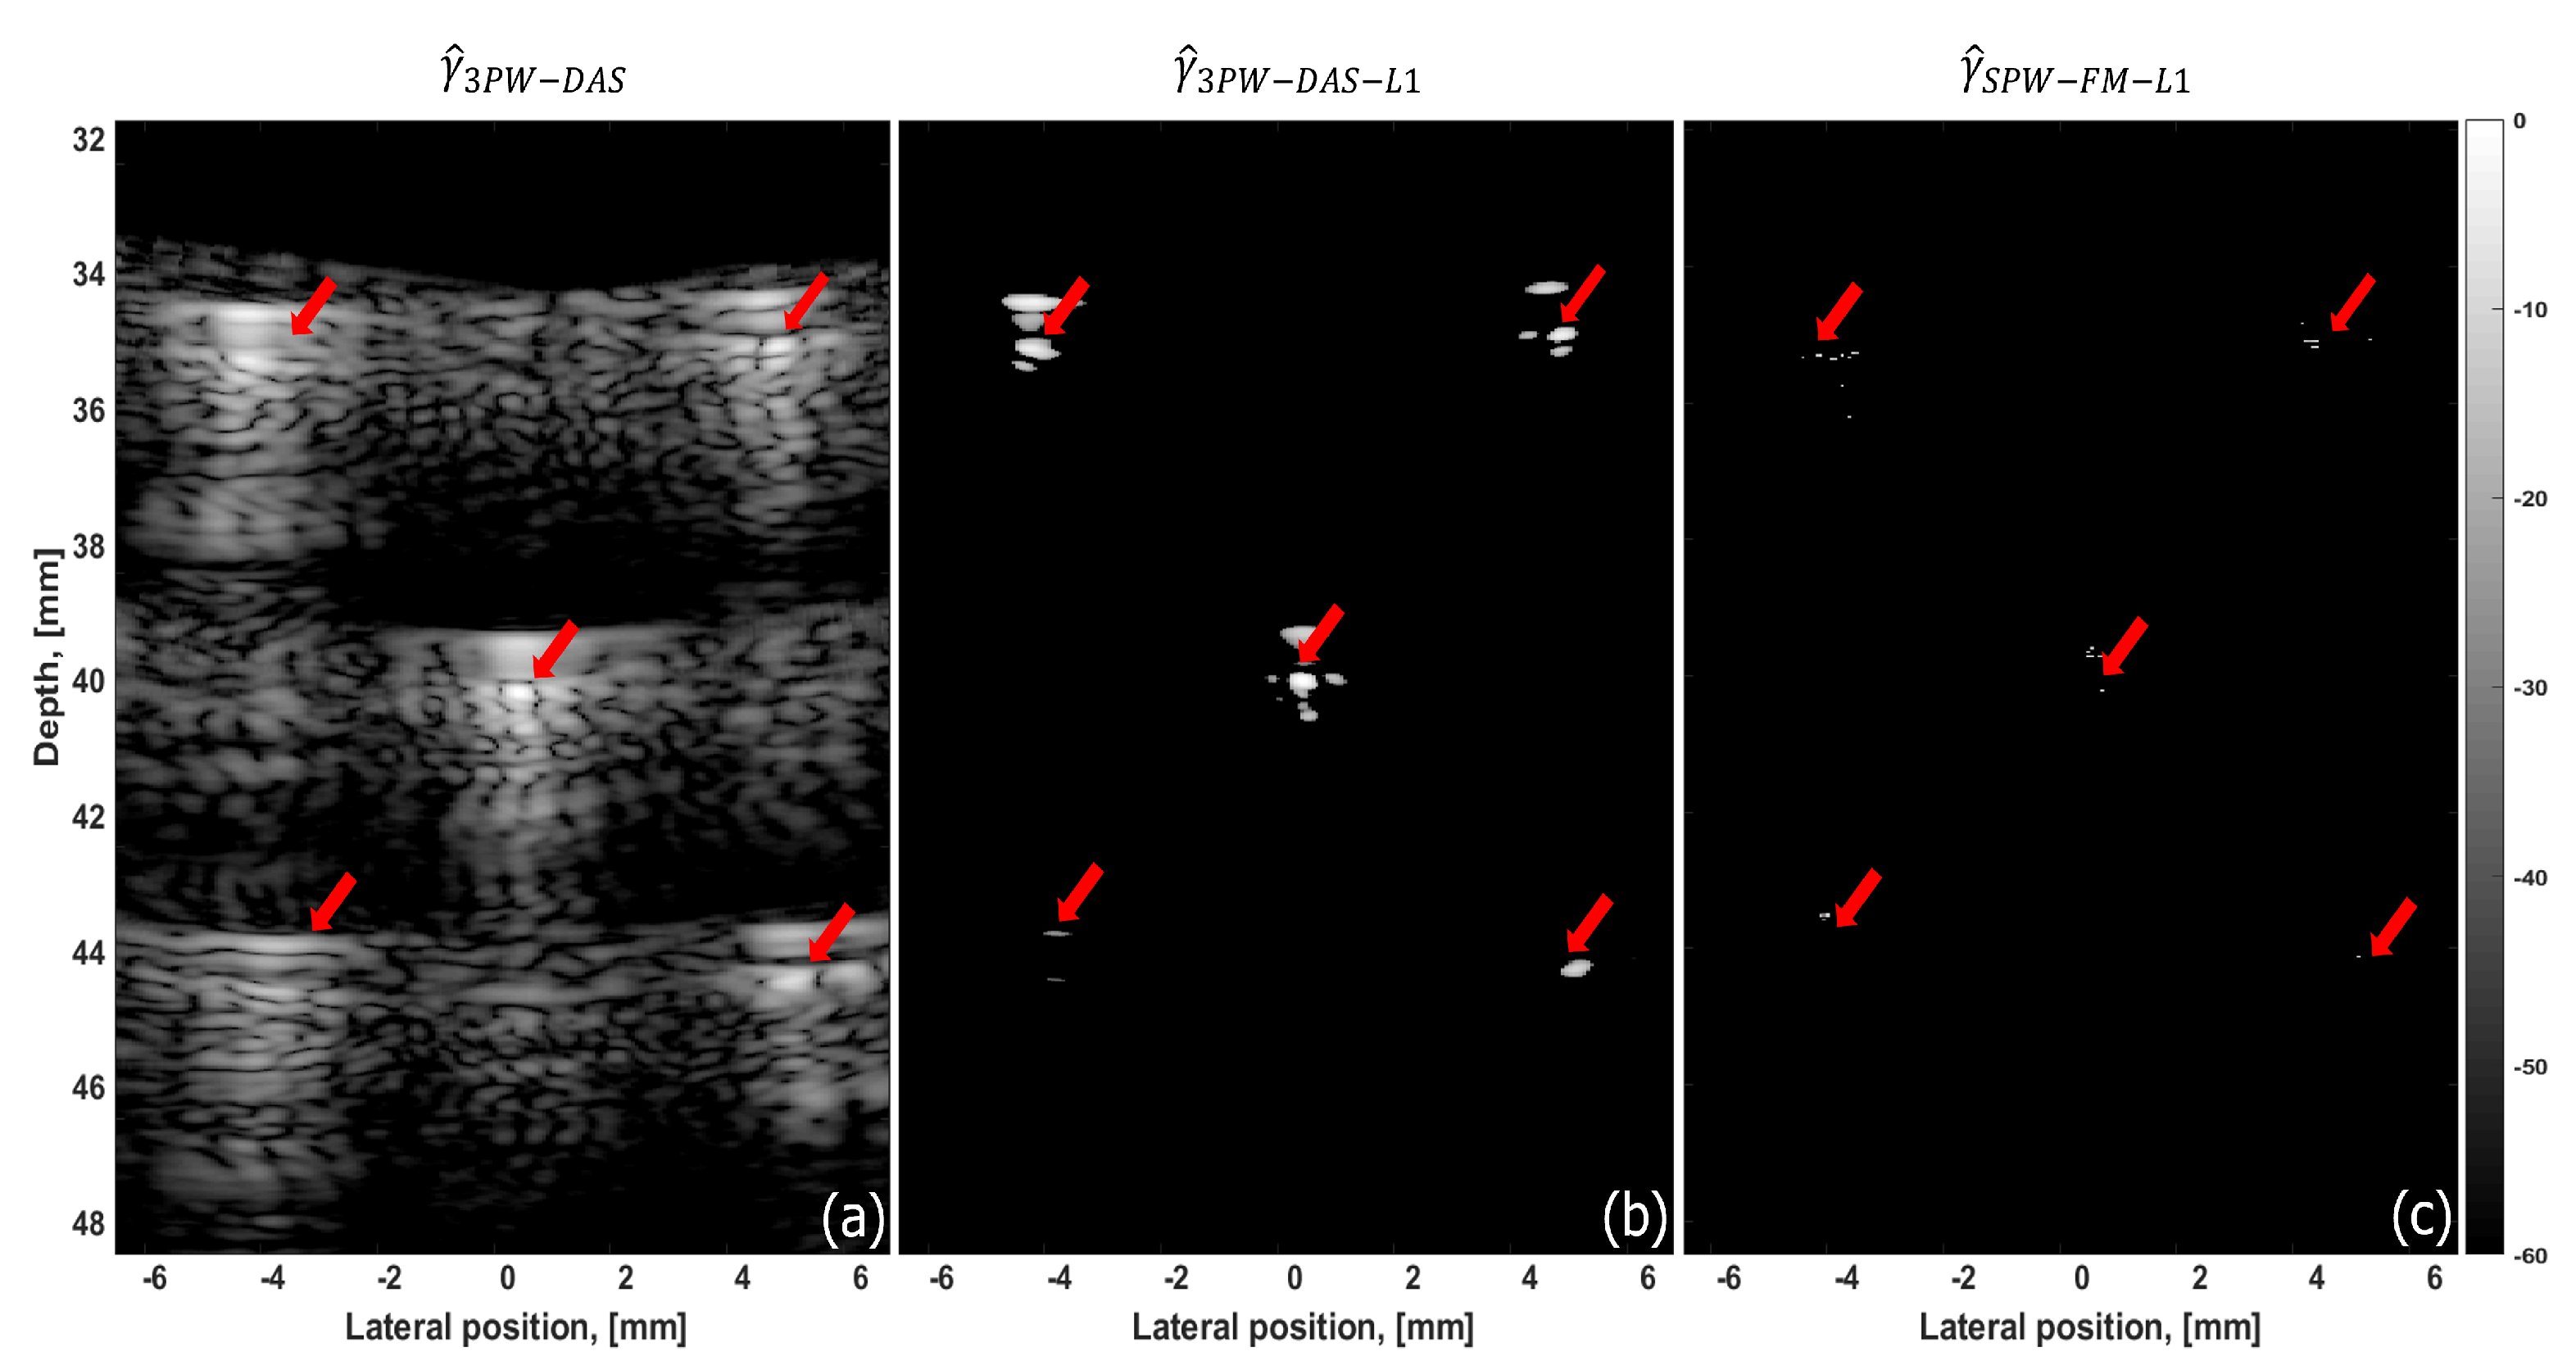
In this subsection, we apply the proposed method experimentally to the sparse medium described in Figure 3b. Figure 8 shows the estimated TRF using DAS ( γ ^ 3 PW - DAS ), using 1 denoising on γ ^ 3 PW - DAS ( γ ^ 3 PW - DAS - L 1 ), and using the proposed method with λ = 0.01. In order to avoid confusion, the location of the scatterers is indicated by the red arrows.
First, it can be seen that the proposed method converges to a stable solution where the five scatterers are correctly localized. In fact, the estimated TRF contains 63 nonzero coefficients located around the physical position of the scatterers, which is more than the five expected but still considerably lower than the 836 and 36,405 coefficients from γ ^ 3 PW - DAS - L 1 and γ ^ 3 PW - DAS . Due to the acquisition noise and the imperfect orthogonality of the sequences, an ideal solution of five nonzero coefficients cannot be reached experimentally. However, these results confirm that the proposed method can be applied experimentally, even with the complexity of the simultaneously emitted waveforms.
The spatial resolution FWHM from the central scatterer is compared between γ ^ 3 PW - DAS , γ ^ 3 PW - DAS - L 1 , and γ ^ SPW - FM - L 1 . In the axial direction, the measured spatial resolution FWHM is 25, 250, and 175 μ m for the proposed method γ ^ SPW - FM - L 1 , γ ^ 3 PW - DAS , and γ ^ 3 PW - DAS - L 1 . Thus, the axial resolution is improved 10-fold using γ ^ SPW - FM - L 1 rather than γ ^ 3 PW - DAS . In the lateral direction, the same trend is observed. The measured spatial resolution FWHM is 61, 367, and 250 μ m for the proposed method γ ^ SPW - FM - L 1 , γ ^ 3 PW - DAS , and γ ^ 3 PW - DAS - L 1 . These measurements clearly show that the proposed method outperforms conventional techniques on sparse mediums in terms of spatial resolution, while increasing the frame rate by 55.57%.

4. Conclusions

Here, we presented a general forward model that links the recorded RF data to the excitation signals, the geometric/acousto-electrical properties of the ultrasound probe, and the TRF. The general model was adapted to the concept of coherent PW compounding. To increase the frame acquisition rate, simultaneous coded emission of PWs was proposed, and the forward model was adapted accordingly. Three PWs were emitted simultaneously inside the medium to obtain an overdetermined forward model. The proposed excitation signals were a mix of three linear chirps. The maximal value of the cross-correlation/autocorrelation ratio obtained (between the excitation signals) did not exceed 14 dB. In addition, the proposed forward model accounts for the crosstalk noise, which was compensated for during the inversion of the forward model.
Simulation results on wire phantom showed that the ability to separate scatterers is improved axially and laterally with the proposed method. For the estimated TRF γ ^ SPW - FM - L 1 , scatterers axially spaced by more than 0.16 λ were separated, while DAS achieved a similar performance at 0.89 λ . In the lateral direction, the scatterers separated by more than 0.6 λ were separated using the proposed method, while for the same task, DAS-reconstructed TRF required more than 2 λ . Furthermore, the PCID was globally lower than −60 dB for the proposed method, while the best value for DAS was −31.6 dB. We also observed that the PSF inside the proposed TRF estimation was quasi-constant as a function of the scatterer depth and lateral position (unlike the DAS). Such improvements were obtained because the proposed model is not based on the classic DAS assumptions (a pulse as the excitation signal, an ultrasound probe of infinite bandwidth, far-field scatterings). In addition, we implemented the proposed method experimentally on an ultrasonic system and imaged a sparse medium composed of five wires in water. The spatial resolution was better than the one obtained with conventional DAS and DAS with 1 denoising ( γ ^ 3 PW - DAS and γ ^ 3 PW - DAS - L 1 ). This confirms that the model is accurate, even on real experimental data. However, since the model is based on free-field propagation within nonattenuating media, it may not be accurate for media with heterogeneous speed of sound and attenuation. In the proposed method, three planes waves were emitted simultaneously. More plane waves could be emitted simultaneously to increase the image quality and the frame rate. However, due to the crosstalk noise (Section 2.4), which can cause degradation in the image quality, it would require a higher number of orthogonal sequences.
The prospectivesof this work are the following. First, the performance of the method will be evaluated in sparse mediums containing microbubbles such as in ultrasound localization microscopy [57], and in phantoms mimicking blood vessels, where the gain in frame rate may be truly beneficial. Safety measures will be quantified with a view toward in vivo application of the technique. The feasibility of using a larger number of simultaneous plane waves will be studied. Finally, regularization techniques using deep learning (see, e.g., [58]) will be studied for TRF reconstruction.

Author Contributions

Conceptualization, D.B. and D.F.; methodology, D.B., H.L., D.F. and B.N.; software, F.N. and D.B.; validation, F.N., D.B., H.L. and B.N.; formal analysis, D.B.; investigation, F.N. and D.B.; data curation, F.N. and D.B.; writing—original draft preparation, all; writing—review and editing, all; visualization, F.N. and D.B.; supervision, E.C., H.L., D.F. and B.N.; project administration, E.C., H.L. and B.N.; funding acquisition, E.C., H.L., D.F. and B.N. All authors have read and agreed to the published version of the manuscript.

Funding

This research was funded by the LABEX PRIMES (ANR-11-LABX-0063) of Université de Lyon, within the program “Investissements d’Avenir” (ANR-11-IDEX-0007), by the ANR-19-LCV2-0004-01 LabCom Image4US and the LABEX CeLyA (ANR-10-LABX- 0060) of Université de Lyon, within the program “Investissements dAvenir” (ANR-16- IDEX-0005) operated by the French National Research Agency (ANR). We would like to thank the ANRT, for funding through the CIFRE grant 2019/1816.

Institutional Review Board Statement

Not applicable.

Informed Consent Statement

Not applicable.

Data Availability Statement

Codes will be made available upon request.

Acknowledgments

We would also like to acknowledge the useful exchange of ideas with Adrien Besson, Dimitris Perdios, and Jean-Philippe Thiran at the Signal Processing Laboratory (LTS5), Ecole Polytechnique Fédérale de Lausanne, Lausanne, Switzerland. This material is based upon work carried out at the PILoT facility (PILoT, INSA-Lyon).

Conflicts of Interest

The authors declare no conflict of interest.

Appendix A. Formulation of the Cji Matrix for Planar Transducers

In Equation (8), it can be seen that g j i can be replaced with a matrix product between an N y × N z N x matrix C j i and the vector γ . As each column m of the matrix C j i is related to a point in Ω through Equation (6), for each point r = (x,z), the entries along only column m of C j i will be modified, as follows: m will be null everywhere except at line τ that corresponds to time τ / f s = ( t t 0 ) f s / f s when the echo generated in r arrives at v i ( represents the nearest integer function). Ideally (if τ / f s = t t 0 ), the entry C j i [ τ , m ] will take the value given by the geometric spreading term 1 / ( 4 π 2 d u ( r ) d v ( r ) ) of the wave amplitude. However, as in most cases τ / f s t t 0 , we propose to extrapolate the term 1 / ( 4 π 2 d u j ( r ) d v i ( r ) ) into two entries of C j i [ τ , m ] , as follows:
C j i [ τ , m ] = v = 1 N u = 1 N C u j v i [ τ , m ] with : C u j v i [ τ , m ] = { α 4 π 2 d u j ( r ) d v i ( r ) , for τ = d u j ( r ) + d v i ( r ) c f s β 4 π 2 d u j ( r ) d v i ( r ) , for τ = d u j ( r ) + d v i ( r ) c f s 0 , elsewhere
where is the ceiling function. Linear interpolation, nearest-neighbor, and ceiling functions were compared. The lowest mean square error (compared to the reference using Field II) was achieved using the ceiling function. In Equation (A1), the extrapolation coefficients α and β are chosen in such a way as to minimize the echo discretization error, and they are computed using the following expression:
argmin ( α , β ) e ( t ) [ δ t d u j ( r ) + d v i ( r ) c α δ ( t τ ) + β δ ( t τ 1 f s ) ] 2

Appendix B. Establishment of the General Forward Model

To overcome some emission/reception artifacts, it is also possible to apply a spatial apodization function to the elements of the probe at emission/reception [59,60]. This consists of applying a weight w j on the excitation signal ( a j ( t ) ) for each element j, and a weight w i on the received signal at each element i. Let us consider that N el elements of the probe are active in emission. Under these conditions, the total signal y i ( t ) received by an element i can be approximated by the sum of the signals y j i ( t ) . We obtain:
y i ( t ) = w i h i ( t ) j = 1 N el w j h j ( t ) a j ( t ) δ ( t t j ) g j i ( t )
Assuming that the excitation signal is the same for all j ( a ( t ) = a j ( t ) , j ) and that the elements have the same IR h ( t ) in emission and reception, we can rewrite Equation (A3) as follows [61]:
y i ( t ) = w i e ( t ) g i ( t ) with : e ( t ) = a ( t ) h ( t ) h ( t ) g i ( t ) = j = 1 N el w j δ ( t t j ) g j i ( t )
As can be seen, the signal g i ( t ) depends on the emission tapering, emission delays, TRF, probe and medium geometry, and medium TRF. Using Equation (A1), the discrete expression of Equation (A4) becomes:
y i = w i E j = 1 N el w j C j i γ = w i E C i γ = Λ i γ with : C i = j = 1 N el w j C j i Λ i = w i E C i

Appendix C. Estimation of the Condition Number of Kernel Ψ

The condition number K Ψ of kernel Ψ can be deduced as follows. In Section 2.10, we showed that the filters f ( k ) ( t ) are adapted to quasi-orthogonal waveforms e ( k ) ( t ) . This means that f ( k ) ( t ) is also almost orthogonal and the resulting Toeplitz matrices F ( k ) verify ( F ( k ) ) T F ( k ) I , k { 1 . . N pw } where ( ) T is the transpose operator and I is the identity matrix. We can use the Gram matrix rank property to deduce the rank ϱ Ψ of the matrix Ψ :
ϱ Ψ = ϱ ( Ψ ) T Ψ
Using Equation (A3), we can deduce the analytical expression for the matrix product ( Ψ ) T Ψ :
( Ψ ) T Ψ = k = 1 N pw i = 1 N el ( Λ ̲ i ) T ( F ( k ) ) T F ( k ) Λ ̲ i k = 1 N pw ξ ( k ) i = 1 N el ( Λ ̲ i ) T Λ ̲ i Ξ k = 1 N pw ξ ( k ) with : ξ ( k ) = f ( k ) Ξ = i = 1 N el ( Λ ̲ i ) T Λ ̲ i
As ϱ Λ ̲ i N y , we can use the subadditivity property of the matrix rank to write:
ϱ Ξ i = 1 N el ϱ ( Λ ̲ i ) T Λ ̲ i N el N y
Combining Equations (A6)–(A8), we obtain:
ϱ Ψ ϱ Ξ N el N y
Given that the kernel Ψ is of size N pw N el ( N y + N f 1 ) × N x N z , the result of Equation (A9) means that Ψ is not full rank, which means by definition that its condition number K Ψ is very high (∼10 22 ).

References

  1. Tanter, M.; Fink, M. Ultrafast imaging in biomedical ultrasound. IEEE Trans. Ultrason. Ferroelectr. Freq. Control 2014, 61, 102–119. [Google Scholar] [CrossRef] [PubMed]
  2. Shattuck, D.P.; Weinshenker, M.D.; Smith, S.W.; von Ramm, O.T. Explososcan: A parallel processing technique for high speed ultrasound imaging with linear phased arrays. J. Acoust. Soc. Am. 1984, 75, 1273–1282. [Google Scholar] [CrossRef] [PubMed]
  3. Smith, S.W.; Pavy, H.G., Jr.; von Ramm, O.T. High-speed ultrasound volumetric imaging system. I. Transducer design and beam steering. IEEE Trans. Ultrason. Ferroelectr. Freq. Control 1991, 38, 100–108. [Google Scholar] [CrossRef]
  4. von Ramm, O.T.; Smith, S.W.; Pavy, H.G., Jr. High-speed ultrasound volumetric imaging system. II. Parallel processing and image display. IEEE Trans. Ultrason. Ferroelectr. Freq. Control 1991, 38, 109–115. [Google Scholar] [CrossRef] [PubMed]
  5. Badescu, E.; Garcia, D.; Joos, P.; Bernard, A.; Augeul, L.; Ferrera, R.; Viallon, M.; Petrusca, L.; Friboulet, D.; Liebgott, H. Comparison Between Multiline Transmission and Diverging Wave Imaging: Assessment of Image Quality and Motion Estimation Accuracy. IEEE Trans. Ultrason. Ferroelectr. Freq. Control 2019, 66, 1560–1572. [Google Scholar] [CrossRef] [Green Version]
  6. Johnson, S.A.; Greenleaf, J.F.; Duck, F.A.; Chu, A.; Samayou, W.R.; Gilbert, B.K. Digital computer simulation study of a real-time collections, post processing synthetic focusing ultrasound cardiac camera. Acoust. Hologr. 1975, 6, 193–211. [Google Scholar]
  7. Delannoy, B.; Torgue, R.; Bruneel, C.; Bridou, E. Ultrafast electronical image reconstruction device. In Echocardiology; Springer: Dordrecht, Germany, 1979; Volume 1. [Google Scholar]
  8. Delannoy, B.; Torgue, R.; Bruneel, C.; Bridoux, E.; Rouvaen, J.M. Acoustical image reconstruction in parallel-processing analog electronic systems. J. Appl. Phys. 1979, 50, 3153–3159. [Google Scholar] [CrossRef]
  9. Lockwood, G.R.; Talman, J.R.; Brunke, S.S. Real-time 3D ultrasound imaging using sparse synthetic aperture beamforming. IEEE Trans. Ultrason. Ferroelectr. Freq. Control 1998, 45, 980–988. [Google Scholar] [CrossRef]
  10. Hazard, C.R.; Lockwood, G.R. Theoretical assessment of a synthetic aperture beamformer for real-time 3-D imaging. IEEE Trans. Ultrason. Ferroelectr. Freq. Control 1999, 46, 972–980. [Google Scholar] [CrossRef]
  11. Nikolov, S.I.; Jensen, J.A. In-vivo synthetic aperture flow imaging in medical ultrasound. IEEE Trans. Ultrason. Ferroelectr. Freq. Control 2003, 50, 848–856. [Google Scholar] [CrossRef] [Green Version]
  12. Udesen, J.; Gran, F.; Hansen, K.L.; Jensen, J.A.; Thomsen, C.; Nielsen, M.B. High frame-rate blood vector velocity imaging using plane waves: Simulations and preliminary experiments. IEEE Trans. Ultrason. Ferroelectr. Freq. Control 2008, 55, 1729–1743. [Google Scholar] [CrossRef] [PubMed]
  13. Sandrin, L.; Catheline, S.; Tanter, M.; Hennequin, X.; Fink, M. Time-resolved pulsed elastography with ultrafast ultrasonic imaging. Ultrason. Imaging 1999, 21, 259–272. [Google Scholar] [CrossRef] [PubMed]
  14. Sandrin, L.; Tanter, M.; Catheline, S.; Fink, M. Shear modulus imaging with 2-D transient elastography. IEEE Trans. Ultrason. Ferroelectr. Freq. Control 2002, 49, 426–435. [Google Scholar] [CrossRef] [PubMed]
  15. Hasegawa, H.; Kanai, H. High-frame-rate echocardiography using diverging transmit beams and parallel receive beamforming. J. Med. Ultrason. 2011, 38, 129–140. [Google Scholar] [CrossRef] [PubMed]
  16. Nikolov, S.I. Synthetic Aperture Tissue and Flow Ultrasound Imaging. Ph.D. Thesis, Department of Biomedical Engineering, Ørsted-DTU, Technical University of Denmark, Lyngby, Denmark, 2001. [Google Scholar]
  17. Tanter, M.; Bercoff, J.; Sandrin, L.; Fink, M. Ultrafast compound imaging for 2-D motion vector estimation: Application to transient elastography. IEEE Trans. Ultrason. Ferroelectr. Freq. Control 2002, 49, 1363–1374. [Google Scholar] [CrossRef]
  18. Montaldo, G.; Tanter, M.; Bercoff, J.; Benech, N.; Fink, M. Coherent plane-wave compounding for very high frame rate ultraso nography and transient elastography. IEEE Trans. Ultrason. Ferroelectr. Freq. Control 2009, 56, 489–506. [Google Scholar] [CrossRef]
  19. Papadacci, C.; Pernot, M.; Couade, M.; Fink, M.; Tanter, M. High-contrast ultrafast imaging of the heart. IEEE Trans. Ultrason. Ferroelectr. Freq. Control 2014, 61, 288–301. [Google Scholar] [CrossRef] [Green Version]
  20. Liebgott, H.; Rodriguez-Molares, A.; Jensen, J.A.; Bernard, O. Plane-Wave Imaging Challenge in Medical Ultrasound. In Proceedings of the IEEE International Ultrasonics Symposium (IUS), Tours, France, 18–21 September 2016. [Google Scholar]
  21. Miwa, H.; Hayashi, H.; Shimura, T.; Murakami, K. Simultaneous multifrequency ultrasonography the principle and technology. In Proceedings of the IEEE International Ultrasonics Symposium (IUS), Chicago, IL, USA, 14–16 October 1981. [Google Scholar]
  22. O’Donnell, M. Coded excitation system for improving the penetration of real-time phased-array imaging systems. IEEE Trans. Ultrason. Ferroelectr. Freq. Control 1992, 39, 341–351. [Google Scholar] [CrossRef]
  23. Haider, B.; Lewin, P.A.; Thomenius, K.E. Pulse elongation and deconvolution filtering for medical ultrasonic imaging. IEEE Trans. Ultrason. Ferroelectr. Freq. Control 1998, 45, 98–113. [Google Scholar] [CrossRef]
  24. Misaridis, T.; Jensen, J.A. Use of modulated excitation signals in medical ultrasound. Part I: Concepts and expected benefits. IEEE Trans. Ultrason. Ferroelectr. Freq. Control 2005, 52, 177–191. [Google Scholar] [CrossRef]
  25. Shen, J.; Ebbini, E.S. A new coded-excitation ultrasound imaging system. I. Basic principles. IEEE Trans. Ultrason. Ferroelectr. Freq. Control 1996, 43, 131140. [Google Scholar] [CrossRef]
  26. Misaridis, T.; Jensen, J.A. Space-time encoding for high frame rate ultrasound imaging. Ultrasonics 2002, 40, 593–597. [Google Scholar] [CrossRef] [PubMed]
  27. Hernández, A.; Urena, J.; Garcia, J.J.; Mazo, M.; Hernanz, D.; Derutin, J.P.; Sérot, J. Ultrasonic ranging sensor using simultaneous emissions from different transducers. IEEE Trans. Ultrason. Ferroelectr. Freq. Control 2004, 51, 1660–1670. [Google Scholar] [CrossRef] [PubMed]
  28. Misaridis, T.; Fink, M.; Jensen, J.A. Complex pulsing schemes for high frame rate imaging. In Proceedings of the IEEE IUS, Munich, Germany, 8–11 October 2002. [Google Scholar]
  29. Gran, F.; Jensen, J.A. Spatio-temporal encoding using narrow-band linearly frequency modulated signals in synthetic aperture ultrasound imaging. In Proceedings of the Medical Imaging 2005: Ultrasonic Imaging and Signal Processing, San Diego, CA, USA, 12–17 February 2005; pp. 405–416. [Google Scholar]
  30. Gran, F.; Jensen, J.A. Spatial encoding using a code division technique for fast ultrasound imaging. IEEE Trans. Ultrason. Ferroelectr. Freq. Control 2008, 55, 12–23. [Google Scholar] [CrossRef] [Green Version]
  31. Bujoreanu, D.; Liebgott, H.; Nicolas, B. Simultaneous coded plane wave imaging in ultrasound: Problem formulation and constraints. In Proceedings of the IEEE ICASSP, New Orleans, LA, USA, 5–9 March 2017. [Google Scholar]
  32. Bujoreanu, D.; Bernard, A.; Nicolas, B.; Liebgott, H.; Friboulet, D. Simultaneous coded plane wave imaging: Implementation on a research echograph. In Proceedings of the IEEE IUS, Washington, DC, USA, 6–9 September 2017. [Google Scholar]
  33. David, G.; Robert, J.-L.; Zhang, B.; Laine, A.F. Time domain compressive beam forming of ultrasound signals. J. Acoust. Soc. Am. 2015, 137, 2773–2784. [Google Scholar] [CrossRef] [Green Version]
  34. Zhang, B.; Robert, J.-L.; David, G. Dual-domain compressed beamforming for medical ultrasound imaging. In Proceedings of the 2015 IEEE International Ultrasonics Symposium (IUS), Taipei, Taiwan, 21–24 October 2015. [Google Scholar]
  35. Besson, A.; Carrillo, R.E.; Bernard, O.; Wiaux, Y.; Thiran, J.P. Compressed delay-and-sum beamforming for ultrafast ultrasound imaging. In Proceedings of the 2016 IEEE International Conference on Image Processing (ICIP), Phoenix, AZ, USA, 25–28 September 2016. [Google Scholar]
  36. Besson, A.; Perdios, D.; Martinez, F.; Chen, Z.; Carrillo, R.E.; Arditi, M.; Thiran, J.P. Ultrafast ultrasound imaging as an inverse problem: Matrix-free sparse image reconstruction. IEEE Trans. Ultrason. Ferroelectr. Freq. Control 2017, 65, 339–355. [Google Scholar] [CrossRef] [Green Version]
  37. Besson, A.G.J.; Roquette, L.; Perdios, D.; Arditi, M.; Hurley, P.; Wiaux, Y.; Thiran, J.P. Fast Non-stationary Deconvolution in Ultrasound Imaging. IEEE Trans. Comput. Imaging 2018, 7, 935–947. [Google Scholar]
  38. Jensen, J.A.; Svendsen, N.B. Calculation of pressure fields from arbitrarily shaped, apodized, and excited ultrasound transducers. IEEE Trans. Ultrason. Ferroelectr. Freq. Control 1992, 39, 262–267. [Google Scholar] [CrossRef] [Green Version]
  39. PMorse, M.; Ingard, K.U. Theoretical Acoustics; Princeton University Press: Princeton, NJ, USA, 1968. [Google Scholar]
  40. Stepanishen, P.R. Pulsed transmit/receive response of ultrasonic piezoelectric transducers. J. Acoust. Soc. Am. 1981, 69, 1815–1827. [Google Scholar] [CrossRef]
  41. Jensen, J.R.A. A model for the propagation and scattering of ultrasound in tissue. J. Acoust. Soc. Am. 1991, 89, 182–190. [Google Scholar] [CrossRef] [Green Version]
  42. Tupholme, G.E. Generation of acoustic pulses by baffled plane pistons. Mathematika 1969, 16, 209–224. [Google Scholar] [CrossRef]
  43. Porée, J.; Posada, D.; Hodzic, A.; Tournoux, F.; Cloutier, G.; Garcia, D. High-Frame-Rate Echocardiography Using Coherent Compounding With Doppler-Based Motion-Compensation. IEEE Trans. Med. Imaging 2016, 35, 1647–1657. [Google Scholar] [CrossRef] [PubMed]
  44. Idier, J.; Demoment, G. Main Approaches to the Regularization of Ill-posed Problems. In Bayesian Approach to Inverse Problems; John Wiley and Sons: Hoboken, NJ, USA, 2008; pp. 41–58. [Google Scholar]
  45. Byram, B.; Dei, K.; Tierney, J.; Dumont, D. A model and regularization scheme for ultrasonic beamforming clutter reduction. IEEE Trans. Ultrason. Ferroelectr. Freq. Control 2015, 62, 1913–1927. [Google Scholar] [CrossRef] [PubMed] [Green Version]
  46. Beck, A.; Teboulle, M. A fast iterative shrinkage-thresholding algorithm for linear inverse problems. SIAM J. Imaging Sci. 2009, 2, 183–202. [Google Scholar] [CrossRef] [Green Version]
  47. Jensen, J.A. Field: A Program for Simulating Ultrasound Systems. Med. Biol. Eng. Comput. 1996, 34 (Suppl. S1), 351–353. [Google Scholar]
  48. Fan, C.; Caleap, M.; Pan, M.; Drinkwater, B.W. A comparison between ultrasonic array beamforming and super resolution imaging algorithms for non-destructive evaluation. Ultrasonics 2014, 54, 1842–1850. [Google Scholar] [CrossRef] [Green Version]
  49. Laroche, N.; Bourguignon, S.; Carcreff, E.; Idier, J.; Duclos, A. An inverse approach for ultrasonic imaging from full matrix capture data: Application to resolution enhancement in NDT. IEEE Trans. Ultrason. Ferroelectr. Freq. Control 2020, 67, 1877. [Google Scholar] [CrossRef]
  50. Jensen, J.; Stuart, M.B.; Jensen, J.A. Optimized Plane Wave Imaging for Fast and High-Quality Ultrasound Imaging. IEEE Trans. Ultrason. Ferroelectr. Freq. Control 2016, 63, 1922–1934. [Google Scholar] [CrossRef]
  51. Widrow, B.; Glover, J.R.; McCool, J.M.; Kaunitz, J.; Williams, C.S.; Hearn, R.H.; Zeidler, J.R.; Dong, E., Jr.; Goodlin, R.C. Adaptive noise cancelling: Principles and applications. Proc. IEEE 1975, 63, 1692–1716. [Google Scholar] [CrossRef]
  52. Nowicki, A.; Trots, I.; Lewin, P.A.; Tymkiewicz, R. Influence of the ultrasound transducer bandwidth on selection of the complementary Golay bit code length. Ultrasonics 2007, 47, 64–73. [Google Scholar] [CrossRef]
  53. Trots, I.; Nowicki, A.; Secomski, W.; Litniewski, J. Golay sequences-side-lobe-canceling codes for ultrasonography. Arch. Acoust. 2004, 29, 87–97. [Google Scholar]
  54. Oelze, M.L. Bandwidth and resolution enhancement through pulse compression. IEEE Trans. Ultrason. Ferroelectr. Freq. Control 2007, 54, 768–781. [Google Scholar] [CrossRef] [PubMed]
  55. Benane, Y.M.; Bujoreanu, D.; Lavarello, R.; Varray, F.; Escoffre, J.M.; Novell, A.; Cachard, C.; Basset, O. Experimental Implementation of a Pulse Compression Technique using Coherent Plane Wave Compounding. IEEE Trans. Ultrason. Ferroelectr. Freq. Control 2018, 65, 1025–1036. [Google Scholar] [CrossRef] [PubMed]
  56. Benane, Y.M.; Lavarello, R.; Bujoreanu, D.; Cachard, C.; Varray, F.; Basset, O. Ultrasound bandwidth enhancement through pulse compression using a CMUT probe. In Proceedings of the 2017 IEEE International Ultrasonics Symposium (IUS), Washington, DC, USA, 6–9 September 2017. [Google Scholar]
  57. Errico, C.; Pierre, J.; Pezet, S.; Desailly, Y.; Lenkei, Z.; Couture, O.; Tanter, M. Ultrafast ultrasound localization microscopy for deep super-resolution vascular imaging. Nature 2015, 527, 499–502. [Google Scholar] [CrossRef] [PubMed]
  58. Ongie, G.; Jalal, A.; Metzler, C.A.; Baraniuk, R.G.; Dimakis, A.G.; Willett, R. Deep Learning Techniques for Inverse Problems in Imaging. IEEE J. Sel. Areas Inf. Theory 2020, 1, 39–56. [Google Scholar] [CrossRef]
  59. Holfort, I.K.; Gran, F.; Jensen, J.A. Broadband minimum variance beamforming for ultrasound imaging. IEEE Trans. Ultrason. Ferroelectr. Freq. Control 2009, 56, 314–325. [Google Scholar] [CrossRef] [Green Version]
  60. Briguet, A.; Fanet, H.; Sappey-Marinier, D.; Vray, D. Imagerie Médicale à Base de Champs Magnétiques et D’ultrasons. 2014. Available online: https://hal.archives-ouvertes.fr/hal-00976650/ (accessed on 1 September 2022).
  61. Carcreff, E.; Bourguignon, S.; Idier, J.; Simon, L. A linear model approach for ultrasonic inverse problems with attenuation and dispersion. IEEE Trans. Ultrason. Ferroelectr. Freq. Control 2014, 61, 1191–1203. [Google Scholar] [CrossRef]
Figure 1. a—Schematic representation of the proposed imaging approach. γ —tissue reflectivity function; δ ( k ) —short electrical excitation of the k t h wave; g ( k ) —received echoes that correspond to the emission of δ ( k ) ( k t h wave); a ( k ) —code carried by the k t h wave; y ( k ) —received echoes after emission of a ( k ) ; y —recorded echoes when N pw plane waves are emitted simultaneously; f ( k ) —optimal compression filter that corresponds to the k t h wave; and g ^ ( k ) —estimation of g ( k ) obtained from y . Finally, an estimation γ ^ of the tissue reflectivity function γ is obtained by solving the inverse problem.
Applsci 12 12809 g001
Figure 2. (a) Schematic representation of the ultrasound wave emitter j, receiver i, and the associated coordinate system. (b) Proposed discretization for the transducers and propagation medium Ω . The surfaces S j and S i are divided into N subdivisions.
Applsci 12 12809 g002
Figure 3. Studied mediums. (a) Simulated position of the scatterers inside the wire phantom. (b) Physical position of the scatterers inside the water tank.
Applsci 12 12809 g003
Figure 4. (ac) Examples of three orthogonal e ( k ) ( t ) signals. This set of waveforms contains an ‘up’ chirp, a ‘down’ chirp, and a ‘up−down’ chirp. (df) Corresponding excitations a ( k ) ( t ) are used to drive a transducer of IR h ( t ) .
Applsci 12 12809 g004
Figure 5. (ac) Results of compression of the waveforms e 1 ( t ) , e 2 ( t ) , and e 3 ( t ) using the filters f 1 ( t ) , f 2 ( t ) , and f 3 ( t ) , respectively. (df) Crosstalk noise (realization of ζ r 1 ( t ) , ζ r 2 ( t ) , ζ r 3 ( t ) in Equation (20)) generated during the compression of the waveforms e 1 ( t ) , e 2 ( t ) , and e 3 ( t ) , respectively.
Applsci 12 12809 g005
Figure 6. Estimation of the TRF on simulated wire phantom. (a) Estimated using successive PW acquisitions with DAS algorithm ( γ ^ 3 PW - DAS ). (b) Estimated using 1 denoising on γ ^ 3 PW - DAS with λ = 0.5 ( γ ^ 3 PW - DAS - L 1 ). (c) Estimated using DAS and coherent compounding of the compressed echoes g ^ ( k ) after simultaneous PW excitation ( γ ^ SPW - DAS ). (d) Estimated using 1 denoising on γ ^ SPW - DAS with λ = 0.5 ( γ ^ SPW - DAS - L 1 ). (e) Estimated using the proposed method with simultaneous PW excitations ( γ ^ SPW - FM - L 1 ).
Applsci 12 12809 g006
Figure 7. PCID measured on all reconsructed images. (a) Axial direction. (b) Lateral direction. The successive acquisitions (3PW), γ ^ 3 PW - DAS and γ ^ 3 PW - DAS - L 1 , are displayed in green (solid line and dash-dotted line, diamonds). The simultaneous acquisitions, γ ^ SPW - DAS , γ ^ SPW - DAS - L 1 , and γ ^ SPW - FM - L 1 , are displayed as follows: γ ^ SPW - DAS is displayed in red, dotted line, circle; γ ^ SPW - DAS - L 1 is displayed in pink, dash-dotted line, circle; the proposed method γ ^ SPW - DAS is displayed in blue, dash−dotted line, square. For the sake of clarity, the values of the peak−to−center intensity differences lower than this limit are shown at −60 dB.
Applsci 12 12809 g007
Figure 8. Estimation of the wires TRF. (a) Estimated using the delay and sum algorithm ( γ ^ 3 PW - DAS ). (b) Estimated using 1 denoising on γ ^ 3 PW - DAS . (c) Estimated using the proposed approach ( γ ^ SPW - FM - L 1 ). The physical location of the scatterers is indicated by the red arrows. It can be seen that for parts a and b, an additional step of envelope detection is applied before log−compression.
Applsci 12 12809 g008
Table 1. Image quality metrics evaluated on the simulated wire phantom.
Metric γ ^ 3 PW DAS γ ^ 3 PW DAS L 1 γ ^ SPW DAS γ ^ SPW DAS L 1 γ ^ SPW FM l 1
Ax . res WHM192.5 μ m87.4 μ m244 μ m98.8 μ m25 μ m
Lat . res WHM455 μ m177.8 μ m551.25 μ m245 μ m61.25 μ m
Publisher’s Note: MDPI stays neutral with regard to jurisdictional claims in published maps and institutional affiliations.