Abstract
The enlarged head pressure-dispersed anchor cable is a new type of anchor cable, and the enlarged head of the anchor solid is a multisegment body with variable cross section. Compared with the traditional tension type anchor cable structure, the stress mode of the anchor solid is changed from tensile stress to compressive stress, which is more reasonable. The development process of the plastic zone of the soil around the enlarged head anchor solid is verified by a simulation method. The spherical plastic zone space formed at the enlarged head anchorage end is conducive to the load transfer between the anchor solid and the surrounding soil and reduces the displacement of the anchor solid in the soil. In this pursuit, the present study examines the force mechanism of the enlarged head pressure-dispersed anchor cable. Subsequently, taking an actual project as an example, the anchoring capacity of the enlarged head pressure-dispersed anchor cable and enlarged head tension-type anchor cable was analyzed and compared using FLAC3D software. The results indicate that the support effect of the enlarged head pressure-dispersed anchor cable was better than that of the enlarged head tension anchor cable.
1. Introduction
During construction of foundation pits, the unpredictability of the seepage and deep environment increases the difficulty of rock–soil anchoring technology. At present, the tension anchor cable is widely used in foundation pit engineering. During the application process, the grout–soil interface gradually exhibits a “debonding”, blindly improving the anchoring length, which not only occupies the outer space of the property line, but also makes the anchoring effect less obvious. At present, many scholars have made remarkable achievements in research on tension anchor cables.
In terms of engineering tests and indoor model test research, Zeng et al. [1] put forward the concept of “end pressure inflection point”. Through the analysis of several engineering examples, it was concluded that the buried depth of the anchor solid, cohesion of the soil body, and internal friction angle were the main factors affecting end resistance. In the tension test of the tension-type enlarged head anchor cable, Cao et al. [2] found that the displacement of the anchor cable determined the degree of exertion of the lateral resistance through the study of anchor failure. Robert Y. Liang et al. [3] studied the mechanism and phenomena of the interaction of the anchor soil and showed that the shear-induced soil dilation was the main factor leading to increased friction at the interface of the anchor soil. Tao et al. [4] found that “constant resistance” and “elongation” are the two most important indicators to evaluate the performance of anchor cables. Liu et al. [5] found in a field experiment that soil mass at the front end of a pressure type anchor cable with enlarged head provides important uplift resistance. In terms of anchor tensioning, Su et al. [6] found that the tensioning sequence of anchors can follow the principle of a certain distance between tensions in reducing the loss of axial force of anchors. Dong et al. [7] optimized the calculation method of the geotechnical model and evaluated this method through minislump test.
Using numerical simulation research, Ren et al. [8] solved the stress characteristics of the enlarged head anchor rod under different structural parameters and deformation of the surrounding soil layer and its influence on the vertical displacement of the anchor rod using the finite element analysis software ABAQUS. It was observed that the length of anchorage section increased, and its horizontal displacement decreased gradually, which then tends to be stable. Increasing the diameter of the anchor section reduced the degree of deformation of the surrounding soil layer, and the axial force of the anchor rod decreases slowly. Zhang [9] investigated the anchoring mechanism and found that the axial value of the anchor solid was large at the top, and the force decayed rapidly along with the depth of the anchor cable. In addition, the shear stress curve showed an exponential function distribution along with the interface of the anchor solid. Shan et al. [10] proposed a new type of support structure that could withstand the transverse shear force. The numerical results showed that the surface displacement was reduced by at least 20%, and the equilibrium time was shortened compared with the original scheme. Li et al. [11] studied the transverse shear force of the anchor cable. The numerical results showed that there were two boundary anchor lengths in the shear test of the anchor cable. Yu [12] simulated the foundation pit excavation of the anchor pile support structure and studied the shear stress distribution law of the grout interface in the tension-dispersed anchor cable. The results showed that the peak shear stress of the anchor cable was about 1.5 times that of the tension-dispersed anchor cable. Kim [13] proposed a finite element calculation model for the ground anchor and compared the numerical prediction with the observed measurements. The simulated values of the ground anchor load transfer mechanism provided a reasonable prediction for the project. Dong et al. [14] studied the fluid–structure coupling effect in the simulation of the deep foundation pit and found that the settlement displacement of the fluid–structure coupling model was larger than that of the nonfluid–structure coupling model. Through experiment and simulation, Liu et al. [15] found that the anchorage section of pressure-dispersed anchor cable is mainly compressed, and the maximum compressive stress occurs at the embedded plate. Wang et al. [16] deduced the calculation formula of ultimate pullout force suitable for the enlarged head anchor cable, which solved the problem of the high precision requirement of the parameter value in the standard method. Fan et al. [17] proposed a geotechnical framework, which can further analyze the internal stress of soil.
The anchor solids of a tension anchor cable are easily destroyed due to the stress concentration inside the anchor solids, but the pressure-dispersed anchor cables disperse the total tension load to each anchor cable element and transfer the tension of the anchor cable into the pressure of the anchor solid of the anchor cable element to the soil mass [18]. Additionally, the stress is more reasonable, and the non-sticky anchor cable is easy to recover [19]. Yao found that pressure-dispersed anchor cable has a better anti-vibration ability than the tension-concentrated anchor cable [20]. Therefore, in recent years, there has been a huge surge in research on pressure-dispersed anchor cables. According to the stress distribution characteristics of pressure dispersive ground anchors, Liang et al. [21] developed a new type of bottom-expanding construction equipment, thus expanding the effective diameter of the anchor body and improving the anchoring capacity and saving project costs. Zhang et al. [22] carried out performance tests on the pressure-dispersed compression anchors in clay. Field tests and calculations showed that post-grouting increased the diameter of effective anchors and improved pull-out resistance of anchors. Li [23] carried out numerical simulation research on the new pressure anchor cables and observed that the distribution of axial stress and shear stress of the anchor solid was reasonable, which overcame the transmission defects of the traditional anchor cables.
Summarizing the above research results, we can see that the current research on the anchor cable mainly focuses on three aspects. One is to focus on the internal forces, such as the shearing stress of the grout–soil interface and the axial stress of the anchor solid, while there is relatively little research on the end resistance at variable sections. The stress of the anchor cable is shown in Figure 1. Second, the study on the enlarged head anchor cable is mainly focused on the tension-type rather than the pressure-dispersed type. Third, with respect to foundation pit support, there are few studies considering the fluid–structure coupling, but the influence of seepage on the foundation pit support cannot be ignored. Therefore, using engineering examples along with the FLAC3D numerical simulation, the force mechanism of the enlarged head tension-type and pressure-dispersed type anchor cables and the support effect of the two types of anchor cables are compared and analyzed in the present study. Enlarged head anchor cable is a kind of anchor cable commonly used in foundation engineering. First, an anchor drilling rig is used to drill a hole. After the drilling is expected to be completed, high pressure jet grouting is inserted at the end of the anchorage to expand the hole to 6 m. The length of the hole is 6 m. Then, the prefabricated steel strand and steel casing are inserted. Finally, the grouting is divided two times until it flows out of the cement slurry.
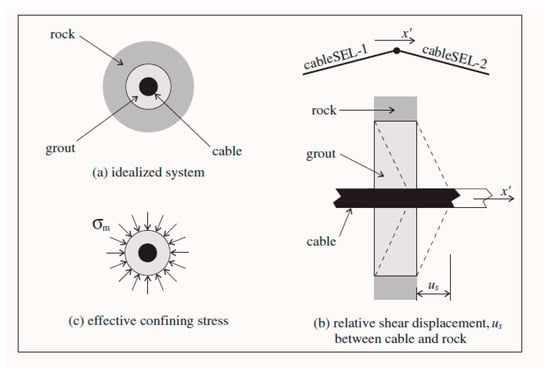
Figure 1.
Stress of the anchor cable.
2. Analysis of the Force Mechanism
2.1. Composition of the Support System
The support system of the enlarged head pressure-dispersed anchor cable mainly consists of the support pile, the steel strand, and the enlarged head anchor solid. The difference from the traditional tension anchor cable is that the anchor solid disperses the tension to the different sections through the embedded plate, and the anchor solid bears pressure. This support system has the advantages of small displacement and high bearing capacity. The anchor solid bears the compressive stress and overcomes the defect of low tensile strength of the anchor solids. The pile–anchor support structure is shown in Figure 2. In the figure, is the pressure on the anchor solid after the embedded plate is pulled by the anchor cable.
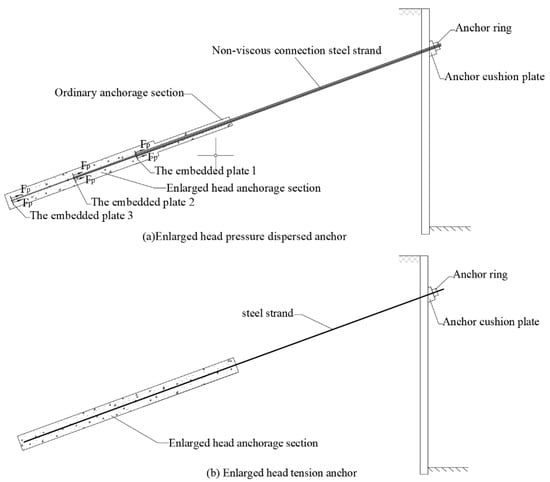
Figure 2.
Pile–anchor supporting structure.
2.2. Internal Force Analysis of the Anchor Cable
Due to the particularity of the geometric size of the enlarged head pressure-dispersed anchor cable and the dispersion of the transmission path, the shear stress around the anchor cable exhibits different distribution forms with the increase in the pull-out resistance. The discussion is divided into three stages according to the displacement of the anchor cable and the distribution of shear stress.
- (1)
- Static earth pressure stage: In the initial stage of axial force growth at the anchor head and the anchor cable, there is only a relative displacement trend between the anchor solid and the soil, i.e., only the static friction force around anchor solid. It is pointed out in the relevant literature [24,25] that the generation of passive earth pressure requires a certain amount of displacement, while the displacement of the anchor solids at this stage is very small. Therefore, the extrusion of enlarged head anchor solids by the soil in front of the end is the static earth pressure. Due to the small displacement of the anchor cable in this stage, the pull-out bearing capacity is mainly provided by the side friction of the ordinary anchorage section and the enlarged head anchorage section.
- (2)
- Transition stage: As the load continues to increase, the interface will plastically yield when the stress state at the interface between the anchor solid and the soil interface reaches the shear strength. We continue to increase the tension of the anchor cable. Due to the insufficient shear strength of the soil mass, the soil mass around the anchor solid is damaged and connected. The enlarged head anchorage section and ordinary anchorage section have obvious displacement. The pressure of the soil mass on the end face of the enlarged head gradually increases, and the soil mass in front of the enlarged head end forms a plastic zone in the local set. A further increase in the axial tension of the anchor cable leads to the compaction in the soil at the front of the variable section, gradually forming a plastic sphere space. At this moment, the end pressure resistance becomes an important part of the bearing capacity, and the displacement growth rate in this stage is larger than that in the previous stage. Since the compression of the soil mass at the front of the enlarged head anchor cable is a progressive developmental process, the increase in the pull-out force at this stage is nonlinear. The displacement of the variable sections results in the extrusion of the front-end soil mass, which directly increases the end resistance. The soil mass at the front of the variable section is compressed all around, resulting in the compression of the soil mass at the front of a variable section and confined by the further soil mass and anchor solid.
- (3)
- Plastic development stage of soils in front of the end: With an increase in the tension, an obvious “end-pressing inflection point” appears on the tension F (the sum of axial force on the anchor head and anchor cable)-displacement S (the front end of the anchor solid) curve. Subsequently, the soil mass in the plastic zone becomes further compressed by the enlarged head and the surrounding soil mass, as shown in Figure 3. When the anchor cable is subject to tension F and produces displacement or deformation, the variable section of the enlarged head anchor cable will produce end resistance σ1, and shear stress τf will be generated between the soil and the anchor cable. The soil mass in the plastic zone is further squeezed by the enlarged head and the surrounding soil mass and further enhances the pressure σ2 of the soil mass on the enlarged head. The sliding surface of the soil mass in the front of the enlarged head no longer occurs along the grout–soil interface but moves outwards. Soil in the plastic zone undergoes a plastic expansion and internal force rebalancing at the same time. This process is similar to the plastic zone expansion before the shear failure of a foundation under vertical pressure. Soil in the plastic zone becomes compact under the confining pressure, which is essentially a process of increasing the “stiffness” of the plastic zone. As the surface area of the plastic zone increases, the soil provides a wider range of resistance. In order to achieve the mechanical balance of the anchor cable, the internal force of the soil is transferred directly to the front of the enlarged head through the plastic zone with increased rigidity. In addition, the compression modulus of the soil and the position of the interlayer in the soil also directly affect the expansion of the plastic zone and the magnitude of the end pressure.
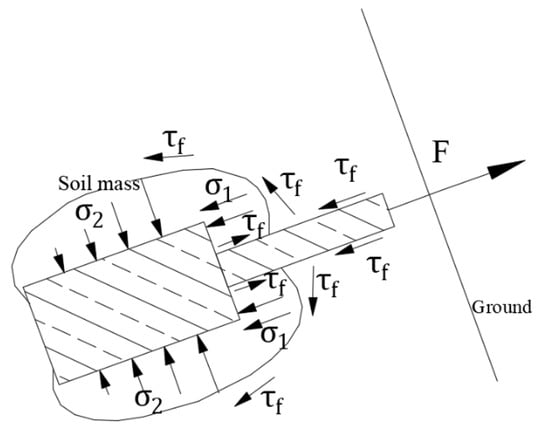 Figure 3. Strengthening effect model of the end resistance to side resistance.
2.3. End Resistance of the Enlarged Head Pressure-Dispersed Anchor Cable
Through numerical simulation, the stress mechanism of the anchor cable was further explored. The free section of the anchor cable was 8 m, and the anchorage section was 9 m. The ordinary anchorage section was 350 mm in diameter and 3 m in length, and the enlarged head anchorage section was 600 mm in diameter and 6 m in length. The embedded plate had a diameter of 340 mm and was located at y = 0 m, y = 12 m, y = 14.5 m, and y = 17 m, respectively. Model size was 5 m × 5 m × 18 m. The geometry of the model is shown in Figure 4, the enlarged head pressure-dispersed anchor cable sample diagram is shown in Figure 5, and the material parameters are shown in Table 1.

Figure 4.
Quarter grid model.

Figure 5.
The enlarged head pressure-dispersed anchor cable sample diagram.

Table 1.
Material parameters.
During the experiment, the pulling force was equally divided into six anchor cables. At 50 kN intervals, the pull-out resistance increased from 300 kN to 900 kN. Figure 6 shows the relationship curves of tension, side resistance, and the end resistance and displacement. It can be seen from Figure 6 that the maximum end resistance of the anchor cable reached 26.27% of the total tension. The side resistance before point A was generated by the relative displacement trend of the static friction force and after point A was mainly supplied by the sliding friction force. Point A to Point B is the process in which the plastic penetration at the grout–soil interface to the end resistance begins to play a leading role. After Point B, as the displacement of the anchor cable continued to increase, the end resistance accounts for more than 25% of the pull-out force. The end resistance at the variable section of the anchor cable becomes more and more important. Compared with the curve after Point B, the curve from Point A to Point B has some changes, and the slope decreases. When it approaches Point B, the curve tends to be smooth. Therefore, the “end-pressing inflection point” was near Point B. The remarkable feature was that on the tension-displacement curve, after the inflection point, the slope decreases, and the curve tends to be smooth. At this time, the displacement value was 15 mm, the end pressure reached the displacement required for the function, and the anchor solid slipped significantly. Moreover, the front end formed a large plastic sphere space, which was not suitable for carrying.
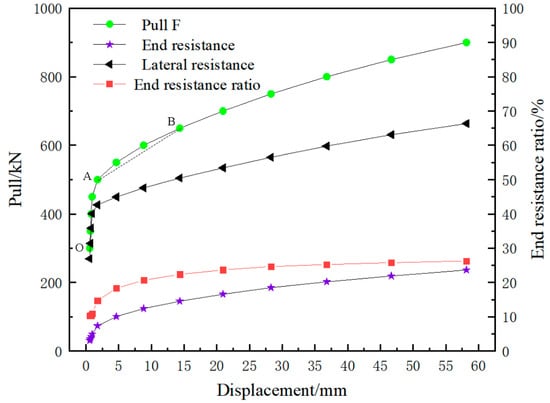
Figure 6.
Relation curve of tension, side resistance, end resistance, and displacement.
With the continuous increase of displacement at the variable section of the anchor cable, the soil at the front end of the anchor solid is further compacted, the plastic zone of the soil at the front end of the anchor cable is further expanded, and the soil enters a deeper level of plastic expansion and redistribution of internal forces. In the case of small displacement, the development process of shear stress at the grout–soil interface of local shear failure to full interface penetration is shown in Figure 7. Before the plastic connection of the grout–soil interface, the displacement of the anchor solid is relatively small, and the shear stress of the grout–soil interface increases first and then decreases near the variable section y = 3 m, which is caused by the breaking of the original balance of the soil particles and the plastic failure of a small part of the “soil in front of the end”. With the increase in tension, the grout–soil interface undergoes elastic deformation. The displacement of the ordinary anchorage section drives the “soil in front of the end”. At the same time, the soil at the front of the variable section is squeezed by the vertical variable section, which weakens the relative displacement trend, and the shear stress decreases sharply. When F = 500 kN, the plastic zone of the anchor cable has been connected. The contour diagram of the shear stress state is shown in Figure 8. Before and after the plastic zone of the anchor cable is connected and the distribution of the plastic zone is shown in Figure 9. When the anchor cable is increased from 450 kN to 500 kN, the displacement increment at each position of the anchor solid is greatly increased, which is mainly caused by the penetration of the plastic zone. The displacement contour diagram when the plastic zone is connected is shown in Figure 10. Generally, the OA section is considered to be the main section for anchor cable utilization. Although Point A can provide greater uplift resistance, the displacement of the anchor cable will also increase rapidly with the increase of uplift resistance. For foundation pit support, the lateral displacement of the pit wall should not be too large.
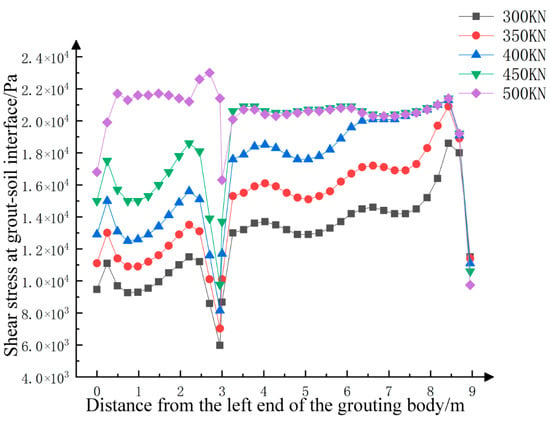
Figure 7.
Shear stress variation of anchor cable during plastic penetration.

Figure 8.
Distribution of shear stress at the grout–soil interface when the plastic zone of the anchor cable is connected.
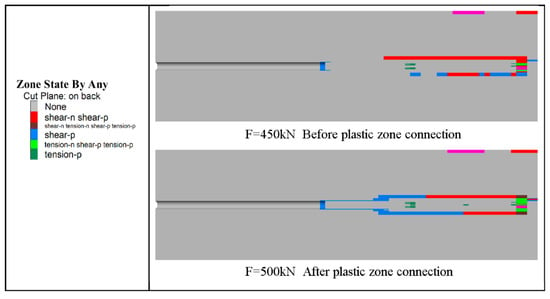
Figure 9.
Before and after the plastic zone of the anchor cable is connected.

Figure 10.
Model displacement contour diagram when the anchor cable tension F = 500 kN.
When the tensile force reached 700 kN, the development range of the plastic zone and the penetration of the grout–soil interface are shown in Figure 11. A plastic space similar to a sphere was formed at the front of the variable section, indicating that end resistance played an important role.

Figure 11.
Plastic failure range at anchor cable pulling force 700 kN.
3. Case Study of the Enlarged Head Tension Anchor Cable Support
3.1. Engineering Overview
This project was a support and drainage project for the foundation pit of Jingang Yuwan. The foundation pit project was located in the southern part of Dao Nan of Haigang District, Qinhuangdao City. The project included an underground garage and six high-rise residential buildings. The area of the foundation pit was about 17,860 m2, the depth of the foundation pit was 9.52–9.92 m, and the safety level of the foundation pit was Grade II. The plan of the foundation pit and the surrounding environment are shown in Figure 12.

Figure 12.
Foundation pit plan.
A cast-in-place pile and a prestressed anchor cable support system were used in this foundation pit project, and the high-pressure jet grouting anchor cable was used in the anchor cable type to enhance the anchoring force of the anchor cable and reduce the deformation of the support structure. The tensioning of anchor cable is shown in Figure 13. In the figure, A-F is to divide the foundation pit into different construction sections.
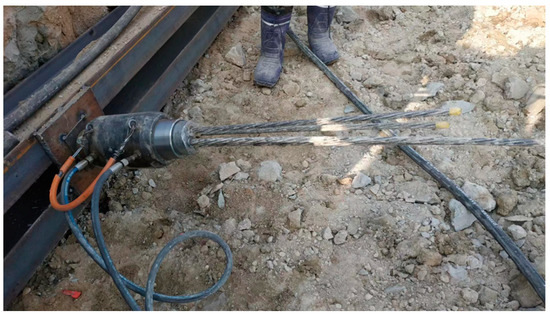
Figure 13.
Tensioning of anchor cable.
3.2. Monitoring of Foundation Pit Engineering
The monitoring point was located on top of the supporting pile, and the displacement of the pile top was monitored by a total station with an accuracy of 0.1 mm. As shown in Figure 14, the horizontal displacement of the pile top was mostly below 9 mm, which did not exceed the maximum limit of 20 mm.
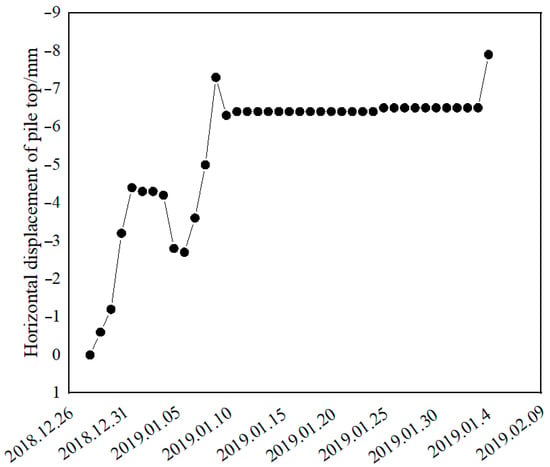
Figure 14.
Monitoring of the horizontal displacement of the pile top.
4. Numerical Simulation Analysis of the Anchor–Cable Support System
Based on the above engineering case of the enlarged head tension anchor cable, we performed a numerical simulation analysis for the enlarged head tension anchor cable and enlarged head pressure-dispersed anchor cable and compared the simulation results of the two types of anchors with the actual monitoring values.
4.1. Selection of Soil Constitutive Model and Calculation Parameters
As the Mohr–Coulomb elastic-plastic constitutive model is both practical and accurate, it is widely used in numerical simulations of foundation pit support. Therefore, this model was employed in the simulation calculation, considering the effect of pore water pressure on soil mass. According to the step-by-step excavation process of the actual support case, seepage calculation and mechanical calculation were used alternately in model calculation until the excavation was completed. The model drawing from the excavation of the foundation pit to the bottom of the pit is shown in Figure 15. In Figure 15, the model is 60 m long and 30 m high. The coordinates of the points in Figure 16 are A (35, 0.6, 0); B (35, −0.6, 0); C (5.9, 0.6, 0); D (5.9, −0.6, 0); E (−0.4, 0.6, −3); F (−0.4, −0.6, −3); G (−25, 0.6, −9.52); and H (−25, −0.6, −9.52). The parameters of the contact surface between soil, anchor cable material, grout, and soil are shown in Table 2, Table 3 and Table 4.
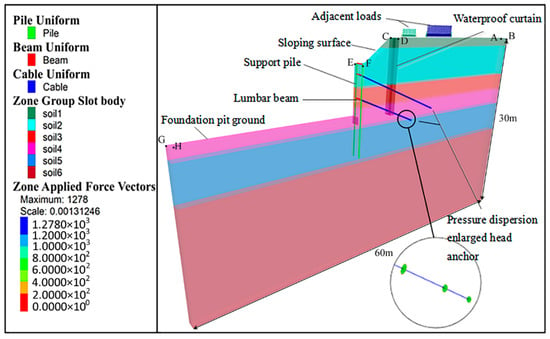
Figure 15.
Model diagram of the excavation of the foundation pit to the bottom of the pit.
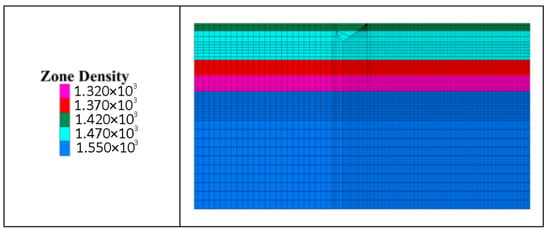
Figure 16.
FLAC3D mesh model.

Table 2.
Soil parameters.

Table 3.
Bolt parameters.

Table 4.
Grout–soil interface parameters.
4.1.1. Calculation of Model Size and Determination of Boundary Conditions
The basic rules for the shape of the foundation pit in this project are as follows: The upper part of the foundation pit had a slope of 3 m with a slope ratio of 1:1.5. Two-axle mixing piles were set around the foundation pit to block the first layer of the groundwater. The spacing between the supporting piles was 1.2 m. Rotary jet grouting piles were constructed in the spacing between the supporting piles, which jointly blocked the soil between the piles and acted as a water-stop curtain. The pumping well was set between the support pile of the foundation pit and the twin-axle mixing pile to discharge the second layer of groundwater. The horizontal spacing of the anchor cable was 2.4 m. According to the research on the influence range from an earlier study [26], the vertical calculation depth was 2–4 times the excavation depth, and the horizontal calculation length was 3–4 times the excavation depth from the edge of foundation pit outwards.
The three-dimensional space model was established using the FLAC3D. In Figure 12, the CD section of the foundation pit was selected as a cycle of a support structure, i.e., the distance between two support piles was the width used for the model calculation. The coordinate origin was in the middle of the model top surface; the XY plane was the horizontal plane. The vertical pit wall was the X-axis, the outer pit was 35 m, and the inner pit was 25 m. The vertical direction was the Z-axis, and the model height was 30 m. The Y-axis was along the pit wall, and the width of the foundation pit was 3.6 m.
When dividing the grid in this study, on the one hand, considering the requirement of the accuracy of calculation and the limitation of computer operation ability, the number of grids selected should not be not too large. On the other hand, for key research areas, the grid needs to be encrypted. The final model was divided into 15,720 zones, and the grid model is shown in Figure 16. The boundary condition constraints are the parallel faces close to the bottom of the anchor cable and are set as free constraints, and the other faces are set as fixed constraints. In this way, in the process of drawing, only the anchor solid will produce displacement, while the anchor head will not, so the displacement of the anchor cable can be used as a judgment of the anchoring effect. The boundary conditions for flow and displacements are shown in Figure 17.

Figure 17.
The boundary conditions for flow and displacements.
4.1.2. Simulating Process of Foundation Pit Excavation
After stress initialization of the model, the displacement was cleared to zero, and then the project was divided into 11 working conditions according to the design scheme of the foundation pit support. The simulation process of each working condition is shown in Table 5.

Table 5.
Foundation pit working conditions.
4.2. Results and Analysis of the Numerical Simulation
4.2.1. Support Effect of the Enlarged Head Pressure-Dispersed Anchor Cable on Foundation Pit
Two pumping wells were set inside the foundation pit and at the edge of the foundation pit, with a depth of 18 m. At the beginning of precipitation, the pore pressure around the pumping well obviously decreased, as shown in Figure 18. Because the third and fourth layers of soil were silty clay layers, the permeability coefficient was very small, forming a natural aquifer, which could only be drained out by the open drainage during construction. After precipitation, the water in the aquifer was not discharged in time, forming a clear boundary, as shown in Figure 19. It can be clearly seen from the stress contour diagram of pore water pressure that the pore water pressure dropped to 0 within a meter below the excavation surface. It was observed that the water pressure in the range of seepage radius of the pumping well decreased significantly.
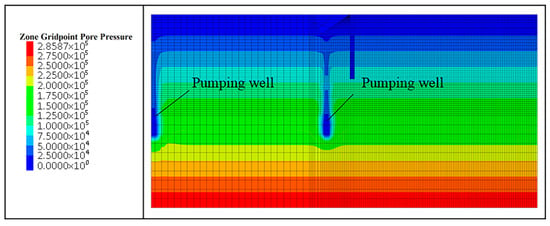
Figure 18.
Initial pore water pressure distribution.
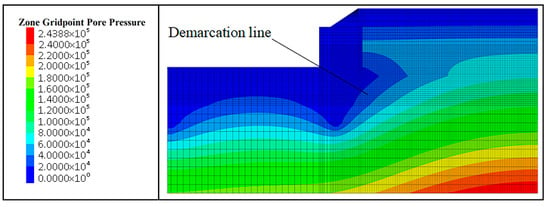
Figure 19.
Final pore water pressure distribution.
The surface settlement around the foundation pit under different working conditions is shown in Figure 20. Working Conditions 4 and 7 show that the dewatering process of the foundation pit increased the surface settlement near the edge of the foundation pit, and the influence effect was up to 23 mm. Due to the Mohr–Coulomb constitutive model, the elastic deformation and plastic deformation of the soil coexisted after an in situ stress balance. After excavation under working Conditions 5 and 8, the soil around the foundation pit suddenly lost its compressive force, and the elastic deformation of soil was released. It is shown that the ground near the edge of the foundation pit rebounded. On the bottom surface of the foundation pit excavation, the self-weight stress in the vertical direction was lost, resulting in a small increment in the vertical displacement.

Figure 20.
Surface settlement curve around the foundation pit under different working conditions.
The horizontal displacement contour diagram of each position in the foundation pit after the foundation pit excavation was completed is shown in Figure 21. It can be seen that the enlarged head pressure-dispersed anchor cable increased the integrity of the pile and the soil outside the foundation pit and played an obvious reinforcement role on the pit wall. The horizontal displacement of the support pile under different conditions is shown in Figure 22. Working Condition 3 completed the construction of the support pile, where the horizontal displacement of the pile was 0. Working Condition 7 indicates that the seepage forces during precipitation increased the horizontal displacement of the support pile to some extent. Before Working Condition 10, the precipitation of confined water was basically completed, the water content of soil outside the foundation pit was reduced, and the change of seepage path caused the horizontal displacement of the support pile to be reduced slightly. Working Conditions 6 and 9 indicate that the anchor cable obviously controlled the horizontal displacement of the support, and the maximum reduction displacement of the pile top was about 2.5 mm. The horizontal displacement of the pile body was the largest at the top of the pile. The greater the displacement of the pile body is, the greater the axial force of the anchor cable is [27].

Figure 21.
Final horizontal displacement cloud image.
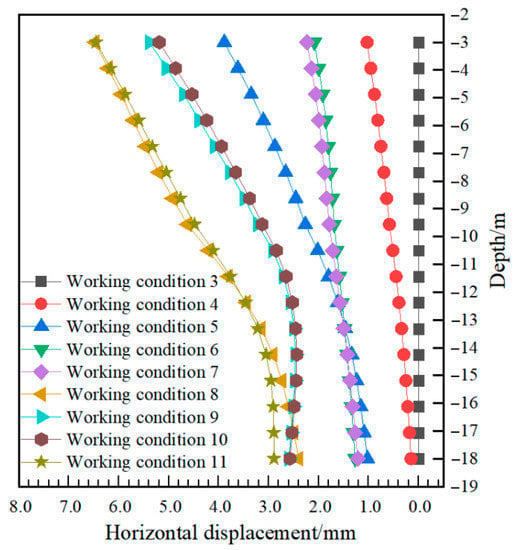
Figure 22.
Changes in the horizontal displacement of supporting piles under different working conditions.
4.2.2. Comparison of Support Effects of Enlarged Head Pressure-Dispersed Anchor Cables and Enlarged Head Tension Anchor Cables
The enlarged head pressure-dispersed type and the tension-type anchor cable were simulated, respectively. Under the same circumstances, only the stress mode of the anchor cable was changed. The enlarged head tension-type anchor cable effectively bonded with concrete by a steel strand, while the enlarged head pressure-dispersed type anchor cable was still rigidly connected with the embedded plate by a non-sticky connection steel strand. The axial force changes of the two types of anchor cable are shown in Figure 23.

Figure 23.
Changes in the anchor cable axial force under different working conditions.
During the simulation, the inclination angle of the anchor cable was set at 20 degrees, and the elevation of the anchor head of the first row of anchor cables was 4.3 m. The free section was 0–8 m, the ordinary anchorage section was 8–11 m with 350 mm diameter, and the enlarged anchorage section was 11–17 m with 600 mm diameter. The second row of the anchor cable had an elevation of 7.3 m, an inclination angle of 20 degrees, a free section of 0–6 m, and an enlarged section of 600 mm diameters.
As residual mortar was unavoidable in the free section during the actual construction, the simulation in this study was consistent with the actual situation, and the soil in the free section was not excavated. Conditions 6 and 9, respectively, applied prestress to the first and second rows of the anchor cables. In Cases 7 and 10, the value of axial force only increased slightly, which indicates that the seepage exhibited a little influence on the axial force compared with foundation pit excavation. In Cases 8 and 11, while excavating the soil body further, it was found that the axial force of the expanded head pressure-dispersed anchor cable was significantly increased. The maximum axial force of the first and second rows of anchor cables was 127.3 kN and 180.5 kN, respectively, but it was slightly lower than that of the extended head tension-type anchor cables. Case 9 shows that the axial force of the first row of anchor cables was significantly reduced after the second row of anchor cables was constructed, which indicates that they both played an important role in the foundation pit support. Generally speaking, the axial force of an enlarged head pressure anchor cable is less than that of an enlarged head tension cable, which is caused by excavation depth, properties of surrounding soil and seepage.
Figure 24 shows the change in the horizontal displacement of the pile top under different conditions for the two types of anchor cables. Generally, the horizontal displacement of the pile top did not exceed 20 mm during construction. The simulation results showed that the displacement results of both types of anchor cables in this study were within the error range, and the maximum error between the simulation results of the enlarged head tension-type anchor cables and the monitoring values of Section 2.2 was only 0.4 mm, which verified the accuracy of the simulation. After excavation, the simulation result of the enlarged head tension anchor cables was 7.55 mm, while that of the enlarged head pressure-dispersed anchor cable was reduced to 6.46 mm, and the horizontal displacement of the pile top was reduced by 14.43%, which indicates that the support effect of the enlarged head pressure-dispersed anchor cable was better than that of the enlarged head tension anchor cable.

Figure 24.
Changes in the horizontal displacement of the pile top under different working conditions.
When excavated to 9.52 m below the ground, the horizontal displacement was calculated by taking the monitoring points of the support pile body. From Figure 25, it can be clearly seen that the horizontal displacement value of the pile body of the enlarged head pressure dispersion type was significantly reduced compared with that of the enlarged head tension-type anchor cable, and the displacement of the pile top of the enlarged head pressure dispersion type was 6.46 mm.
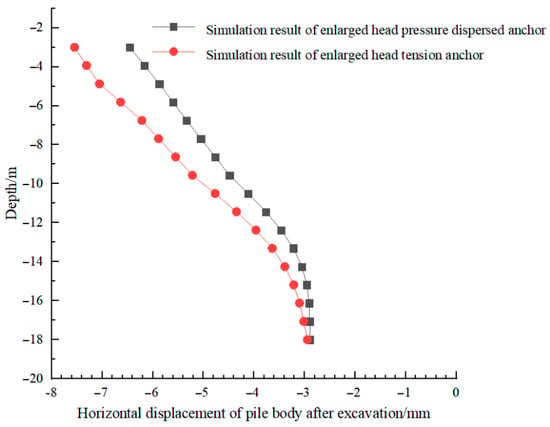
Figure 25.
Pile body displacements.
5. Conclusions
In order to explore the support effect of the enlarged head pressure-dispersed anchor cable on a foundation pit, we used a foundation pit project in Qinhuangdao City. The present study initially analyzed the internal force distribution law of the anchor cable. Subsequently, in order to verify its anchoring ability, the fluid–structure coupling numerical simulation analysis of the enlarged head pressure-dispersed and enlarged head tension-type anchor cable was carried out using FLAC3D software. The simulation results of the two types of anchor cables were compared with the actual monitoring values and the main conclusions drawn are as follows:
- (1)
- When the plastic zone at the grout–soil interface of anchor cable was penetrated, the end resistance at the variable section enhanced the side resistance. An “End-pressing inflection point” was caused by the different increasing speeds of the end resistance and side resistance, and with the increase in the tension, the maximum end resistance can reach 30% of the total tension, and an obvious plastic sphere space appeared at the front of the anchor.
- (2)
- In the numerical simulation, the conditions, such as saturated seepage, inclination of anchor cable, excavation of multi-layer soil body and loading at the side of a pit, were considered. By analyzing various conditions of the foundation pit excavation, it was found that the drainage process of the foundation pit increased the horizontal displacement of the support pile and the surface settlement around the foundation pit to a certain extent. The simulation results showed that the displacement results of both the types of anchor cables in this study were within the error range, and the maximum error between the simulation results of the tension-type anchor cables and the engineering monitoring values was only 0.4 mm, which verified the accuracy of the simulation.
- (3)
- After excavation, the horizontal displacement of pile body of the enlarged head pressure-dispersed anchor cable was significantly smaller than that of the enlarged head tension-type anchor cable compared with the simulation results of ordinary tension anchor cable. It shows that the displacement of enlarged head pressure-dispersed anchor cable decreases by 24.4%, which indicates that the support effect of the enlarged head pressure-dispersed anchor cable was superior to that of the enlarged head tension-type anchor cable. In general, the axial force of the enlarged head pressure anchor cables was less than that of the enlarged head tension cables, which was possibly due to the excavation depth and properties of surrounding soil and seepage. Therefore, in regard to the foundation pit support, the support effect of the enlarged head pressure-dispersed anchor cable was better than that of the enlarged head tension anchor cable.
There are still many deficiencies in the research on the enlarged head pressure-dispersed anchor cable, such as changing the size of the enlarged head. Further research is needed on the force and deformation laws of the enlarged head and the interaction with the surrounding soil mass. The influence of changing the anchor cable tension at different embedded plates on the enlarged head and the plastic zone of the surrounding soil and the anchoring effect can also be analyzed and studied.
Author Contributions
Conceptualization, C.W.; data curation, C.W. and L.K.; formal analysis Q.G.; funding acquisition, C.W. and H.C.; investigation, L.K.; methodology, Q.G.; project administration, C.W.; visualization, L.K. and Q.G.; writing—review and editing, C.W. and H.C. All authors have read and agreed to the published version of the manuscript.
Funding
This research was financially supported by Natural Science Foundation of Hebei Province (E2020203075), Natural Science Foundation of Hebei Province (E2020203168), Science and Technology Research Project of Colleges, Universities in Hebei Province (ZD2020330), and Qinhuangdao Scientific and Technological Research and Development Plan (202005A001).
Conflicts of Interest
The authors declare no conflict of interest.
References
- Zeng, Q.; Yang, X.; Yang, C. Mechanical mechanism and calculation method of bit expanded anchor rods. Rock Soil Mech. 2010, 31, 1359–1367. [Google Scholar] [CrossRef]
- Chen, C.; Nemick, J.; Ting, R.; Aziz, N. A study of rock bolting failure modes. Int. J. Min. Sci. Technol. 2013, 23, 79–88. [Google Scholar] [CrossRef]
- Ling, Y.; Feng, Y. Development and Application of Anchor-Soil Interface Models. Soils Found. 2002, 41, 59–77. [Google Scholar] [CrossRef]
- Tao, Z.; Zhu, Z.; Han, W.; Zhu, C.; Liu, W. Static tension and finite element analysis of constant resistance and large deformation anchor cable. Adv. Mech. Eng. 2018, 10, 1–13. [Google Scholar] [CrossRef]
- Liu, G.; Wen, K.; Li, Z.; Hu, R. Field Test on Pressure-type Anchor with Enlarged-end. China Earthq. Eng. J. 2011, 33, 303–307. [Google Scholar]
- Su, T.; Zhou, Y.; Wang, Z.; Ye, S. Large Scale Model Test Study of Foundation Pit Supported by Pile Anchors. Appl. Sci. 2022, 12, 9792. [Google Scholar] [CrossRef]
- Dong, Y.; Cui, L.; Zhang, X. Multiple-GPU parallelization of three-dimensional material point method based on single-root complex. Int. J. Numer. Methods Eng. 2021, 123, 1481–1504. [Google Scholar] [CrossRef]
- Ren, D.; Chang, S.; Wang, G. Optimization Study on Structural Parameters of the Bit Expanded Anchor. J. Shenyang Jianzhu Univ. 2016, 32, 466–475. [Google Scholar] [CrossRef]
- Zhang, D.; Wang, R.; Jiang, Y.; Li, D.; Lin, G. Experimental Study on Anchoring Mechanism of Pre-Stressed Anchor Cable by FLAC3D. In Proceedings of the 2010 International Conference on Computational Intelligence and Software Engineering, Wuhan, China, 10–12 December 2010; pp. 1–4. [Google Scholar]
- Shan, R.; Huang, P.; Yuan, H.; Meng, C.; Zhang, S. Research on the full-section anchor cable and C-shaped tube support system of mining roadway in island coal faces. J. Asian Archit. Build. Eng. 2021, 31, 298–310. [Google Scholar] [CrossRef]
- Li, X.; Yang, G.; Nemick, J.; Aziz, N. Numerical investigation of the shear behaviour of a cable bolt in single shear test. Tunn. Under. Space Technol. 2019, 84, 227–236. [Google Scholar] [CrossRef]
- Yu, Y.; Liu, X. Flac3d Numerical Simulation of Tension-dispersive Anchor Cable. Electron. J. Geotech. Eng. 2014, 19, 6009–6019. [Google Scholar]
- Kim, N.; Park, J.; Kim, S. Numerical simulation of ground anchors. Comput. Geotech. 2006, 34, 498–507. [Google Scholar] [CrossRef]
- Dong, B.; Zhang, P.; Zhang, M.; Qu, Z.; Huang, W. Research on Deformation of Deep Foundation Pit Dewatering Excavation Based on Fluid-solid Coupling Effect. Highway 2021, 66, 349–356. [Google Scholar]
- Liu, H.; Feng, J. Study on Anchorage Mechanism of Pressure Dispersed Anchor by Numerical Analysis. Chin. J. Undergr. Space Eng. 2015, 11, 446–455. [Google Scholar]
- Wang, Z.; Wang, Q.; Ma, S.; Xue, Y.; Xu, S. A method for calculating ultimate pullout force of recoverable under-reamed prestressed anchor cable. Rock Soil Mech. 2018, 38, 202–208. [Google Scholar]
- Fan, N.; Jiang, J.; Dong, Y.; Guo, L.; Song, L. Approach for evaluating instantaneous impact forces during submarine slide- pipeline interaction considering the interaction considering the inertial action. Ocean Eng. 2022, 245, 110466. [Google Scholar] [CrossRef]
- Li, Q.; Zhang, L.; Liu, H.; Qin, J.; Wu, S. Research on the Strain Energy and the Stiffness Matching of Pressure-dispersive Anchor Cable. Chin. J. Undergr. Space Eng. 2019, 15, 1033–1037. [Google Scholar]
- Zhang, Y.; Zhao, H.; Zhang, X. Test Study of Mechanical Performances of Anchorage Zone of Pressure Dispersion Anchor Cable Style. Chin. J. Rock Mech. Eng. 2010, 29, 3052–3056. [Google Scholar]
- Yao, H.; Gan, K.; Wu, D.; Ren, Y.; Lv, W.; Duan, W. Research on anti-vibration ability of pressure dispersed anchor cable and tension concentrated anchor cable. Rock Soil Mech. 2012, 33, 3598–3603. [Google Scholar]
- Liang, Y.; Liu, G.; Li, Z.; Yang, J. Field Test on Sub-Enlarged Pressure-Dispersive Ground Anchor. Appl. Mech. Mater. 2012, 1800, 683–686. [Google Scholar] [CrossRef]
- Zhang, Z.; Liu, J.; Ye, G.; Liang, Z.; He, Z. Performance Tests on Pressure-Dispersed Compression Anchors in Cohesive Soils. Int. J. Geomech. 2021, 21, 04021012. [Google Scholar] [CrossRef]
- Li, J.; Li, L. Numerical analysis on a new pressure-type anchor cable with precast anchor head based on FLAC3d. In Proceedings of the 2016 2nd International Conference on Electronics, Network and Computer Engineering (ICENCE 2016), Yinchuan, China, 13 August 2016; pp. 252–256. [Google Scholar] [CrossRef][Green Version]
- Wilson, P.; Elgamal, A. Large-Scale Passive Earth Pressure Load-Displacement Tests and Numerical Simulation. J. Geotech. Geoenviron. Eng. 2010, 136, 1634–1643. [Google Scholar] [CrossRef]
- Yang, T.; He, H.; Gong, X. Analysis Again for Earth Pressure Calculation Theory Considering Displacement Effects. Adv. Mater. Res. 2012, 368–373, 2755–2759. [Google Scholar] [CrossRef]
- Liu, B.; Liu, H.; Cheng, Y. Numerical analysis of pile-anchor supporting structure in deep excavation. J. Liaoning Tech. Univ. (Nat. Sci.) 2017, 36, 825–829. [Google Scholar]
- Song, W.; Liu, Y.; Zheng, Q. Influence of anchor cable failure on a supporting system of pile anchor foundation pit. In Proceedings of the 2nd International Conference on Civil Engineering Environment Resources and Energy Materials, Changsha, China, 18–20 September 2020. [Google Scholar]
Publisher’s Note: MDPI stays neutral with regard to jurisdictional claims in published maps and institutional affiliations. |
© 2022 by the authors. Licensee MDPI, Basel, Switzerland. This article is an open access article distributed under the terms and conditions of the Creative Commons Attribution (CC BY) license (https://creativecommons.org/licenses/by/4.0/).