Article

Effect of Local Cyclic Loading on Direct Shear Strength Characteristics of Shear-Zone Soil

1
Faculty of Engineering, China University of Geosciences, Wuhan 430074, China
2
Badong National Observation and Research Station of Geohazards, China University of Geosciences, Wuhan 430074, China
*
Author to whom correspondence should be addressed.
Appl. Sci. 2022, 12(24), 13024; https://doi.org/10.3390/app122413024
Submission received: 17 November 2022 / Revised: 9 December 2022 / Accepted: 15 December 2022 / Published: 19 December 2022

Abstract

:
The reservoir landslide in the Three Gorges Reservoir Area (TGRA) often suffers from local cyclic loading scenarios produced by surge waves, groundwater level fluctuation, traffic loading, and seismic activity. However, the effects of local cyclic loading on the shear resistance of the shear-zone of the reservoir landslide are poorly understood. This study experimentally investigates the effects of local cyclic loading on the shear strength and the deformation of shear-zone material using cyclic direct shear tests. A series of cyclic direct shear tests are performed with different normal stresses, cyclic periods, and numbers of cycles. The experimental results indicate that: (1) Compared with monotonic loading, local cyclic loading can significantly decrease the shear stress of shear-zone soil. (2) Shear-zone soil exhibits greater volumetric contraction under local cyclic loading conditions than that under monotonic loading. (3) Under different vertical stresses, the differentiation of shear deformation after 40 cycles of loading was slight and virtually insignificant. The research results reveal the weakening law of the mechanical strength of shear-zone soil under local cyclic loading, which provides a foundation for investigating the mechanism of the reservoir landslide under the fluctuation of water levels.

1. Introduction

Despite extensive investigations having been carried out in the recent decades to investigate the static shear strength of the sliding zone in landslides, only a few studies have been performed on the effects of local cyclic loading, i.e., surge waves, groundwater level fluctuation, traffic loading, precipitation, or seismic loading, which are often encountered periodically in reservoir landslides but do not last long. One of the reasons for this discrepancy is that in general, local cyclic loading cannot trigger large-scale rapid landslides. However, the phenomenon of cyclic loading-induced landslides has been noticed in much of the recent research. For example, Gratchev et al. [1] noted that under every stress loading process, the pore pressure raised until it increased to the vertical stress. Sassa et al. [2] found that cyclic loading could trigger a liquefaction effect near the slip zone. Nakamura et al. [3] observed that shear strength can be reduced under cyclic loading and may eventually make the materials behave like high mobility materials. Moreover, effective cell pressure and deviatoric stress had a great effect on pore pressure in triaxial tests [4,5]. In saturated sliding-zone soils, pore pressure may increase to cell pressure under cyclic loading, leading to soil liquefaction [6].
Reservoir bank landslides and the surge waves they generate are a calamitous disaster that can cause massive property damage and fatalities [7]. For example, the impulse water waves generated by the Vajont landslide tsunami in Italy (1963) swept away several villages and caused nearly 2000 fatalities [8]. During the 2004 Mid-Niigata earthquake, cyclic loading triggered numerous landslides and a barrier dam in front of the landslide [2]. Since the impounding of the Three Gorges Reservoir (TGR), reservoir landslides have been arousing wide public concern as they can generate dynamic loading [9,10]. The current situation is that many reservoir landslides have not been reinforced and remain in a state of continuous deformation under local cyclic loading in the TRGA, for example, the Huangtupo landslide [11] and the Outang landslide [12]. Hence, it is of great significance to study the stress–strain characteristics of reservoir landslides under local cyclic loading.
Understanding the deformation evolution of shear-zone soil under the condition of monotonic loading and cyclic loading is essential for calculating the stability and designing the prevention structure of reservoir landslides [13,14]. Monotonic loading and cyclic loading will cause permanent and fatigue deformation in specimens under different stress levels [15,16]. Under these deformations, as a slope is damaged, it generates tensile cracks at the trailing edge [9,17]. The main study methods involve computer simulation, model testing, indoor testing, and in situ surveys [18,19,20,21]. In addition, some linear and nonlinear methods were used to predict the shear strength parameters from soils’ physical properties [22,23,24].
Monitoring data from reservoir landslides has shown that reservoir level variation is amongst the most significant elements governing the stability and deformation features since the impoundment of the TGR [25]. The cyclic loading effect on the displacement behaviors has become more and more obvious [26]. Detailed deformation and strength studies are necessary to explain how reservoir level changes influence the stability of a landslide.
In this paper, the shear-zone soil of the Huangtupo landslide was taken as the research object, and a cyclic direct shearing test system was used to perform a special dynamic test. Then, the shear strength characteristics of the shear-zone soil under various stress states and the stress-deformation behavior of the shear-zone soil with local cyclic direct shear testing were obtained to simulate the stress–strain evolution law of reservoir landslides under the fluctuation of the water level. Eventually, the effects of the cyclic period and the cycle number on the stress–strain behaviors of the shear-zone soil were studied. The research results reveal the weakening law of the mechanical strength of the shear-zone soil under local cyclic loading, which provides a foundation for investigating the mechanism of reservoir landslides under the fluctuation of the water level.

2. Landslide Overview

The Huangtupo landslide is in the south band of the Yangtze River in Badong County (Figure 1a) and is an ancient large-scale landslide, which seriously threatens life and property in its vicinity [27]. Given the instability of the deformation, the migrant relocation project of Huangtupo landslide dated from February 2009 and was finished in May 2017, altogether 16,000 people relocated from the landslide (Figure 1b). Because a highway on the landslide is connected with the provincial highway, there are always cars and wagons using the road throughout the year, which generates very low-frequency traffic cyclic loading on the shear-zone of the landslide (Figure 1c).
The Huangtupo landslide consist of mudstone, sandstone, and limestone strata of the Badong Formation of the Triassic period (T3b) and is a multi-stage landslide accumulation. The landslide is made up of No. 1 and No. 2 sliding accumulation near the Yangtze River. At the end of 2021, the China University of Geosciences (Wuhan) built the Badong National Observation and Research Station of Geohazards on the No. 1 riverside sliding accumulation to study the deformation evolution of the landslide under fluctuations of the reservoir level.
According to the monitoring data from the ground, slip body, and slip bed, there is fatigue loading on the shear-zone soil because of the variation in reservoir level (145 m–175 m), as well as dynamic stress by earthquakes. Therefore, it is quite important to reveal the stress–strain relationship under various vertical loads, cycle periods, and cycle numbers. A flowchart for the whole work process is provided in Figure 2.

3. Materials and Methods

3.1. Soil Properties

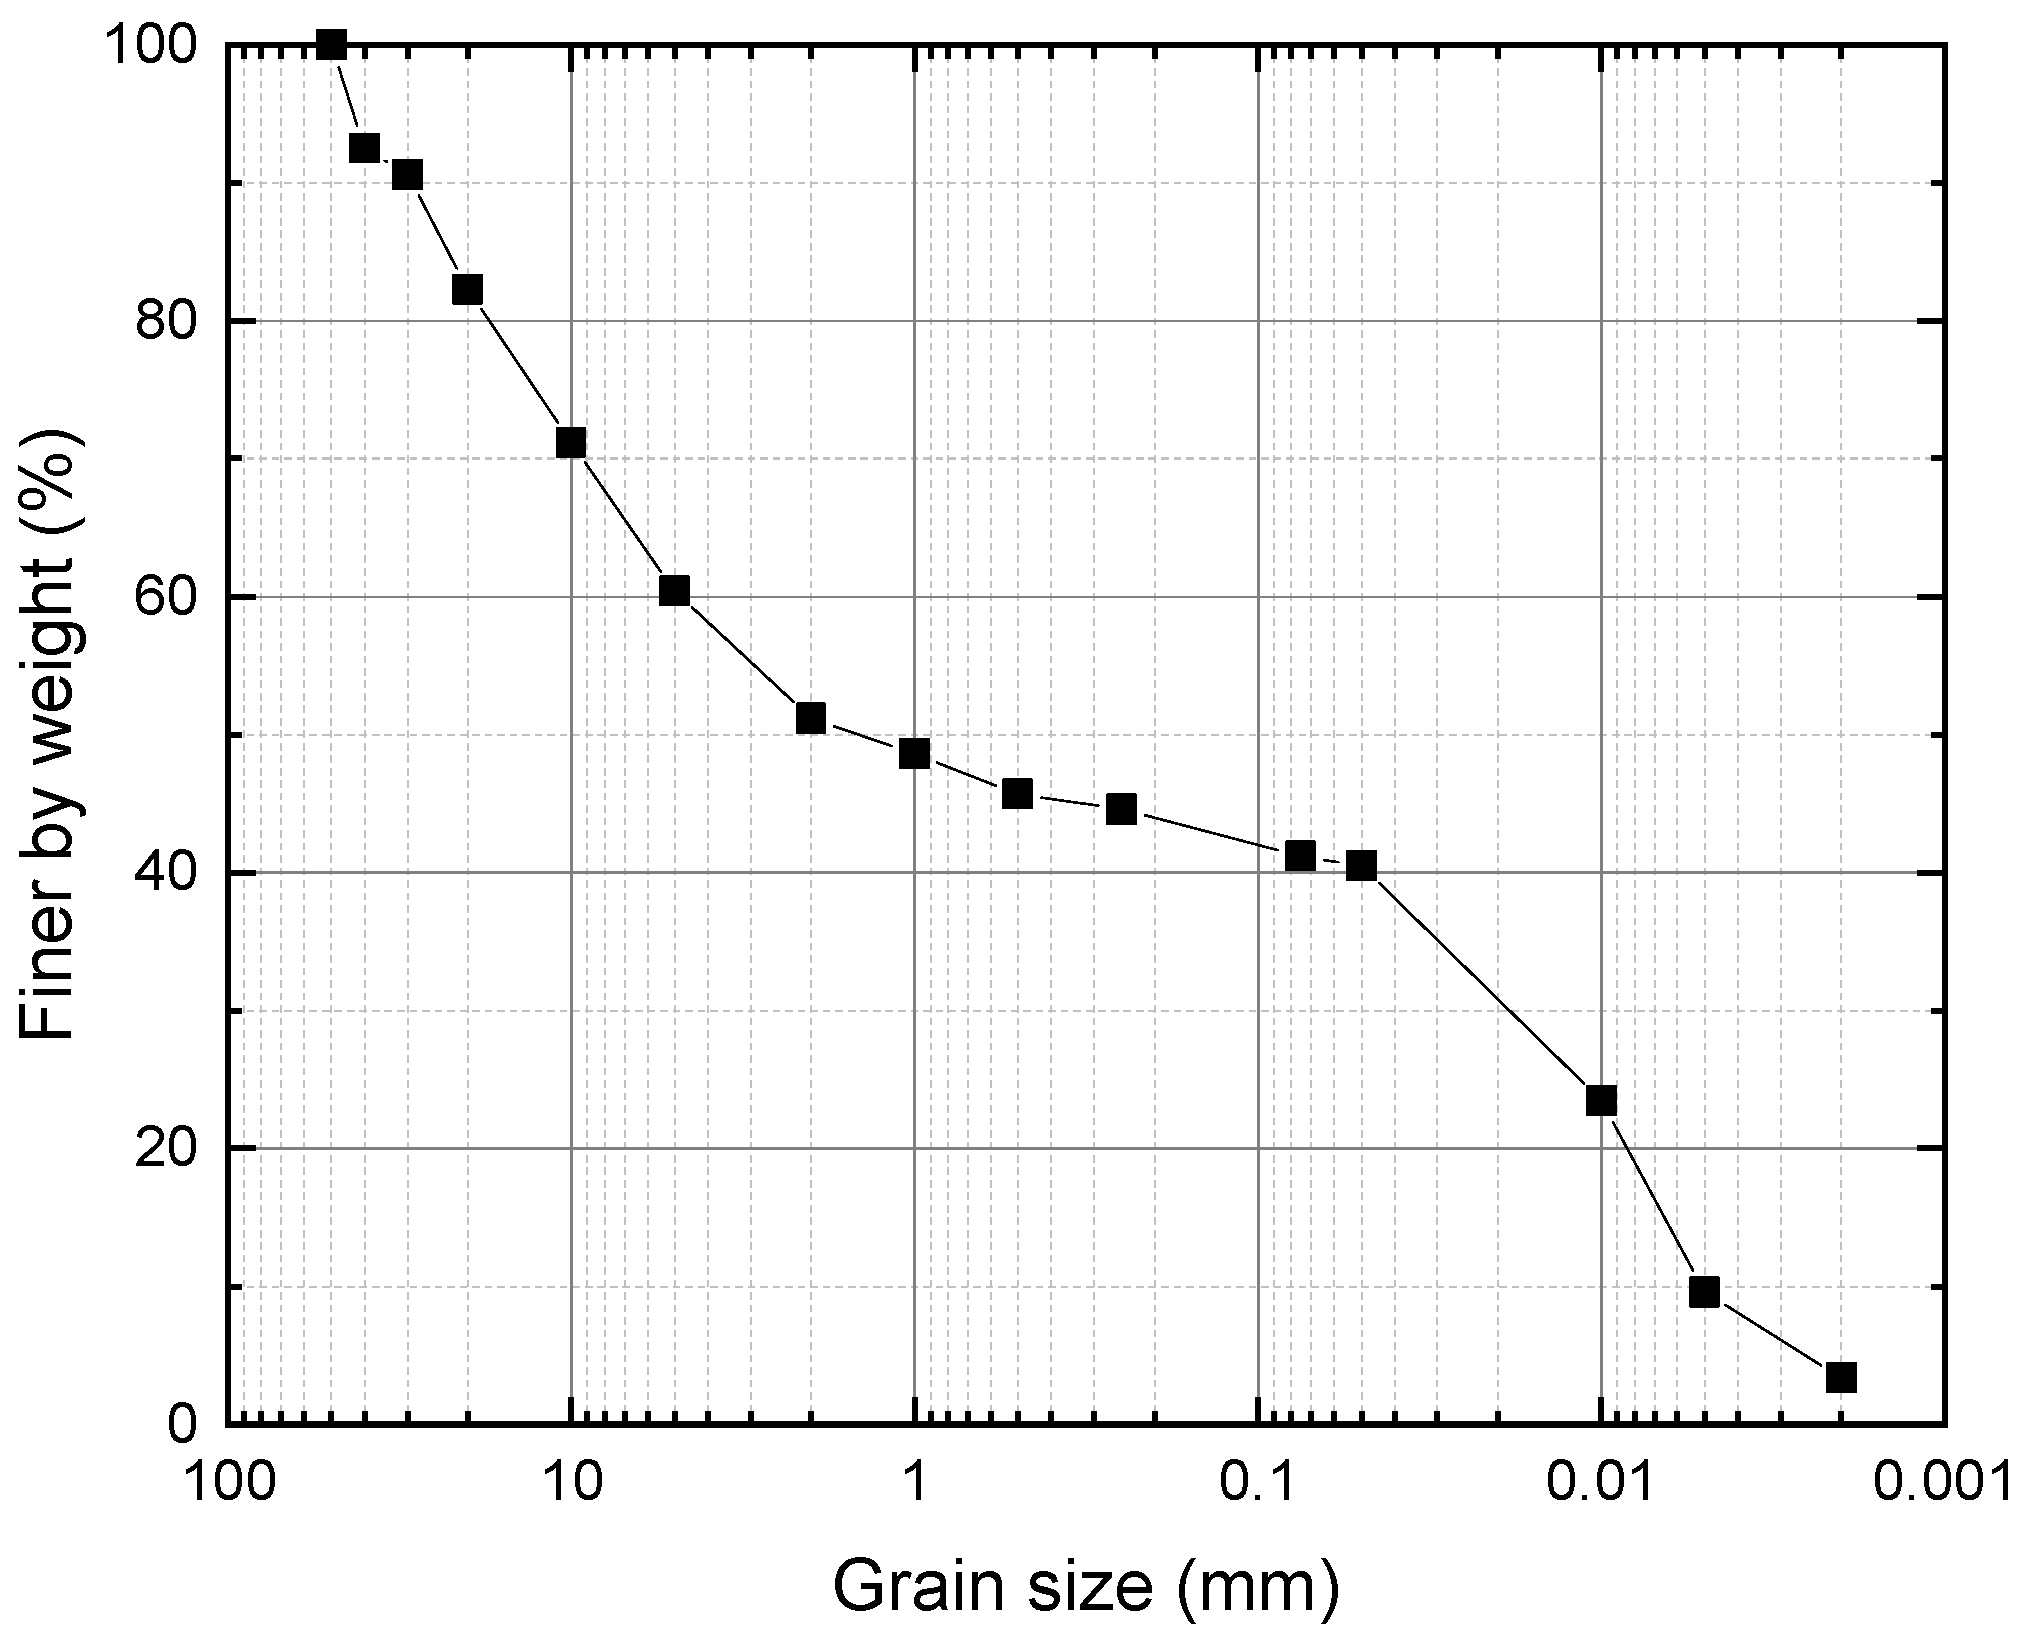
The shear-zone soil used in the cyclic direct shear test was from the third test tunnel of the No. 1 riverside landslide accumulation of the Huangtupo landslide. Laboratory tests were performed to determine the basic physical and mechanical properties of the shear-zone soil (Table 1). The particle size distribution curve of the shear-zone soil is shown in Figure 3. According to a plasticity chart of the unified soil classification system of ASTM D-2487, because the plasticity index and liquid limit are 18.51 and 36.02%, respectively, the soil classification of the shear-zone soil is CL. Based on the particle size distribution curve, the sizes d60, d50, and d10 are 4.96 mm, 1.54 mm, and 0.03 mm, respectively. As the coefficient of uniformity Cu is 146.93, the shear-zone soil is poorly graded.

3.2. Testing Methodology

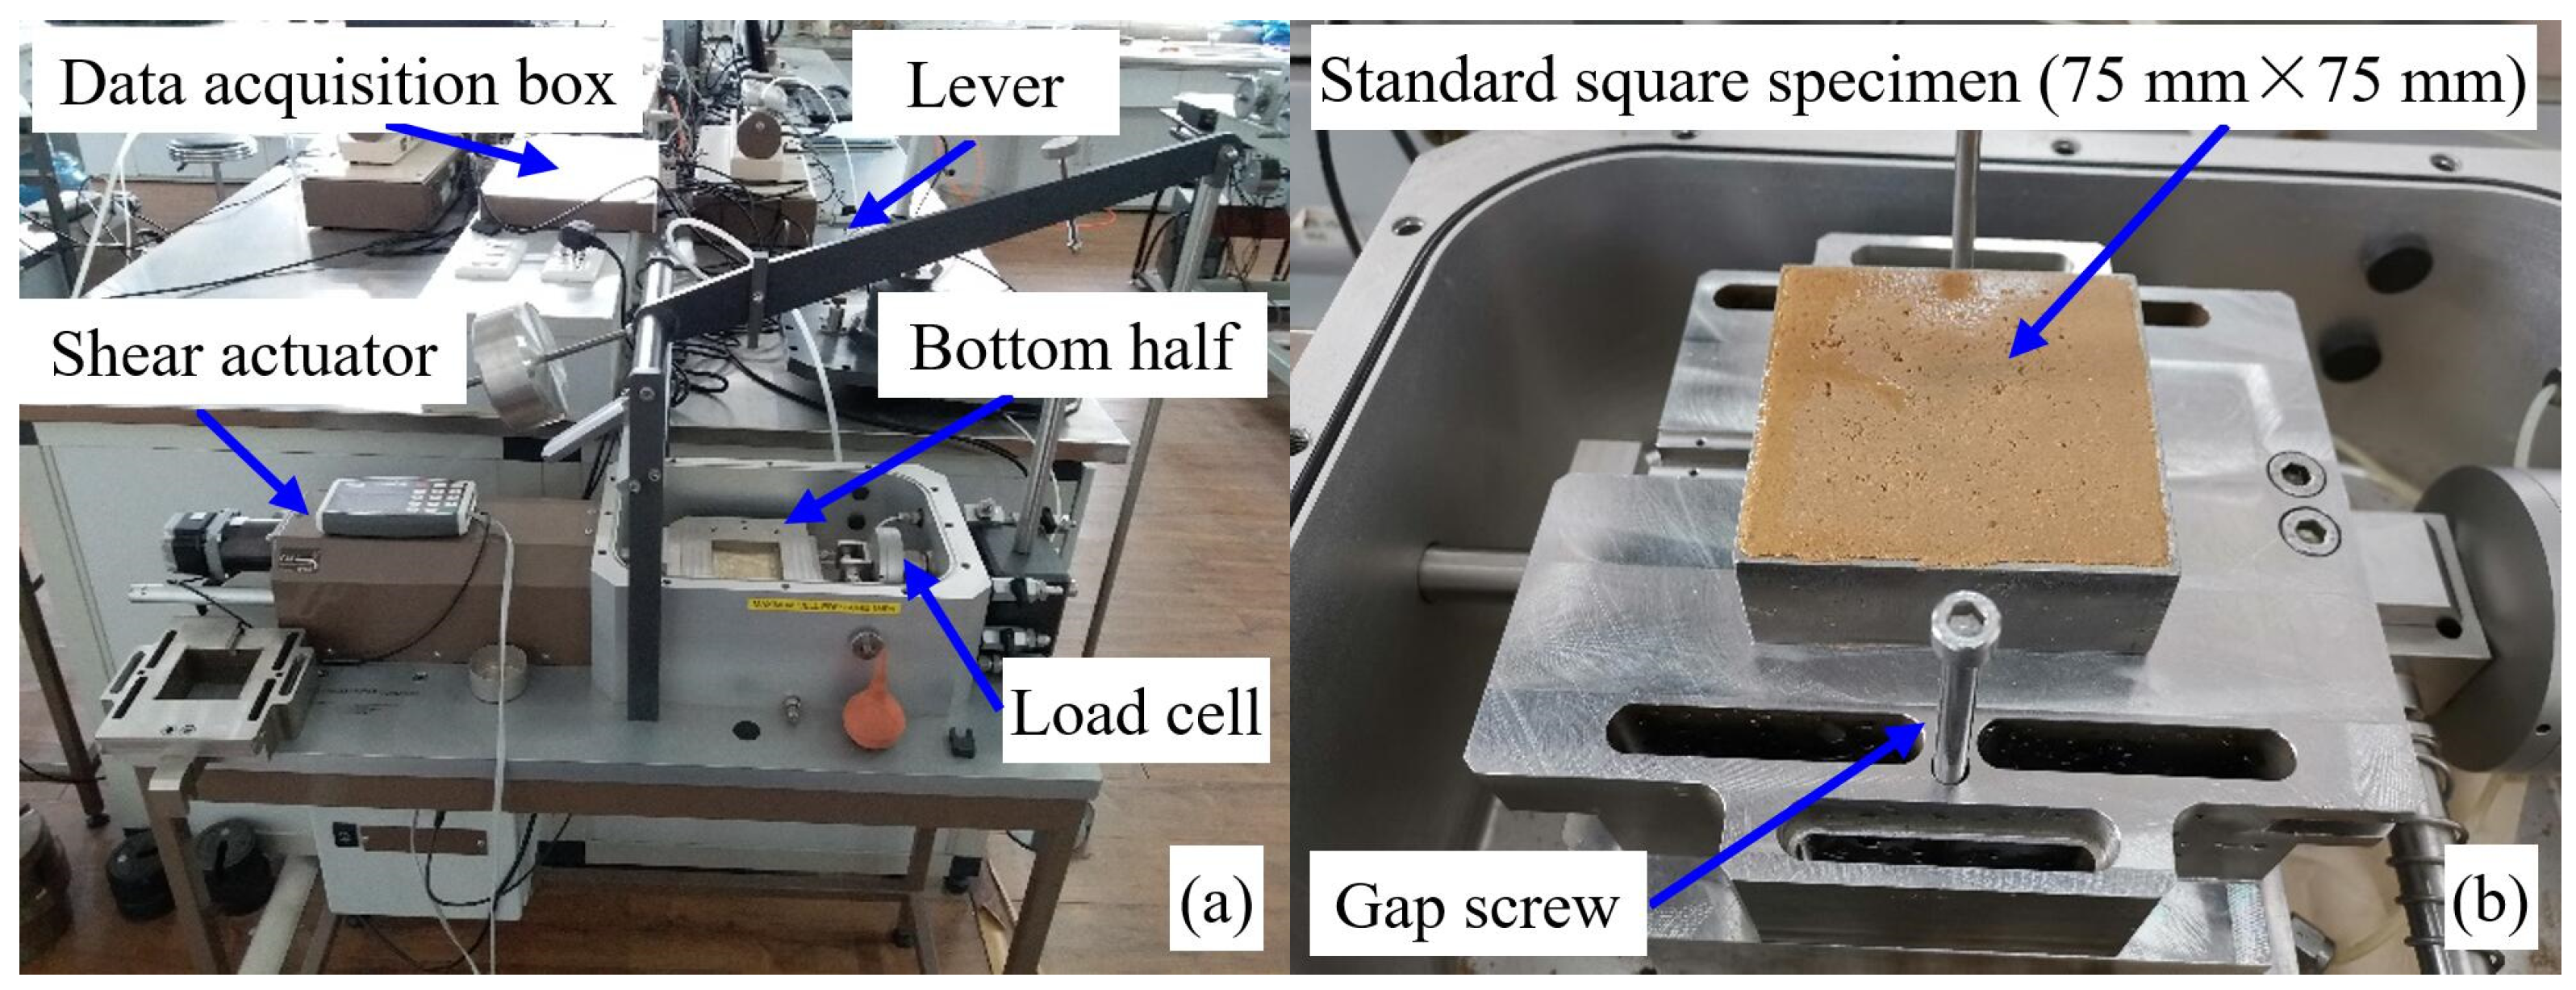
The cyclic direct shear tests were performed using an automated direct shear apparatus (Figure 4) from GDS Instruments (Hook, UK), which could perform standard/cyclic direct shear testing with full automation (ASTM D-3080). In cyclic direct shear tests, horizontal shearing could be applied at an (i) assigned rate of horizontal deformation, (ii) assigned rate of horizontal force change, or (iii) assigned cyclic loading. The system had a shear actuator, internal load cell, and data acquisition box. The system also had horizontal travel of ±25 mm and displacement accuracy of 0.1% FSO.
The specimen assessed with the cyclic direct shear test apparatus was approximately 75 mm × 75 mm × 30 mm. The remolded specimens were prepared to match the dry density and water content of the undisturbed specimens. To prevent material loss at the clearance between the two halves of the direct shear box, the clearance size was fixed to 0.2 mm using the gap screws.
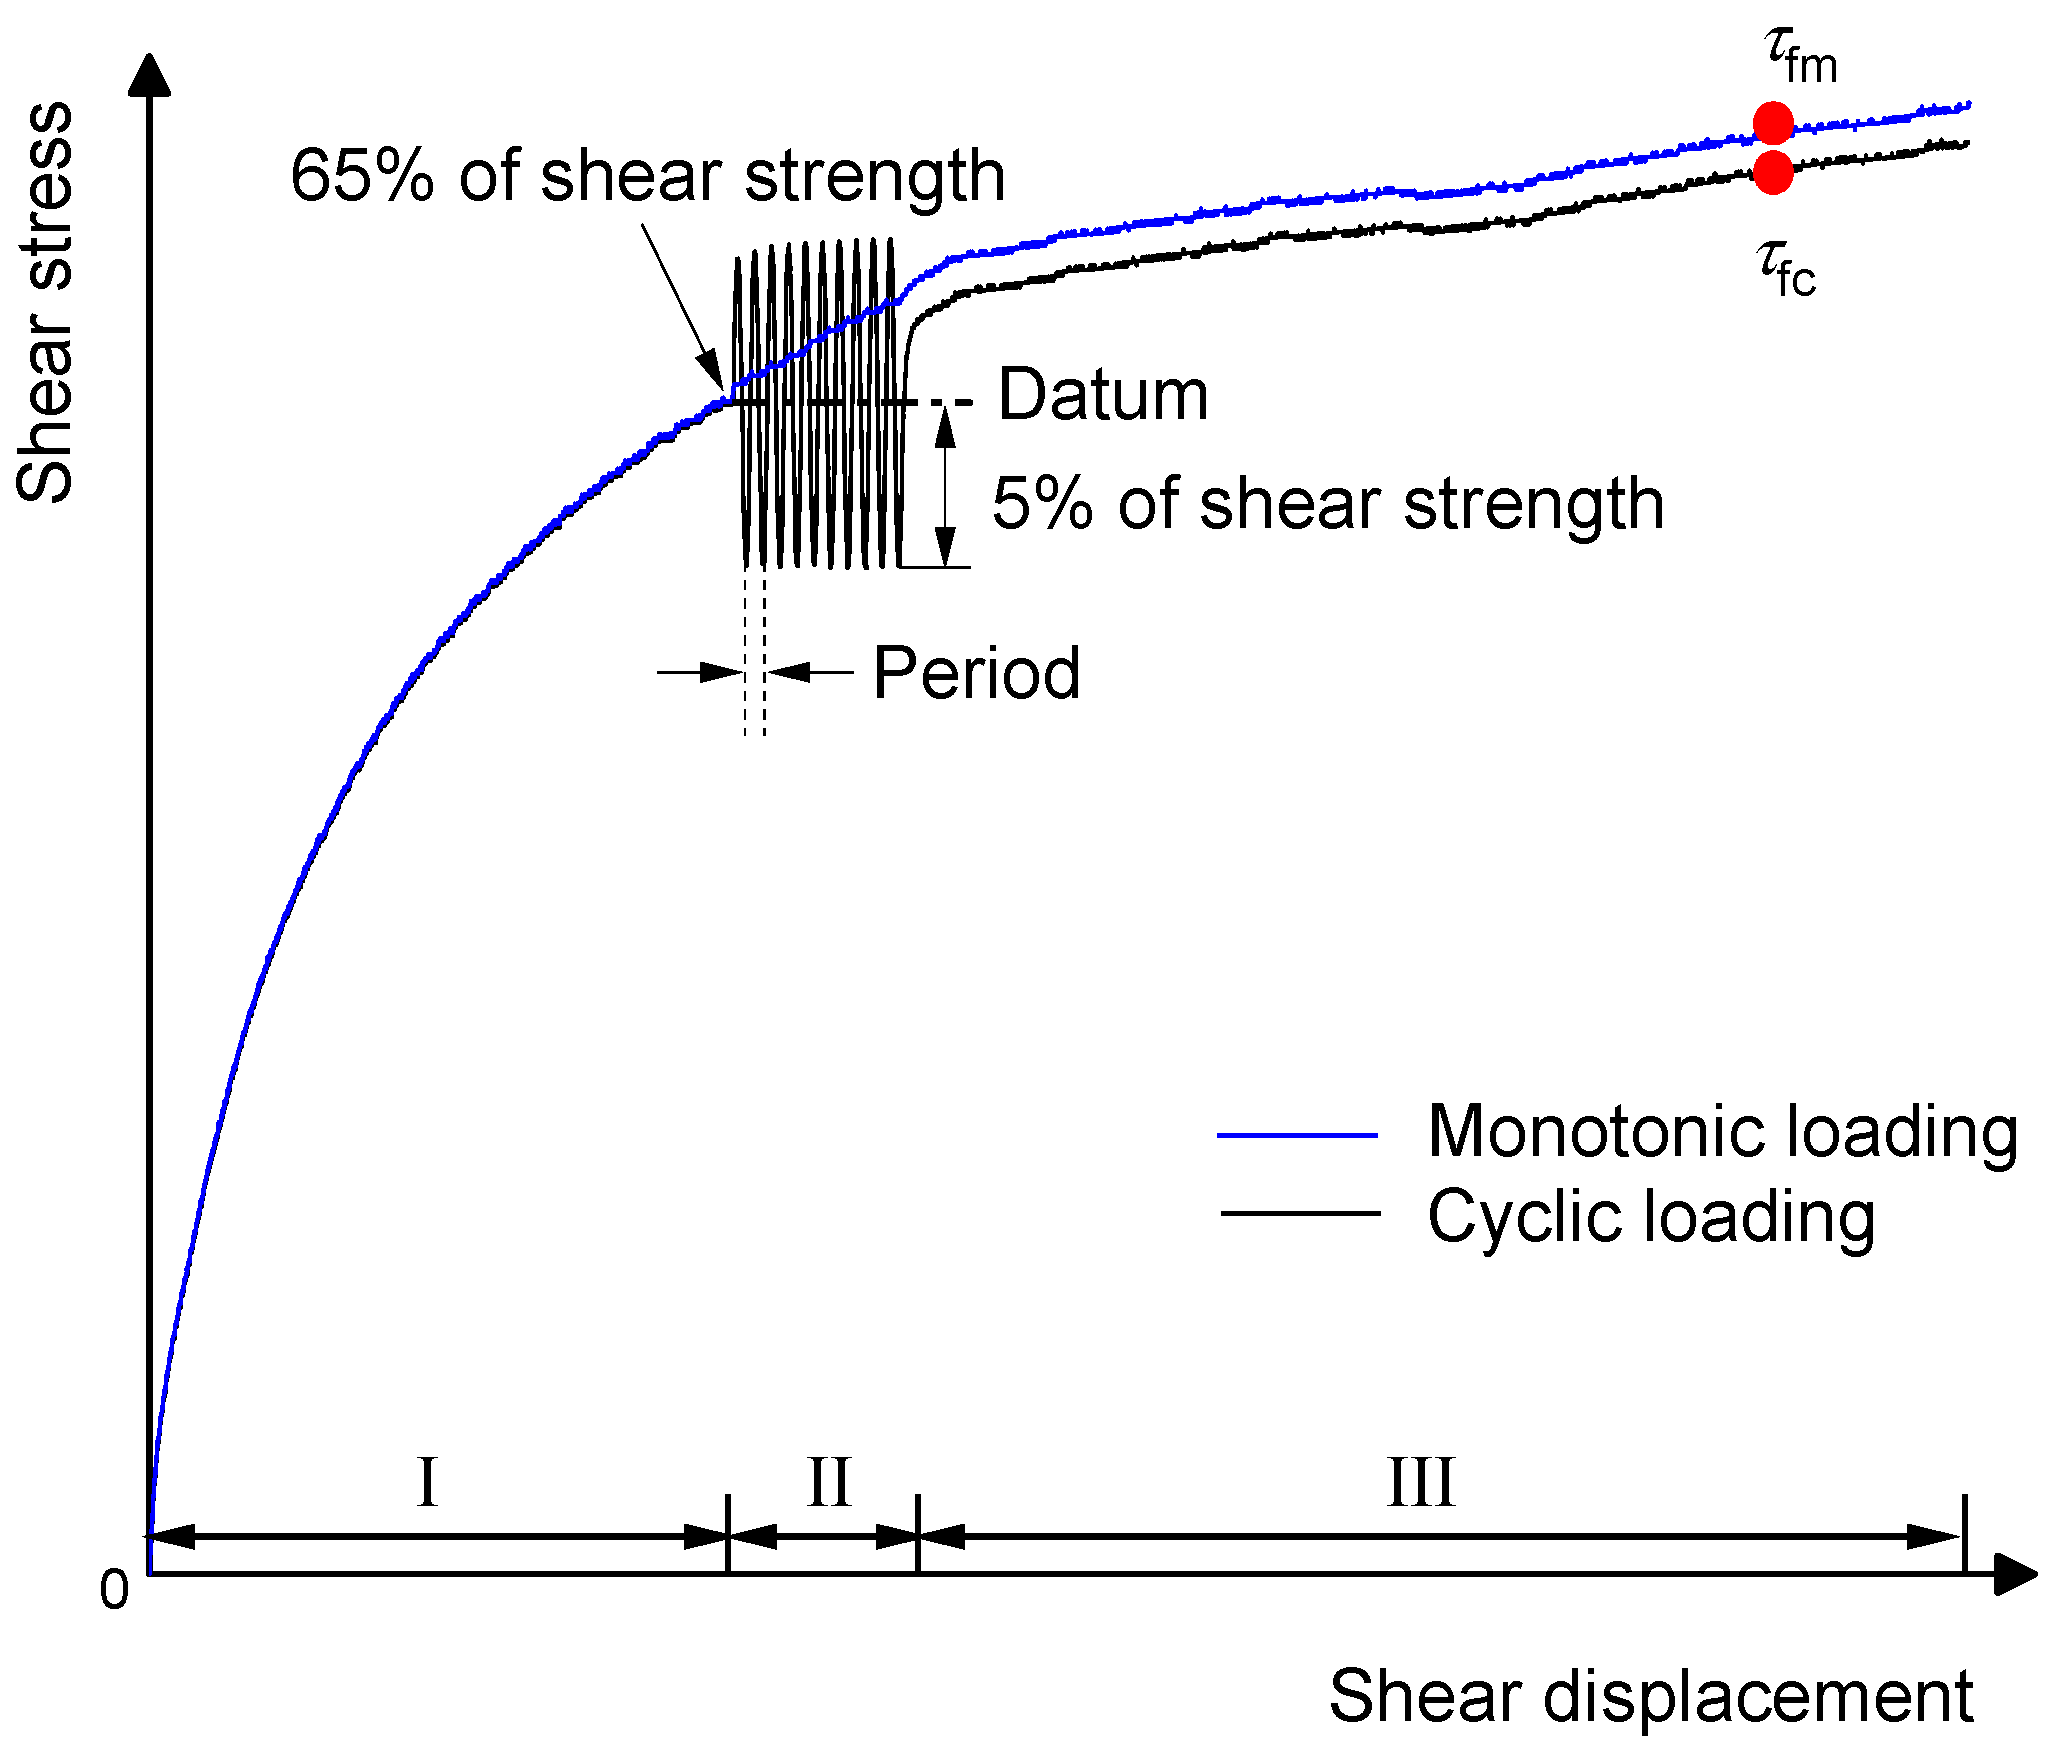
The samples in the cyclic direct shear test were loaded to 100 kPa, 200 kPa, and 400 kPa vertical stresses according to the buried depth and elevation of the shear-zone soil. For monotonic loading tests, the specimens were sheared at a steady rate of 0.02 mm/min throughout the test. The Huangtupo landslide is a revived landslide after the impoundment of the TGR, and the shear strength of the shear-zone soil falls to the residual value, about 60~70% of the maximum shear stress (τf) [28]. Thus, for the cyclic loading test when the shear stress increased to 65% of the maximum shear stress or specified shear strength under monotonic loading (stage I), cyclic loading (stage II) was applied. According to the water level fluctuation data [20], the stress amplitude of the cyclic loading was 5% of the shear strength, the cyclic frequencies were 0.011 Hz (90 s), 0.017 Hz (60 s), and 0.100 Hz (10 s), and the number of cycles were 10, 20, 100, and 1000. The dynamic stress ratios were 0.577, 0.540, and 0.368 for normal consolidation stress of 100 kPa, 200 kPa, and 400 kPa, respectively. After cyclic loading, the specimen was sheared monotonically (stage III) until the specific termination to reveal the effect of local cyclic loading on the shear stress of the shear-zone soil. A schematic diagram of monotonic loading (stage I), cyclic loading (stage II), and monotonic loading (stage III) is shown in Figure 5. In the absence of a peak strength, the shear stress at 10 percent relative lateral displacement is taken as a failure (ASTM D-3080). Table 2 shows the detailed cyclic direct shear test conditions for the shear-zone soil of the Huangtupo landslide.
The shear strength ratio fcm, which is expressed as the ratio of the shear strength τfc in a cyclic direct shear test to the peak strength τfm in a monotonic direct shear test on shear-zone soil under the same vertical stress is proposed as follows:
f cm = τ fc / τ fm

4. Results

4.1. Monotonic Direct Shear Test Characteristics

The evolutions of the horizontal shear stress and the vertical deformation as functions of the shear displacement of the shear-zone soil are shown in Figure 6. The shear stress–shear displacement curves, plotted in Figure 6a, show a strain-hardening characteristic with different normal stress. For the shear-zone soil, an increase in the normal stress enhanced the initial stiffness of the stress-displacement curve. As there was no peak strength in the stress-deformation curves, the shear stress at 7.50 mm shear displacement (10 percent relative lateral displacement) was taken as a failure. At the same time, the shear-zone soil exhibited a shear-contraction property as an increase in shear displacement under different normal stress (Figure 6b). In addition, an increase in the normal pressure enhanced the vertical deformation at the end of each stress level.
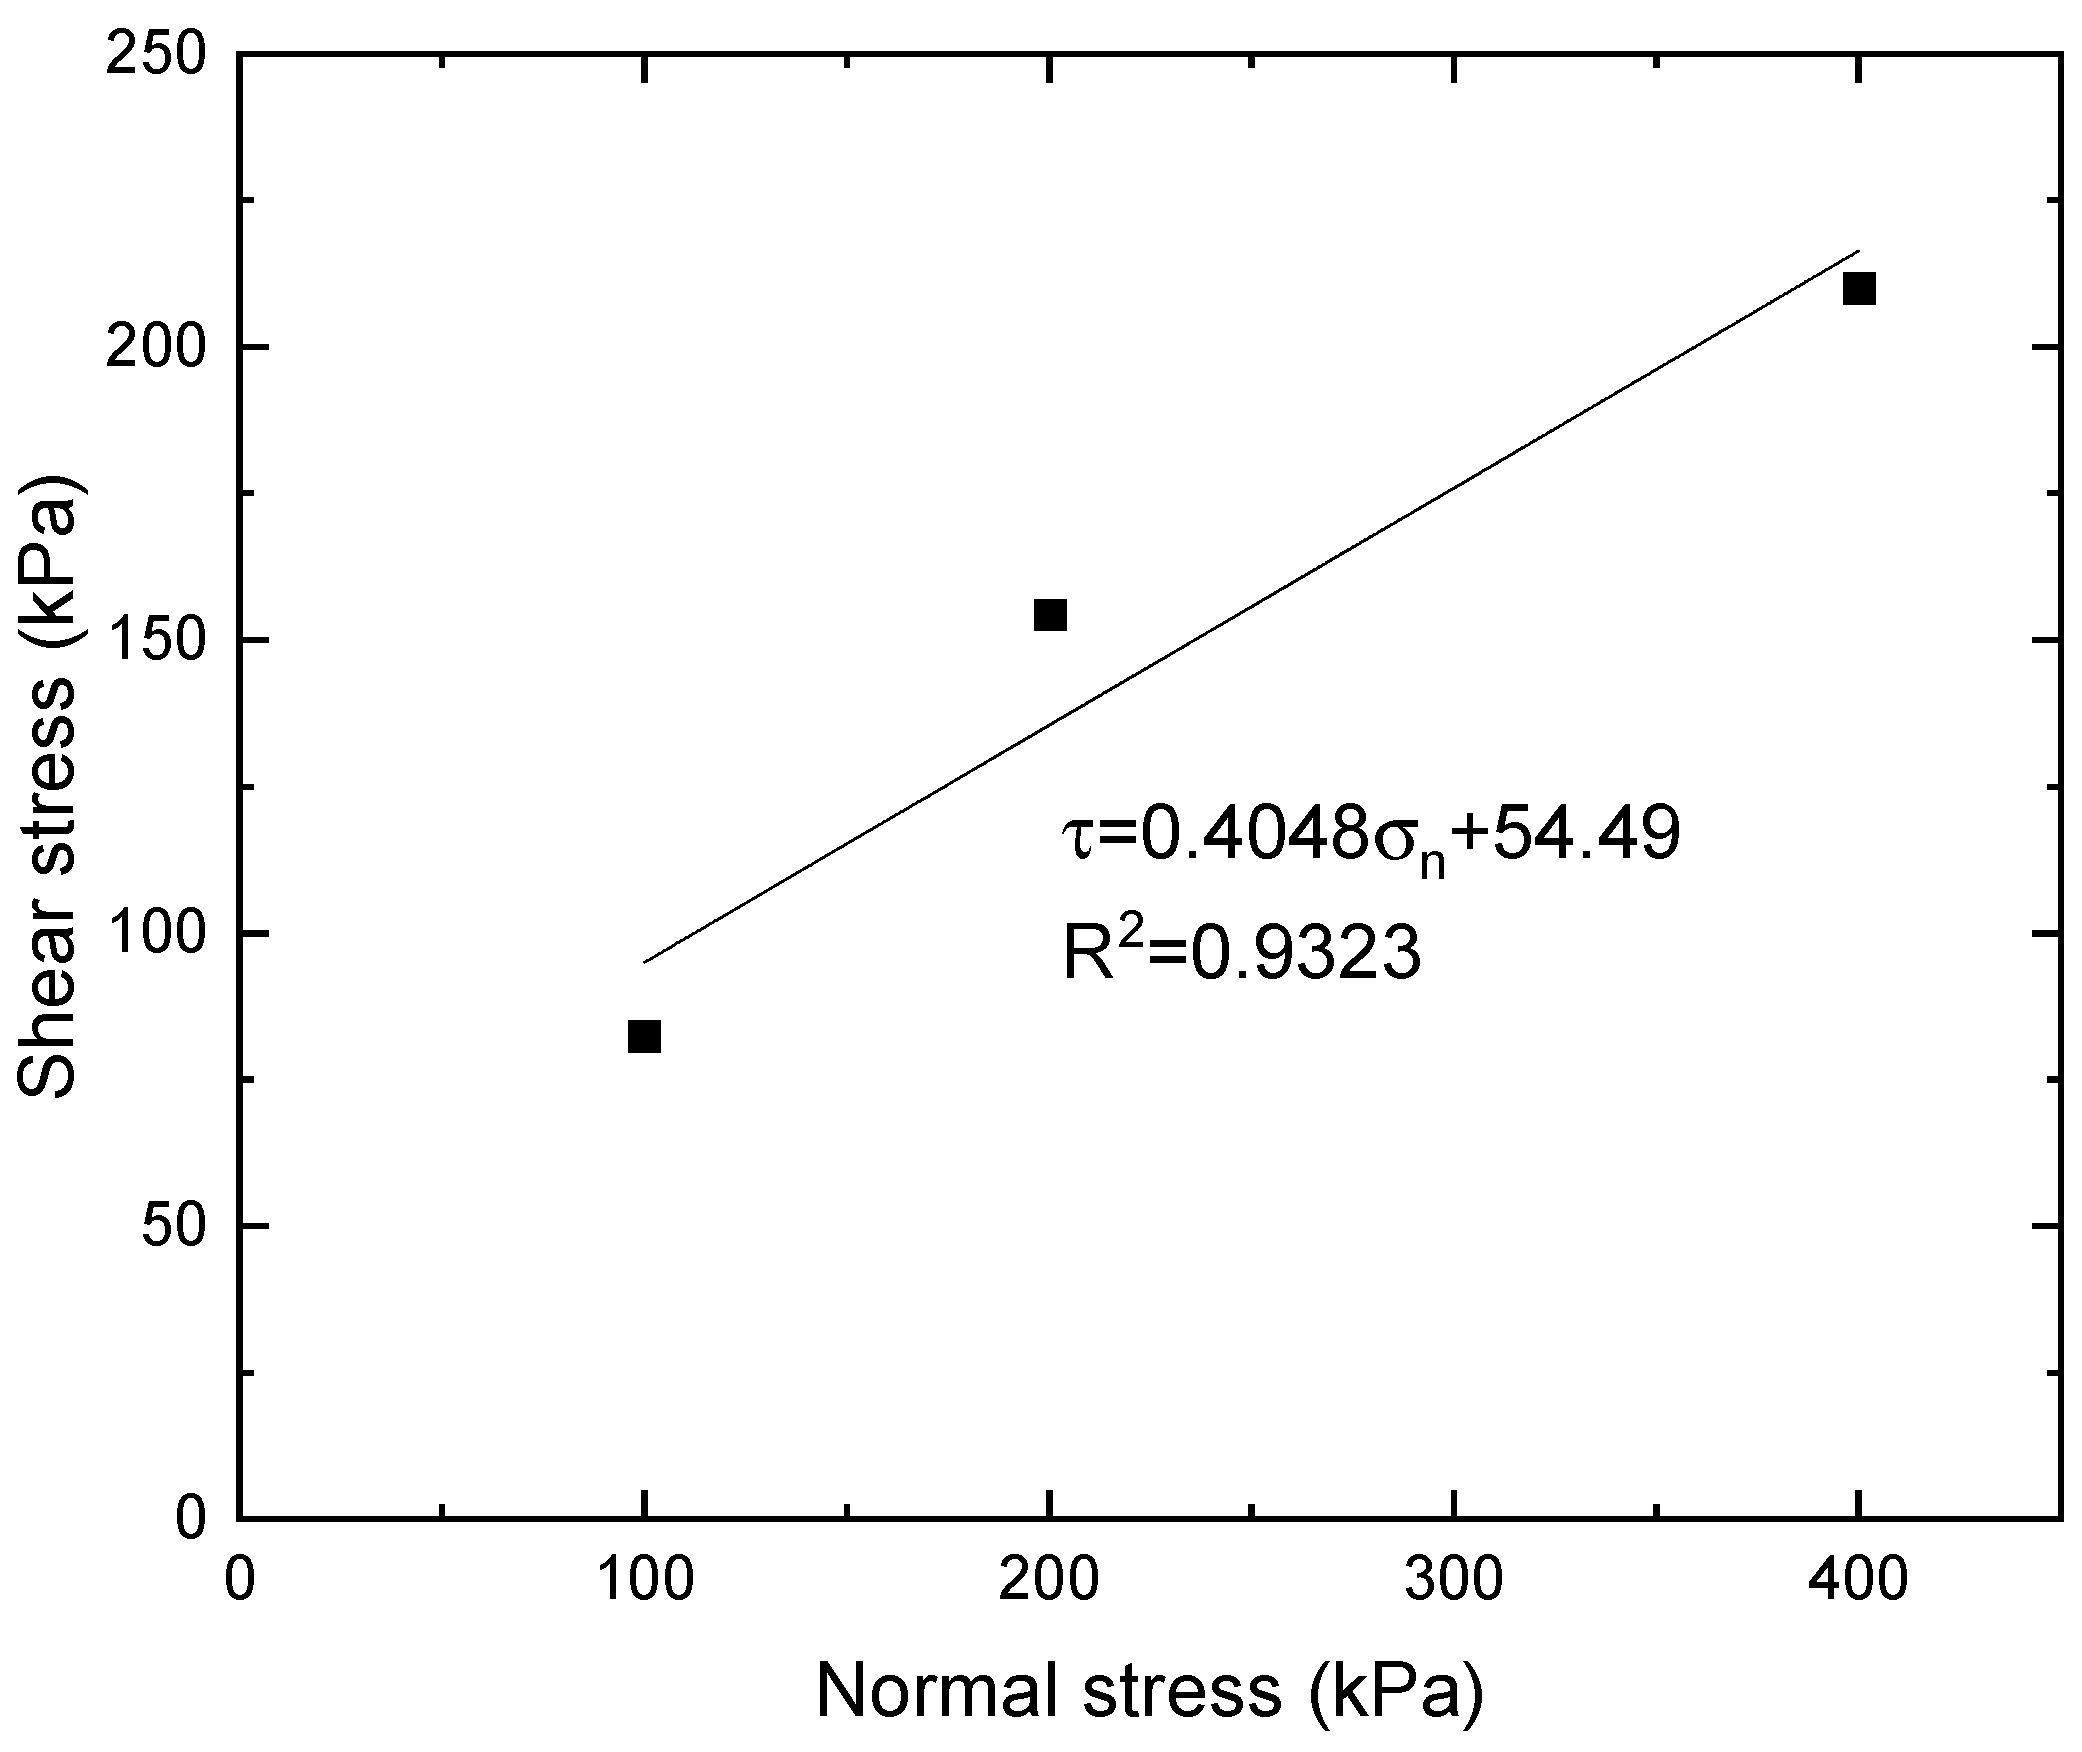
Figure 7 presents the shear stress and normal stress relationships for three values of normal stress, as well as the corresponding linear best fit. Following the Mohr–Coulomb failure criterion, the shear strength parameters of shear-zone soil showed an adhesion c = 52.87 kPa and a friction angle φ = 20.13° under monotonic loading.

4.2. Studying the Effect of Normal Stress

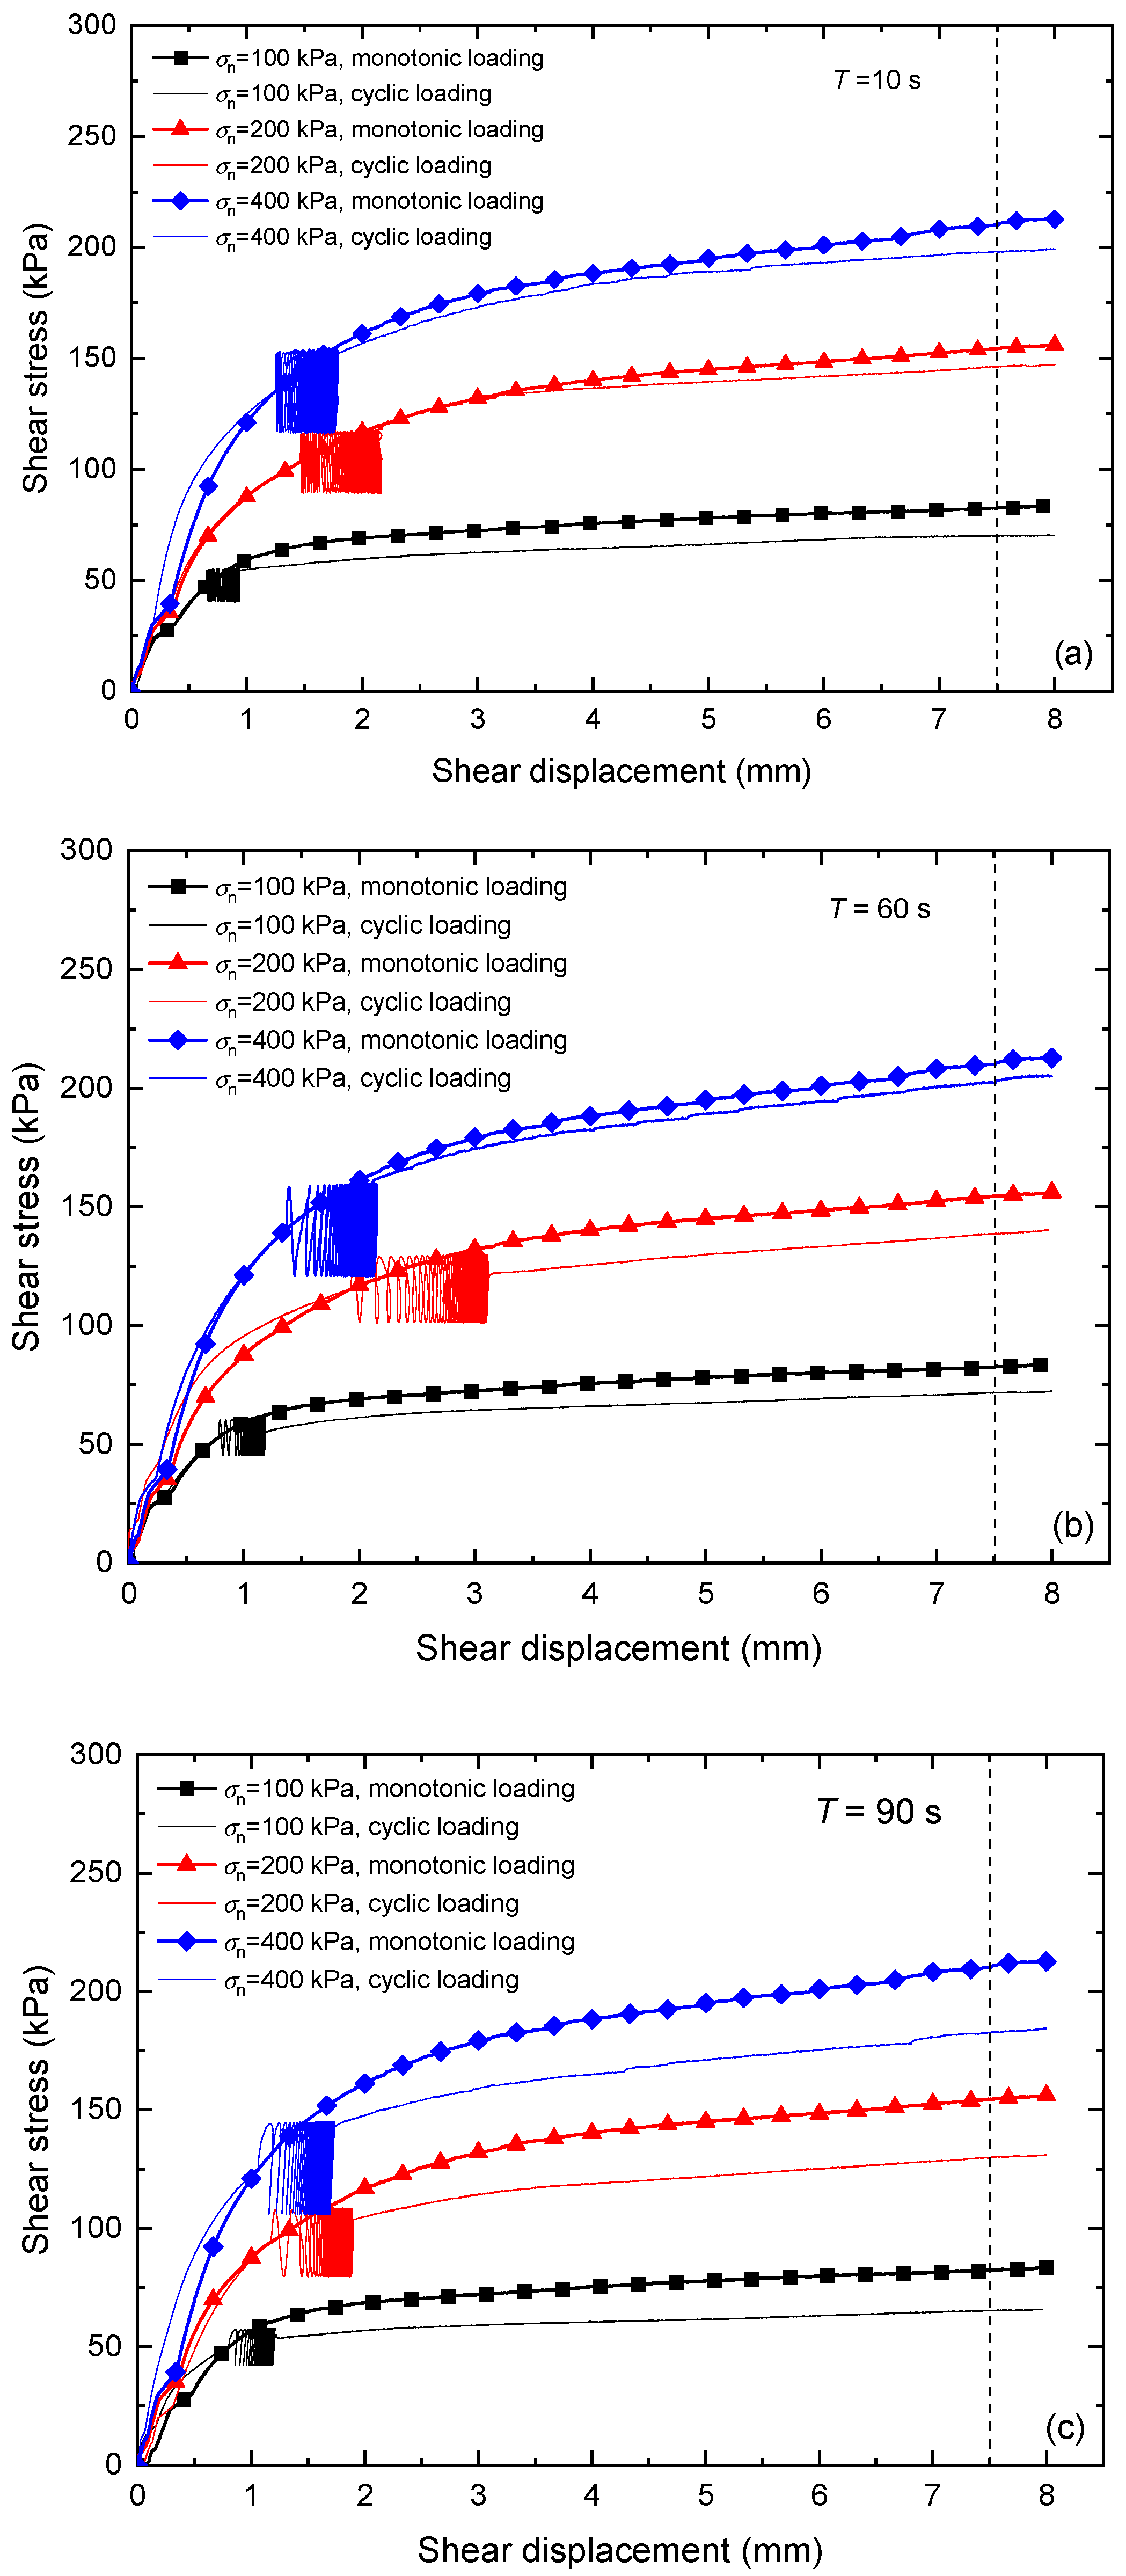
The cyclic direct shear tests exhibited in this section were carried out with the normal stresses of 100 kPa, 200 kPa, and 400 kPa, and shear stresses of sinusoidal waveforms. A total of 100 cycles were imposed to the shear-zone soil for each stress level. For the load-controlled local cyclic direct shear tests, the applied shear stress amplitude, τa, was 5% of the shear strength reached under monotonic loading (τfm). The applied normal stress, the vertical displacement, the shear displacement, and the horizontal shear stress were recorded automatically during the direct shearing process.
Figure 8 shows the shear stress plotted against shear displacement for shear-zone soil at a normal stress of 100 kPa, 200 kPa, and 400 kPa. It indicates that an increase in the normal stress enhanced the initial slope of the curves and the stiffness of the shear-zone soil. Compared with the monotonic direct shear test, local cyclic loading did not change the stress-displacement tendency but decreased shear strength, which could be attributed mainly to the different cyclic loading [29]. After 100 cycles the specimens were subjected to more accumulated plastic deformation and fatigue damage, leading to lower shear strength.
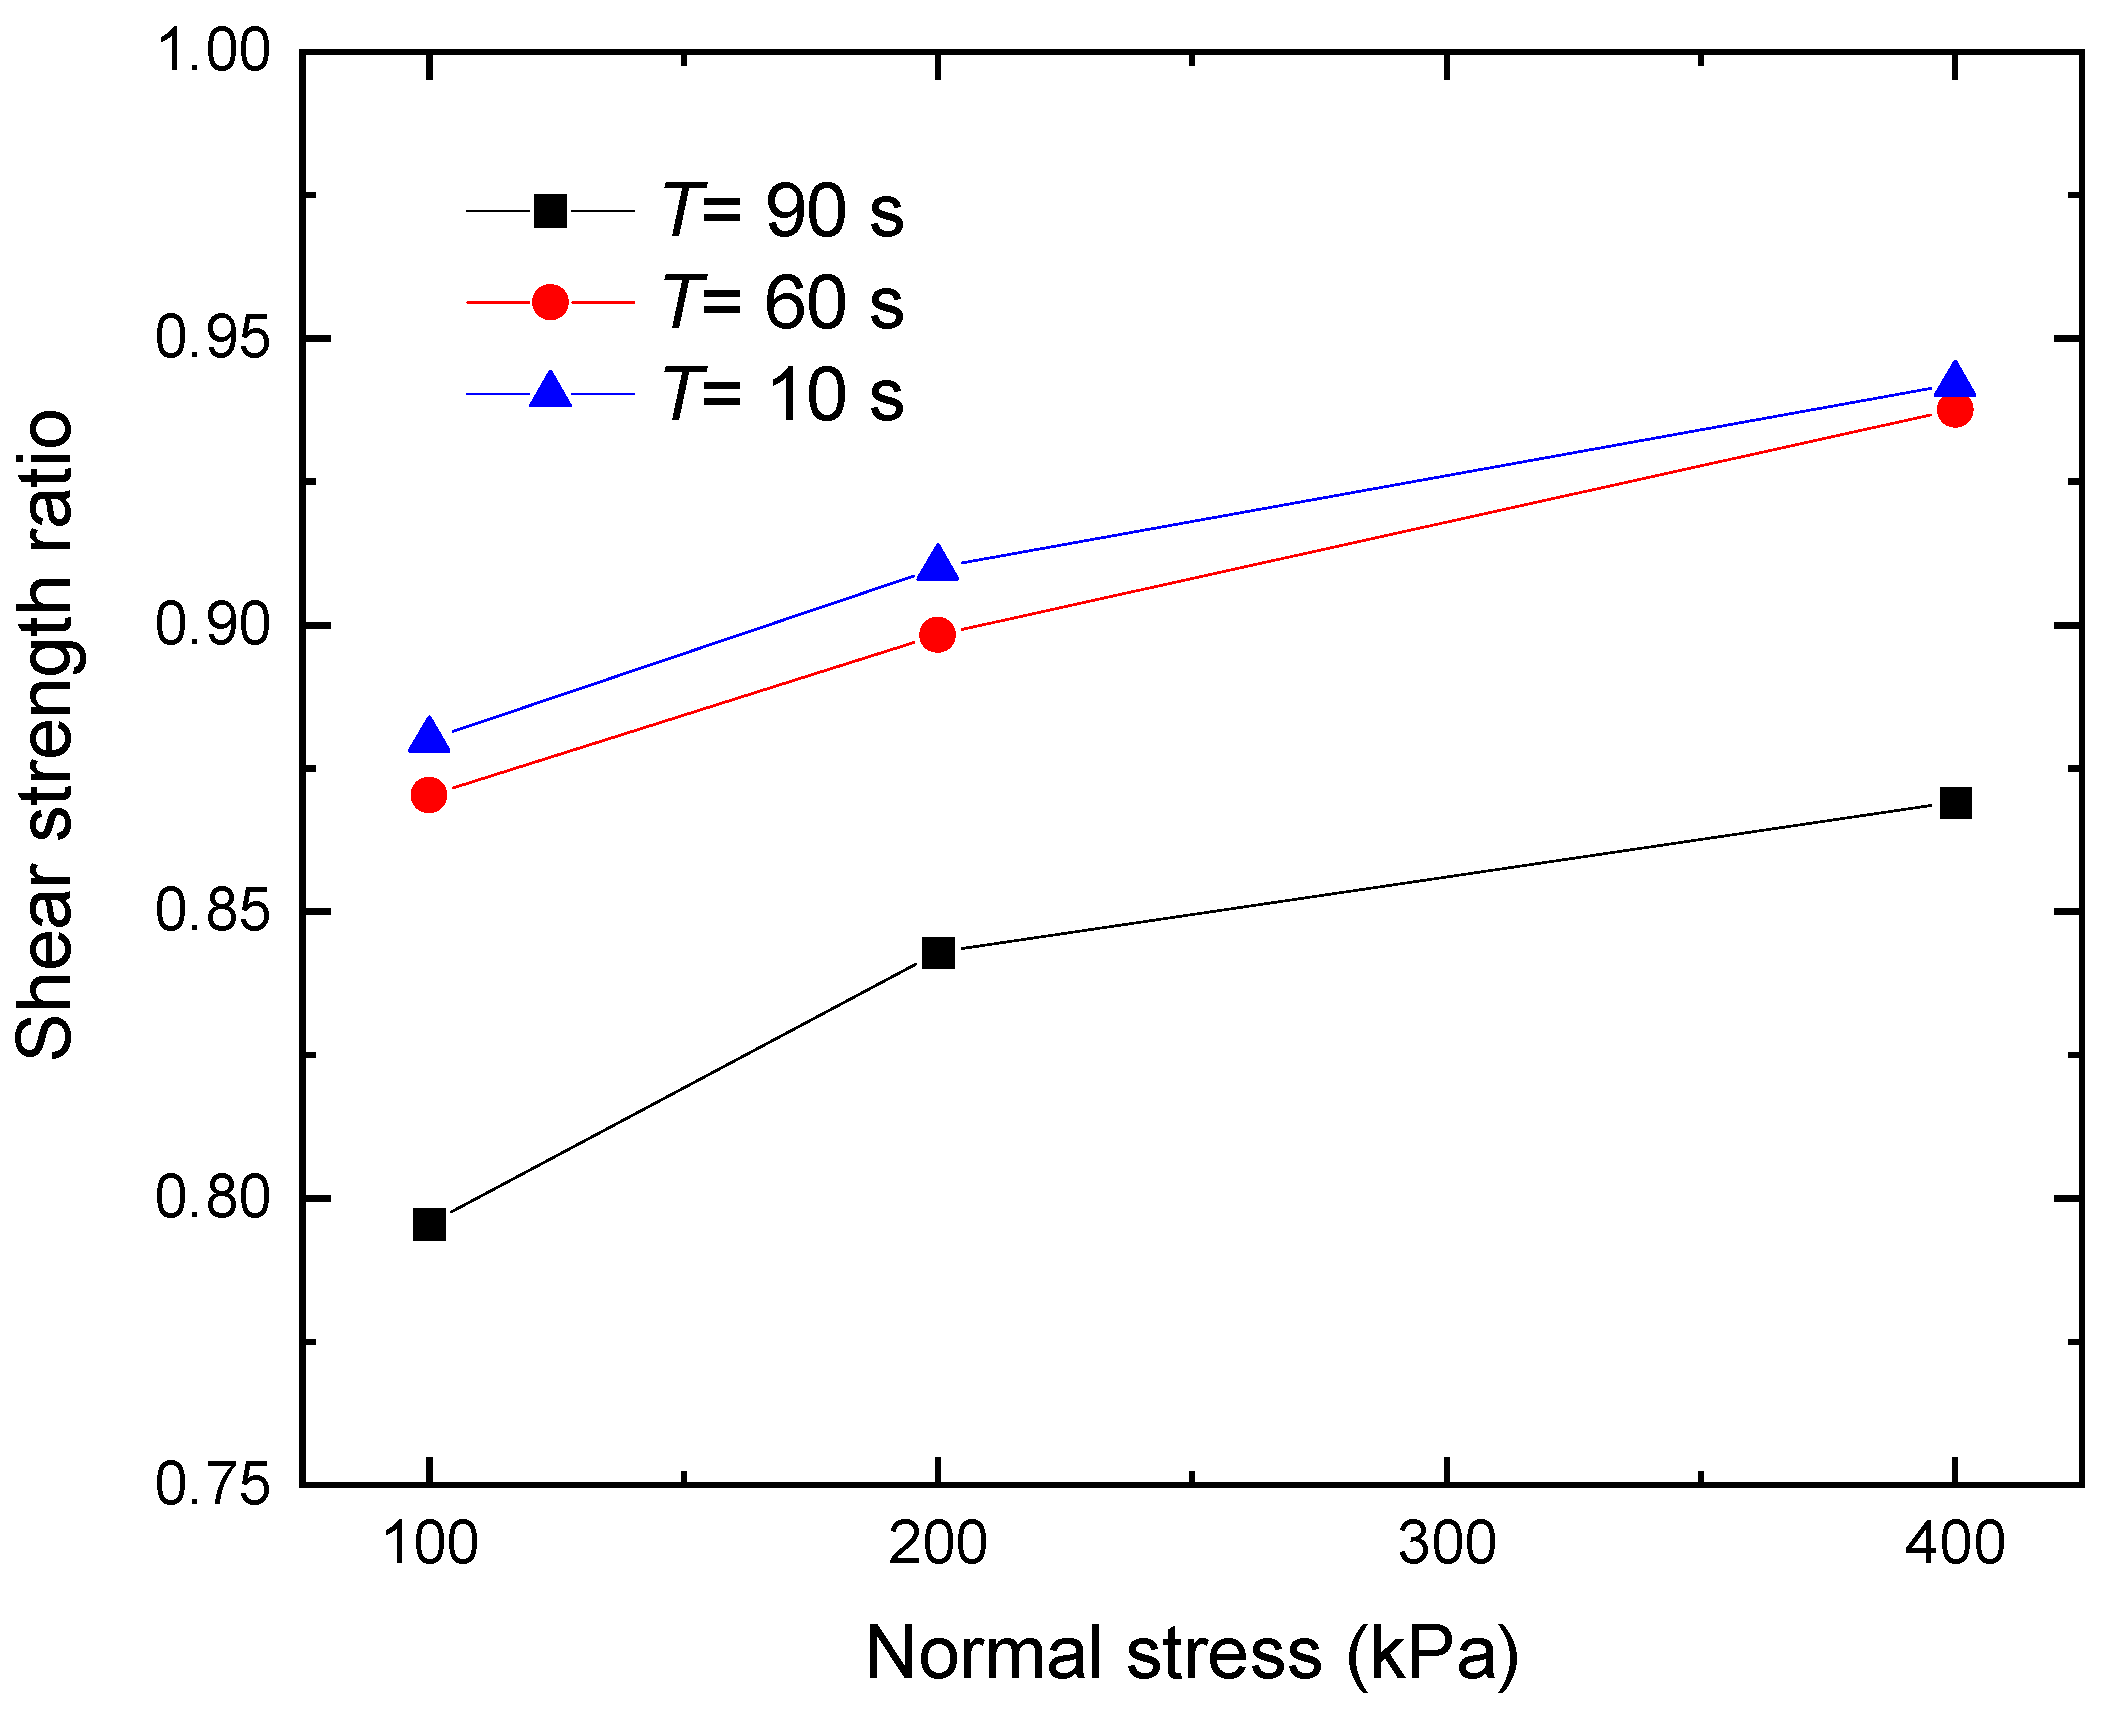
Figure 9 presents the dimensionless normalized shear strength ratio (fcm) as a function of the normal stress for the shear-zone soil under monotonic and cyclic loading. Apparently, the shear strength ratio of the shear-zone soil increases with increasing normal stress because of shearing contraction due to the rearrangement of soil particles. In addition, longer cyclic periods (T = 90 s) implies that the specimen is weaker and less resistant to the shear stress, due to the fatigue deteriorating effect of the cyclic stress. For example, the shear strength parameters of the shear-zone soil are c = 45.715 kPa, c = 43.185 kPa, c = 39.55 kPa, φ = 20.35°, φ = 20.00°, and φ = 20.06° under 10 s, 60 s, and 90 s, respectively. The shear strength ratio is in the range of 0.79–0.94 for shear-zone soil under different normal stress and cyclic loading periods.

4.3. Studying the Effect of Number of Cycles

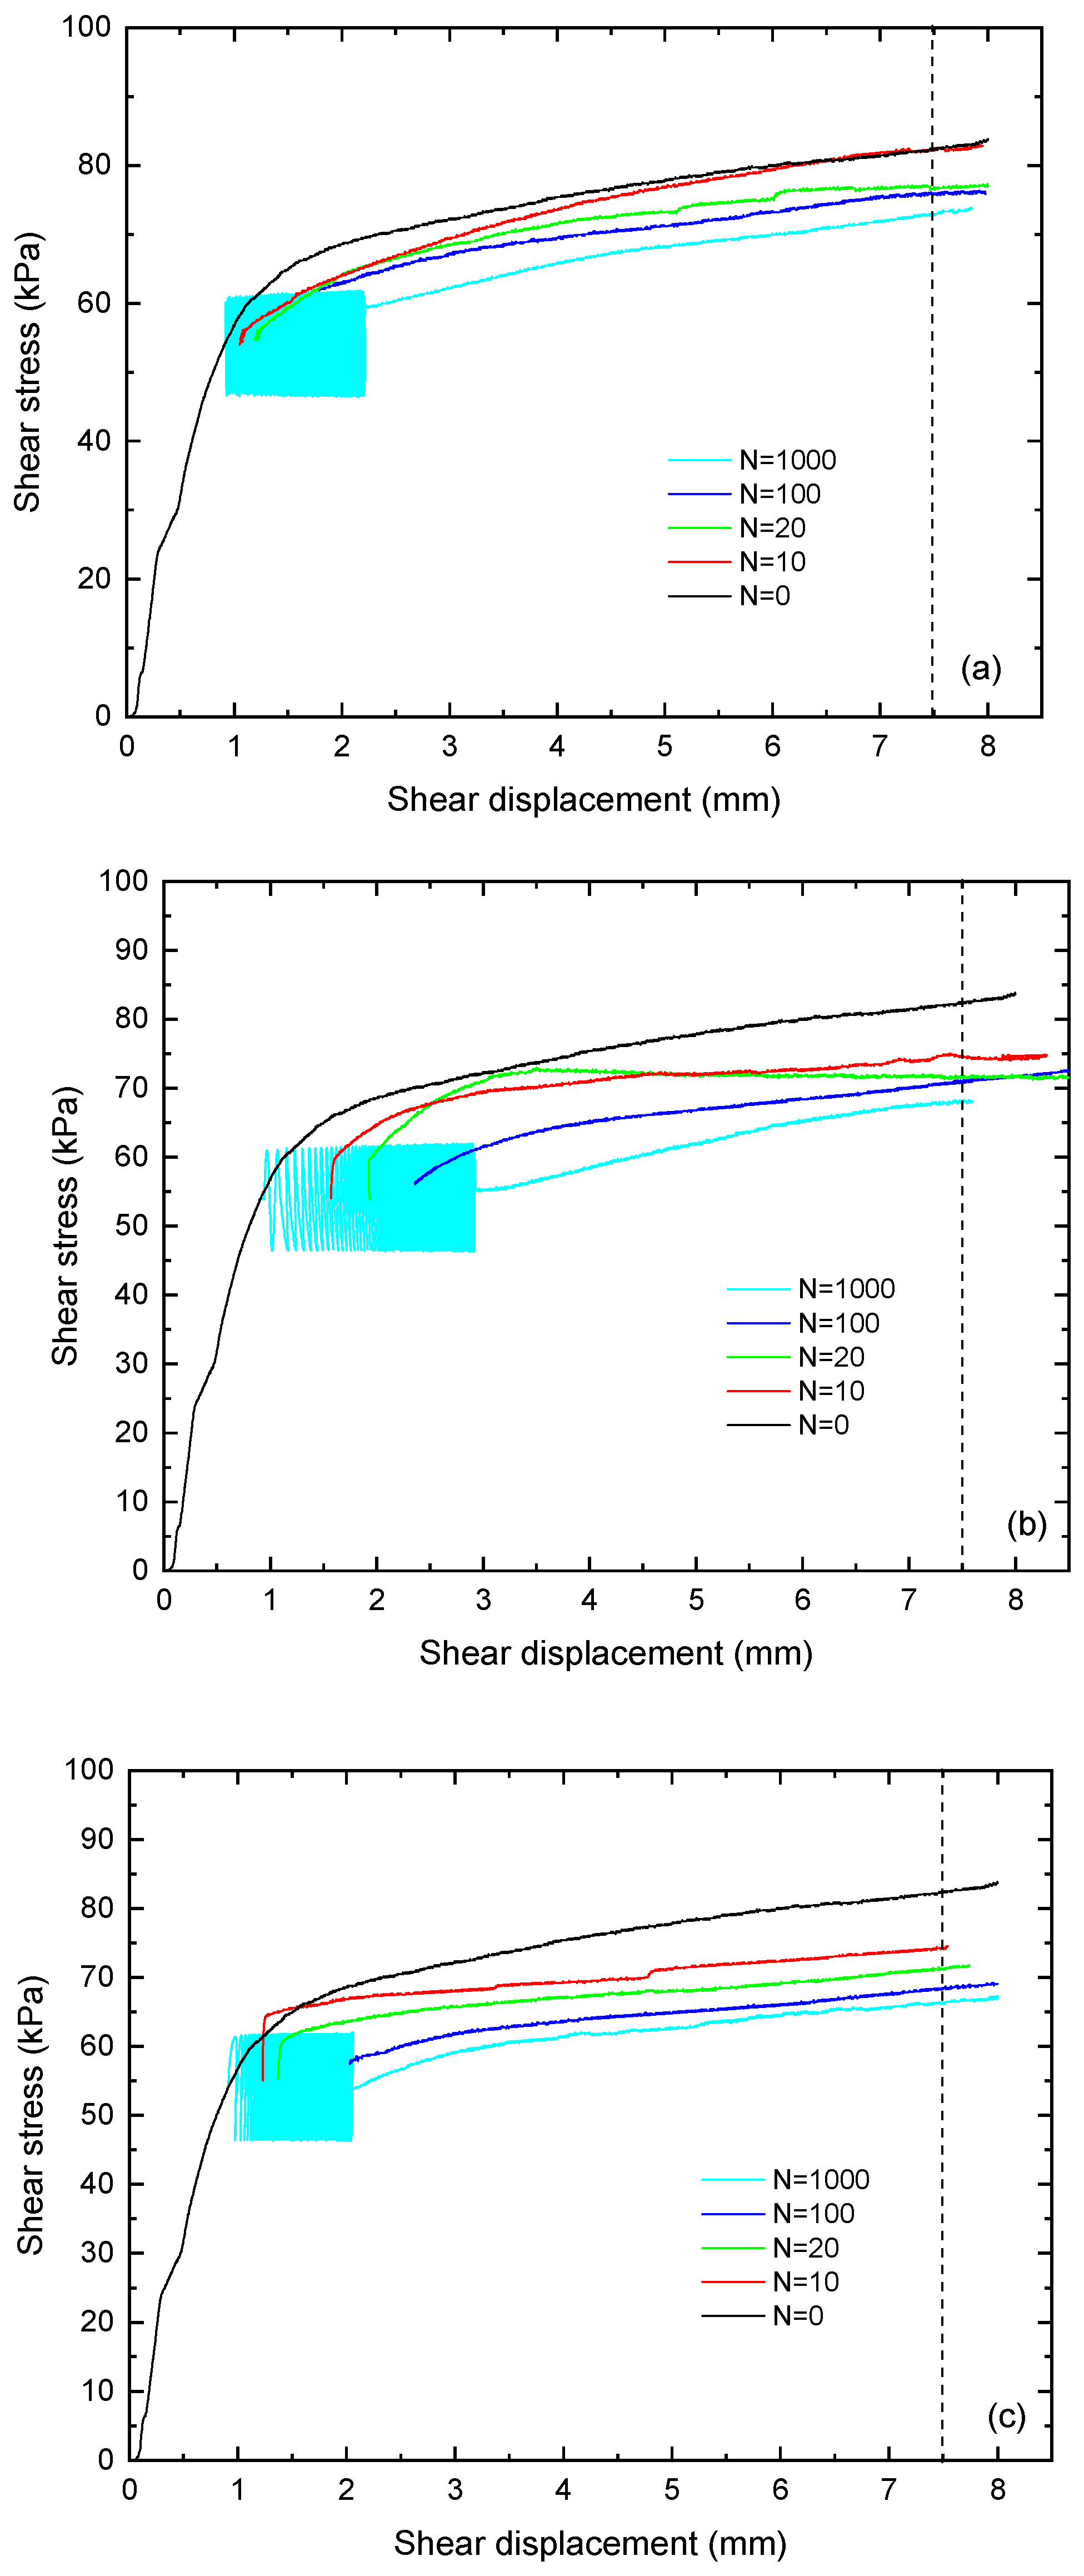
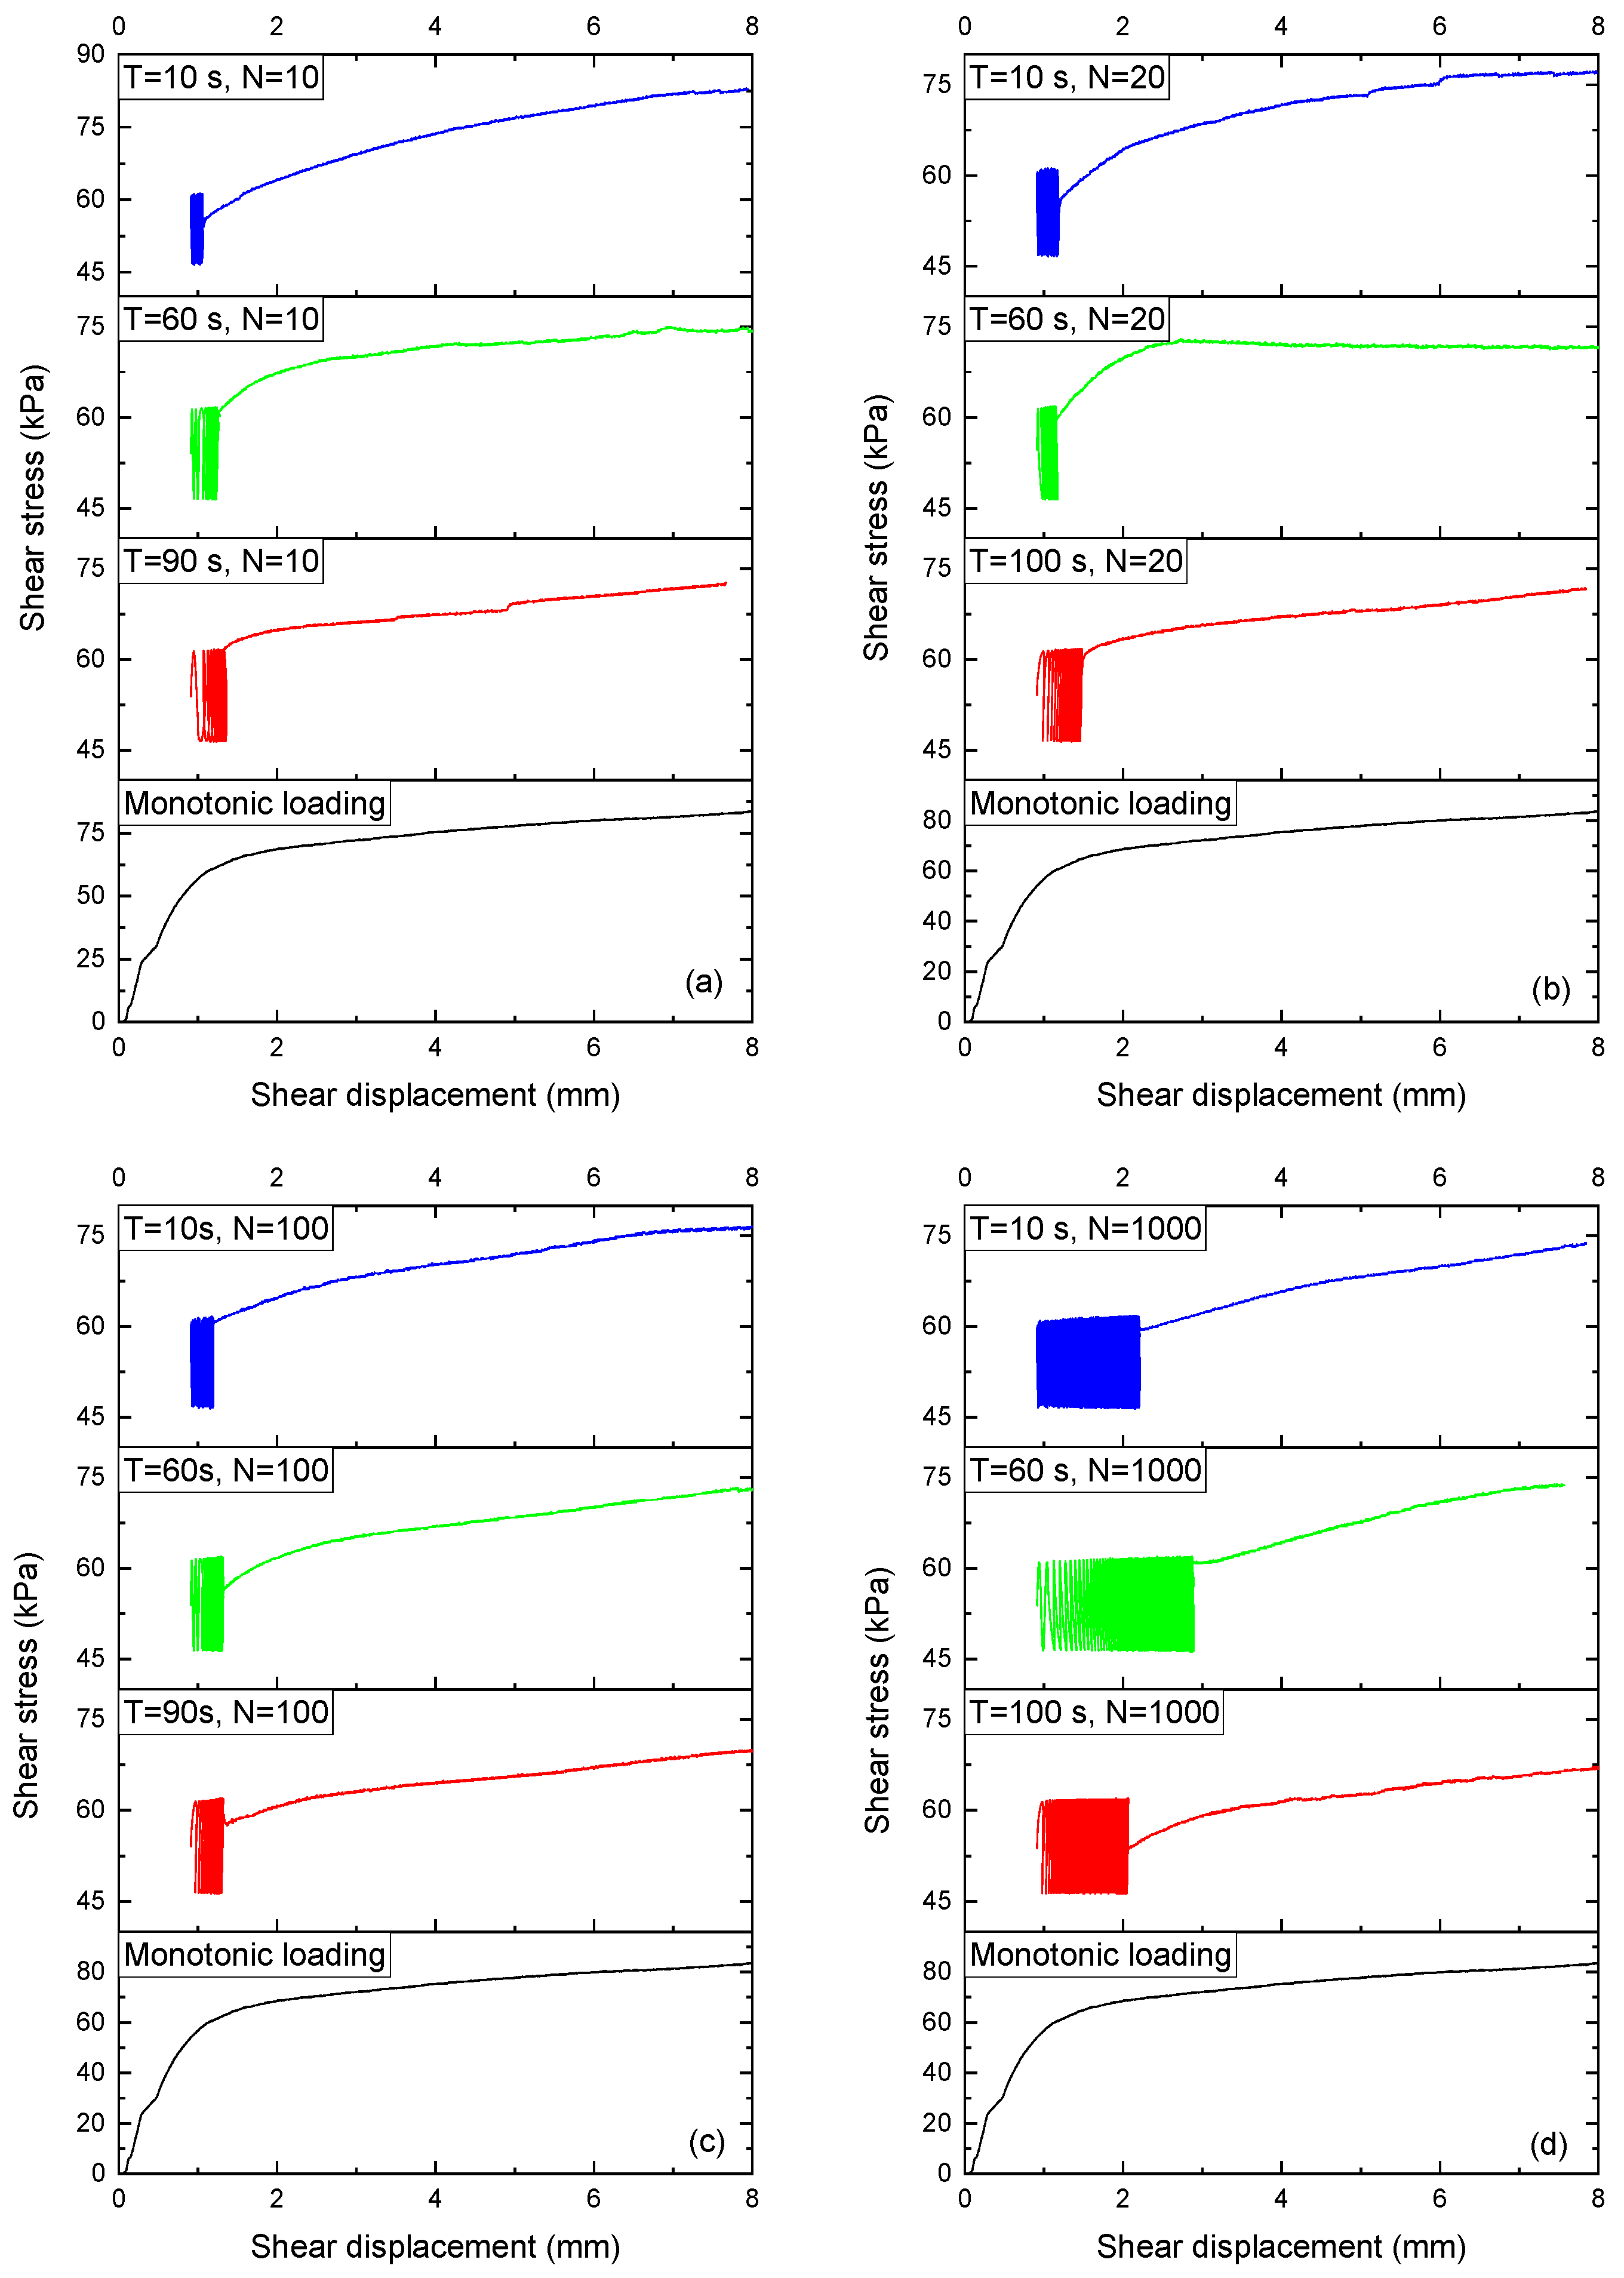
The shear-stress response of the shear-zone soil to a local stress-controlled cyclic direct shear test is illustrated in Figure 10. In this test, the shear-zone soil was applied to 0, 10, 20, 100, and 1000 cycles with the vertical pressure of 100 kPa and cyclic period of 10 s, 60 s, and 90 s. Figure 10a exhibits shear stress for steady loading and local cyclic loading as a function of shear displacement and illustrates the fact that increasing the number of cycles decreased the shear strength of the shear-zone soil under different numbers of cycles. With a cyclic loading application, the shear-zone soil hardened gradually, and then smaller displacements were produced by the same load amplitude. It is especially evident in Figure 10b that the maximum data of deformation were only 0.1 mm for the first cycle. This increased to 3.31 mm after 1000 cycles and was kept approximately constant.
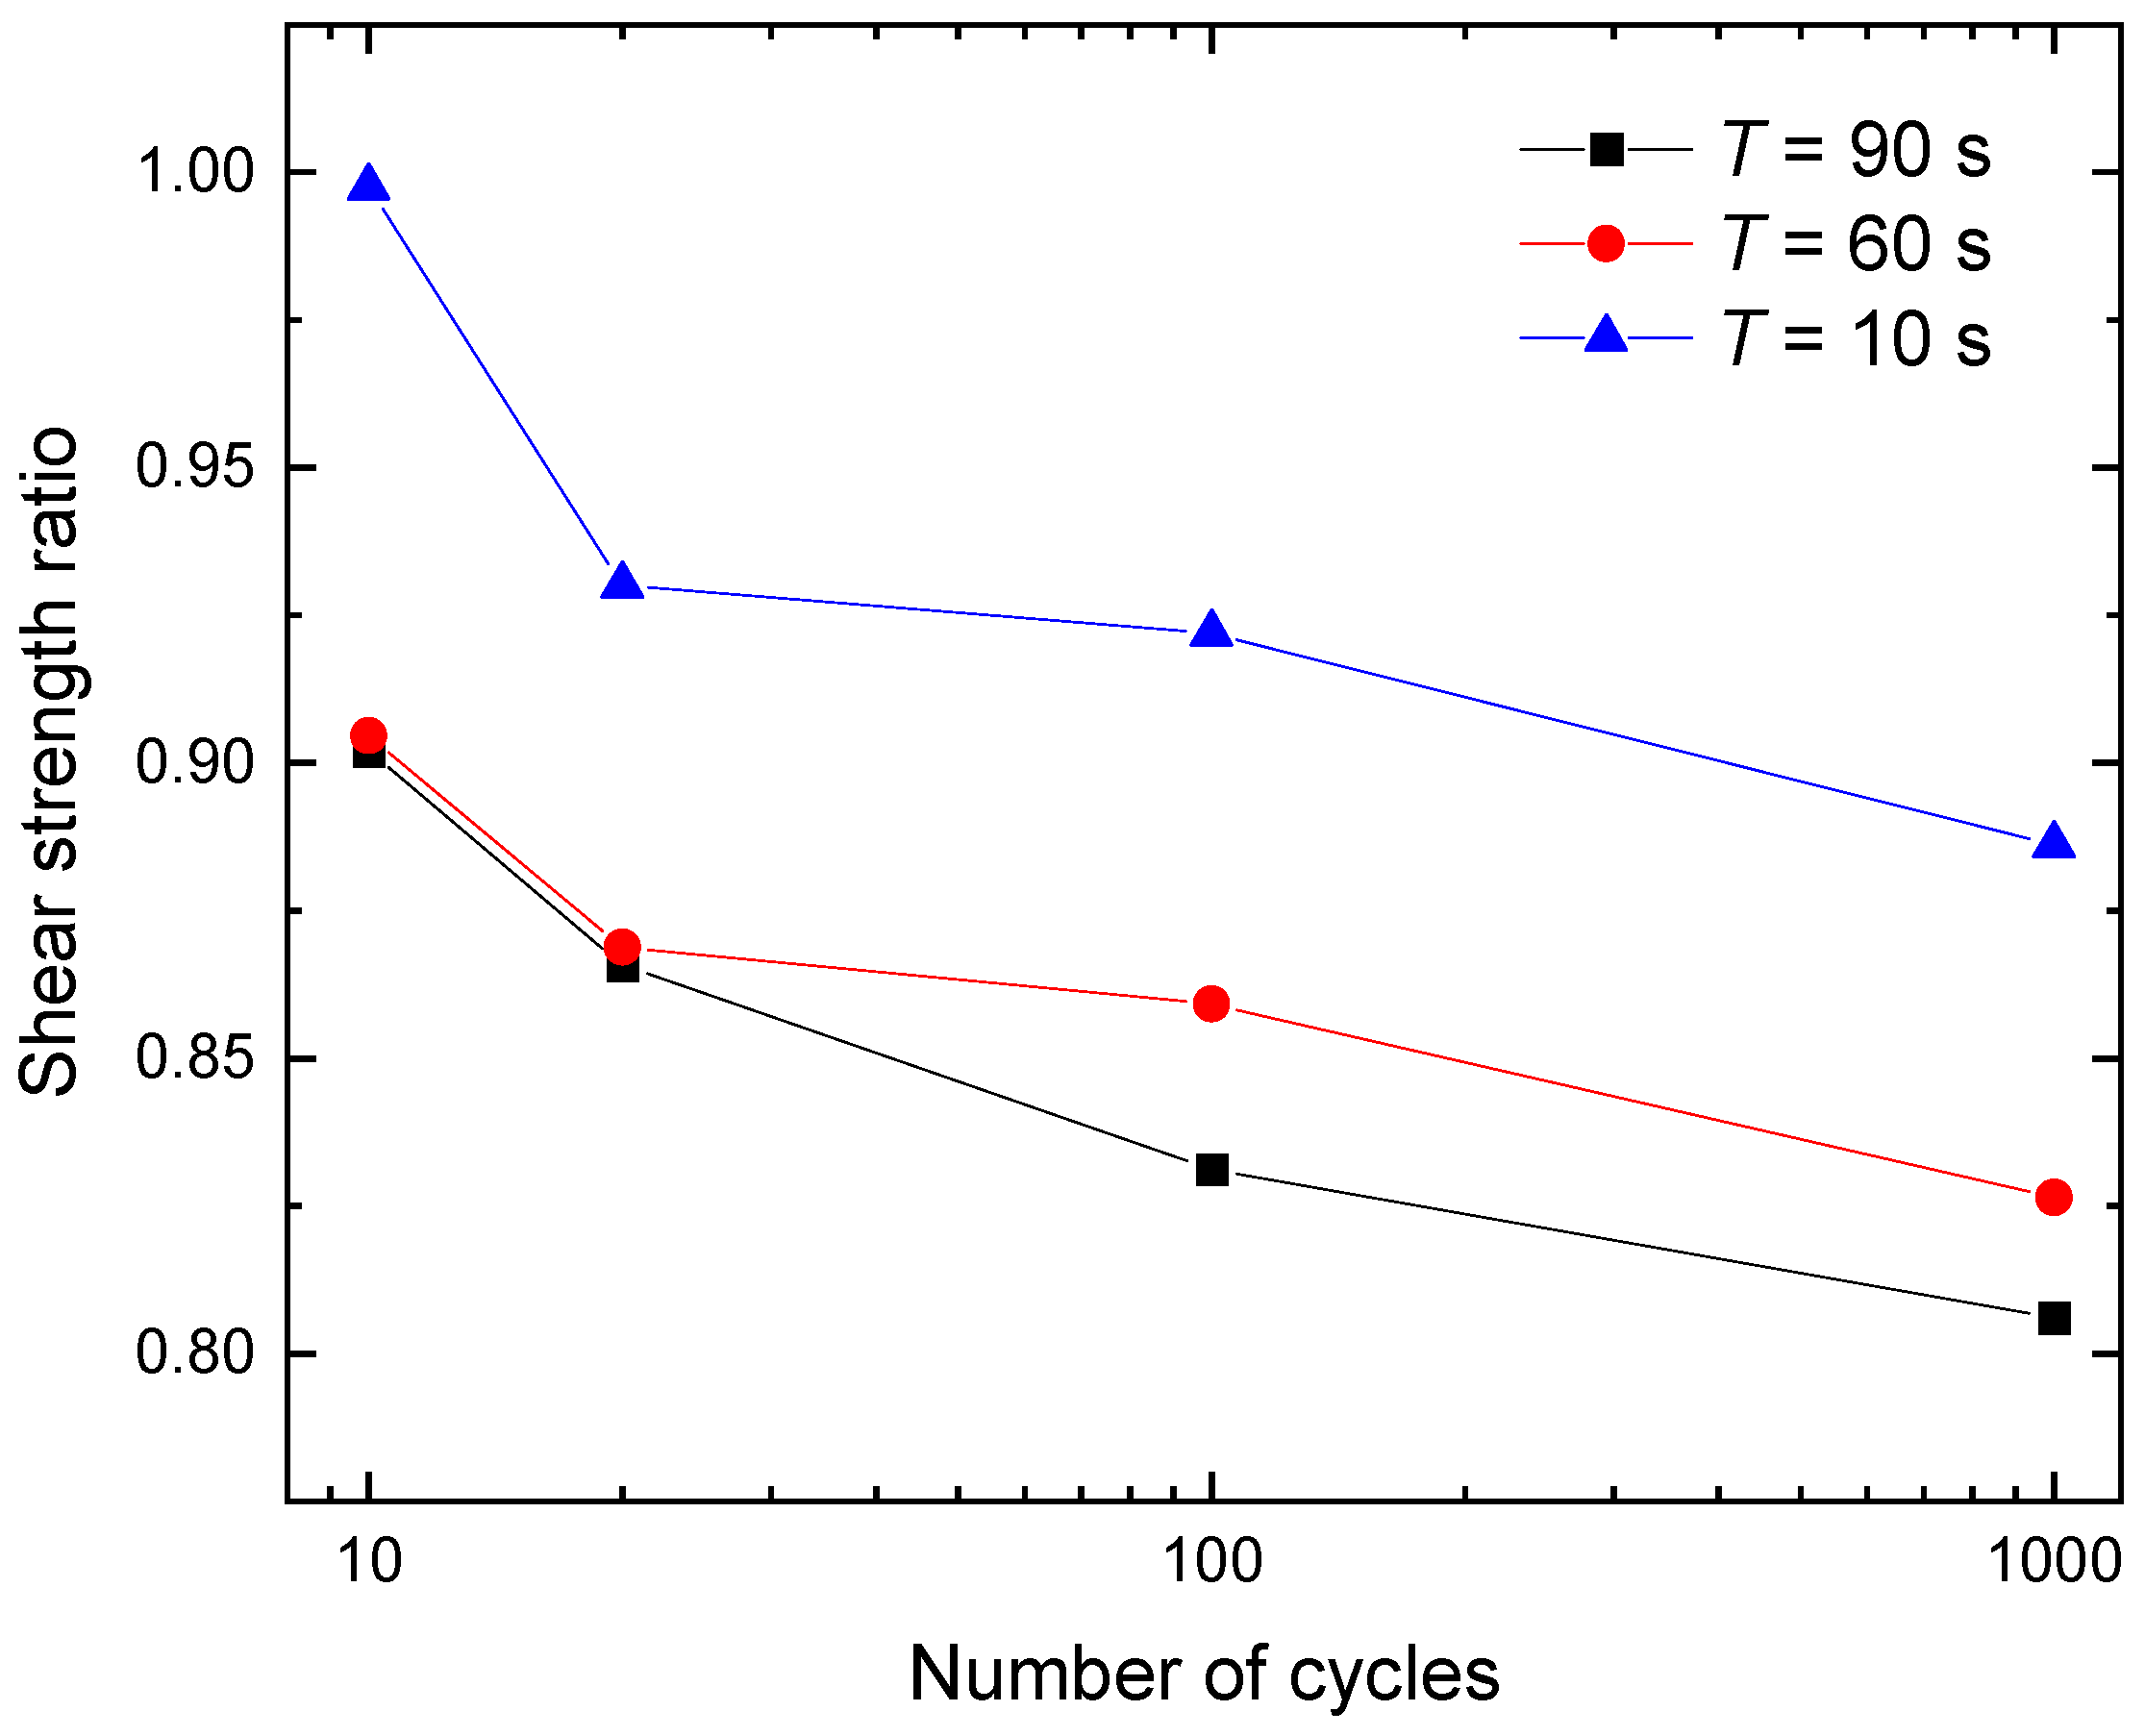
Figure 11 exhibits that the shear strength ratio decreased as the number of cycles increased because the plastic deformation and fatigue damage of the specimen increased with the number of cycles. In other words, the plastic deformation did not disappear until a great number of cycles had been completed.

4.4. Studying the Effect of Cyclic Period

Figure 12 exhibits the relationship between shear stress and shear displacement after different numbers of cycles at different cyclic periods of 10 s, 60 s, and 90 s. It is apparent that the shear stress was lower for local cyclic loading under different cyclic periods than that for monotonic loading because of fatigue deterioration. It is also found that the cyclic shear stress decreased with a decrease in the cyclic period due to faster plastic deformation.
The cumulative shear displacement of the specimen under different cyclic periods increases nonlinearly with time, from the large to the small. Under vertical stress of 100 kPa, the change of shear deformation after 40 cycles of loading was virtually insignificant at cyclic periods of 90 s, 60 s, and 10 s, respectively.
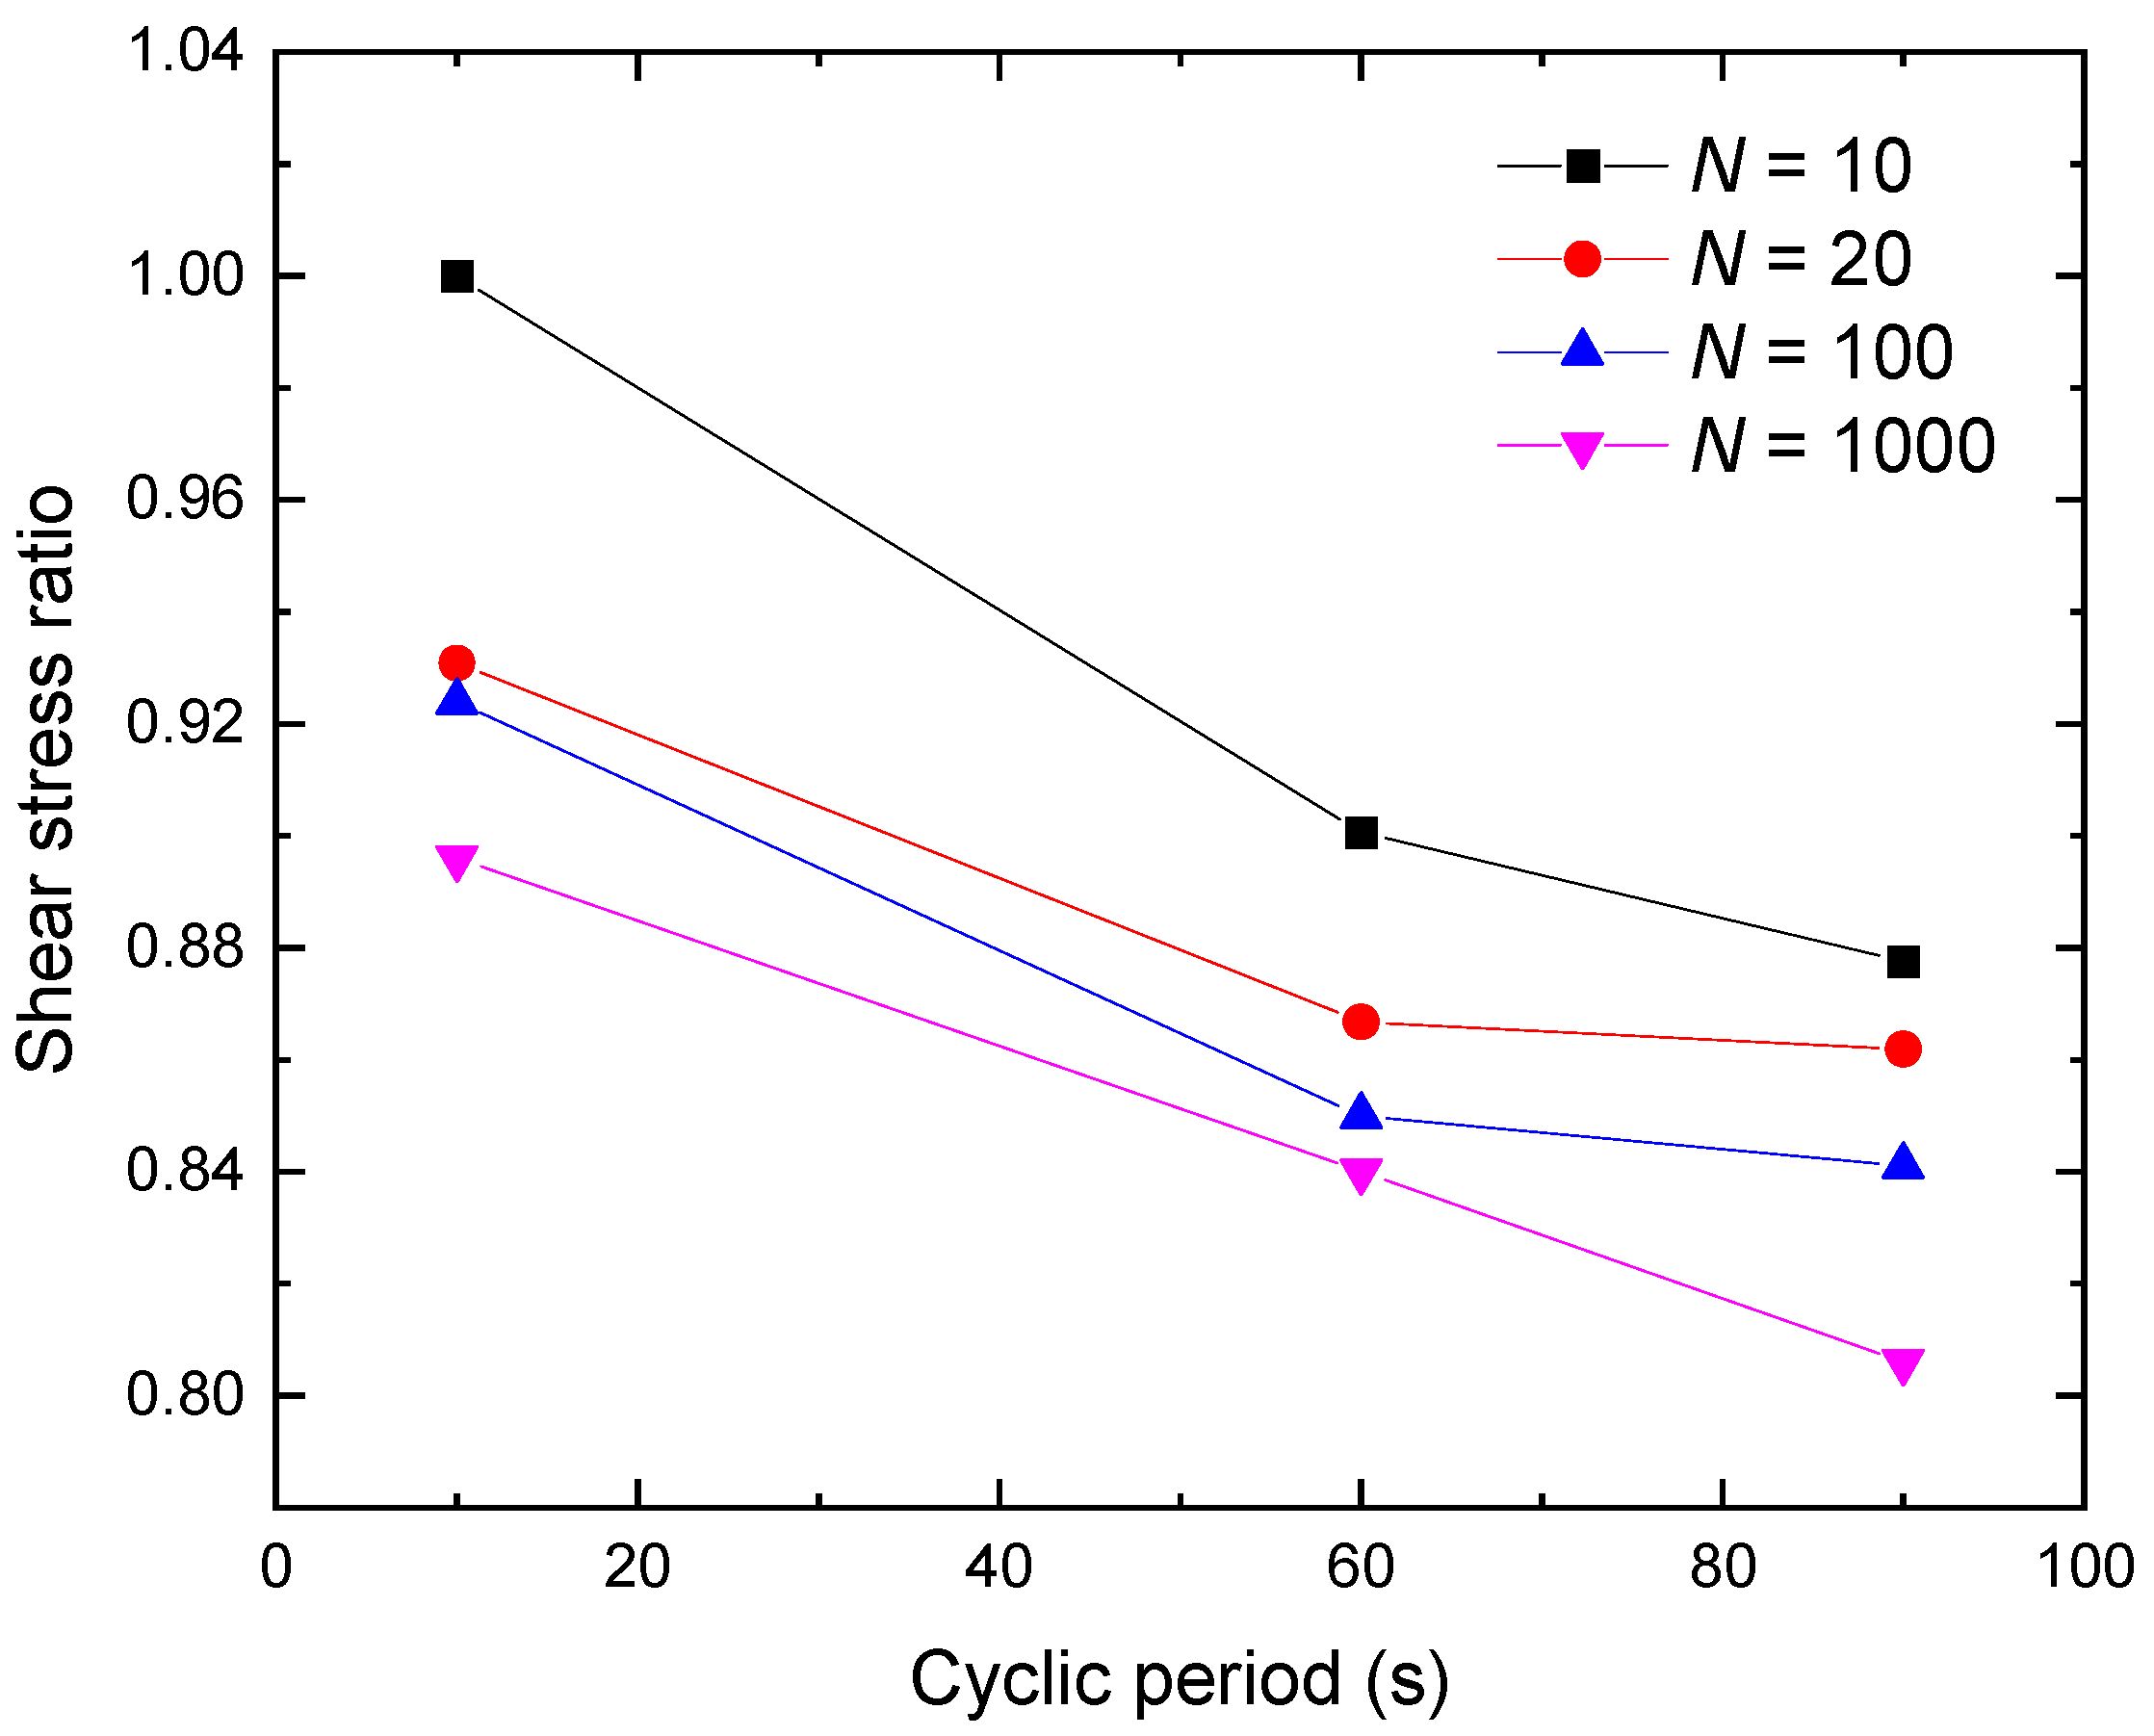
Figure 13 shows the shear strength ratio in relation to the cyclic period for shear-zone soil with different numbers of cycles. The shear strength ratio decreases with the increasing cyclic period. After 1000 cycles, the cyclic strength attained was 18.27%, 15.04%, and 12.73% smaller than the shear strength under monotonic loading, with cyclic periods of 90 s, 60 s, and 10 s, respectively.

5. Discussion

5.1. Effect of Cyclic Loading on Shear Displacement

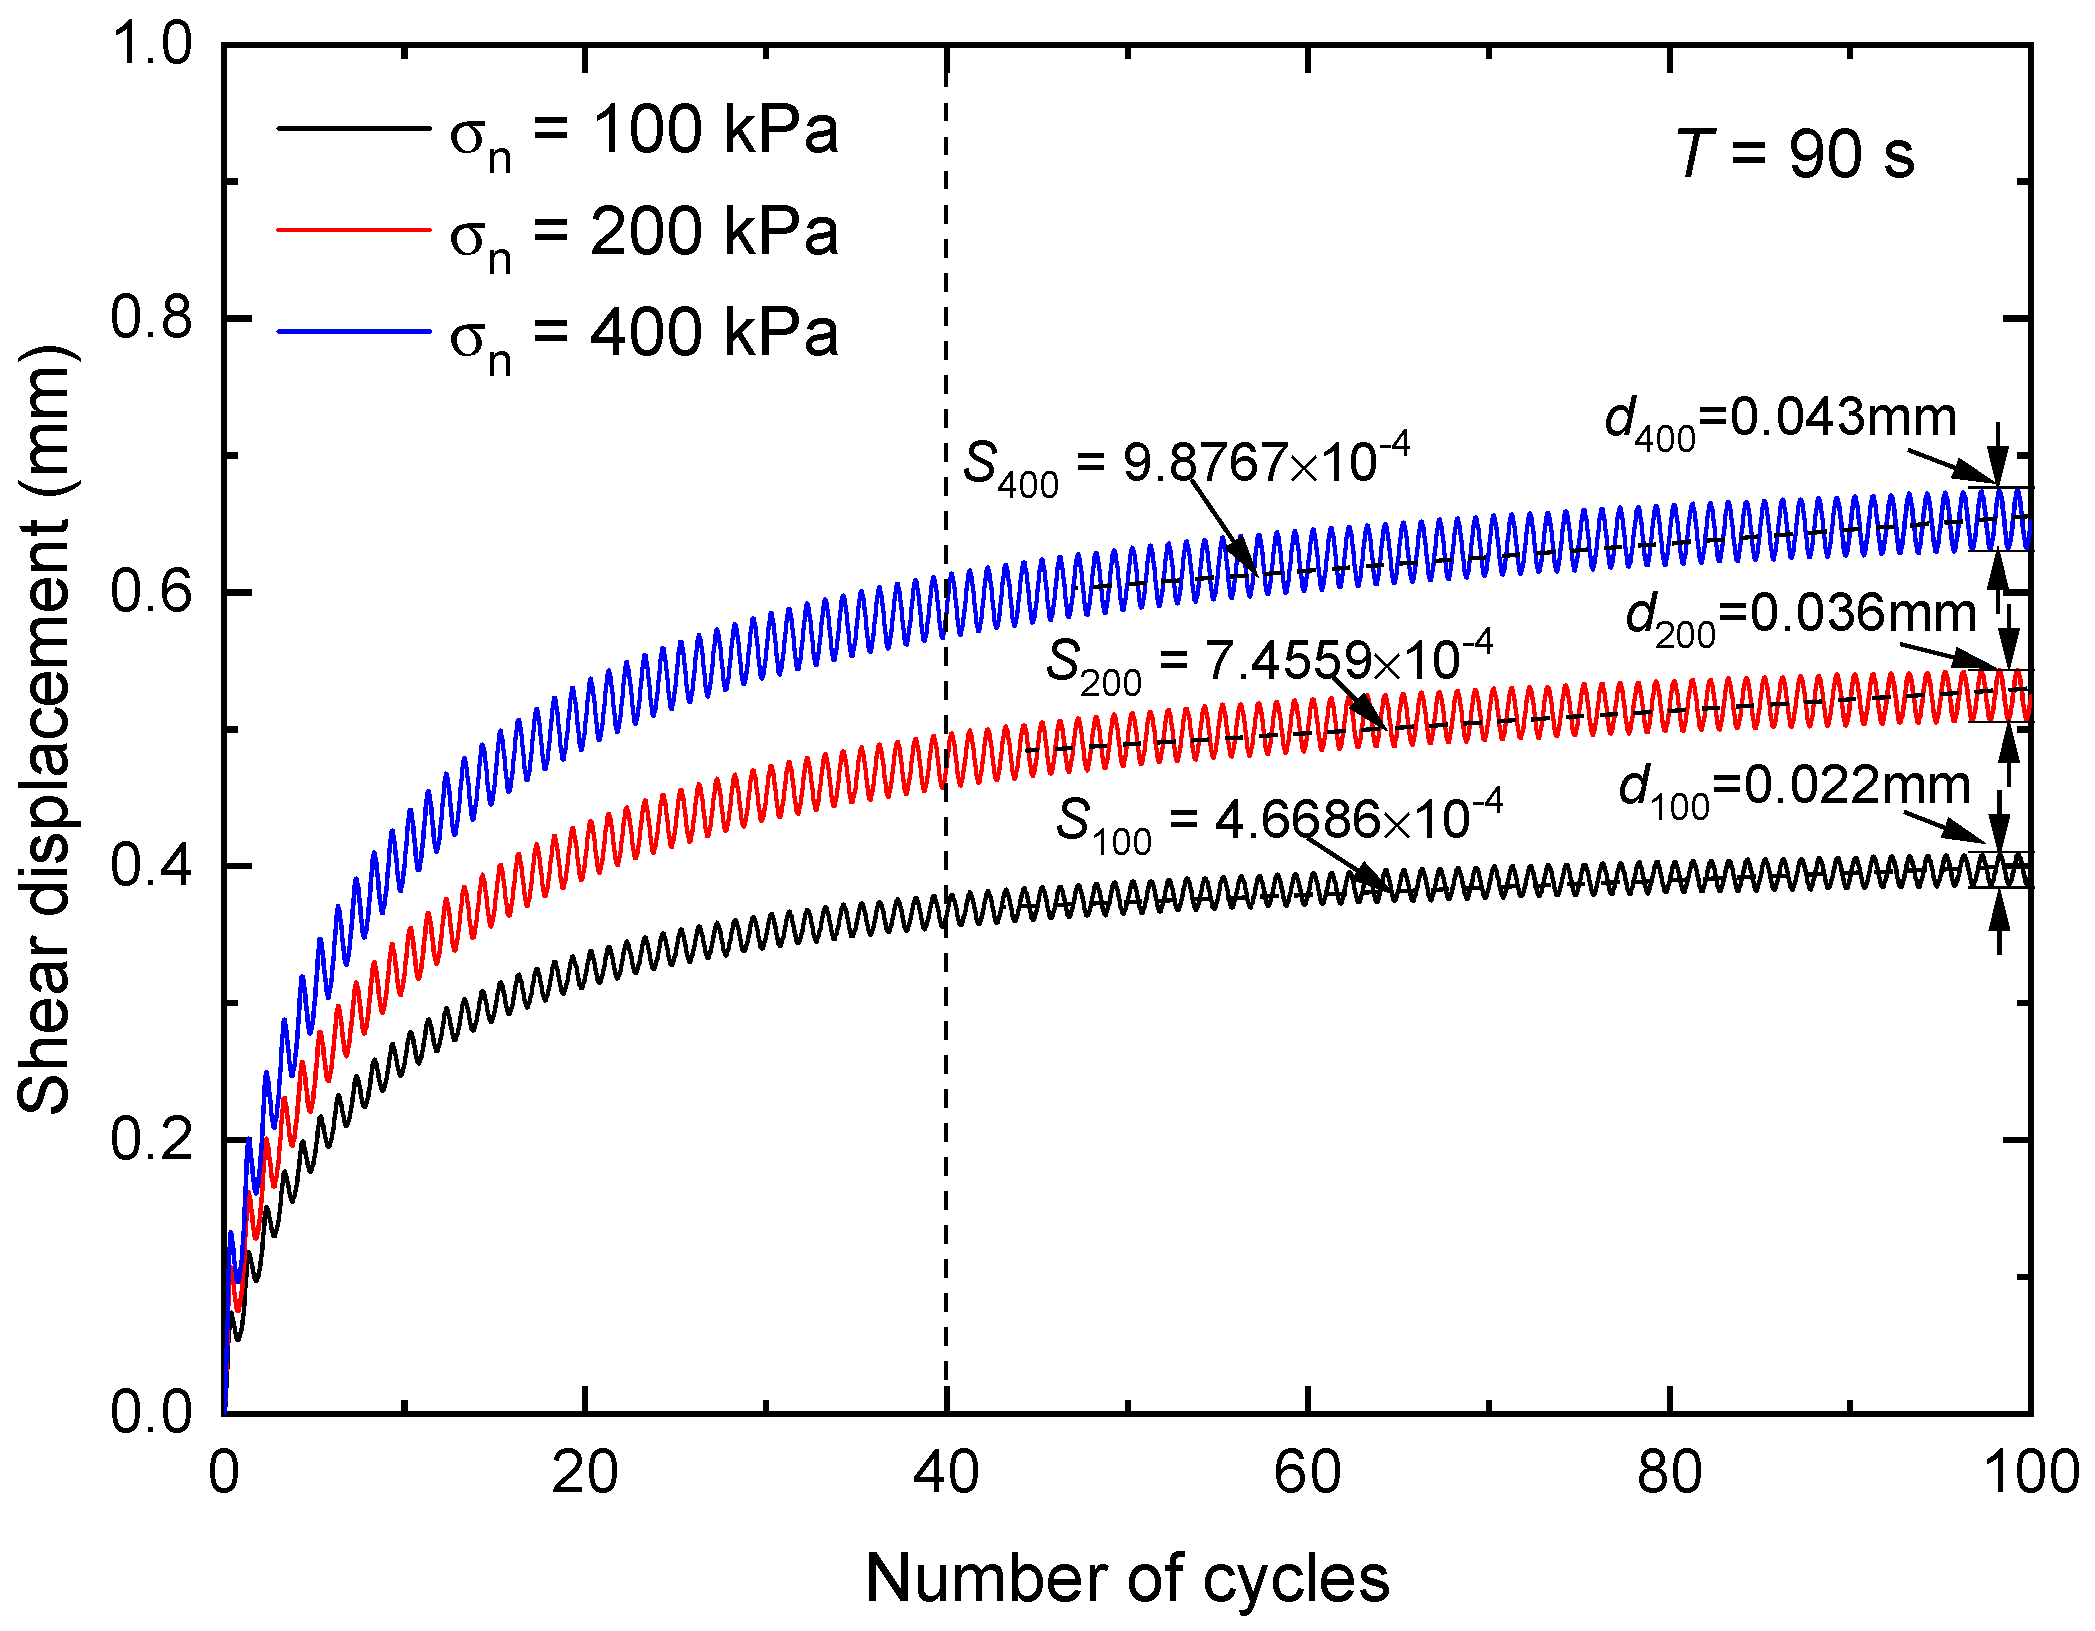
Figure 14 compares the shear displacement obtained by local load-controlled cyclic loading tests with the same cyclic period (90 s) but different normal stresses. Under different vertical stresses, the differentiation of shear deformation after 40 cycles of loading was slight and virtually insignificant. Obviously, the shear displacement–cyclic number curve can be separated into two parts. The first part is from the beginning to the 40th cycle, regarded as the initial stage of shear displacement. At this stage, the accumulative shear displacement increases evidently with an increase in the cyclic number, especially in the initial cycles. The second part is from the 40th cycle to the end, regarded as the steady stage. Moreover, the shear displacement increases very slowly at this stage.
However, each shear displacement responded differently to the number of cycles during the local cyclic loading of the second part. The slopes of the mean cyclic path (S100, S200, and S400) increased slightly from 4.6686 × 10⁻⁴ to 9.88797 × 10⁻⁴, but the cyclic displacement amplitudes (d100, d200, and d400) increased near two times, from 0.022 mm to 0.043 mm, with an increase in normal stresses. At a given cyclic period and number of cycles, the imposed normal stress plays a major role in local cyclic displacement, as previously noted by Pra-ai and Boulon [30].
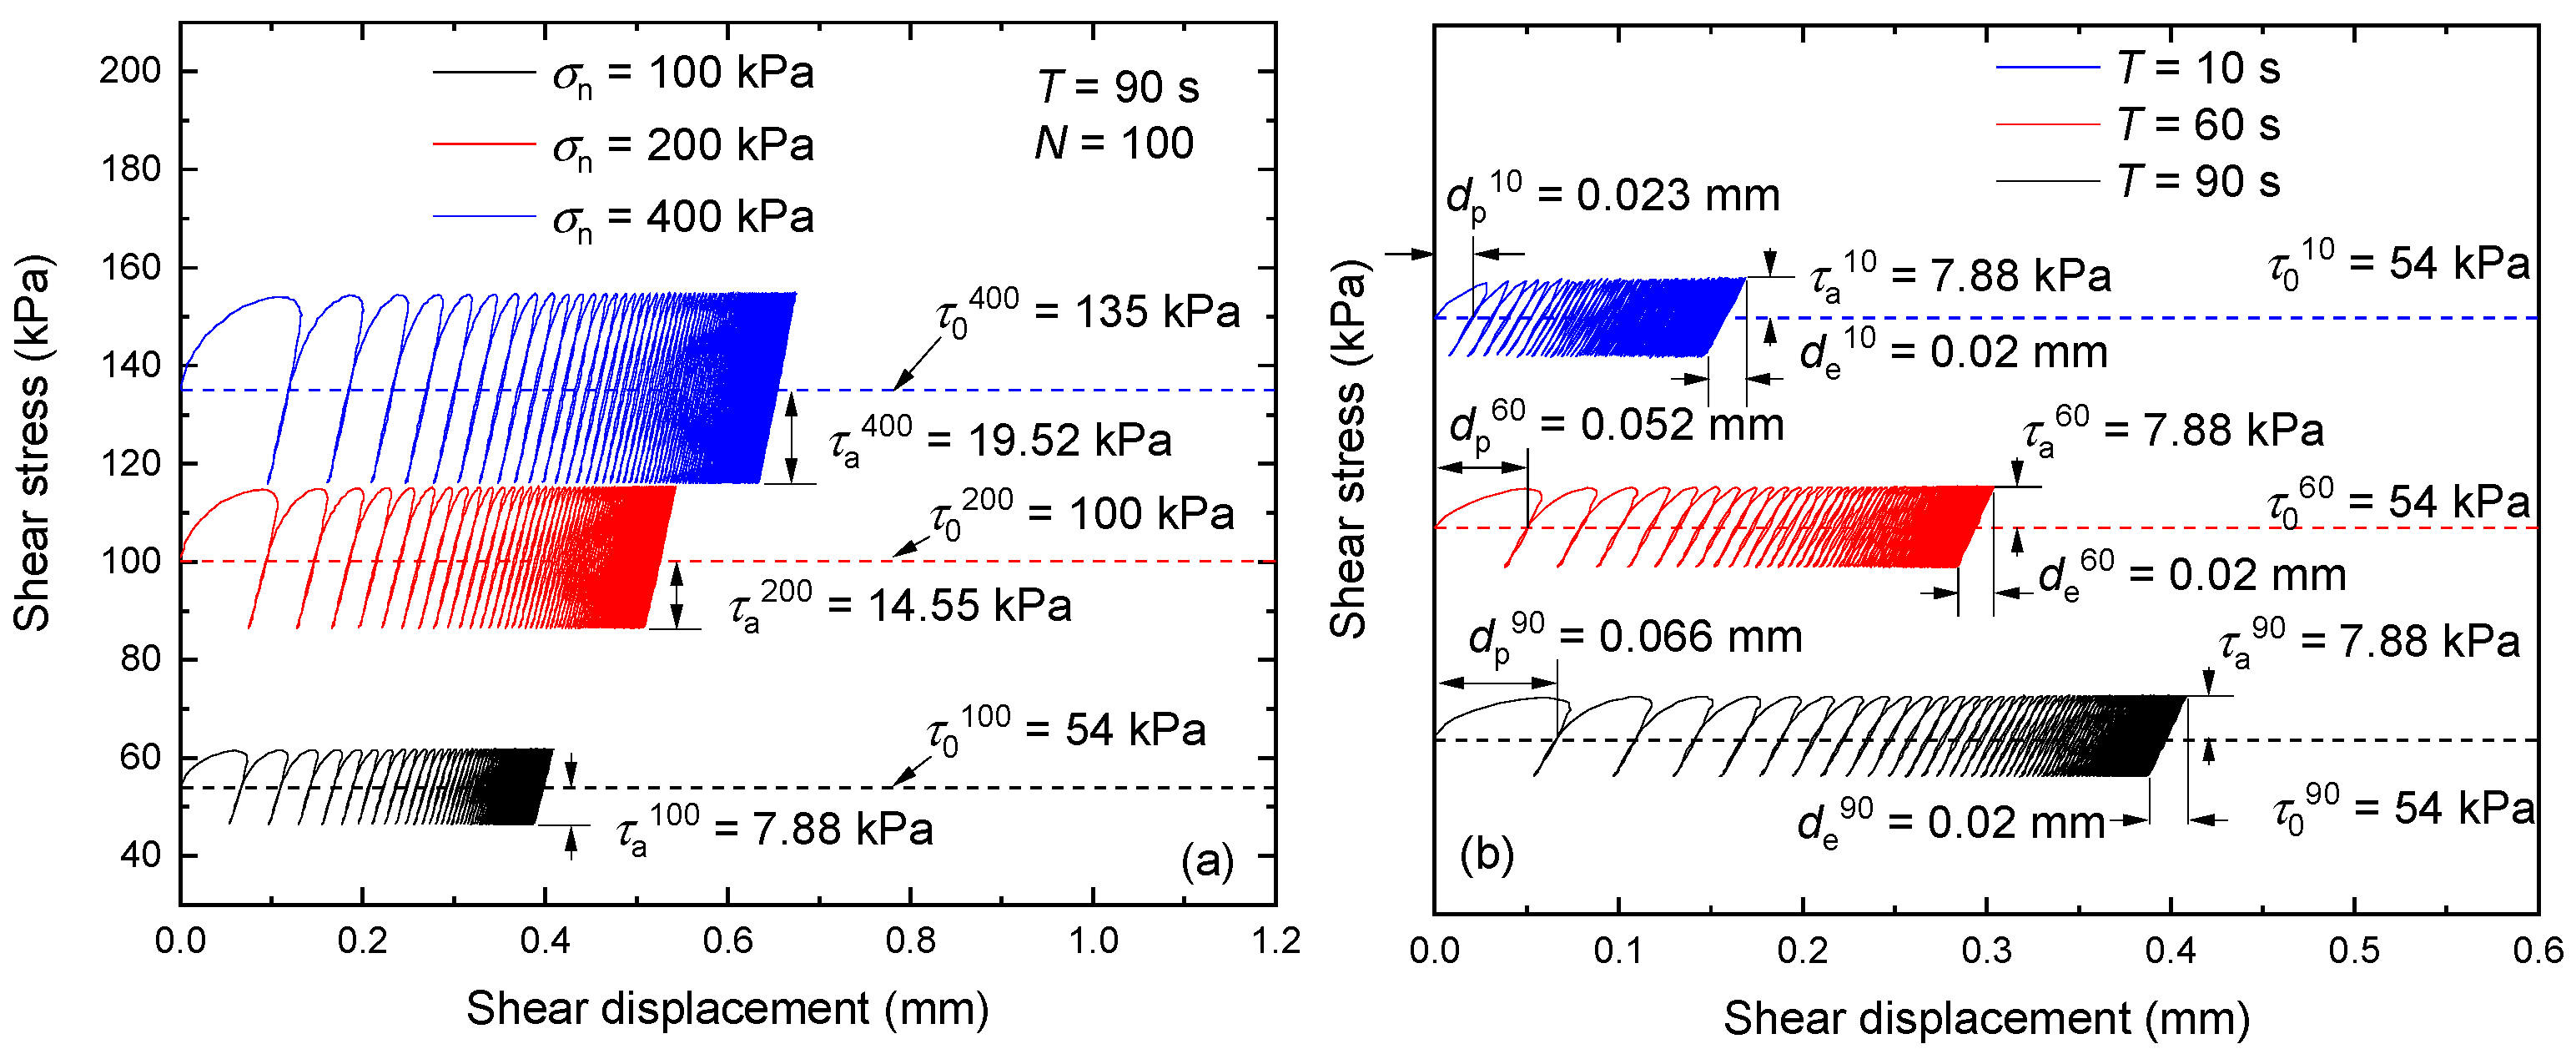
Figure 15 presents the cyclic shear stress behavior of the shear-zone soil with varying normal stress and cyclic periods. As shown in Figure 15a, the increasing vertical stress increases the amplitude of the cyclic shear stress, τa. At vertical stress of 100 kPa, the shear stress of the mean position is τ0100 = 54 kPa and the amplitude of the cyclic shear stress is τa100 = 7.88 kPa, whereas the shear stress of the mean position and the stress amplitude increase to τ0400 = 135 kPa and τa100 = 19.52 kPa under normal stress of 400 kPa.
Figure 15b shows the samples manifest diverse shear response patterns at varying cyclic periods under vertical stress of 100 kPa. The shear displacement increases with the increasing cyclic period and is composed of two different parts: elastic displacement de and plastic displacement dp. In the first cycle, the plastic displacement dp1 increases from 0.023 mm to 0.066 mm as the cyclic period increases from 10 s to 90 s. However, in the last cycle, the plastic displacement drops to zero and the elastic displacement tends to become a stable constant de = 0.02 mm. Even though the specimen is sheared under cyclic periods of 10 s, 60 s, and 90 s, the elastic displacements of the shear-zone soil finally approach the same value under a stable mean position and amplitude of the cyclic shear stress.

5.2. Effect of Cyclic Loading on Volume change

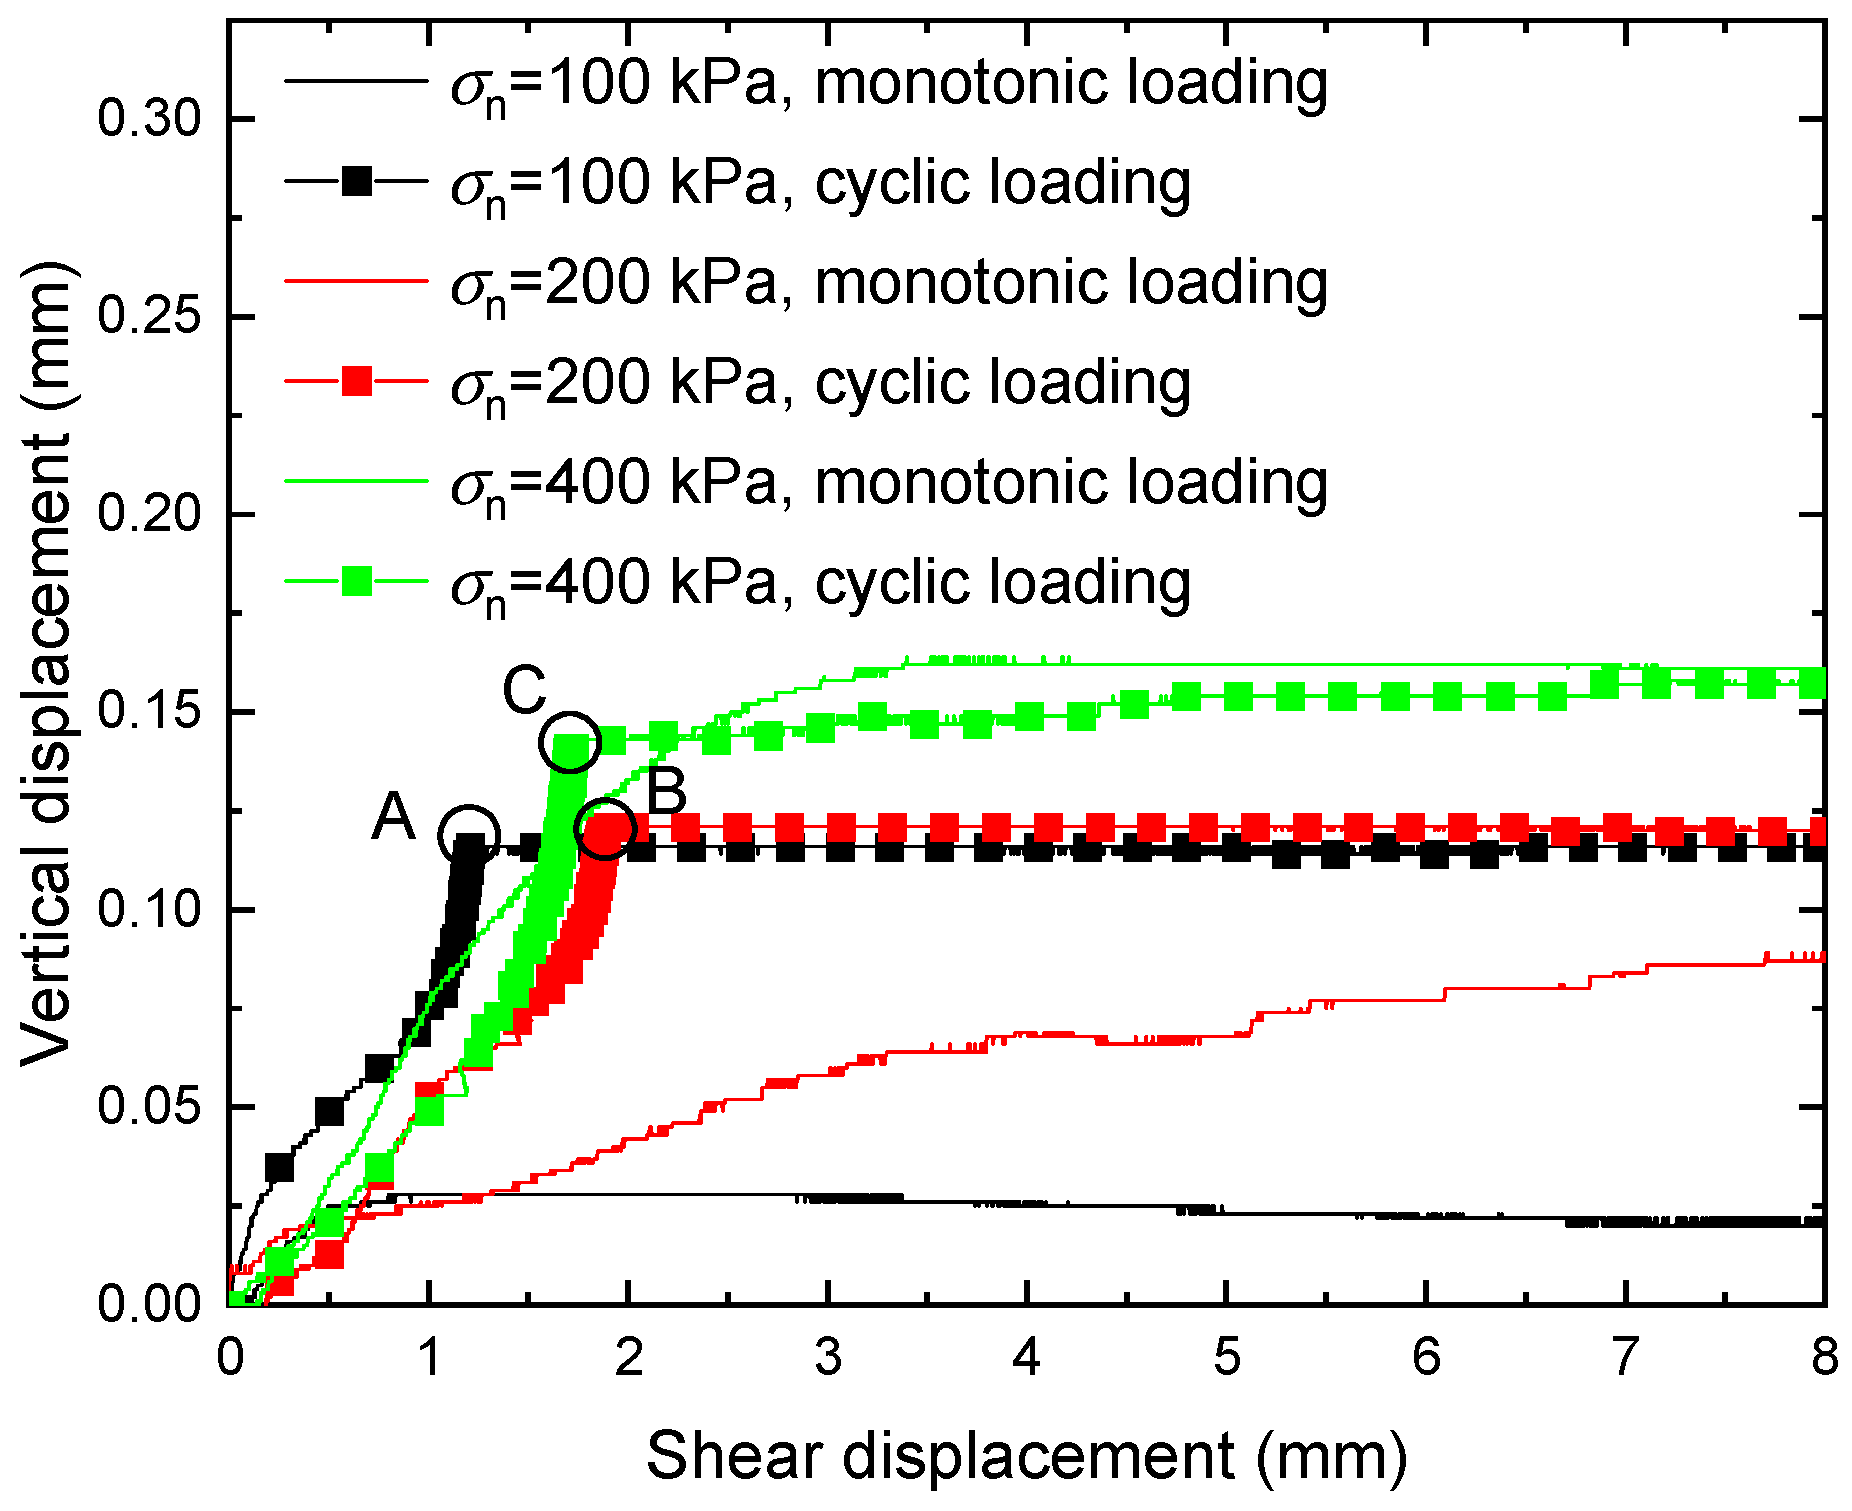
The vertical displacement–shear displacement curves of shear-zone soil under monotonic and cyclic loading, plotted in Figure 16, show a contraction characteristic that increased with increasing normal stress from 100 to 400 kPa. However, for lower vertical stress (100 kPa) under monotonic loading, the shear-zone soil initially presented a contractile behavior at 0.84 mm, such as that examined at the higher stress (200 kPa and 400 kPa), and then reversed to show a dilation until the end of the test. During shearing of the shear-zone soil, the macroscopic shear surface is horizontal, but sliding between single particles happens on multiple microscopic surfaces inclined at different angles near the horizontal, showing dilation or contraction. These observations were consistent with those of the sand interface under a direct shear test [31], which also reveals that the specimen exhibited a contraction phase followed by a dilation phase.
The volume change induced by a cyclic shear test increased with increasing shear displacement [32]. For the cyclic loading curves with 100 cycles at a cyclic period of 90 s under different normal stress, the volume change initially increased slightly at near 1 mm horizontal displacement but increased sharply under local cyclic loading from 0.05 mm to 0.116 mm (circle A), 0.121 mm (circle B), and 0.141 mm (circle C). However, at the second monotonic direct shear stage (III stage), the variation of the volume change was almost insignificant. Thus, for slow-moving reservoir landslides in the TGR, the horizontal displacements are more sensitive than the vertical ones after suffering local cyclic loading [33].

6. Conclusions

In this paper, the stress–strain behaviors of shear-zone soil obtained from the Huangtupo landslide in the TGR area were characterized through monotonic and local cyclic direct shear tests under different normal stress, cyclic periods, and numbers of cycles. Based on the detailed analysis and interpretation of the cyclic shear test results, the following conclusions can be drawn:
  • The shear strength ratio fcm of shear-zone soil from monotonic and local cyclic direct shear testing depends on the normal stress and cyclic shear stress. As the normal stress increases, the shear strength ratio fcm grows almost linearly with different cyclic periods. The shear strength of shear-zone soil after applying local cyclic loading is smaller than that of monotonic loading because of ratcheting behavior and fatigue deterioration.
  • In a local cyclic loading direct shear test, the shear failure stress of shear-zone soil decreases with an increase in the number of cycles and a decrease in the cyclic periods. In a local load-controlled cyclic loading test (stage II), the shear displacement of specimens in each cycle initially increases dramatically, and then increases slightly to steady stage, exhibiting a ratcheting effect. If loading persists after cyclic loading, the shear-zone soil hardens continuously, resulting in an elastic hysteresis loop with a larger number of cycles.
  • Compared with monotonic loading, an increase in the cyclic period of cyclic loading on a specimen causes a decrease in the shear strength ratio fcm. The shear stress–displacement curves of the shear-zone soil with different numbers of cycles are quite similar, showing two individual parts: initially a plastic displacement stage and then elastic displacement stage.
  • For slow-moving reservoir landslides in the TGR, the horizontal displacements are more sensitive than vertical ones after suffering local cyclic loadings.
During the dynamic evolution of the Huangtupo landslide, the shear strength of the shear-zone soil will gradually decrease with cyclic reservoir water fluctuations. Therefore, there is a need to monitor the deformation, especially the horizontal displacement of the widespread reservoir landslide in the Three Gorges Reservoir area, and pertinent prevention measures should be taken to avert serious fatigue deterioration of the shear-zone soil, which may even induce a catastrophic reservoir landslide disaster.

Author Contributions

Conceptualization, Q.C. and Q.L.; methodology, X.T.; validation, X.T.; formal analysis, Q.C. and D.C.; writing—original draft preparation, D.C.; writing—review and editing, Q.C.; funding acquisition, D.C. All authors have read and agreed to the published version of the manuscript.

Funding

This research was funded by the National Natural Science Foundation of China (NSFC), funding number 42277171, 41972298 and 41772304.

Institutional Review Board Statement

Not applicable.

Informed Consent Statement

Not applicable.

Data Availability Statement

Not applicable.

Conflicts of Interest

The authors declare no conflict of interest.

References

  1. Gratchev, I.; Sassa, K.; Osipov, V.; Sokolov, V. The liquefaction of clayey soils under cyclic loading. Eng. Geol. 2006, 86, 70–84. [Google Scholar] [CrossRef]
  2. Sassa, K.; Fukuoka, H.; Wang, G.; Ishikawa, N. Undrained dynamic-loading ring-shear apparatus and its application to landslide dynamics. Landslides 2004, 1, 7–19. [Google Scholar] [CrossRef]
  3. Nakamura, S.; Wakai, A.; Umemura, J.; Sugimoto, H.; Takeshi, T. Earthquake-induced landslides: Distribution, motion and mechanisms. Soils Found. 2014, 54, 544–559. [Google Scholar] [CrossRef] [Green Version]
  4. Faris, F.; Fawu, W. Investigation of the initiation mechanism of an earthquake-induced landslide during rainfall: A case study of the Tandikat landslide, West Sumatra, Indonesia. Geoenviron. Disasters 2014, 1, 4. [Google Scholar] [CrossRef] [Green Version]
  5. Chen, Q.; Cui, D.; Chen, Y.; Tao, X.; Xiang, W. Effect of Prior Cyclic Loading on Triaxial Compression Strength of Sliding Zone Soil of the Huangtupo Landslide. Adv. Civ. Eng. 2021, 2021, 9924995. [Google Scholar] [CrossRef]
  6. Romeo, R. Seismically induced landslide displacements: A predictive model. Eng. Geol. 2000, 58, 337–351. [Google Scholar] [CrossRef]
  7. Tan, H.; Chen, S. A hybrid DEM-SPH model for deformable landslide and its generated surge waves. Adv. Water Resour. 2017, 108, 256–276. [Google Scholar] [CrossRef]
  8. Paronuzzi, P.; Bolla, A. The prehistoric Vajont rockslide: An updated geological model. Geomorphology 2012, 169, 165–191. [Google Scholar] [CrossRef]
  9. Shahnazari, H.; Dehnavi, Y.; Alavi, A.H. Numerical modeling of stress–strain behavior of sand under cyclic loading. Eng. Geol. 2010, 116, 53–72. [Google Scholar] [CrossRef]
  10. Tang, H.; Wasowski, J.; Juang, C.H. Geohazards in the three Gorges Reservoir Area, China–Lessons learned from decades of research. Eng. Geol. 2019, 261, 105267. [Google Scholar] [CrossRef]
  11. Tang, H.; Li, C.; Hu, X.; Su, A.; Wang, L.; Wu, Y.; Criss, R.; Xiong, C.; Li, Y. Evolution characteristics of the Huangtupo landslide based on in situ tunneling and monitoring. Landslides 2015, 12, 511–521. [Google Scholar] [CrossRef]
  12. Yin, Y.; Huang, B.; Wang, W.; Wei, Y.; Ma, X.; Ma, F.; Zhao, C. Reservoir-induced landslides and risk control. in Three Gorges Project on Yangtze River, China. J. Rock Mech. Geotech. 2016, 8, 577–595. [Google Scholar] [CrossRef] [Green Version]
  13. D’Aguiar, S.C.; Modaressi-Farahmand-Razavi, A.; dos Santos, J.A.; Lopez-Caballero, F. Elastoplastic constitutive modelling of soil–structure interfaces under monotonic and cyclic loading. Comput. Geotech. 2011, 38, 430–447. [Google Scholar] [CrossRef]
  14. Cui, D.; Wang, S.; Chen, Q.; Wu, W. Experimental Investigation on Loading-Relaxation Behaviors of Shear-Zone Soil. Int. J. Geomech. 2021, 21, 6021003. [Google Scholar] [CrossRef]
  15. Cabalar, A.F.; Dulundu, K.; Tuncay, K. Strength of various sands in triaxial and cyclic direct shear tests. Eng. Geol. 2013, 156, 92–102. [Google Scholar] [CrossRef]
  16. Kanth, A.; Maheshwari, B.K. Behaviour of Solani sand under monotonic and cyclic loading: Experiments and finite element simulations. Int. J. Geotech. Eng. 2021, 16, 729–742. [Google Scholar] [CrossRef]
  17. Tang, L.; Zhao, Z.; Luo, Z.; Sun, Y. What is the role of tensile cracks in cohesive slopes? J. Rock Mech. Geotech. 2019, 11, 314–324. [Google Scholar] [CrossRef]
  18. Hu, X.; Liu, D.; Niu, L.; Liu, C.; Wang, X.; Fu, R. Development of soil–pile interactions and failure mechanisms in a pile-reinforced landslide. Eng. Geol. 2021, 294, 106389. [Google Scholar] [CrossRef]
  19. Song, K.; Wang, F.; Yi, Q.; Lu, S. Landslide deformation behavior influenced by water level fluctuations of the Three Gorges Reservoir (China). Eng. Geol. 2018, 247, 58–68. [Google Scholar] [CrossRef]
  20. Wang, J.; Su, A.; Xiang, W.; Yeh, H.-F.; Xiong, C.; Zou, Z.; Zhong, C.; Liu, Q. New data and interpretations of the shallow and deep deformation of Huangtupo No. 1 riverside sliding mass during seasonal rainfall and water level fluctuation. Landslides 2016, 13, 795–804. [Google Scholar] [CrossRef]
  21. Wu, Y.; Li, N.; Wang, X.; Cui, J.; Chen, Y.; Wu, Y.; Yamamoto, H. Experimental investigation on mechanical behavior and particle crushing of calcareous sand retrieved from South China Sea. Eng. Geol. 2021, 280, 105932. [Google Scholar] [CrossRef]
  22. Mohammed, A.; Hummadi, R.A.; Mawlood, Y.I. Predicting the chemical and mechanical properties of gypseous soils using different simulation technics. Acta Geotech. 2022, 17, 1111–1127. [Google Scholar] [CrossRef]
  23. Ding, W.; Nguyen, M.D.; Mohammed, A.S.; Armaghani, D.J.; Hasanipanah, M.; Van Bui, L.; Pham, B.T. A new development of ANFIS-Based Henry gas solubility optimization technique for prediction of soil shear strength. Transp. Geotech. 2021, 29, 100579. [Google Scholar] [CrossRef]
  24. Mawlood, Y.; Mohammed, A.; Hummadi, R.; Hasan, A.; Ibrahim, H. Modeling and statistical evaluations of unconfined compressive strength and compression index of the clay soils at various ranges of liquid limit. J. Test. Eval. 2021, 50, 1–19. [Google Scholar] [CrossRef]
  25. Wu, Q.; Tang, H.; Ma, X.; Wu, Y.; Hu, X.; Wang, L.; Criss, R.; Yuan, Y.; Xu, Y. Identification of movement characteristics and causal factors of the Shuping landslide based on monitored displacements. Bull. Eng. Geol. Environ. 2019, 78, 2093–2106. [Google Scholar] [CrossRef]
  26. Wang, J.; Wang, S.; Su, A.; Xiang, W.; Xiong, C.; Blum, P. Simulating landslide-induced tsunamis in the Yangtze River at the Three Gorges in China. Acta Geotech. 2021, 16, 2487–2503. [Google Scholar] [CrossRef]
  27. Jiao, Y.; Song, L.; Tang, H.; Li, Y. Material weakening of slip zone soils induced by water level fluctuation in the ancient landslides of Three Gorges Reservoir. Adv. Mater. Sci. Eng. 2014, 2014, 202340. [Google Scholar] [CrossRef] [Green Version]
  28. Liu, Q.; Wang, S.; Xia, D.; Xiang, W.; Liu, X. Experimental study of residual-state creep behavior of intact sliding-zone soil. Rock Soil Mech. 2017, 38, 1305–1313. [Google Scholar]
  29. Cabalar, A.F. Stress fluctuations in granular material response during cyclic direct shear test. Granul. Matter 2015, 17, 439–446. [Google Scholar] [CrossRef]
  30. Pra-ai, S.; Boulon, M. Soil–structure cyclic direct shear tests: A new interpretation of the direct shear experiment and its application to a series of cyclic tests. Acta Geotech. 2017, 12, 107–127. [Google Scholar] [CrossRef]
  31. Vieira, C.S.; Lopes, M.D.L.; Caldeira, L.M. Sand-geotextile interface characterisation through monotonic and cyclic direct shear tests. Geosynth. Int. 2013, 20, 26–38. [Google Scholar] [CrossRef]
  32. Liu, F.; Wang, P.; Geng, X.; Wang, J.; Lin, X. Cyclic and post-cyclic behaviour from sand–geogrid interface large-scale direct shear tests. Geosynth. Int. 2016, 23, 129–139. [Google Scholar] [CrossRef]
  33. Wang, J.; Schweizer, D.; Liu, Q.; Su, A.; Hu, X.; Blum, P. Three-dimensional landslide evolution model at the Yangtze River. Eng. Geol. 2021, 292, 106275. [Google Scholar] [CrossRef]
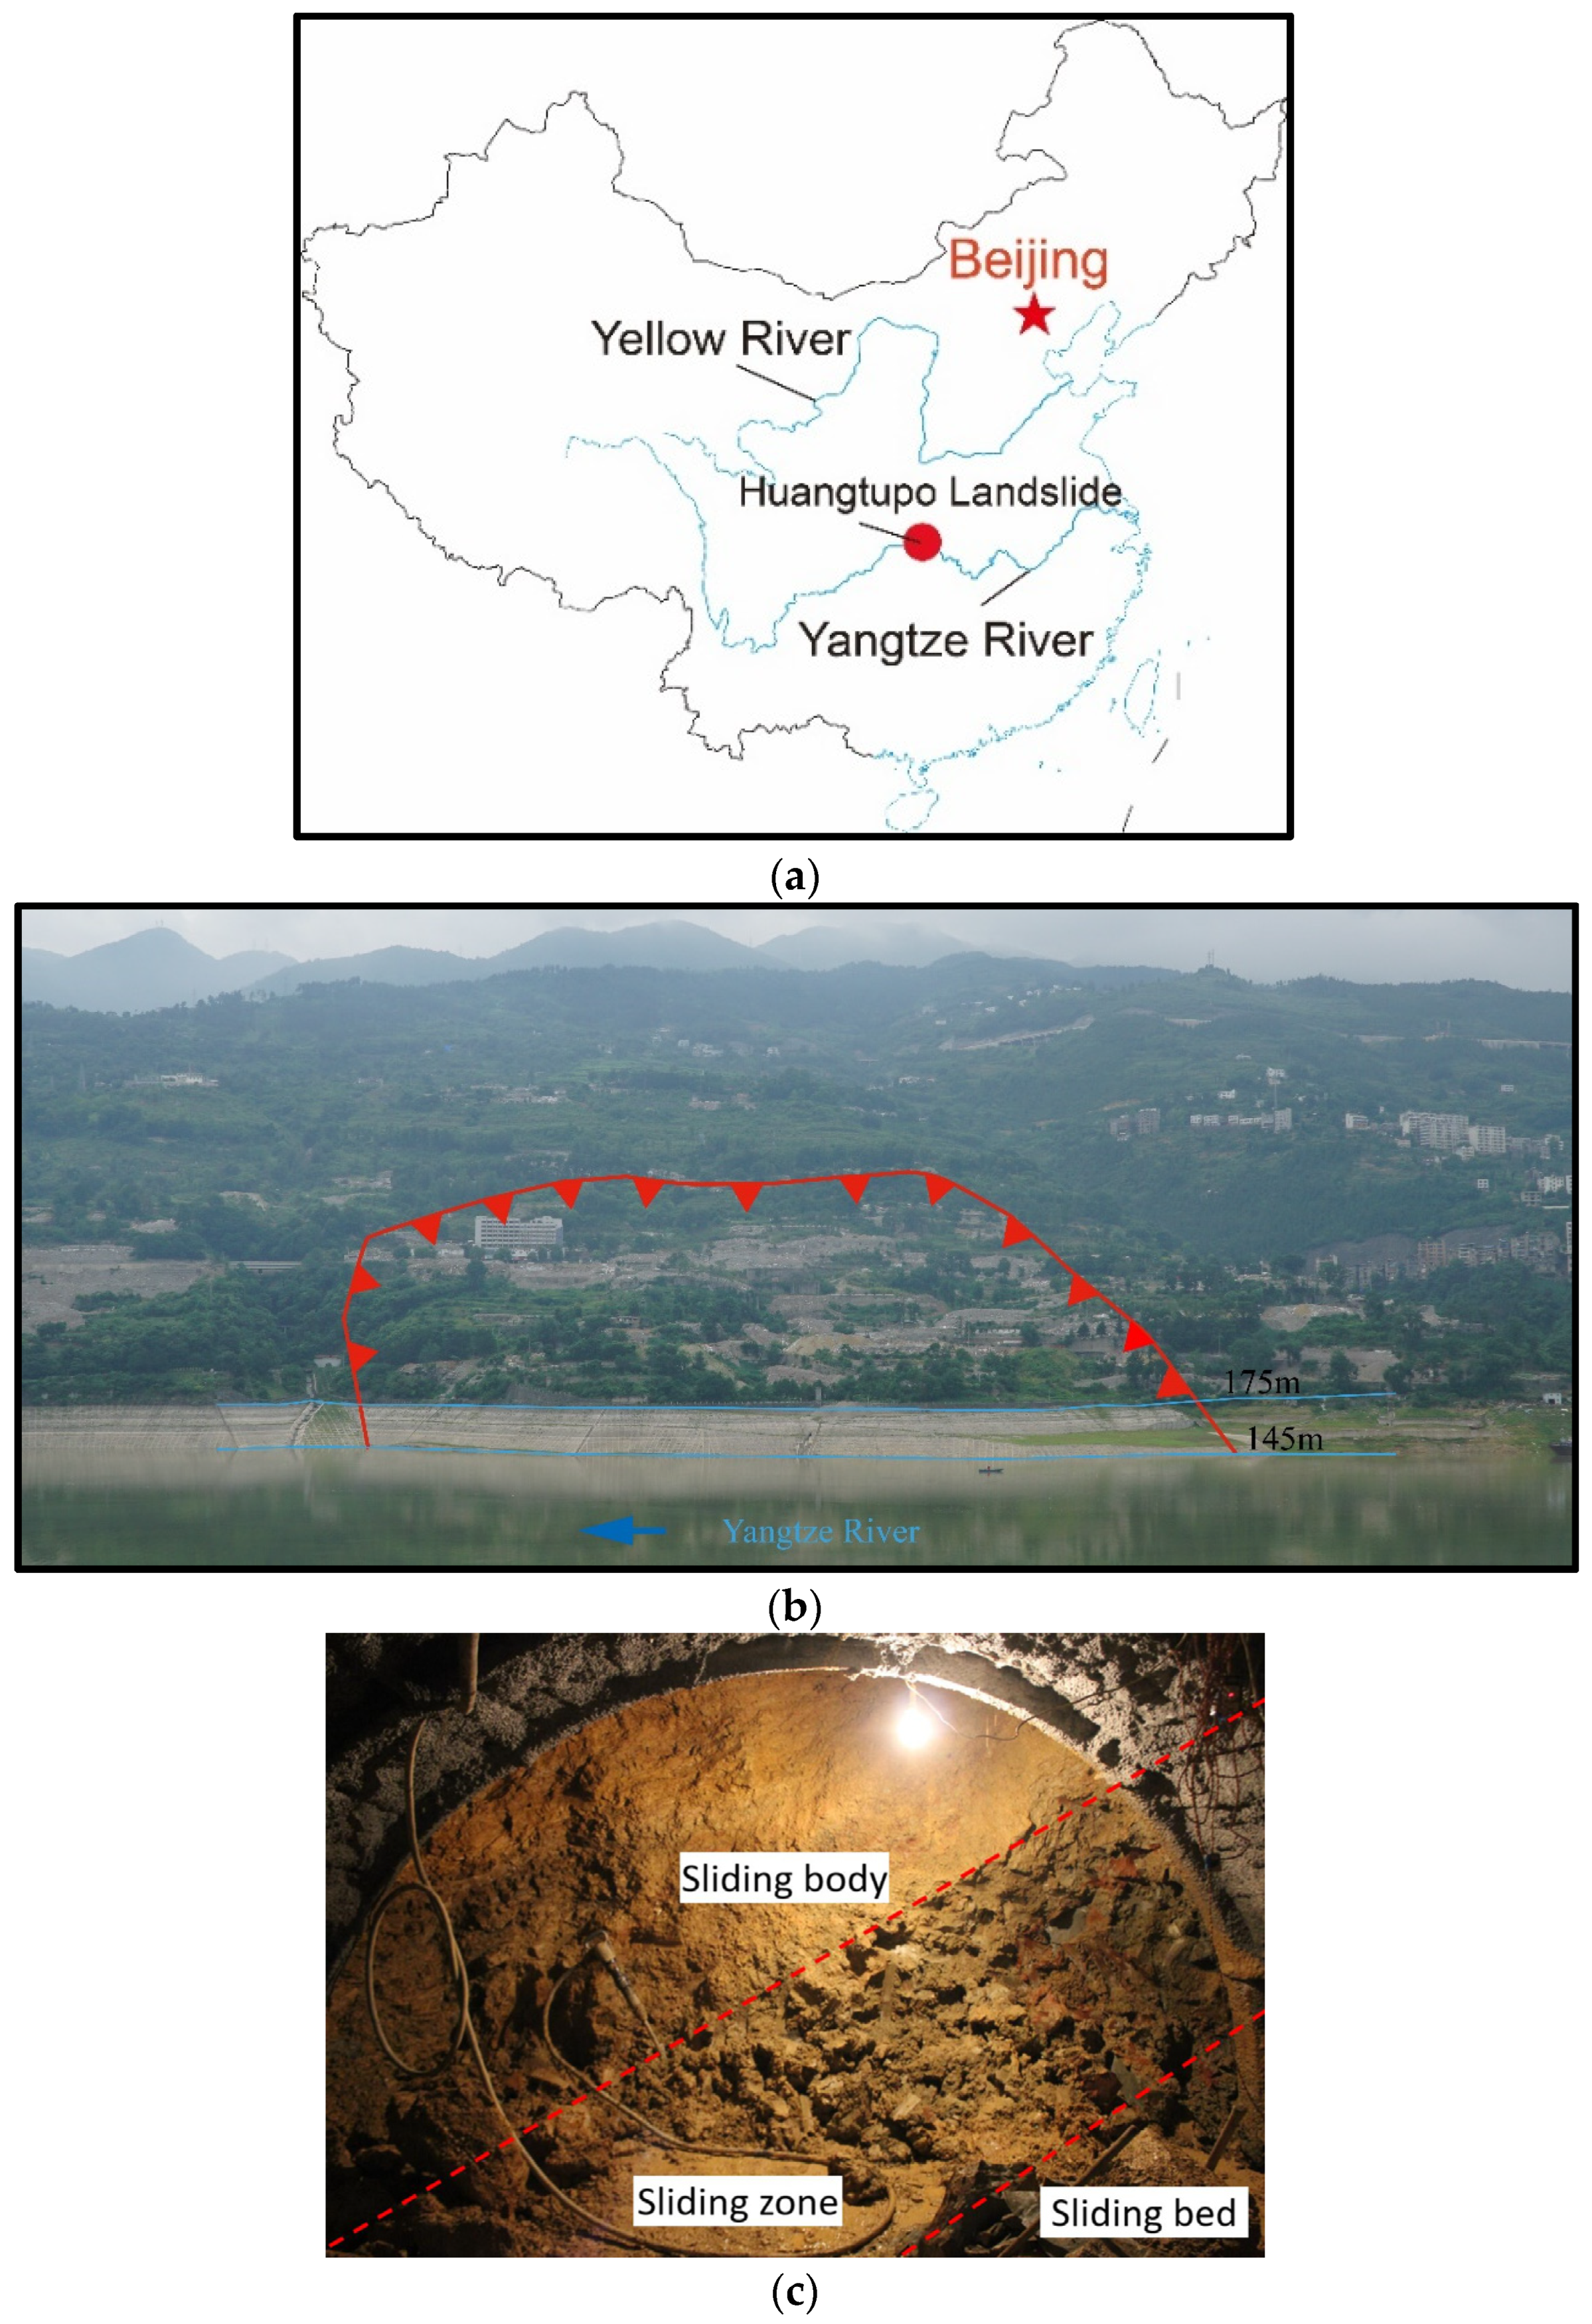
Figure 1. Maps of the Huangtupo landslide (a) the location of the Huangtupo landslide; (b) the scope of landslide and relocation project; and (c) shear-zone of 3# test tunnel.
Applsci 12 13024 g001
Figure 2. Flowchart for the whole work process.
Applsci 12 13024 g002
Figure 3. Particle size distribution curve of shear-zone soil from the Huangtupo landslide.
Applsci 12 13024 g003
Figure 4. The GDS direct shear test equipment. (a) Components of shear test system; (b) mounting the specimen.
Applsci 12 13024 g004
Figure 5. Schematic diagram of monotonic loading and cyclic loading.
Applsci 12 13024 g005
Figure 6. Monotonic direct shear tests of shear-zone soil under different normal stresses: (a) shear stress versus shear displacement; (b) vertical displacement versus shear displacement.
Applsci 12 13024 g006
Figure 7. Shear stress as a function of the applied normal stress under monotonic loading.
Applsci 12 13024 g007
Figure 8. Shear stress versus shear displacement curves under different normal stress (N = 100). (a) T = 10 s; (b) T = 60 s; (c) T = 90 s.
Applsci 12 13024 g008
Figure 9. Shear strength ratio against normal stress for shear-zone soil with different cyclic periods.
Applsci 12 13024 g009
Figure 10. Shear stress versus shear displacement curves with different number of cycles (σn = 100 kPa). (a) T = 10 s; (b) T = 60 s; and (c) T = 90 s.
Applsci 12 13024 g010
Figure 11. Shear strength ratio against number of cycles for shear-zone soil with different cyclic periods (σn = 100 kPa).
Applsci 12 13024 g011
Figure 12. Curves showing shear stress versus shear displacement under different cyclic periods (σn = 100 kPa). (a) N = 10; (b) N = 20; (c) N = 100; and (d) N = 1000.
Applsci 12 13024 g012
Figure 13. Shear strength ratio against cyclic period for shear-zone soil with different numbers of cycles.
Applsci 12 13024 g013
Figure 14. Shear displacement versus the number of cycles with different normal stress (T = 90 s).
Applsci 12 13024 g014
Figure 15. Shear stress versus shear displacement curves with (a) different normal stress and (b) different cyclic periods.
Applsci 12 13024 g015
Figure 16. Vertical displacement versus shear displacement under monotonic and cyclic loading (N = 100, T = 90 s).
Applsci 12 13024 g016
Table 1. Basic physical and mechanical properties of the shear-zone soil.
Natural Moisture Content w/%Natural Density ρ/(g·cm−3)Specific Gravity GsLiquid Limit
wL/%
Plastic Limit
wP/%
Plasticity IndexDeformation Modulus E/MPa
13.852.152.6736.0217.5118.5125.66
Table 2. Test conditions for all direct shear tests.
Test (No.)Test TypeNormal Stress (kPa)Cyclic Period (s)Number of Cycles
A-0MDS10000
A-1-1CDS1009010
A-1-2CDS1009020
A-1-3CDS10090100
A-1-4CDS100901000
A-2-1CDS1006010
A-2-2CDS1006020
A-2-3CDS10060100
A-2-4CDS100601000
A-3-1CDS1001010
A-3-2CDS1001020
A-3-3CDS10010100
A-3-4CDS100101000
B-0MDS20000
B-1CDS20090100
B-2CDS20060100
B-3CDS20010100
C-0MDS40000
C-1CDS40090100
C-2CDS40060100
C-3CDS40010100
Note: MDS-Monotonic direct shear test. CDS-Cyclic direct shear test.
Publisher’s Note: MDPI stays neutral with regard to jurisdictional claims in published maps and institutional affiliations.