1. Introduction
The on-site diagnosis of concrete is an essential issue for engineers in order to take the correct decision about the condition of an existing structure [
1]. Nondestructive evaluation (NDE) covers two main objectives of concrete diagnosis, namely, the estimation of concrete mechanical properties or the assessment of durability indicators (porosity, depth of carbonation, water content, etc.). Nondestructive techniques (NDT), such as rebound hammer ultrasonic, impact echo, or electrical resistivity, play an important role in any investigation program since they allow for the gathering of information about the quality and durability of concrete without damaging it. The more-evaluated property of concrete is the compressive strength, which is important for the assessment of the mechanical capacity of the evaluated structure [
1,
2].
The main challenge in using NDT assessment is that the NDT measurements cannot give directly compressive strength. In fact, the NDT result is often a physical parameter, such as the velocity for the ultrasonic pulse velocity technique or the rebound index for the rebound hammer technique [
3,
4]. In several cases, theoretical relationships between the concrete compressive strength and the parameters measured by NDT are unknown. Consequently, empirical relationships’ “conversion models” are usually identified for this purpose. There are several procedures to identify the conversion models. The most widely used is the regression approach that is based on the least-squared method. Another possibility is the calibration approach generally used for on-site evaluation [
5]. The calibration approach is based on the modification of an existing model (from the literature or standards) for the concrete under consideration. In addition, innovative methods, such as machine learning methods [
6,
7,
8], can be used to identify the relationship between the NDT measurement and compressive strength, but their application on a real structure is limited by the wide variation of concrete mixes [
7]. The literature provides many conversion models (linear, power, exponential, polynomial, etc.). It is then necessary to mention here that there is no general conversion model that can be applied for all concretes on real structures. Therefore, the identification of a new model or calibration of an existing model for concrete under consideration is essential [
8].
For years, the concept of combining two NDT techniques has been studied. The most famous one is called SonReb. It is the combination between the ultrasonic pulse velocity technique and the rebound hammer technique in order to evaluate the concrete compressive strength. This combination has been the focus of many laboratories and on real-structure studies aiming to improve the quality of assessment. The interest in this combination is the inversed sensitivity of ultrasonic pulse velocity and rebound hammer to water content. In fact, ultrasonic pulse velocity is increased in wet concrete, while rebound number is reduced compared to the case of dry concrete [
9]. Consequently, the conversion model that correlates the concrete strength to ultrasonic pulse velocity or rebound index can be false if water content variation is not controlled. Therefore, these two indicators should be evaluated simultaneously, so they are decoupled. The way to do this can be the combination of the two techniques. However, the method that consists of combining NDT is promising only if the additional costs due to combination are compensated by an improvement in the reliability of assessment [
10].
Many researchers have presented their results related to the application of the SonReb method. Cristofaro has used a large database to check the effectiveness of the available prediction models and to propose new relationships, which are very effective for predicting the concrete strength of Italian RC buildings made in the latter decades of the 20th century [
11]. Diaferio has taken advantage of an extensive experimental campaign in order to calibrate a huge number of conversion models by varying the setup conditions and the considered number of data [
12]. Another methodology has been proposed by Ali-Benyahia in order to improve the precision of the assessment quality of concrete strength in an existing structure. The analysis quantified the combined effects of increasing the number of cores, the conditional coring option, and the use of single or combined NDT methods [
13]. However, since the regression methods have shown less accuracy in concrete-strength predictions, new techniques, such as Artificial Neural Network ANN, have been employed to capture the relationship between NDT parameters and concrete mechanical characteristics. The results obtained from the work of Bonagura et al. indicate the excellent estimation potential of a multilayer feed-forward neural network trained with a back propagation error algorithm in the evaluation of concrete compressive strength [
14].
Knowing the reliability of assessment is therefore necessary to make a decision about improving the quality of diagnosis or the cost. Moreover, it is interesting to see whether the combination process gives a better evaluation or not. It is important to note that due to many factors, there is not a consensus regarding the efficiency of SonReb compared to using a single NDT. In fact, as reported by Alwash, the combination of pulse velocity and rebound hammer techniques is not always efficient, and this efficiency depends on the quality of NDT measurements (uncertainty) and the number of samples or cores [
15]. As reported in some research works, the quality of concrete affects the reputability of the rebound hammer method [
16].
This paper presents a review of the combination of NDT techniques using SonReb for the assessment of concrete strength. First, the method is described, and different calibration approaches from the literature are presented. The efficiency of the SonReb method is discussed regarding the use of the RMSE index. In addition, the necessity for identification or calibration of a model for the concrete under evaluation is considered. The performance of the SonReb method is also analyzed by using Monte Carlo simulation, and the trade-off effect is presented. Several conclusions and recommendations are provided regarding the use of the SonReb NDT combining method.
2. Combining NDT Techniques Using the SonReb Method for Concrete-Strength Evaluation
2.1. Identification of Conversion Models for the Case of the Combination of NDT Techniques
For the case of combining NDT techniques, in order to identify a conversion model, the process is mainly a mathematical approach. It is based on the solution of a multivariate mathematical system. The existing approaches for identifying the conversion models can be classified into two main groups: classical approaches (regression analysis) and machine learning approaches (neural networks, support vector machine, etc.). In this paper, only SonReb using a bivariate regression approach is presented.
2.2. Bivaried Regression Model for the SonReb Method
Instead of using a single NDT technique with cores for assessing the concrete strength, the NDT techniques can be used in combination (in addition to the cores). This combination, called SonReb, is the most used combination method for assessing the concrete compressive strength in laboratory and on real structures. This method combines the ultrasonic pulse velocity technique and the rebound hammer technique in order to assess the concrete compressive strength.
The theoretical principle of combination is that when two or more NDT techniques are affected inversely by an influencing factor, combining these techniques can reduce or eliminate this effect and, as a result, improves the reliability of strength estimation [
6]. As an example, there is the effect of the concrete moisture condition which produces an increase in pulse velocity and a decrease in rebound number when it increases. However, the benefit of this improvement in reliability resulting from using the combination of NDT techniques should be assessed against the additional time, cost, and complexity of using this combination.
Two RILEM Technical Committees (7 NDT and 43 CND) played an important role in the development of the SonReb method. TC 43 recommendations [
17] provided a procedure to establish isostrength curves for a reference concrete (concrete has the materials and composition from a particular region or country for which the curves are devoted). For different concrete compositions, correction factors are used for this purpose. When the composition is unknown (as is the case for old structures), the correction factor should be estimated using cores extracted from the structure under investigation [
17]. This methodology can have a major limit because in several cases, information about concrete mix are unknown, and the correction of the result in this case is impossible.
In fact, the isostrength curves represent specific conversion models that correlate the concrete strength with NDT values (pulse velocity and rebound number). The monogram is not unique and many other versions were developed by researchers all around the world (see examples [
18,
19,
20] for isostrength curves, [
19,
20] for isorebound number curves, and [
21] for isopulse velocity curves).
The variety of these isocurves emphasizes that they can give a correct strength prediction only for the particular cases that they are derived for. Therefore, to assess concrete on site, the strength should be predicted using a model derived for the concrete under consideration.
For this reason, the last RILEM recommendations (249 ISC) give more methodological information about how the structure can be investigated, how the models can be identified, and how the model can be calibrated on site [
22]. The recommendations focus on a new flowchart that describe all steps from NDT measurements up to mean strength and error evaluation. It also gives important recommendations about the estimation of the number of cores to be extracted and their positions in the structure by using NDT results that can capture concrete-strength variability.
The evaluation of concrete strength using the SonReb method is similar to that for a single NDT. It includes carrying out the NDT measurements, extracting cores (random or using specific methodology as proposed by RILEM 249 ISC), establishing a model using the dataset (pulse velocity V, rebound number R, compressive strength ) values, and estimating strength at any test location by applying V and R values (corresponding to this test location) in the identified/calibrated model. We will focus in this paper on how to build the SonReb model, how it can be calibrated, and how the performance can be evaluated.
2.2.1. Types of Models
For combining the pulse velocities and rebound numbers with cores, different model forms have been considered by researchers, such as bilinear, double power, exponential, polynomial, and other miscellaneous forms. In the study presented by [
23], Breysse gathered about 69 models from the literature.
Table 1 shows several models derived by different researchers.
A possibility promoted by some researchers, see for examples [
24,
25], is to combine (in addition to NDT measurements) several concrete characteristics (water-to-cement ratio, aggregate-to-cement ratio, admixture content, concrete density, age, etc.) in the model. However, the main drawback of this type of model is the need to know the concrete characteristics as inputs in the model, while they usually remain unknown in old structures. Therefore, in this study, models with only NDT measurements as the inputs are considered.
Table 1.
Some models derived by different researchers in order to estimate strength using combined rebound hammer and pulse velocity techniques.
Table 1.
Some models derived by different researchers in order to estimate strength using combined rebound hammer and pulse velocity techniques.
| Model (fcest in MPa, V in km/s) | Title 2 |
|---|
| fcest = 8.630V + 1.416R − 51.581 | [26] |
| fcest = 7.695 ∗ 10−11 V2.6 R1.4 | [17,27] |
| fcest = e0.446V + 0.048R | [28] |
| fcest = 0.67 e0.72V + 0.04R | [29] |
| fcest = 0.42 R0.63 e0.58V | [30] |
| fcest = −173.04 + 4.07V2 + 57.96V + 1.31R | [31] |
| fcest = −21.1 + 1.24R + 0.058V4 | [32] |
| fcest = −76.30 + 0.17 V0.4 R0.7 | [33] |
| fcest = (R/(3.64 + 0.023R − 0.56V))2 | [34] |
| fcest = 44.8V + 0.77R − 194 | [35] |
| fcest = 1.974 e0.000542V + 0.01605R | [36] |
| fcest = 0.01174V + 0.37R − 28.44 | [18] |
| fcest = 10−4.251 V1.281 R0.686 | [36] |
The power form is the most widely used one in the literature, and it is written as follows:
where
a,
b, and
c are the model parameters to be identified. The least squares minimization [
37] can be used to derive the values of the model parameters; however, it is necessary to first put the model in a linear form using the logarithmic transformation. Consequently, Equation (1) becomes:
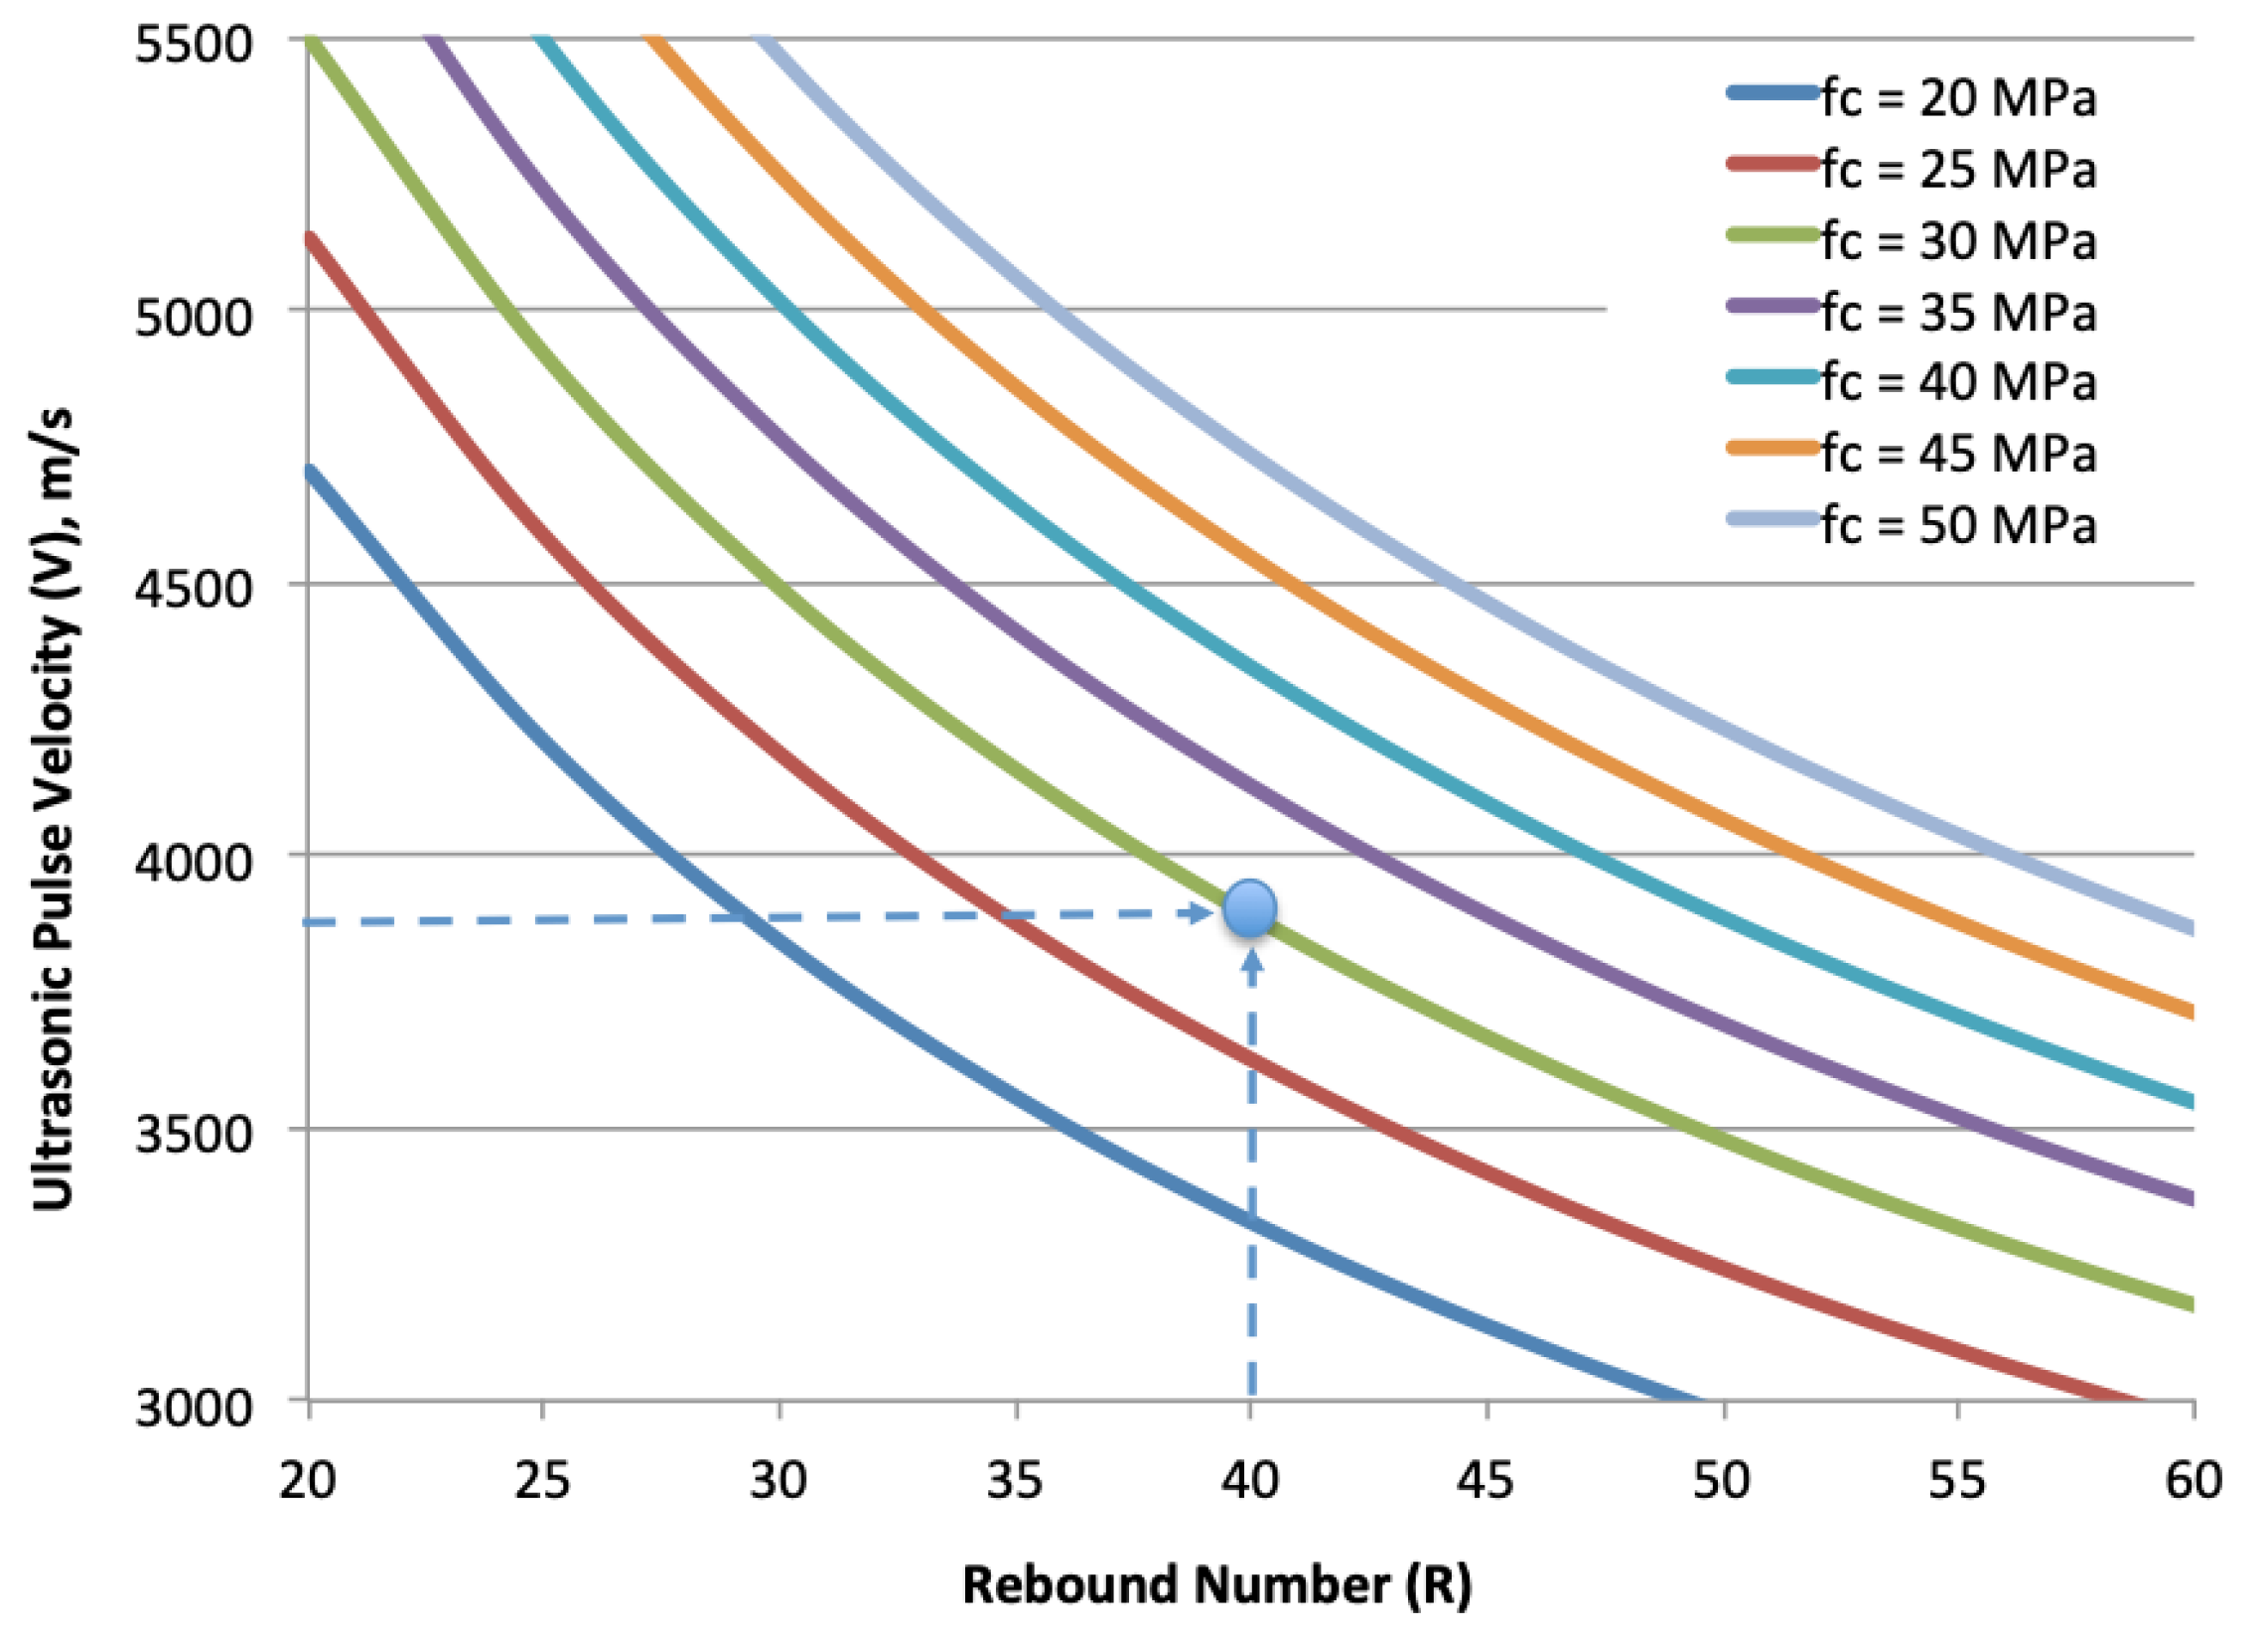
As an example, the SonReb model provided by [
23] is
fc = 1.15 × 10
−10 V2.6 R1.3. The graphical representation of this model is shown in
Figure 1. From this figure, the compressive strength corresponding to any values of
V and
R can be evaluated (for example, for
V = 3800 m/s and
R = 40, the compressive strength
fc = 30 MPa).
It is necessary to note here that this model and each one of the models presented in
Table 1 were identified from experimental work on a specific concrete, which explains the variability in the values of the model parameters from one model to another. Generally, the identification of the SonReb model for a specific concrete requires a dataset of NDT measurements (
V and
R) and compressive strengths
fc from a destructive test on samples. This dataset (
V,
R, and
fc) is used to identify the model parameters, and, consequently, the identified model can be used to assess the compressive strength within the concrete for which this model is derived. If this model is used to assess the compressive strength within another concrete, the calibration of this model is very important. The principles of calibration will be discussed later.
2.2.2. Efficiency of the SonReb Method
The SonReb method is widely used in real practice; however, until now, there has been no general agreement about the efficiency of this method (i.e., whether the use of ultrasonic and rebound hammer techniques together is more efficient than the application of only one of these two techniques). Some studies indicate that using the SonReb method leads to a better assessment of the compressive strength [
19,
38]. However, other studies did not find an important improvement in the quality of assessment when using the SonReb method [
39,
40].
In real practice, to study the efficiency of the SonReb method, the coefficient of determination
r2 for the case of combination is compared with
r2 values that correspond to cases of single NDT techniques.
Table 2 compares
r2 values obtained from using SonReb with the values obtained from using the ultrasonic pulse velocity technique only (single
V) or rebound hammer only (single
R) and for several datasets selected from the literature. It is clear that, for each dataset, the value of
r2 for SonReb is always greater than the corresponding values for the cases of single
V and single
R. However, from the principles of statistics, adding a new term to the model (as is the case for SonReb) will increase the value of
r2 [
41]. As a result, the coefficient of determination is a misleading indicator about the efficiency of SonReb.
Table 2 also shows the values of the RMSE (root mean square error) calculated at the prediction stage, i.e., for the part of dataset that was not used in the model identification (fitting stage). From these values, it is clear that for some datasets, the minimum errors are obtained from using a single NDT technique, while for other datasets, the minimum errors are provided by the SonReb method. This indicates that the combination is not always efficient. Furthermore, [
42] has studied the efficiency of the SonReb method using synthetic datasets and highlighted that the efficiency of SonReb depends on the qualities of the two techniques combined (in other words, the uncertainties of measurements) and on the number of samples or cores used in the model identification process.
In summary, the SonReb method is not always efficient, and its efficiency is affected by factors such as the quality of pulse velocity and rebound hammer measurements, the number of samples/cores used in the model identification, and probably the concrete quality (strength, variability, moisture variation, etc.). To analyze the efficiency of SonReb, it is necessary to do so at the prediction stage and not at the fitting stage. This consists of splitting the data in two groups, one for fitting models and the second for testing the model (prediction on data not used for fitting). Moreover, to deepen the analysis of the efficiency, it is important to compare the cost of the SonReb with that of using a single technique in order to derive conclusions that are more realistic.
where
fcore i is the true in situ strength,
fcest i is the estimated compressive strength, and
NC is the number of cores.
3. Calibration of Conversion Models for the Case of Combination of NDT Techniques
3.1. Objective and Aim of Calibration
As both V and R are influenced by many factors (i.e., aggregate type, moisture, cracks, carbonation, etc.), calibration is needed for more accurate strength evaluation. Instead of identifying the conversion models, as described in the previous section, for assessing concrete in the existing structures, conversion models from standards or laboratory studies or those provided in the literature can be tested for this purpose. However, since there is no universal model, which can be applied for all concrete, these models, can only be used for the cases from which they are derived, and the application of these models to any other case needs a prior calibration step. The objective of the calibration process of an existing model is to modify it to the concrete under consideration.
3.2. Methods of Calibration
Different methods can be applied in order to calibrate an existing conversion model. These calibration methods differ in their simplicity and accuracy. We present here several calibration methods:
3.2.1. Shifting Factor Method (Δ-Method)
The method of calibration by shifting (Δ-method), in which the model f is calibrated by shifting it by a calibration constant Δ, i.e., the calibrated model becomes
f + Δ. The constant Δ is calculated from the values of indicators and observables measured at some points within the concrete under consideration. The calibration by the shifting method is easy to carry out and inexpensive. However, the parameter Δ cannot correct or modify the conversion model to include the effects of all influencing parameters. Moreover, it does not modify the model sensitivity coefficients (i.e., if the model is linear, then the calibration has no effect on the slope ‘’sensitivity coefficient’’) which may lead in some cases to serious errors. The concept here is to shift the uncalibrated prior model by a coefficient Δ,
The coefficient Δ is calculated as in the following steps:
- (a)
Use the uncalibrated prior model to calculate the estimated strength at each core location fcuncal I, then
- (b)
Calculate the shifting factor Δ
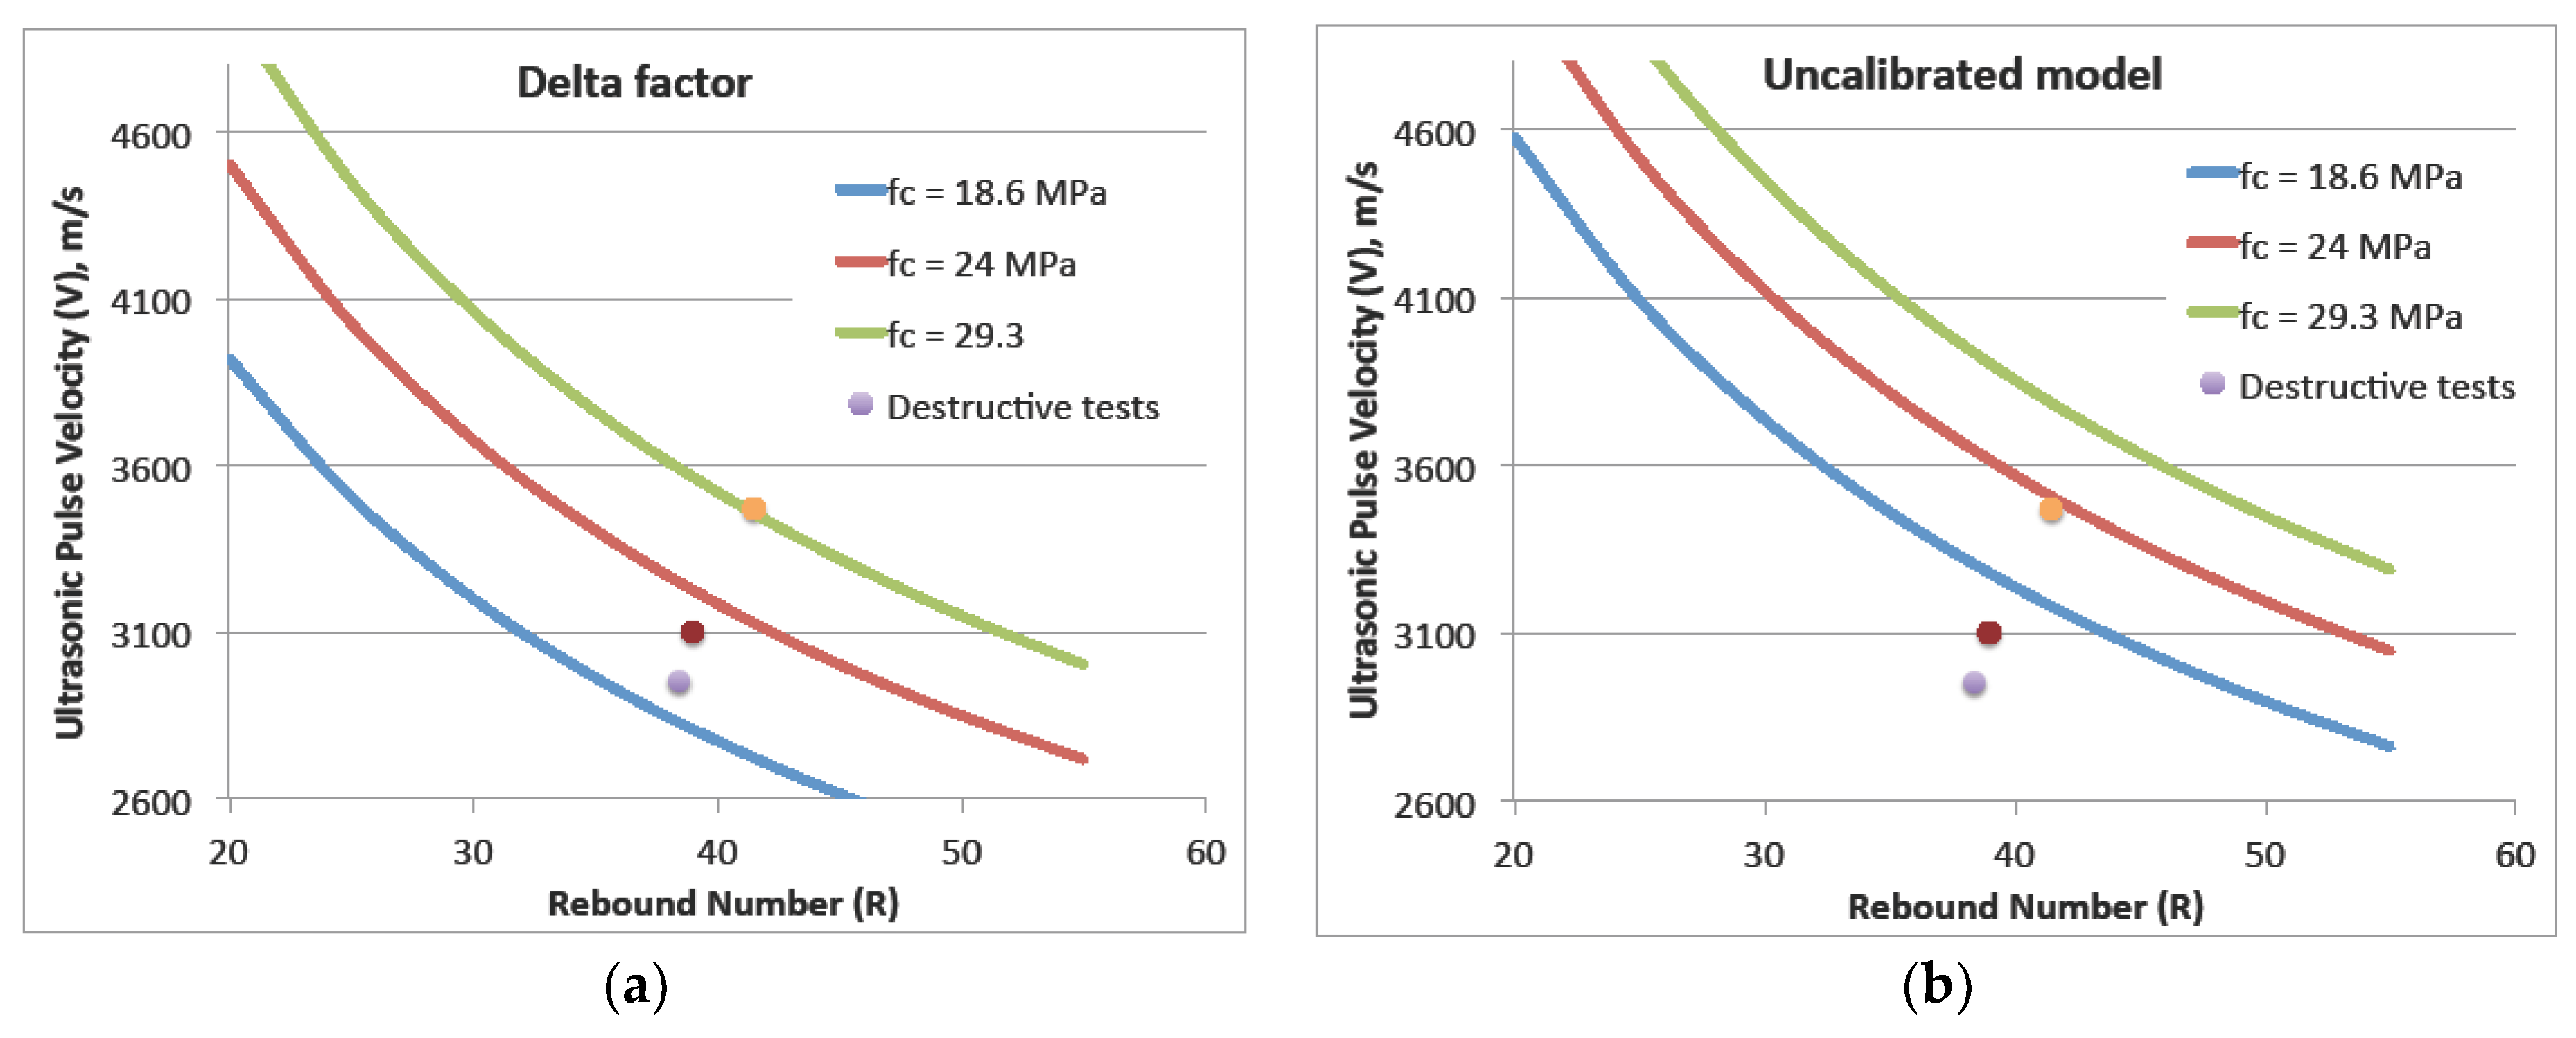
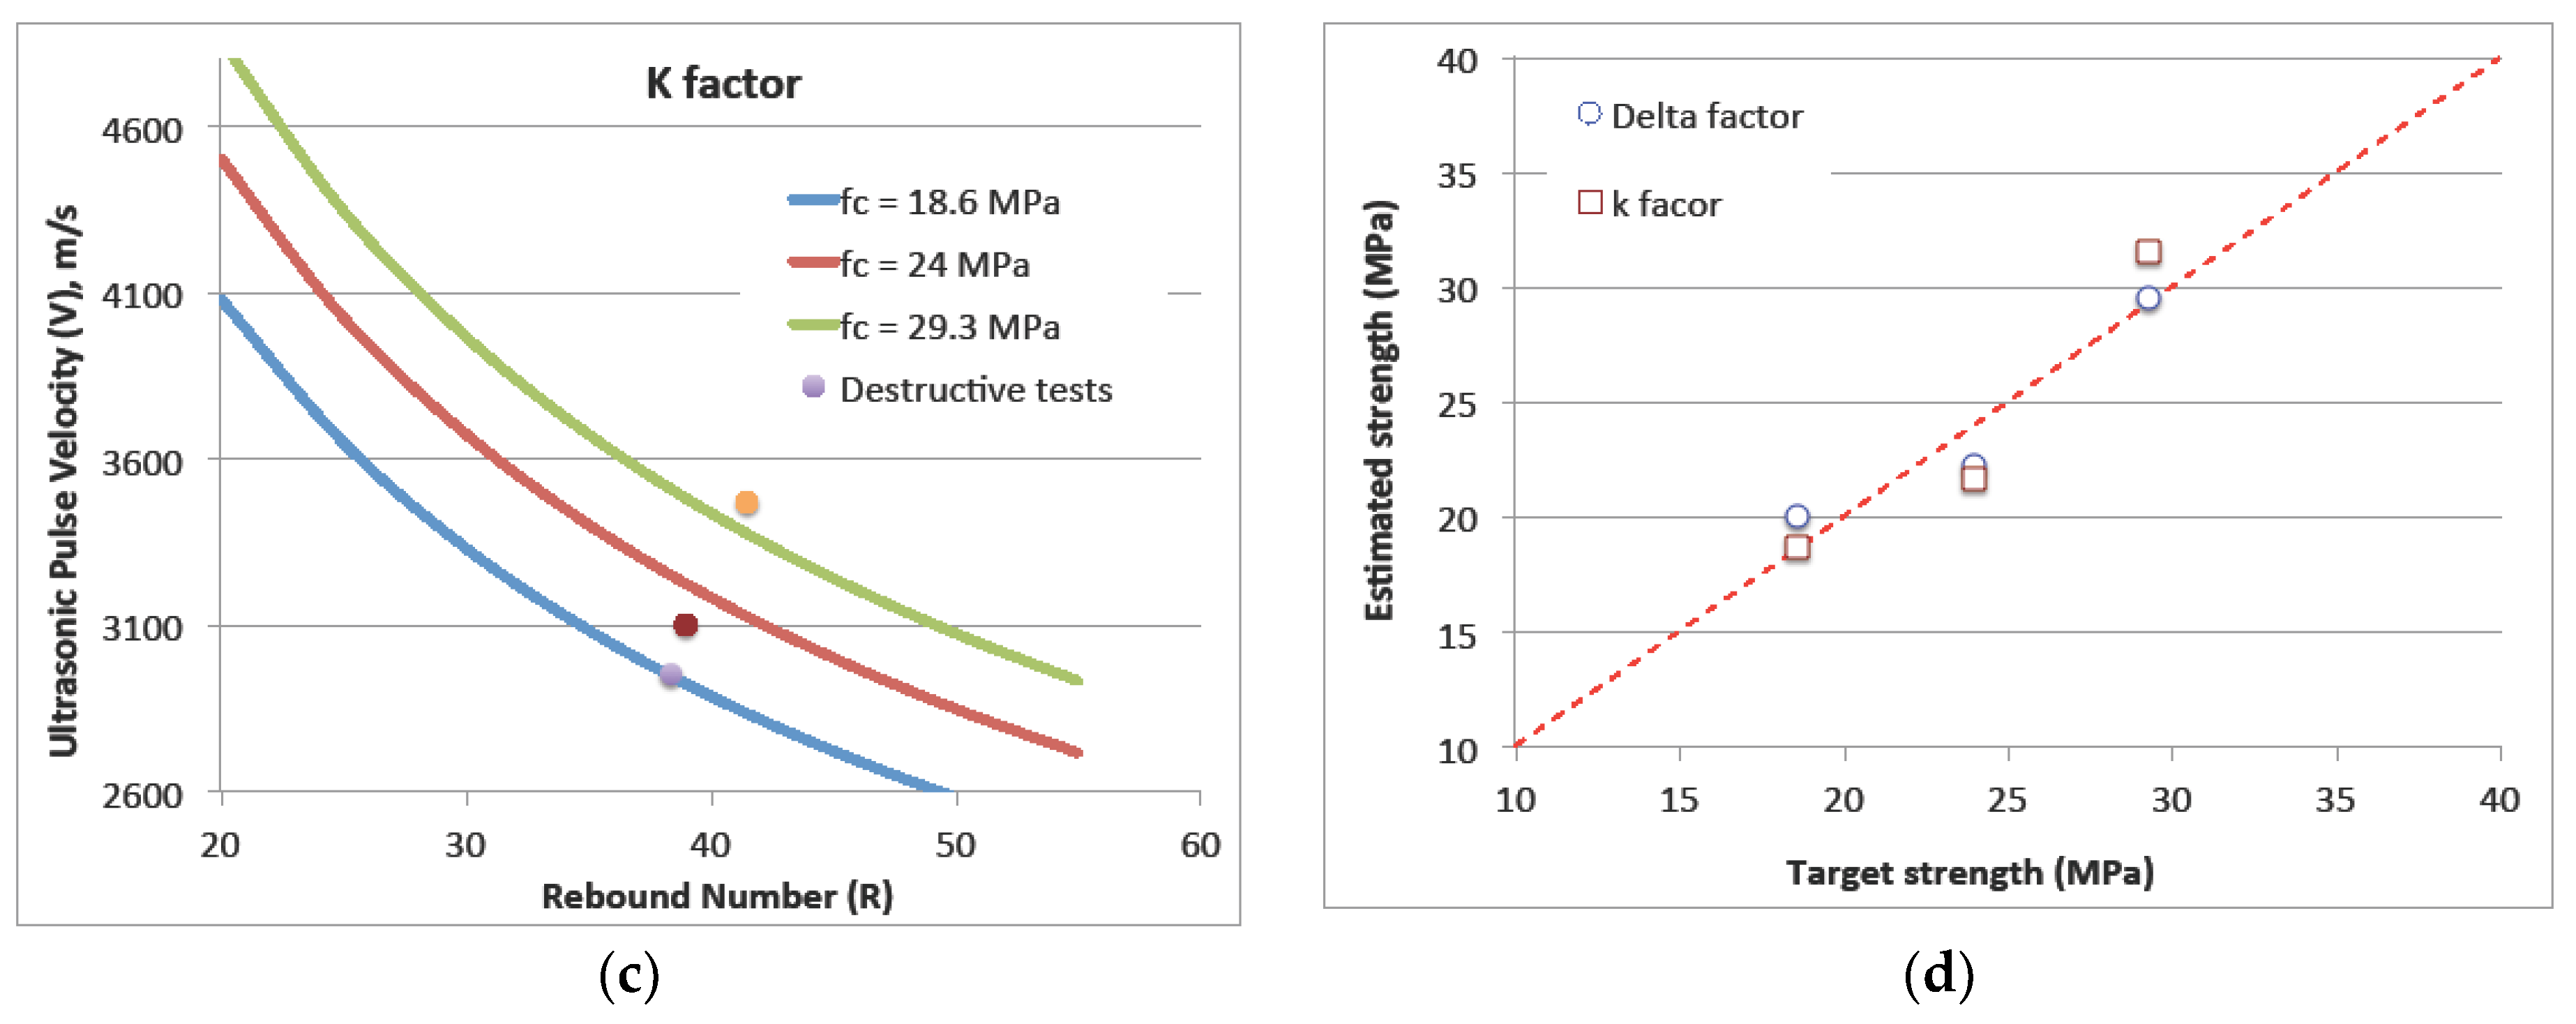
Figure 2 shows the scatter diagram with an uncalibrated model selected from the literature and the calibrated models that result from using the two calibration methods (k-method and Δ-method).
3.2.2. Multiplying Factor Method (k-Method)
In this method, the conversion model f is multiplied by a calibration constant k in order to produce a calibrated model k f. As in the previous method, the calibration constant k is calculated from the available data on the concrete under consideration. In contrast to the calibration method by shifting, the present method modifies all coefficients of the conversion model.
The principle comes to update an uncalibrated prior model by a coefficient
k to produce a calibrated model,
where
fc uncal is the estimated compressive strength calculated from the selected uncalibrated prior model. The coefficient
k is calculated as in the following steps:
- (a)
Calculate the mean value of core strengths,
- (b)
Use the uncalibrated prior model to calculate the estimated strengths at core locations and then take the mean of these values,
- (c)
Calculate the calibration factor.
4. Case of the SonReb Method
To calibrate SonReb conversion models, any one of the two approaches (i.e., Δ-method or
k-method) presented above can be applied. In this section, an example of the calibration of the SonReb model is presented; the two calibration methods were applied on datasets collected from the literature [
23]. These datasets consist of ultrasonic pulse velocity and rebound hammer measurements carried out on an existing structure. Firstly, the results of using the SonReb model without calibrations are shown in
Figure 3a. If one compares the concrete strength estimated by the SonReb model with the values obtained from destructive tests, see
Figure 3a; it is clear that the uncalibrated model is unable to assess the strength with a good precision (here, the mean absolute error of 6.2 MPa is found). However, when the model in
Figure 3a is calibrated by applying the Δ-method (
Figure 3b) or the
k-method (
Figure 3c), the reliability of assessment is improved. The strengths estimated after calibration were compared with the measured strengths, as shown in
Figure 3d. From this figure, it is obvious that the errors are reduced to 1.2 MPa for both the Δ-method and the
k-method.
5. Performance of the Evaluation Using Monte Carlo Simulations
In real practices, after the in situ measurements and strength testing in laboratory, these results are used to identify/calibrate a conversion model between the NDT measurements and concrete strengths. This methodology can be affected by some factors, such as the number of cores and the uncertainty of NDT measurements. To take into account these effects, recent works [
24,
48] proposed to simulate the methodology using the Monte Carlo method.
The model calibration is based on a random selected number of test results or number of cores (NC). The process of strength estimation goes first through the identification step and then the prediction step. The strength estimation in the identification step is based on the NC of the test results or cores chosen for the calibration. On the other hand, the strength estimation in the prediction step is based on a number NT-NC of test results, where NC is the number of test or cores used to identify the model and NT is the total number of test locations or tested samples for NDT measurements.
After the random selection of NC from NT test locations, the regression analysis is used to identify three linear models corresponding to three cases: using pulse velocity method
V, using rebound hammer method
R, and using combined method (
V + R). Each identified model is used to estimate the local strength, which is used to calculate the estimated mean strength
, the estimated strength standard deviation (strength variability) s(
), and errors [
42].
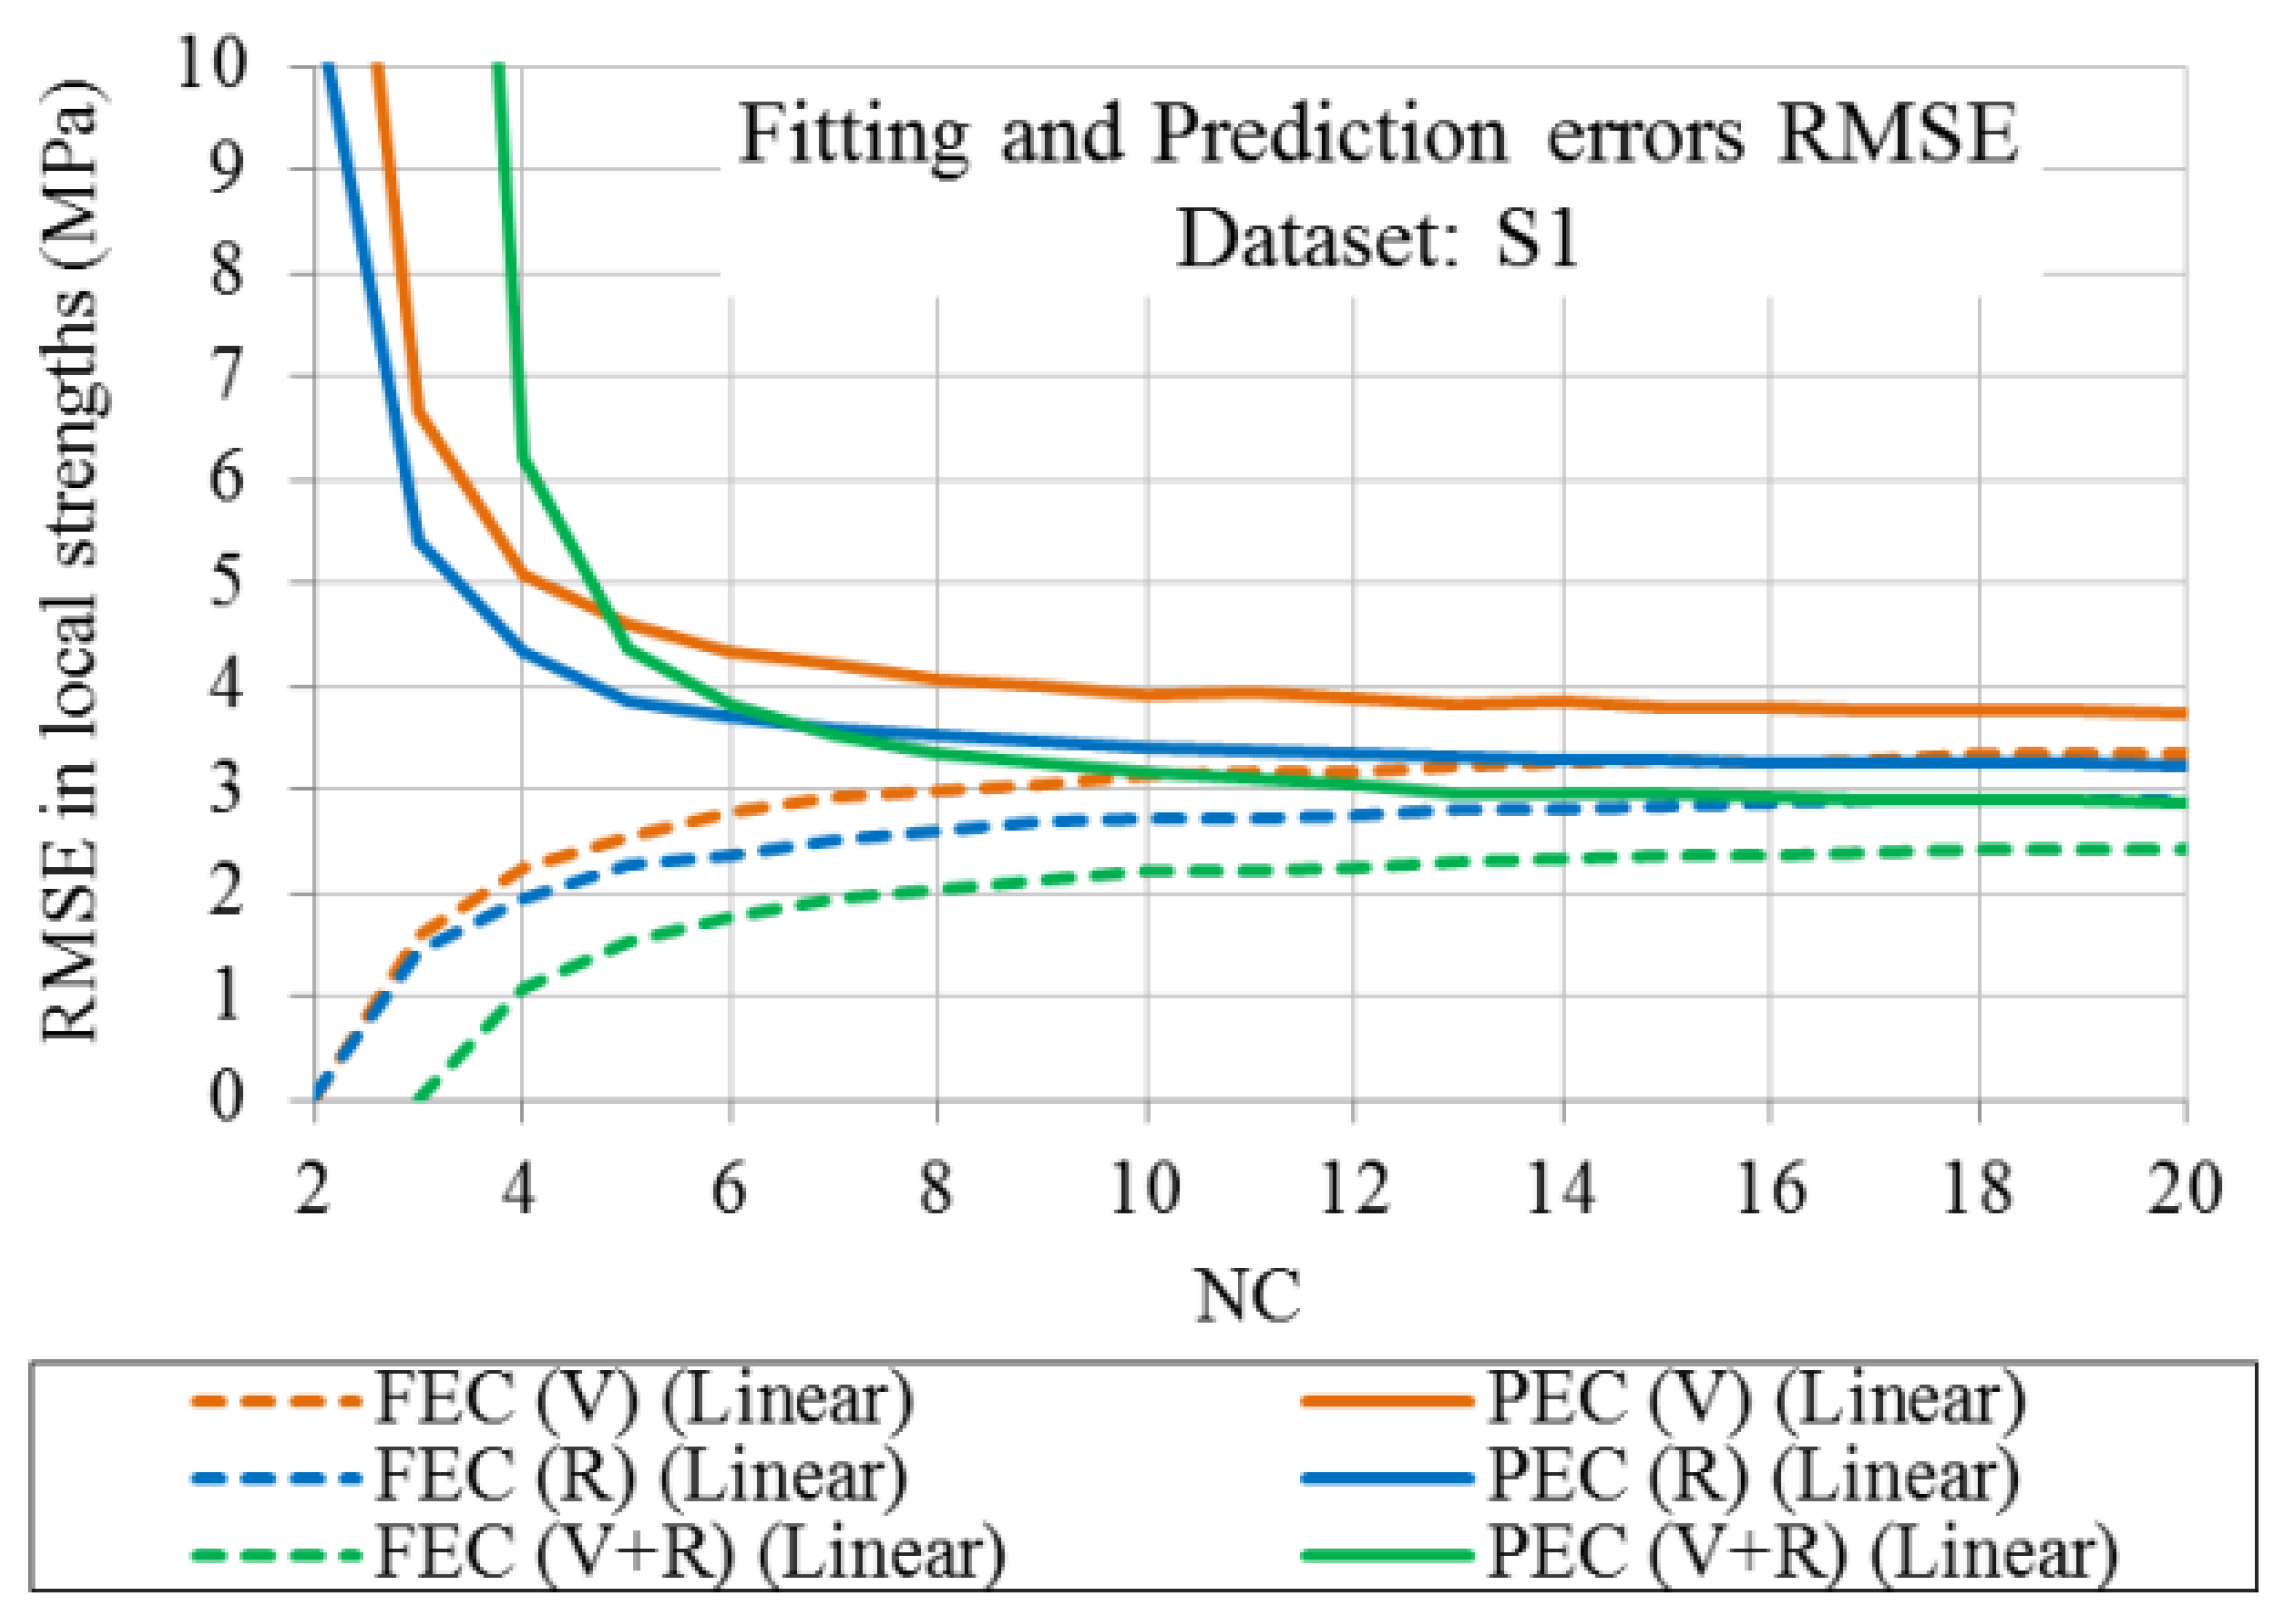
The figure below shows three Fitting Error Curves (FEC) and Prediction Error Curves (PEC) corresponding to three cases (single technique V, single technique R, and combination of V + R).
From
Figure 4, the following can be noted:
The fitting error RMSEfit increases as NC increases. This is rational because the number of points to be fitted using a model having a fixed number of parameters is increased.
The other interesting observation is about the points with RMSEfit = 0 when NC = 2 for the case of a single technique and NC = 3 for the case of combination of NDT techniques. This means that when NC is equal to the number of model parameters, the model parameters can be identified without any fitting error, but the prediction error is very large, i.e., the models have poor predictive ability. This discrepancy must be pointed out, since a very low number of cores is a common practice.
The prediction error exhibits an adverse pattern to that of fitting error, since it decreases while NC increases by increasing NC.
For each of the three cases (V and R measurements alone or in combination), the difference between the FEC and PEC decreases as NC increases.
For all cases, the error of prediction starts stabilisation after six cores. After nine cores, there is no significant improvement in the strength prediction. Therefore, no core is needed after this number.
Figure 4.
Fitting and prediction errors (FEC and PEC) as a function of NC resulting from analyzing the in situ dataset S1 [
40].
Figure 4.
Fitting and prediction errors (FEC and PEC) as a function of NC resulting from analyzing the in situ dataset S1 [
40].
6. Relationship between the Statistical Parameters of the Model “Trade-Off Effect”
Based on the dataset of [
40] composed of triplet of
V,
R, and
fcore, the trade-off effect is analyzed on the SonReb method. In order to analyze the model calibration quality, and to study the effect of calibration on the model parameters, the number of cores (NC) that are subject to calibration is varied between the minimum number of 3 cores and a maximum of 20 cores. This procedure is repeated 10,000 times for each number of cores in order to study the stability of the repetitive process. From each repetition, a model with its own statistical parameters is estimated. This set of parameters varies from one repetition to another. The relationship between models’ parameters is called “trade-off”. This effect has only been studied for the single NDT method [
23]. The authors reported that the relation between the two parameters of all the models having the same form from the literature is linear. On a large experimental database [
13], similar results are presented, as can be seen in
Figure 5. This figure presents the results for both
R and
V measurements. The colours indicate the number of cores used for calibration. It can be seen that increasing NC allows one to decrease the variation range of the parameters “a” and “b”.
Regarding the SonReb method, this effect has not been studied. For this reason, in this paper, the same dataset from [
48] that is composed of on-site measurement of 205 triplet
V,
R, and
fc from a reinforced concrete building was used.
From this database, the SonReb method was tested by calibration.
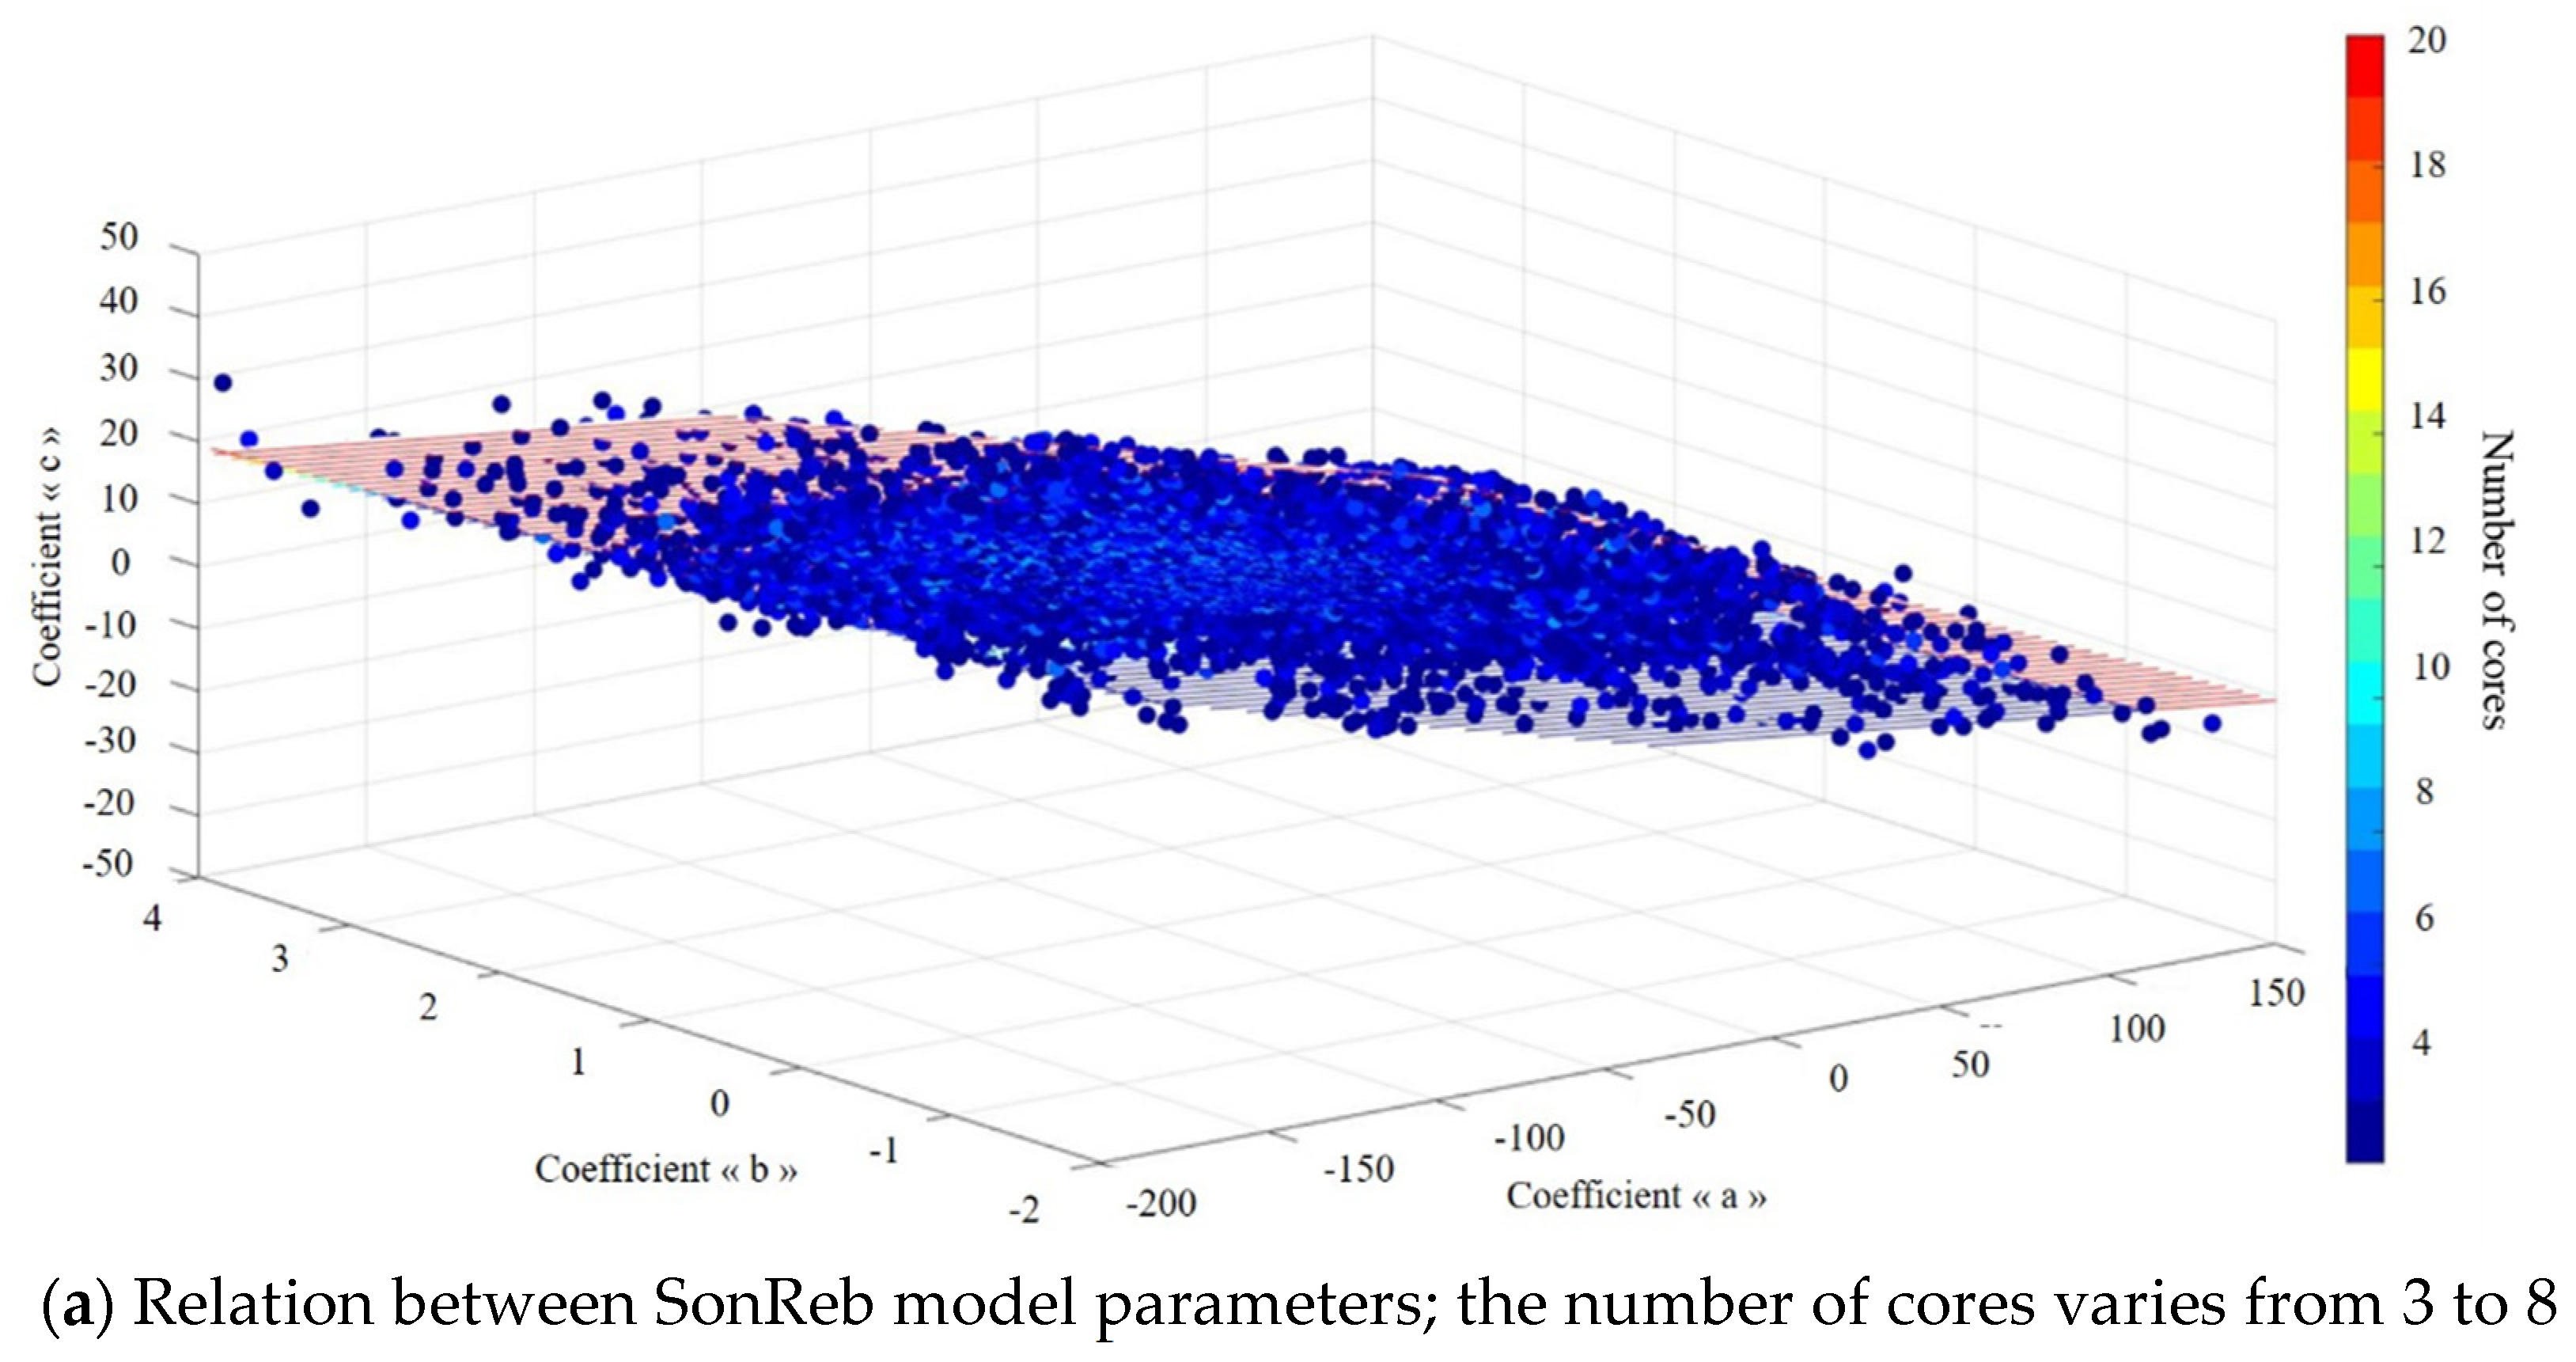
Figure 6 illustrates the trade-off between the statistical parameters “a”, “b”, and “c” of the multivariable model for the combination of rebound and ultrasonic pulse velocity. Furthermore, this trade-off is then analyzed for different NC with 10,000 repetitions for each given number.
For a given NC, each repetition (randomly chosen) has its own model and its own parameters (a, b, and c), which are different from one simulation to another. It is noticed that all the parameters (ai, bi, and ci) of the repetitions (I = 1 to 10,000) for a given NC are on the same plane (ci = f(ai,bi)). Moreover, it is also noticed that even if NC is varied, the sets (ai, bi, and ci) always remain on the same plane. Dispersion of the sets is decreased by as much as the NC increases.
Figure 6 confirms that, in an appropriate reference frame, the parameters a, b, and c of a multivariable model are related by a linear relationship.
It is clearly shown in
Figure 6 that the variation of the NC slightly influences the values of the parameters a, b, and c of the 10,000 repetitions of each NC. These values become closer to the parameters of the whole population model (N) as the NC increases. Moreover, the variation of the NC has a significant influence on the degree of dispersion (standard deviation) of the parameters a, b, and c of each NC.
7. Conclusions
This paper discusses the issues of combining NDT methods in order to assess the concrete compressive strength from a literature point of view. The method is presented, and the mathematical concept is discussed. Even with the combination of NDT, the conversion models identified for a specific concrete cannot be applied for other concretes without calibration procedure. This paper discusses the performance of SonReb and the two methods of calibration (Δ-method and k-method) from a statistical point of view by using Monte Carlo simulation.
In real practice, in order to study the efficiency of combination, the coefficient of determination r2 of the model derived for the combination of NDT techniques is compared with those corresponding to the models established from using these techniques separately. In fact, r2 can be a misleading indicator about the efficiency of combination and may lead to wrong conclusions. Thus, assessing the model prediction capability by using RMSE is an efficient way to decide whether using combined techniques is better than using a single NDT technique.
Using a combination of rebound hammer and ultrasonic pulse velocity techniques with cores for assessing the concrete strength is a common practice. However, there is no consensus about the efficiency of this combination. Some researchers found that it yields results that are more reliable, while others did not find a significant improvement in the concrete assessment by combining methods. A general conclusion about the efficiency of combination methods cannot be provided because it depends on the quality of assessment provided by each specific combination in comparison with what corresponds to the use of only one NDT. Therefore, there is not a general conclusion on the efficiency of SonReb. In fact, for each investigation on a real structure, the evaluation of SonReb efficiency is recommended. This can simply be performed by comparing the RMSE of the prediction from SonReb with the one from a single method (UPV, Rebound, or other method).
Calibration of SonReb on cores taken from structures is very important. The use of a direct model without calibration can lead to wrong evaluation of concrete strength. A shifting method can be applied for the calibration of some models, but its use can over- or underestimate concrete strength. The use of a multiplying factor or a new regression is more efficient.
The use of a prediction dataset for the evaluation of model performance is mandatory. In fact, it is the only way to give realistic information about the predictive capacity of the identified/calibrated model.
Monte Carlo simulation is powerful for evaluating the uncertainty of the SonReb evaluation of concrete compressive strength.
As for the case of one NDT method, SonReb results from the analysis of the trade-off effect demonstrate that the model parameters are correlated linearly, and the number of cores influences the dispersion.
The minimum number of cores is about six to seven cores for stable results. The use of more than nine cores does not significantly improve the quality of the evaluation.
Author Contributions
Methodology, B.K., Z.M.S.; validation, Z.M.S., S.M.E., S.K.; resources, K.A.-B., S.K.; data curation, B.K., M.A., K.A.-B.; writing—original draft preparation, B.K.; writing—review and editing, M.A. S.M.E., S.M.E., N.L., S.K.; supervision, Z.M.S., S.M.E., S.K. All authors have read and agreed to the published version of the manuscript.
Funding
This research received no external funding.
Institutional Review Board Statement
The study was conducted in accordance with the Declaration of Helsinki, and approved by the Institutional Review Board (or Ethics Committee).
Informed Consent Statement
Not applicable.
Data Availability Statement
Data are not available because it was taken from the literature.
Conflicts of Interest
The authors declare that there is no conflict of interest.
References
- Hoła, J.; Schabowicz, K. State-of-the-Art Non-Destructive Methods for Diagnostic Testing of Building Structures—Anticipated Development Trends. Arch. Civ. Mech. Eng. 2010, 10, 5–18. [Google Scholar] [CrossRef]
- Hola, J.; Bien, J.; Sadowski, L.; Schabowicz, K. Non-Destructive and Semi-Destructive Diagnostics of Concrete Structures in Assessment of Their Durability. Bull. Pol. Acad. Sci. Tech. Sci. 2015, 63, 87–96. [Google Scholar] [CrossRef]
- Lehner, P.; Hrabová, K. Relationship of Time-Dependent Parameters from Destructive and Non-Destructive Tests of Structural Concrete. Mathematics 2022, 10, 460. [Google Scholar] [CrossRef]
- Abdallah, W.; Sbartaï, Z.-M.; Saliba, J.; Elachachi, S.M.; Hage Chehade, F.; Sadek, M. Assessment of the Reliability of Concrete Evaluation by Multi-Physical Inversion of NDT Measurements—A Probabilistic Approach. Constr. Build. Mater. 2021, 300, 124371. [Google Scholar] [CrossRef]
- EN 13791:2007; Assessment of in-Situ Compressive Strength in Structures and Precast Concrete Components. Available online: https://standards.iteh.ai/catalog/standards/cen/badbeb09-3270-46d9-a448-9bc18b088968/en-13791-2007 (accessed on 6 September 2022).
- Sbartaï, Z.M.; Laurens, S.; Elachachi, S.M.; Payan, C. Concrete Properties Evaluation by Statistical Fusion of NDT Techniques. Constr. Build. Mater. 2012, 37, 943. [Google Scholar] [CrossRef]
- Sbartaï, Z.M.; Garnier, V.; Villain, G.; Breysse, D. 8—Assessment of Concrete by a Combination of Non-Destructive Techniques. In Non-Destructive Testing and Evaluation of Civil Engineering Structures; Balayssac, J.-P., Garnier, V., Eds.; Elsevier: Amsterdam, The Netherlands, 2018; pp. 259–297. ISBN 978-1-78548-229-8. [Google Scholar]
- Breysse, D.; Villain, G.; Sbartaï, Z.M.; Garnier, V. 7—Construction of Conversion Models of Observables into Indicators. In Non-Destructive Testing and Evaluation of Civil Engineering Structures; Balayssac, J.-P., Garnier, V., Eds.; Elsevier: Amsterdam, The Netherlands, 2018; pp. 231–257. ISBN 978-1-78548-229-8. [Google Scholar]
- Wang, W.; Lu, C.; Yuan, G.; Zhang, Y. Effects of Pore Water Saturation on the Mechanical Properties of Fly Ash Concrete. Constr. Build. Mater. 2017, C, 54–63. [Google Scholar] [CrossRef]
- Gehlen, C.; Dauberschmidt, C.; Nürnberger, U. Zustandserfassung Bestehender Bausubstanz Mit Hil-Fe Leistungsgerecht Differenzierender Prüftechnik. Otto-Graf-J. 2006, 17, 26. [Google Scholar]
- Cristofaro, M.T.; Viti, S.; Tanganelli, M. New Predictive Models to Evaluate Concrete Compressive Strength Using the SonReb Method. J. Build. Eng. 2020, 27, 100962. [Google Scholar] [CrossRef]
- Diaferio, M. Correlation Curves for Concrete Strength Assessment Through Non-Destructive Tests. 2022. Available online: https://ssrn.com/abstract=4177623 (accessed on 1 August 2022).
- Ali-Benyahia, K.; Sbartaï, Z.-M.; Breysse, D.; Ghrici, M.; Kenai, S. Improvement of Nondestructive Assessment of On-Site Concrete Strength: Influence of the Selection Process of Cores Location on the Assessment Quality for Single and Combined NDT Techniques. Constr. Build. Mater. 2019, 195, 613–622. [Google Scholar] [CrossRef]
- Bonagura, M.; Nobile, L. Artificial Neural Network (ANN) Approach for Predicting Concrete Compressive Strength by SonReb. Struct. Durab. Health Monit. 2021, 15, 125–137. [Google Scholar] [CrossRef]
- Alwash, M.F.A. Assessment of Concrete Strength in Existing Structures Using Nondestructive Tests and Cores: Analysis of Current Methodology and Recommendations for More Reliable Assessment. Ph.D Thesis, Université de Bordeaux, Talence, France, 2017. [Google Scholar]
- El Mir, A.; Nehme, S.G. Repeatability of the Rebound Surface Hardness of Concrete with Alteration of Concrete Parameters. Constr. Build. Mater. 2017, 131, 317–326. [Google Scholar] [CrossRef]
- RILEM TC 43-CND Draft Recommendation for in Situ Concrete Strength Determination by Combined Non-Destructive Methods. Mater. Struct. 1993, 43–49.
- Cianfrone, F.; Facaoaru, I. Study on the Introduction into Italy on the Combined Non-Destructive Method, for the Determination Ofin Situ Concrete Strength. Matér. Constr. 1979, 12, 413–424. [Google Scholar] [CrossRef]
- Qasrawi, H.Y. Concrete Strength by Combined Nondestructive Methods Simply and Reliably Predicted. Cem. Concr. Res. 2000, 30, 739–746. [Google Scholar] [CrossRef]
- IAEA Annual Report for 2002. Available online: https://www.iaea.org/publications/reports/annual-report-2002 (accessed on 7 September 2022).
- Galan, A. Détermination des caractéristiques de résistance du béton d’après les mesures de propagation d’ultra-sons combinées avec les données sclérométriques. Matér. Constr. 1984, 17, 201–206. [Google Scholar] [CrossRef]
- Breysse, D.; Balayssac, J.-P.; Biondi, S.; Corbett, D.; Goncalves, A.; Grantham, M.; Luprano, V.A.M.; Masi, A.; Monteiro, A.V.; Sbartai, Z.M. Recommendation of RILEM TC249-ISC on Non Destructive in Situ Strength Assessment of Concrete. Mater. Struct. 2019, 52, 71. [Google Scholar] [CrossRef]
- Breysse, D. Nondestructive Evaluation of Concrete Strength: An Historical Review and a New Perspective by Combining NDT Methods. Constr. Build. Mater. 2012, 33, 139–163. [Google Scholar] [CrossRef]
- Kheder, G.F. A Two Stage Procedure for Assessment of in Situ Concrete Strength Using Combined Non-Destructive Testing. Mater. Struct. 1999, 32, 410. [Google Scholar] [CrossRef]
- Atici, U. Prediction of the Strength of Mineral Admixture Concrete Using Multivariable Regression Analysis and an Artificial Neural Network. Expert Syst. Appl. 2011, 38, 9609–9618. [Google Scholar] [CrossRef]
- Soshiroda, T.; Voraputhaporn, K.; Nozaki, Y. Early-Stage Inspection of Concrete Quality in Structures by Combined Nondestructive Method. Mater. Struct. 2006, 39, 149. [Google Scholar] [CrossRef]
- Porco, F.; Uva, G.; Fiore, A.; Mezzina, M. Assessment of Concrete Degradation in Existing Structures: A Practical Procedure. Struct. Eng. Mech. 2014, 52, 701–721. [Google Scholar] [CrossRef]
- Machado, M.; Shehata, L.; Shehata, I. Correlation Curves to Characterize Concretes Used in Rio de Janeiro by Nondestructive Tests. Rev. Ibracon Estrut. Mater. 2009, 2, 100–123. [Google Scholar] [CrossRef]
- Ravindrajah, R.S.; Loo, Y.H.; Tam, C.T. Strength Evaluation of Recycled-Aggregate Concrete Byin-Situ Tests. Mater. Struct. 1988, 21, 289. [Google Scholar] [CrossRef]
- AL-Ameeri, A.; Al-Hussain, K.; Essa, M. Predicting a Mathematical Models of Some Mechanical Properties of Concrete from Non-Destructive Testing. Civ. Environ. Res. 2013, 3, 78–97. [Google Scholar]
- Shariati, M.; Ramli-Sulong, N.H.; Arabnejad, M.M.; Shafigh, P.; Sinaei, H. Assessing the Strength of Reinforced Concrete Structures Through Ultrasonic Pulse Velocity and Schmidt Rebound Hammer Tests. Sci. Res. Essays 2011, 6, 213–220. [Google Scholar]
- Meynink, P.; Samarin, A. Assessment of Compressive Strength of Concrete by Cylinders, Cores, and Non Destructive Tests. In Proceedings of the Quality Control of Concrete Structures, Rilem Symposium, Stockholm, Sweden, 17–21 June 1979; Volume 1. [Google Scholar]
- Proverbio, E.; Venturi, V. Reliability of Nondestructive Tests for on Site Concrete Strength Assessment. In Proceedings of the 10DBMC International Conférence On Durability of Building Materials and Components, Lyon, France, 17–20 April 2005; Volume 8. [Google Scholar]
- Postacioglu, B. Nouvelles significations de l’indice sclérométrique Schmidt et de la vitesse de propagation des ultra-sons. Mater. Struct. 1985, 18, 447–451. [Google Scholar] [CrossRef]
- Turgut, P.; Kucuk, O.F. Comparative Relationships of Direct, Indirect, and Semi-Direct Ultrasonic Pulse Velocity Measurements in Concrete. Russ. J. Nondestruct. Test. 2006, 42, 745. [Google Scholar] [CrossRef]
- Cristofaro, M.; Nudo, R.; Tanganelli, M.; D’Ambrisi, A.; Stefano, M.; Pucinotti, R. Issues Concerning the Assessment of Concrete Compressive Strength in Existing Buildings: Application to a Case Study. Struct. Concr. 2017, 19. [Google Scholar] [CrossRef]
- Ross, S.M. Introduction to Probability and Statistics for Engineers and Scientists, Student Solutions Manual; University of Southern California: Los Angeles, CA, USA; Academic Press: Cambridge, MA, USA, 2009; ISBN 978-0-08-091942-3. [Google Scholar]
- Hobbs, B.; Tchoketch Kebir, M. Non-Destructive Testing Techniques for the Forensic Engineering Investigation of Reinforced Concrete Buildings. Forensic Sci. Int. 2007, 167, 167–172. [Google Scholar] [CrossRef]
- Komlosš, K.; Popovics, S.; Nürnbergerová, T.; Babál, B.; Popovics, J.S. Ultrasonic Pulse Velocity Test of Concrete Properties as Specified in Various Standards. Cem. Concr. Compos. 1996, 18, 357–364. [Google Scholar] [CrossRef]
- Vincenza, L.; Flavio, C.; Nicola, L.; Gabriele, C.; Angelo, T.; Antonella, T.; Valerio, P. Non Destructive Test Methods for Evaluation of Concrete: The Case Study of Punta Perotti (Italy). In Proceedings of the 11DBMC Conference on Durability of Building Materials and Components, Istanbul, Turkey, 11–14 May 2008; Volume 9. [Google Scholar]
- Montgomery, D.C.; Runger, G.C. Applied Statistics and Probability for Engineers; John Wiley & Sons: Hoboken, NJ, USA, 2010; ISBN 978-0-470-05304-1. [Google Scholar]
- Alwash, M.; Breysse, D.; Sbartaï, Z.M. Non-Destructive Strength Evaluation of Concrete: Analysis of Some Key Factors Using Synthetic Simulations. Constr. Build. Mater. 2015, 99, 235–245. [Google Scholar] [CrossRef]
- Pucinotti, R. Reinforced Concrete Structure: Non Destructive in Situ Strength Assessment of Concrete. Constr. Build. Mater. 2014, 75, 331–341. [Google Scholar] [CrossRef]
- Hannachi, S.; Guetteche, M.N. Application of the Combined Method for Evaluating the Compressive Strength of Concrete on Site. Open J. Civ. Eng. 2012, 2, 16–21. [Google Scholar] [CrossRef]
- Masi, A.; Vona, M. La stima della resistenza del calcestruzzo in situ: Impostazione delle indagini ed elaborazione dei risultati. Progett. Sismica 2009. [Google Scholar]
- Nobile, L. Prediction of Concrete Compressive Strength by Combined Non-Destructive Methods. Meccanica 2015, 2, 411–417. [Google Scholar] [CrossRef]
- Masi, A.; Chiauzzi, L.; Manfredi, V. Criteria for Identifying Concrete Homogeneous Areas for the Estimation of In-Situ Strength in RC Buildings. Constr. Build. Mater. 2016, 121, 576–587. [Google Scholar] [CrossRef]
- Ali-Benyahia, K.; Sbartaï, Z.-M.; Breysse, D.; Kenai, S.; Ghrici, M. Analysis of the Single and Combined Non-Destructive Test Approaches for on-Site Concrete Strength Assessment: General Statements Based on a Real Case-Study. Case Stud. Constr. Mater. 2017, 6, 109–119. [Google Scholar] [CrossRef]
| Publisher’s Note: MDPI stays neutral with regard to jurisdictional claims in published maps and institutional affiliations. |
© 2022 by the authors. Licensee MDPI, Basel, Switzerland. This article is an open access article distributed under the terms and conditions of the Creative Commons Attribution (CC BY) license (https://creativecommons.org/licenses/by/4.0/).


 ,
, 


