1. Introduction
Steel and concrete have been extensively used in the construction of buildings and infrastructure. However, their production can produce large amounts of pollution and carbon dioxide emissions. Compared with traditional construction materials (e.g., steel and concrete), wood is renewable and sustainable and can significantly reduce carbon dioxide emissions. Moreover, it has a high specific strength and good seismic performance, attracting great interest from civil engineers and researchers. In fact, many traditional Chinese buildings, e.g., the Forbidden City, or the Pagoda of Yingxian County, were made of structural wood. Moreover, modern timber houses are widely adopted in developed countries and regions, such as Northern Europe, North America, New Zealand and Japan [
1,
2]. Although structural wood exhibits many advantages, it is sensitive to elevated and high temperatures. When exposed to fire, several physical changes and chemical reactions occur within the wood [
3,
4,
5,
6]. As a result, the mechanical properties of the structural wood may significantly reduce [
7].
Several investigations have been conducted to explore the thermal and mechanical degradations of structural wood under fire or elevated temperatures. The research on the tensile strength of wood at high temperature can be traced back to the experimental study reported by Schaffer et al. [
8] on the parallel-to-grain tensile strength of Douglas fir at temperatures between 25 °C and 288 °C. It was found that the tensile strength decreased slightly from room temperature to 175 °C, and then reduced significantly when the temperature was higher than 175 °C. Östman [
9] reported the parallel-to-grain tensile properties of spruce at temperatures between 25 °C and 250 °C. It was found that the tensile strength of spruce at 250 °C is 35% of that at room temperature while the tensile modulus is 53% of that at room temperature. Yang [
10] conducted parallel-to-grain tensile experiments on larch and Douglas-fir wood at temperatures from 20 °C to 250 °C, considering three temperature durations of 60, 120 and 180 min. A nonlinear relationship was found between the ultimate tensile strength and the temperature. The reduction in the tensile strength was slight in the range of 100 to 150 °C and the peak tensile strength was found in the range of 150 to 200 °C. When the temperature was higher than 200 °C, the tensile strength decreased rapidly. For the specimens with a temperature duration of 60 min, the average tensile strength of Douglas fir and larch at 250 °C was 33% of that at room temperature. Pearson et al. [
11] studied the influence of moisture content and temperature on the tensile properties of New Zealand pine, and the tensile stress–strain relationship under different moisture content and temperature was presented and discussed.
Schaffer et al. [
8] reported the compressive properties of dried Douglas-fir wood at elevated temperatures. The results showed that the compressive strength decreased slowly as the temperature rose from room temperature to 288 °C. Yang [
10] studied the parallel-to-grain compressive strength of Douglas fir and larch wood at elevated temperatures. It was found that the failure mode of the specimens at temperatures from 20 °C to 130 °C was kinking. As the temperature increased from 130 °C to 250 °C, end crushing was the typical failure mode. Bednarek et al. [
12] reported the parallel-to-grain compressive properties of oak and pine wood at temperatures from 50 °C to 230 °C. The compression performance of Brazilian paricá wood at elevated temperatures was investigated by Figueroa et al. [
13] via three different heating treatment methods (steady-state heating HT, heat treatment TT and water-saturated WS). It was found that the heating treatment and wood moisture content had a great impact on compressive performance. When the temperature increased from room temperature to 150 °C, the moisture content was close to zero. Furthermore, when the temperature was higher than 150 °C, the color of the wood was significantly deepened. The compressive strength of the HT specimen decreased by 23% from room temperature to 80 °C. Subsequently, it increased to the maximum value from 80 °C to 150 °C due to the reduction of the water content. When the temperature increased from 150 °C to 230 °C, the compressive strength decreased nonlinearly due to the gradual cracking of cellulose. As a result, the compressive strength at 230 °C is 35% of that at room temperature [
14]. Based on the above experiments, it was found that the moisture content in wood is an important factor affecting the mechanical properties. The tensile and compressive strengths of the wood generally decreased with the increase in temperature from 20 °C to 300 °C. However, in some cases, the tensile and compressive strength increased significantly as the temperature increased from approximately 100 °C to 160 °C.
In China, fast-grown Paulownia wood is extensively used in timber structures and wood-cored sandwich structures. However, the mechanical properties of Chinese Paulownia wood exposed to elevated temperatures is yet to be known. This paper aims to study the effect of elevated temperatures on the parallel-to-grain tensile and compressive performance of Paulownia wood. Thermal analysis was conducted to investigate thermal degradation at high temperatures. Tensile and compressive experiments on clear Paulownia wood at elevated temperatures from 20 °C to 220 °C were conducted. The failure modes of the specimens were presented. Moreover, the temperature-dependent progressions of the moisture, strength and deformation capacity were also presented and discussed.
2. Experimental Program
2.1. Materials
In this study, Chinese Paulownia wood from Shandong province was used as the test material.
Table 1 shows the basic physical and mechanical properties at ambient temperature. The apparent density of the Paulownia wood was determined as 353 kg/m
3. The average moisture content was measured as 10.9% according to GB/T 1931-2009 [
15]. The parallel-to-grain tensile strength and the parallel-to-grain compressive strength were measured according to GB/T 1938-2009 [
16] and GB/T 1935-2009 [
17], respectively. Moreover, the tangential shear and radial shear strengths were tested according to GB/T 1937-2009 [
18]. The parallel-to-grain tensile modulus and compressive modulus at ambient temperature were 5.6 GPa and 4.9 GPa, respectively.
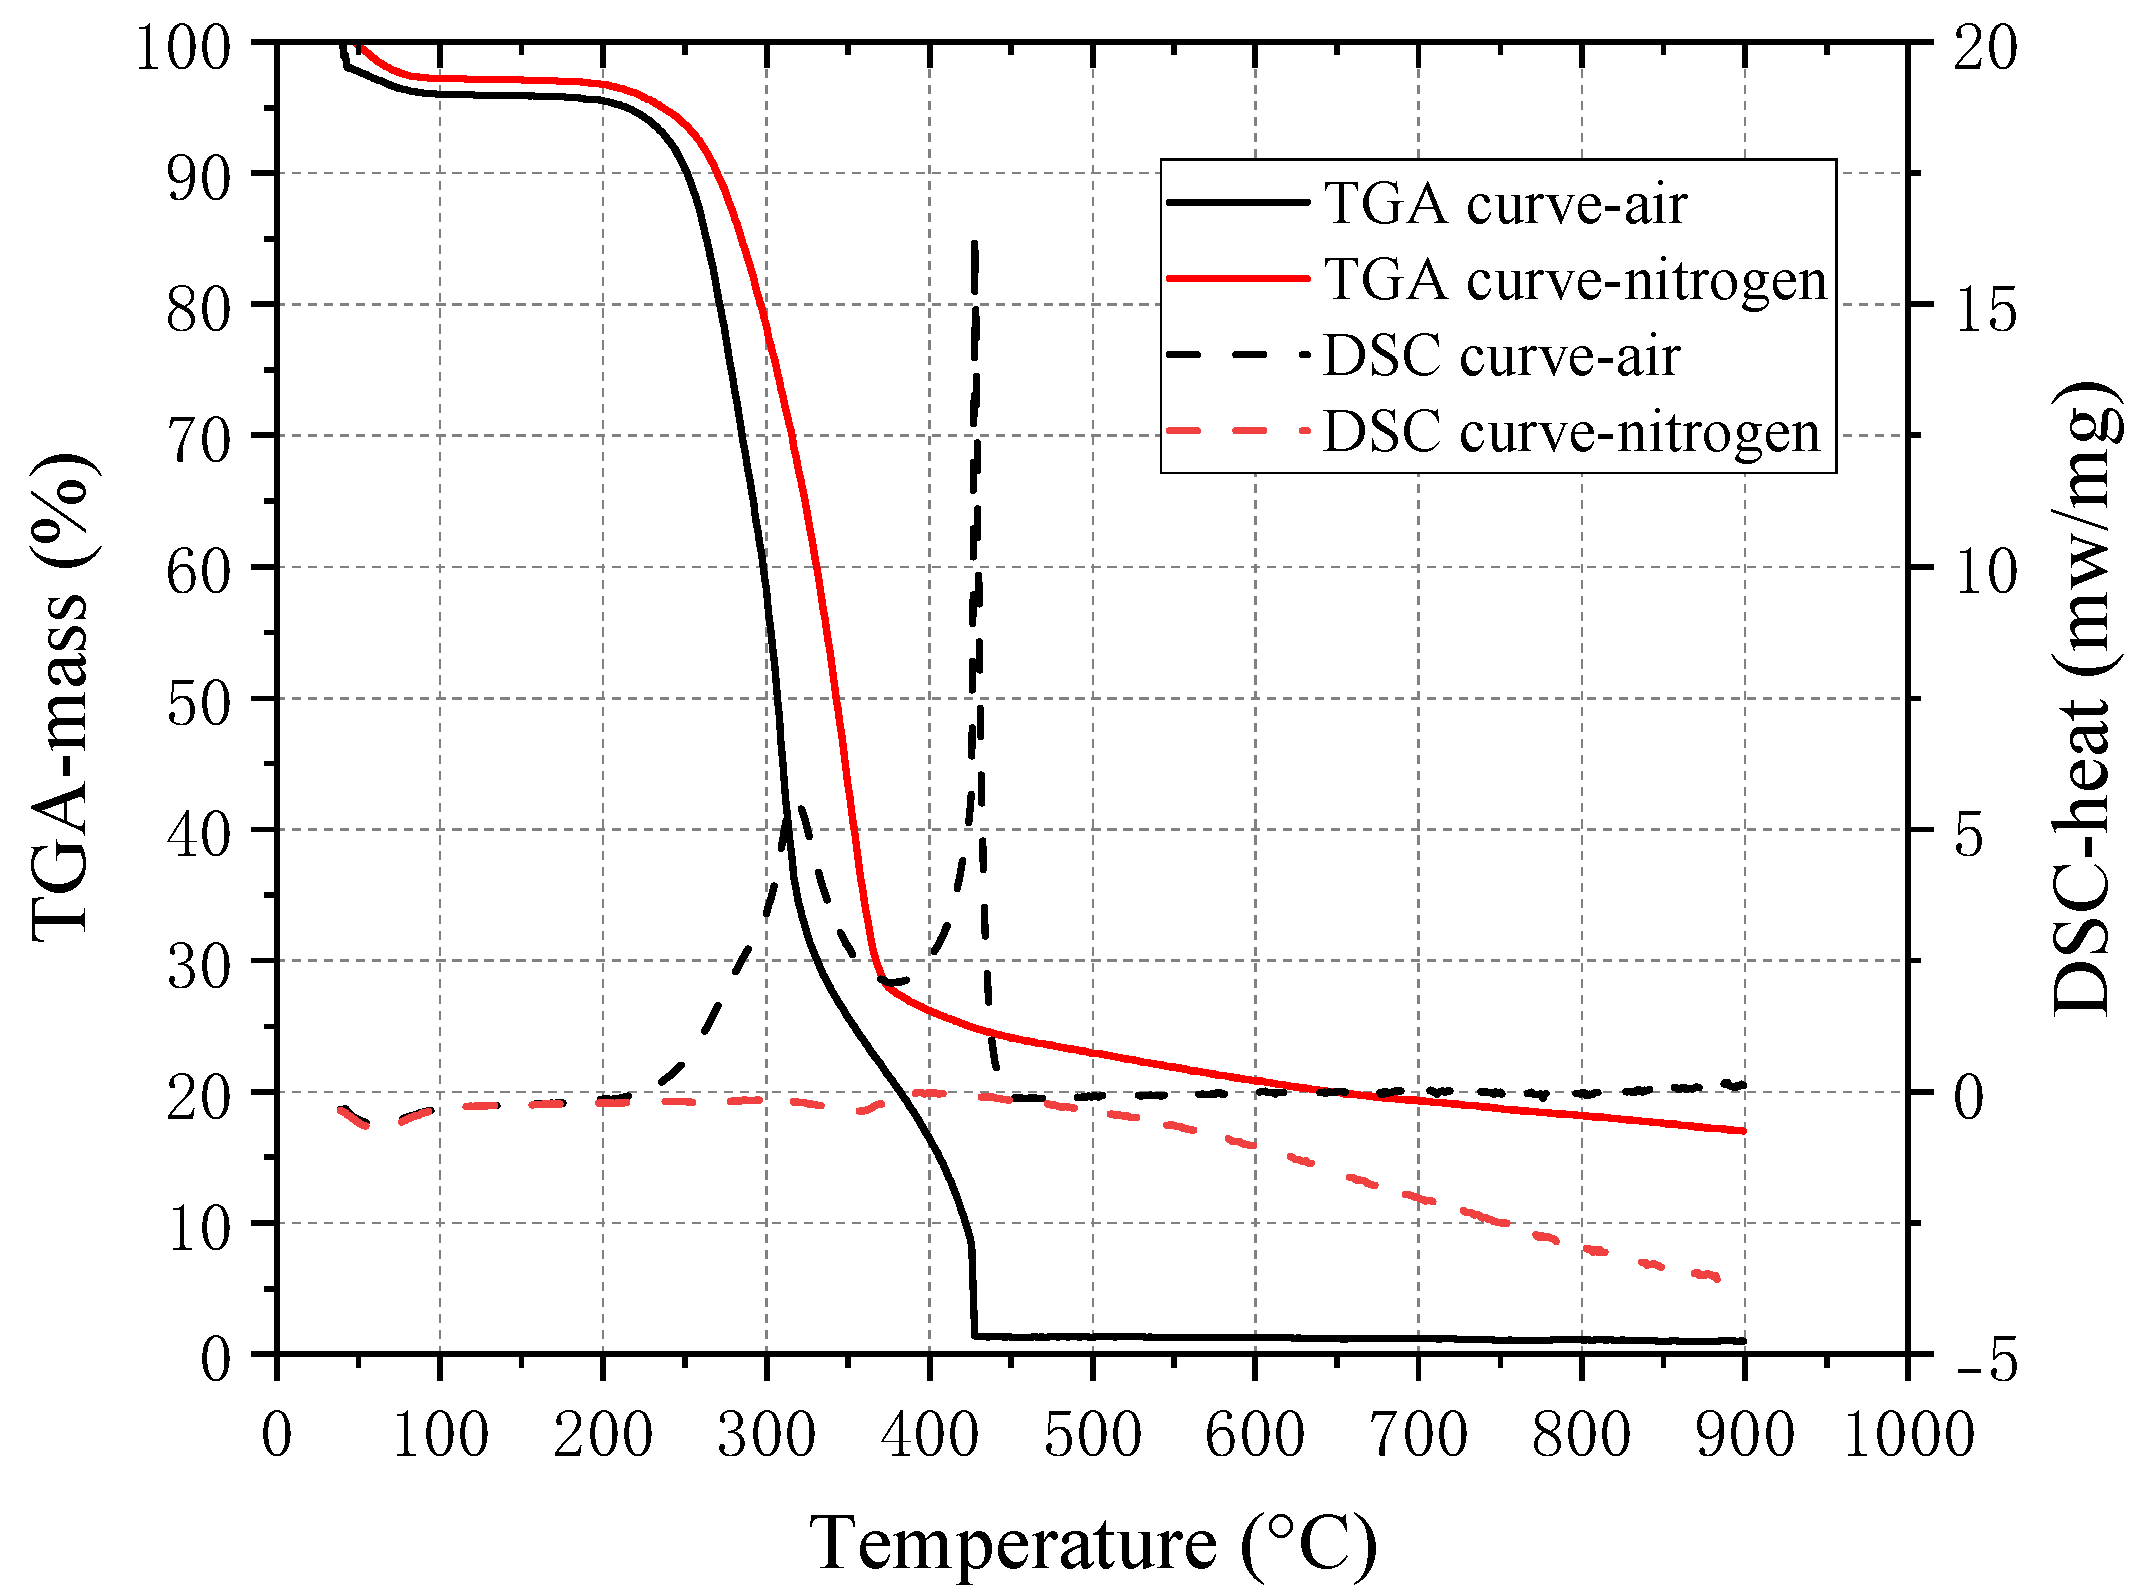
Thermogravimetric analysis (TGA) and differential scan calorimeter (DSC) tests were conducted from room temperature to 900 °C at a heating rate of 10 °C/min. The powder of the Paulownia wood was used as the sample. Before the thermal test, the sample was placed in a standard condition room. Air and nitrogen atmospheres were adopted as purge gases and nitrogen was used as the protection gas.
2.2. Specimens
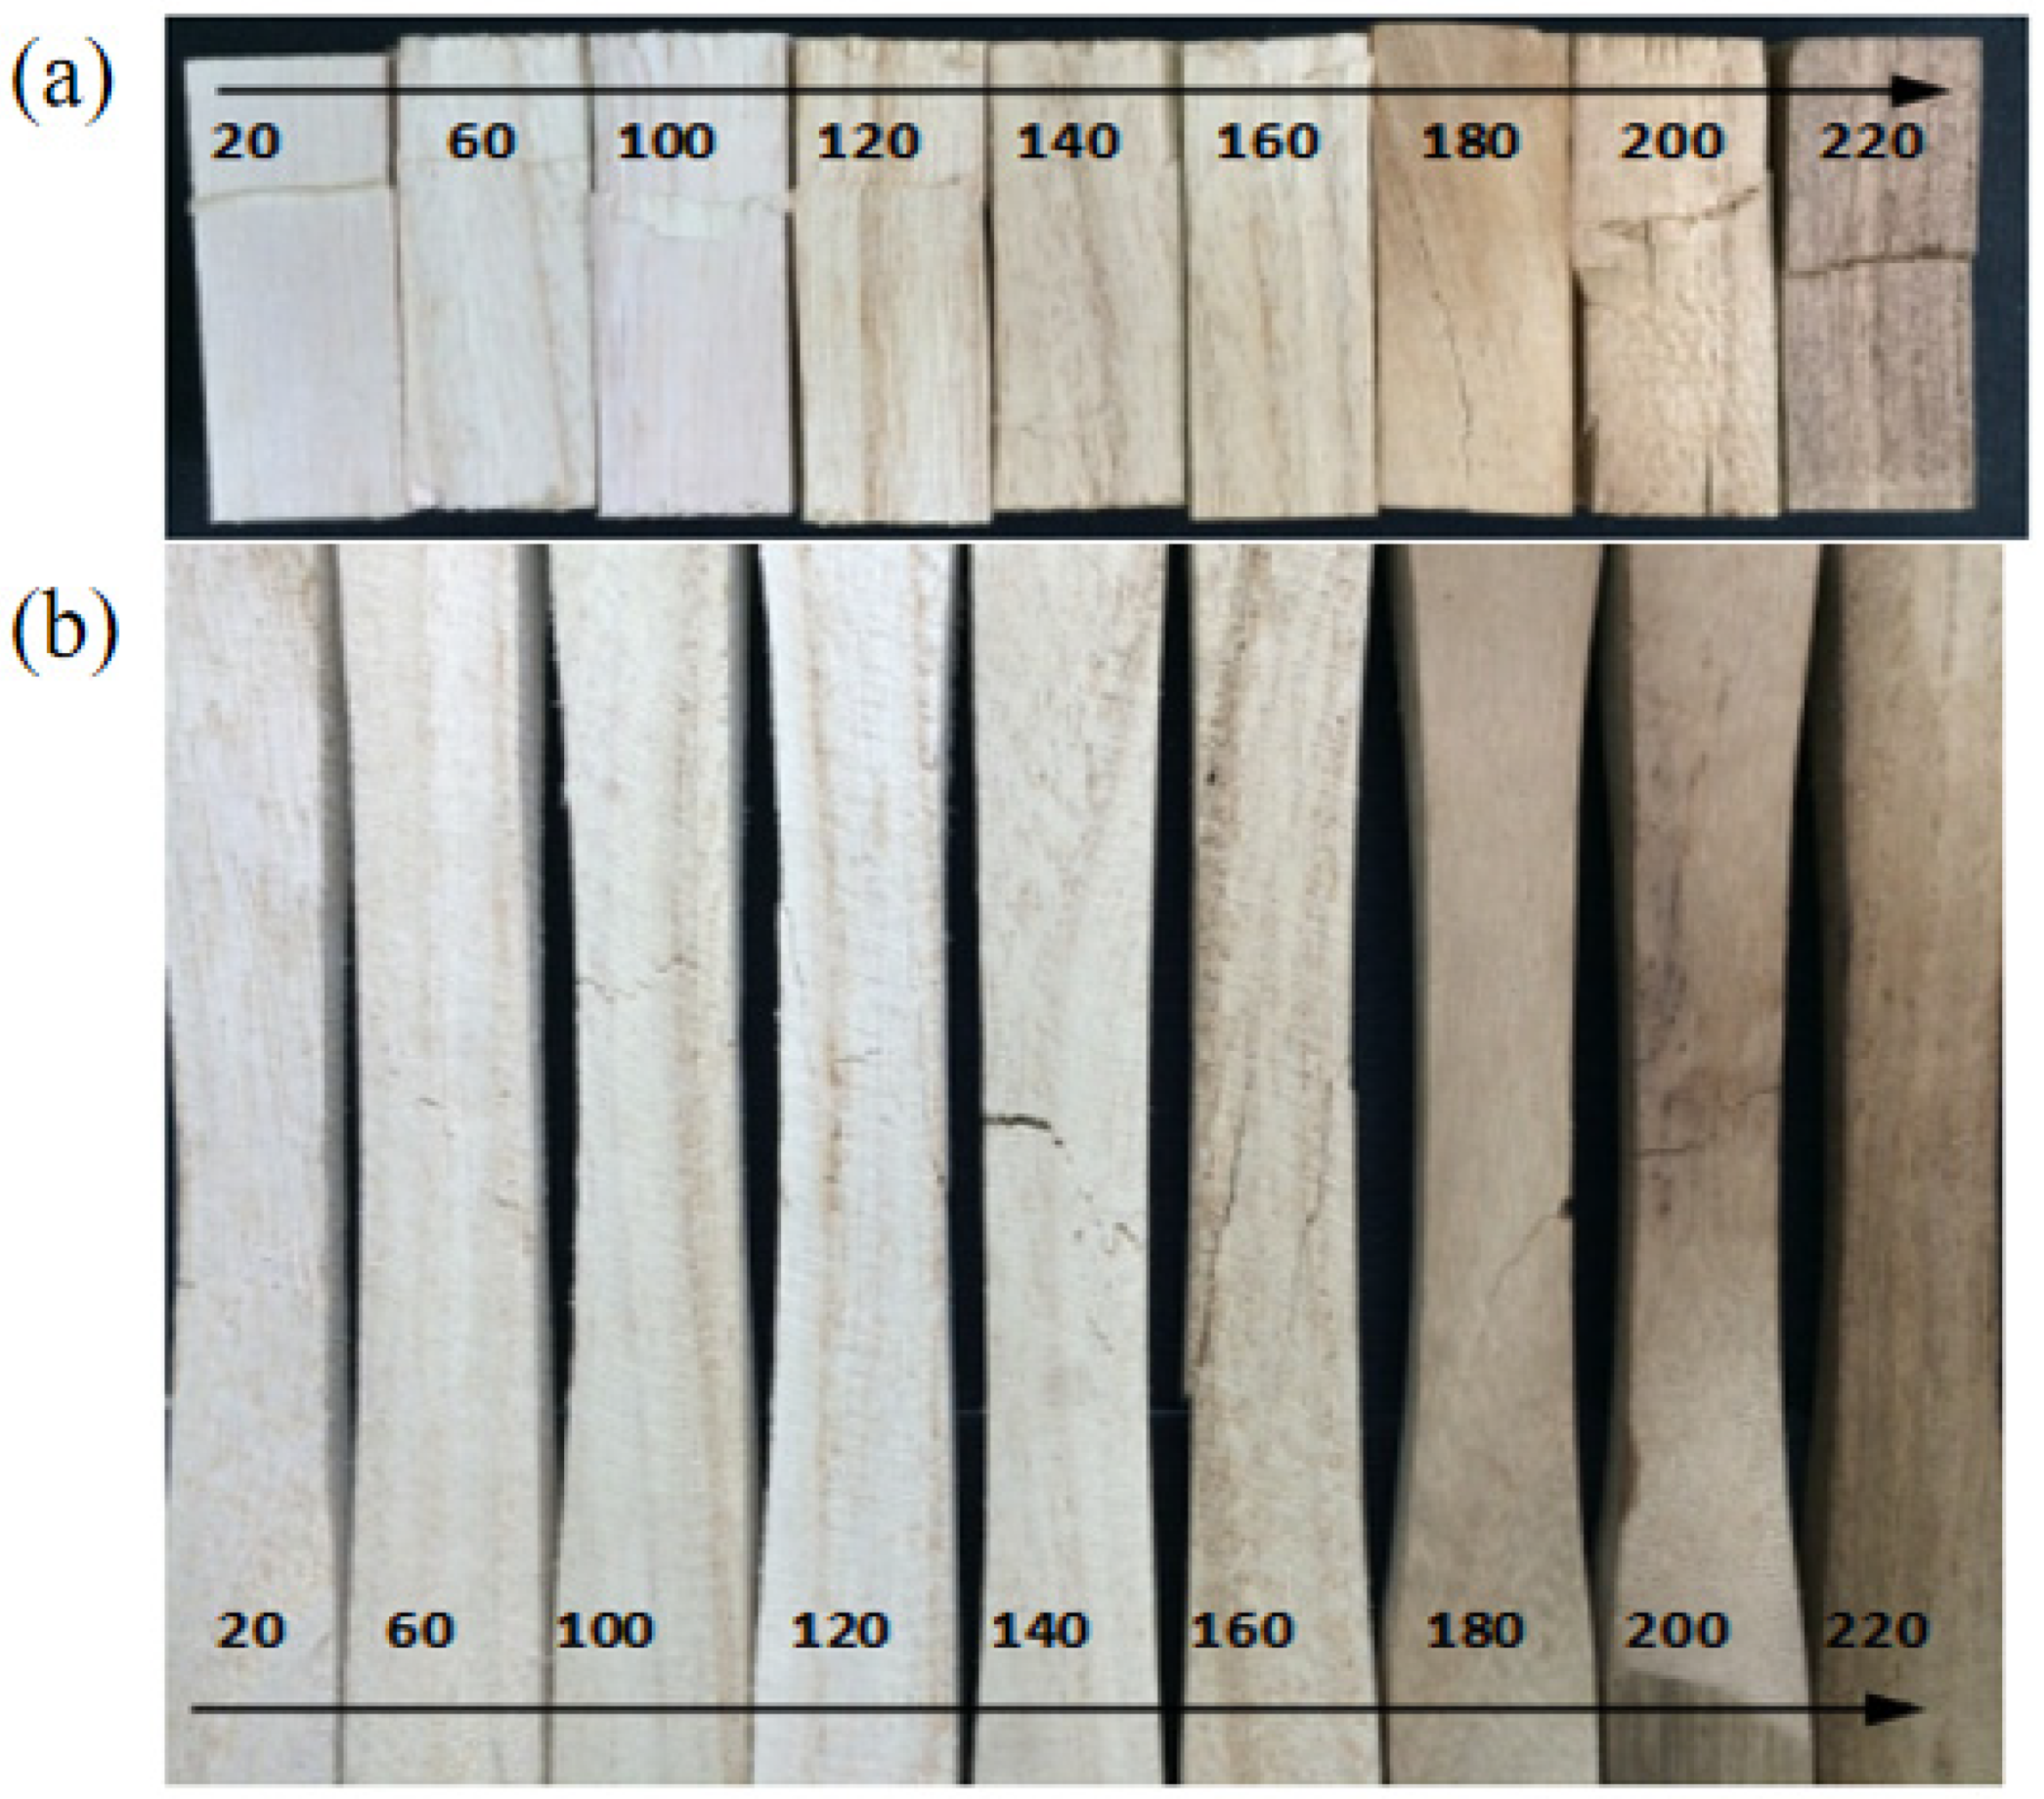
The appearance of the specimens is shown in
Figure 1a. The clear specimens were cut from the Paulownia wood panel. The geometry of the tensile specimens is shown in
Figure 1b. The size of the compressive specimens is 20 mm × 20 mm × 60 mm, according to GB/T 15777-1995 [
19]. A total of 54 tensile specimens and 54 compressive specimens were designed and fabricated. Six repeated specimens were tested for each target temperature.
2.3. Experimental Instruments and Setup
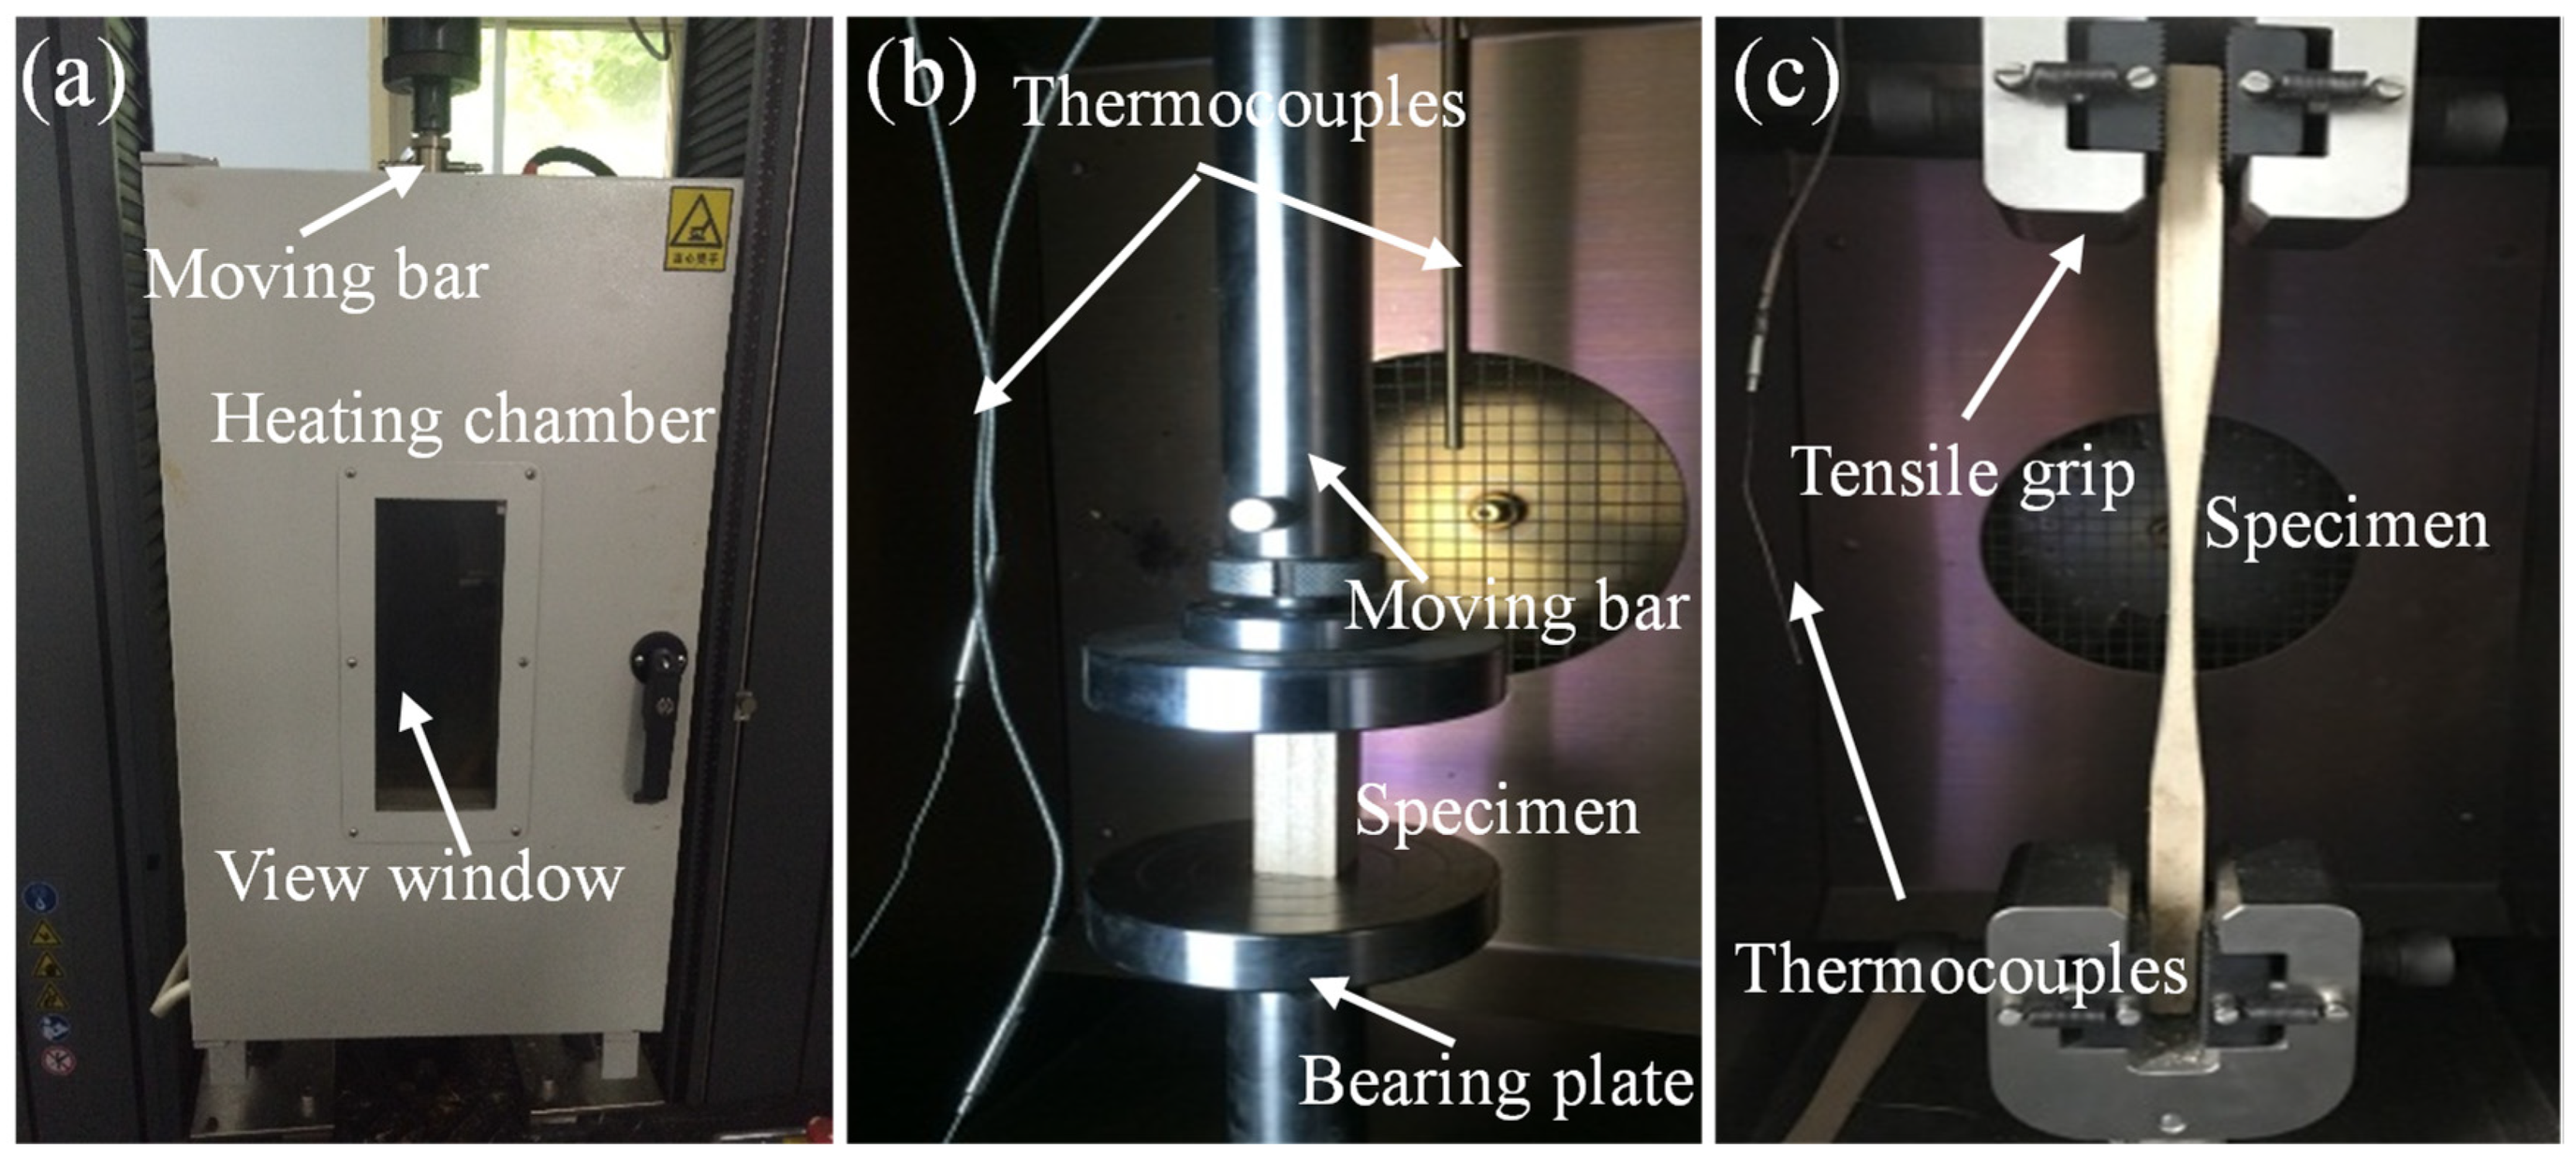
Figure 2 presents the configuration of the heating chamber with compressive and tensile fixtures for the uniaxial compressive and tensile tests. All specimens were firstly cured in the condition room with an average temperature of 20 °C and an average relative humidity of 65%. Subsequently, the density and moisture content were measured before the test. Then, the specimen was placed into the heating chamber. In order to measure the moisture content, five wood cube samples with a length of 20 mm were simultaneously placed in the heating chamber. The specimens were heated to the specified temperature, which was then maintained for 10 min before the mechanical loading. As shown in
Figure 2b, the compressive load was transferred from the universal test machine to the specimen via the moving steel bar with a bearing plate. For the tensile specimen, the ends were fixed with the grips, as depicted in
Figure 2c. All the specimens were loaded with a loading rate of 2 mm/min up to the end of the tests. After the failure of the specimen, the cube samples were weighed to determine the moisture content.
3. Experimental Results and Discussion
3.1. Thermal Analysis
Figure 3 shows the TGA and DSC curves of the Paulownia wood exposed to air and nitrogen atmospheres. The mass loss of the sample in air can be generally divided into three stages. In the first stage, the mass retention rate decreased from 100% at 39 °C to 96% at 120 °C, due to the moisture evaporation. The second stage was the thermal decomposition from 200 °C to 378 °C. As a result, the mass retention rate reduced from 95.5% at 200 °C to 20.5% at 378 °C. In the third stage, the mass loss was nearly 98.6% at 430 °C, indicating that the char was almost completely oxidized. Regarding the sample exposed to nitrogen, it exhibited similar mass loss during the moisture evaporation and the thermal decomposition stages. However, the TGA curve of the sample in nitrogen moved rightward compared to that of the sample in air, indicating the thermal decomposition in nitrogen occurred later than that in air. Moreover, the mass slowly decreased from 26% at 400 °C to 17% at the end of the test while the mass of the sample in air was almost constant (1–1.4%) above 430 °C. Based on the DSC curves, it is worth noting that the thermal decomposition in nitrogen was an endothermic reaction while the thermal decomposition and oxidation in air are exothermic reactions. In an actual fire scenario, a thermal decomposition reaction occurs within the wood, and the volatile combustible gases are continuously transmitted to the surface of the structure and burned, consuming a large amount of oxygen. Since the air pressure in the thermal decomposition area is much higher than the pressure on the surface of the component, it is difficult for oxygen to enter the interior of the wood. Therefore, it can be inferred that only a thermal decomposition reaction may occur within the wood when subjected to fire.
3.2. Failure Modes
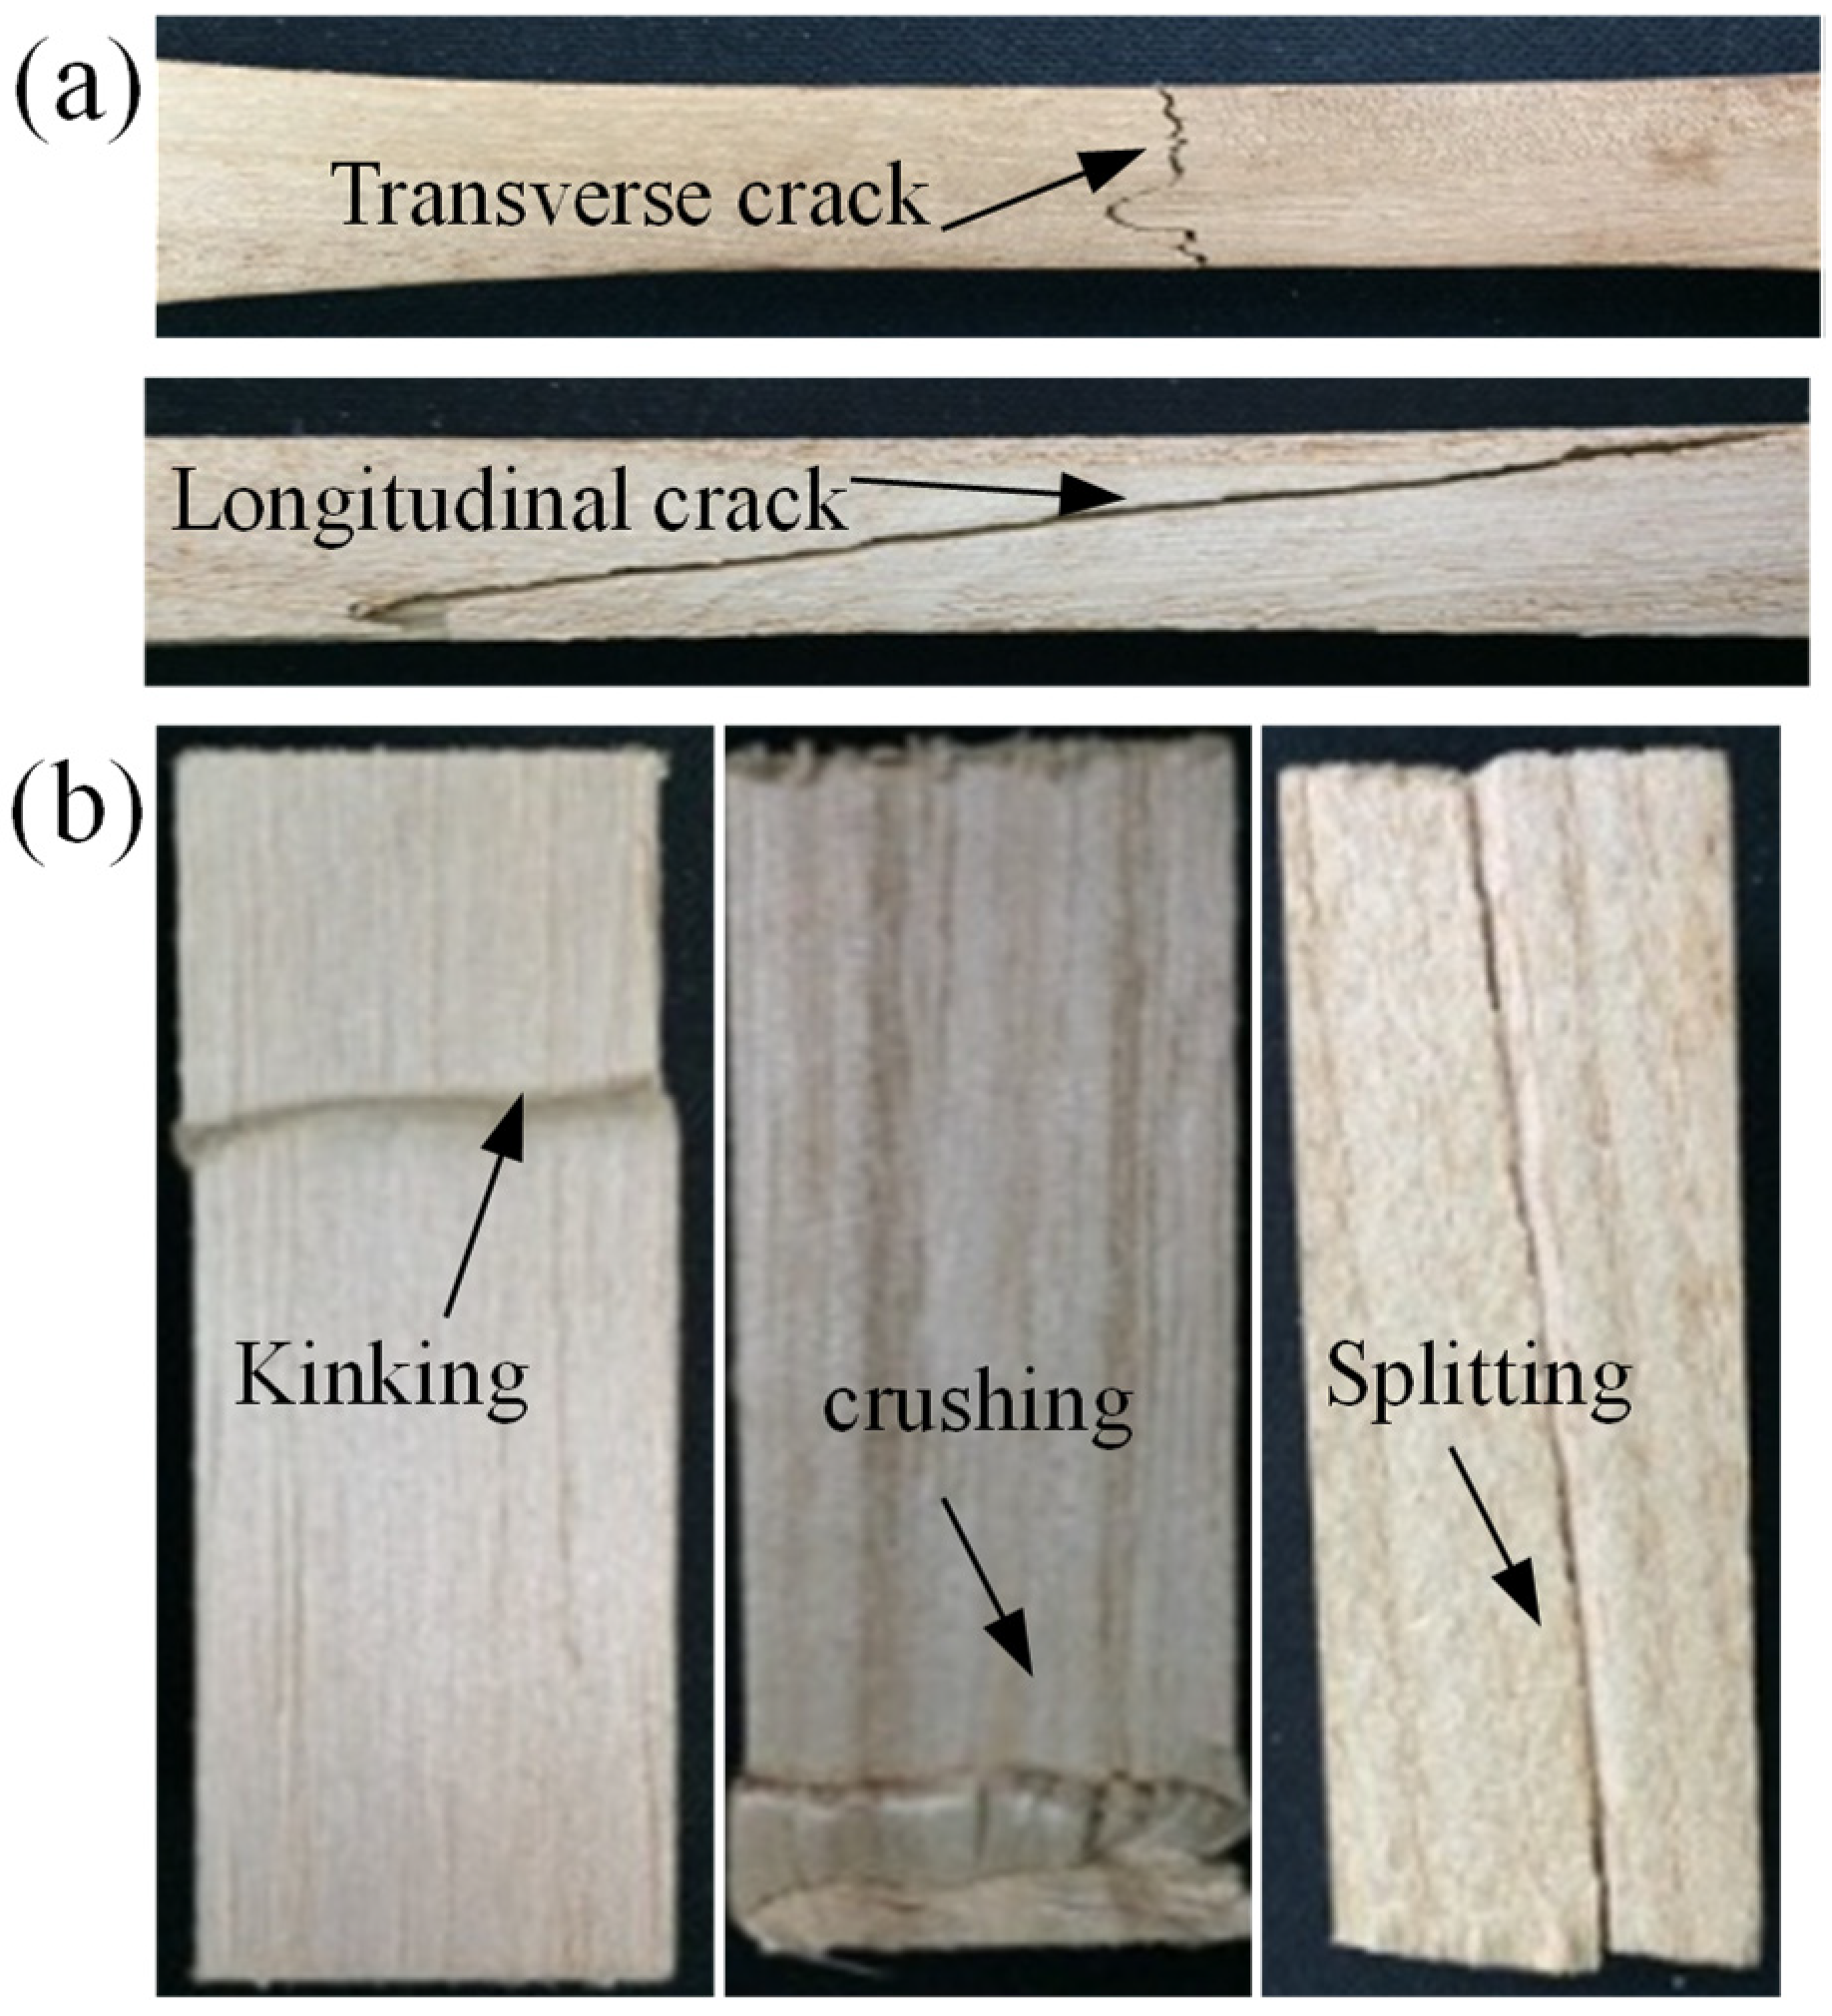
The typical failure modes of the tensile specimens are shown in
Figure 4a. Most of the specimens exhibited a transverse crack in the middle. Moreover, a longitudinal crack was also formed in a few specimens. Yue et al. [
20] found that similar transverse cracks occurred in tensile specimens made of Douglas-fir wood above 130 °C, while irregular cracks formed below 130 °C. However, the failure modes of the tensile Paulownia wood specimens were not affected by the temperature.
Figure 4b presents the typical failure modes of the compressive specimens. It can be seen that a kinking band was clearly formed on the compressive specimens. Moreover, crushing failure was found at the end of the specimen. The crushing failure of Paricá wood at elevated temperatures was also observed by Manríquez el al. [
14]. In addition, some specimens were split into two parts, as shown in
Figure 4b. The same failure modes (kinking, crushing and splitting) were observed by Yue et al. [
20] in Douglas-fir wood at elevated temperatures.
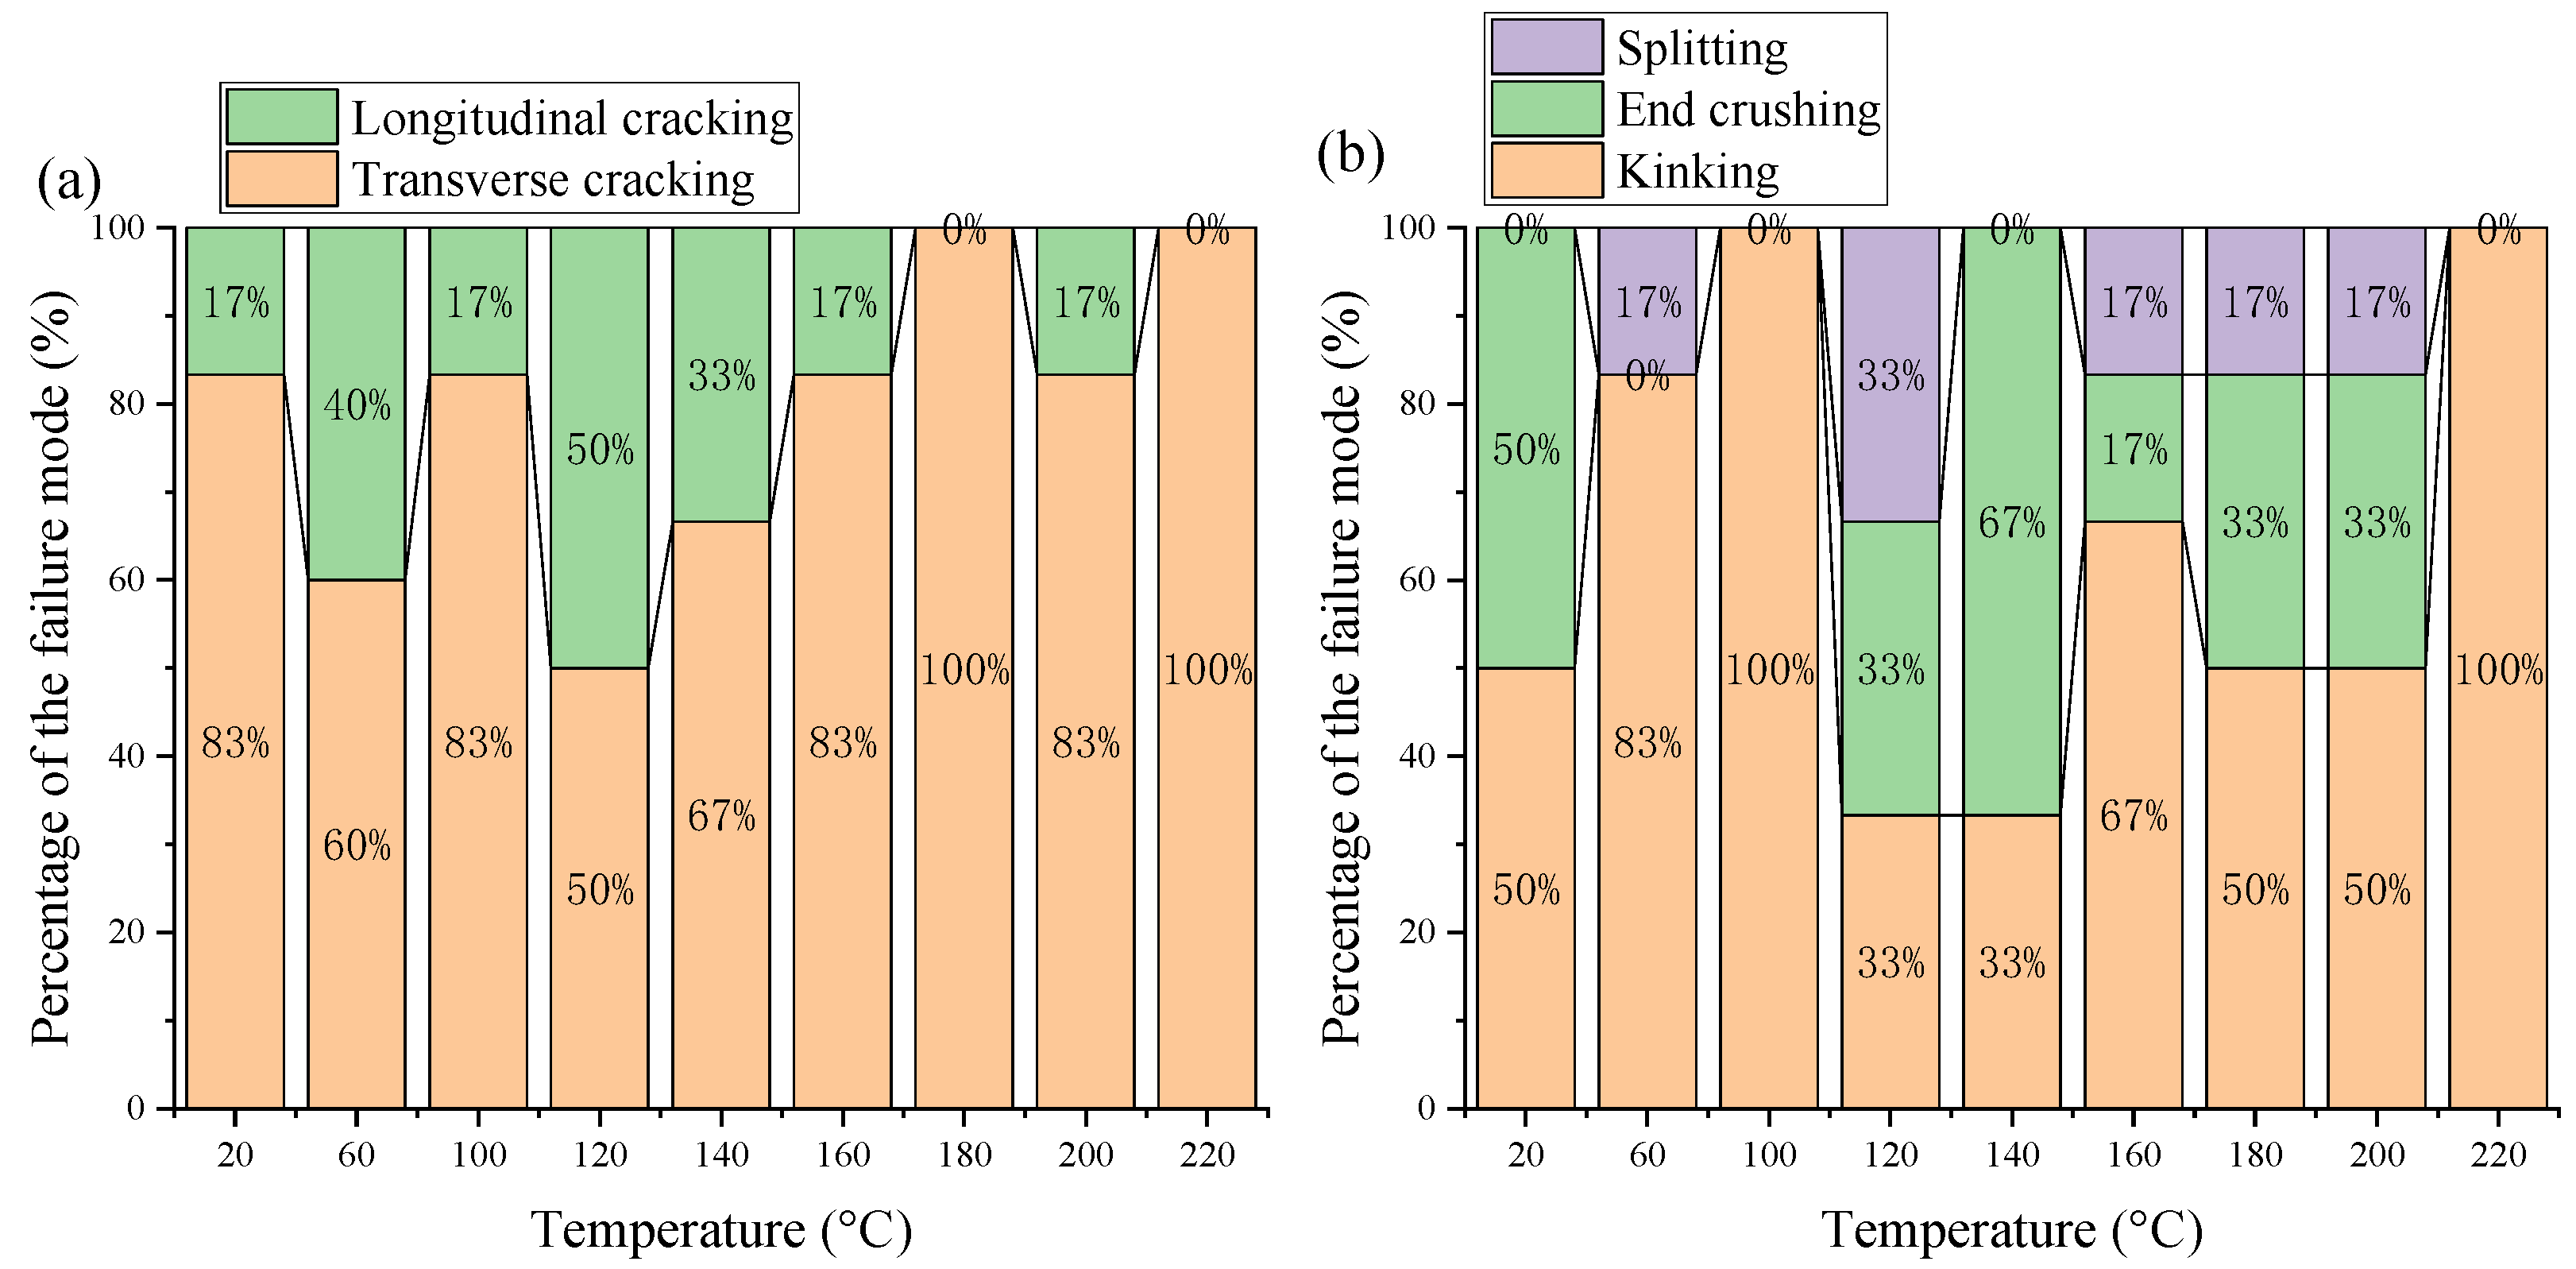
Table 2 summarizes the number of different failure modes for all the specimens at different temperatures.
Figure 5 presents the percentages of the failure modes at the target temperatures. For the tensile specimens, a transverse fracture is the dominant failure mode. For the compressive specimens, kinking is the main failure mode, while a few specimens exhibited a splitting failure. Furthermore, it seems that the elevated temperatures had limited effect on the failure mode of the compressive specimens.
3.3. Temperature-Dependent Moisture Content and Color Changes
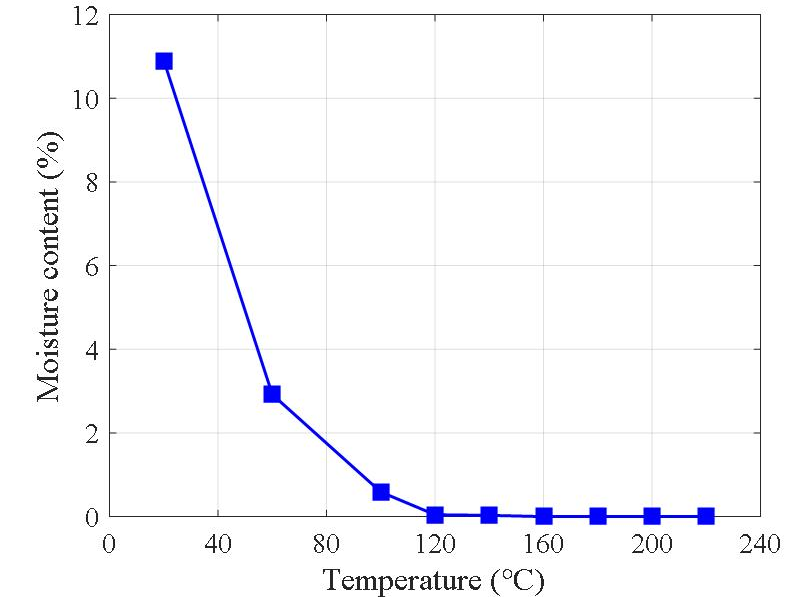
Figure 6 shows the variation of the average moisture content of the wood cube samples with the increase in temperature. The moisture content nonlinearly decreased dramatically from 20 to 120 °C due to the moisture evaporation. When the temperature increased to 120 °C, the average moisture content reduced to almost zero, indicating the specimen was totally dried. A linear reduction of the moisture content in Paricá wood from 20 °C to 150 °C was observed by Manríquez et al. [
14]. The Paricá wood was totally dried at 150 °C, which was higher than the temperature (120 °C) of the Paulownia wood. This was because the size of the Paricá wood specimen (50 mm × 50 mm × 150 mm) was larger than the Paulownia wood cube (20 mm × 20 mm × 20 mm) for the test of moisture content. As a result, the thermal lag in the larger Paricá wood specimen delayed the moisture evaporation process.
Figure 7 depicts the color changes of the typical specimens at different temperatures. It can be seen that the color of the specimens gradually changed from light to dark. At 220 °C, a large area of the tensile and compressive specimens turned black due to the significant thermal degradation of the constituents.
3.4. Load-Displacement Responses
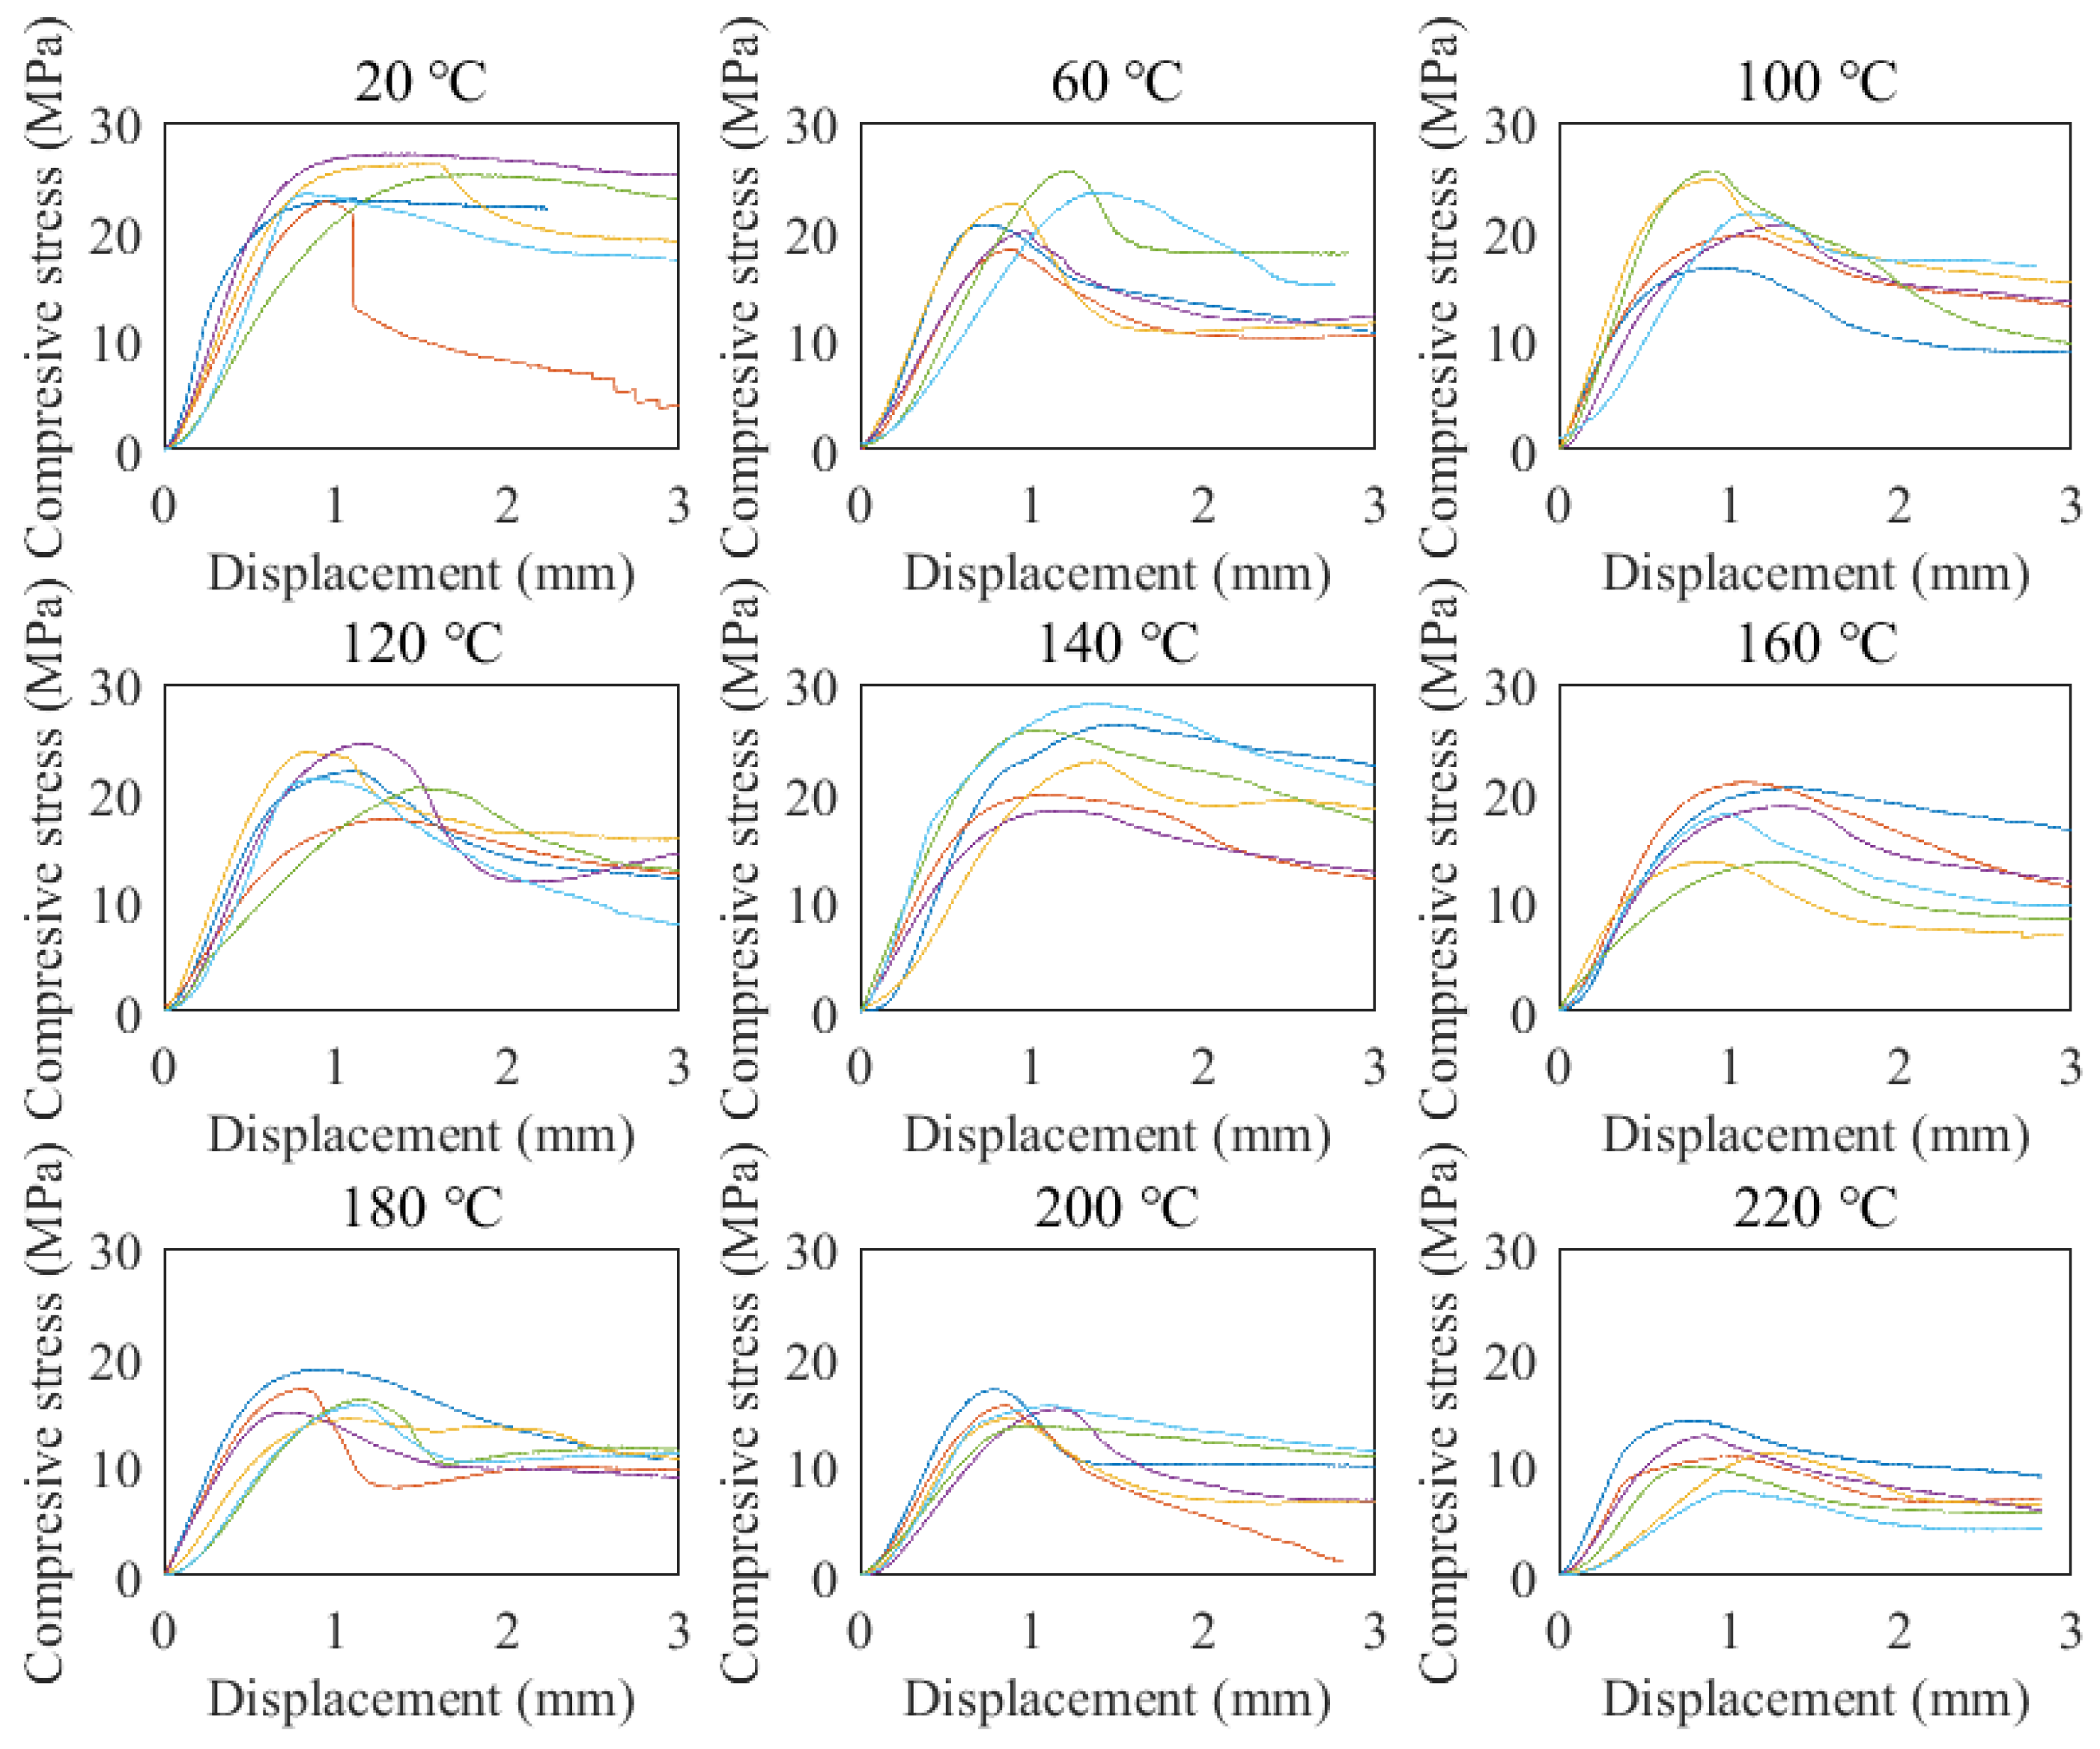
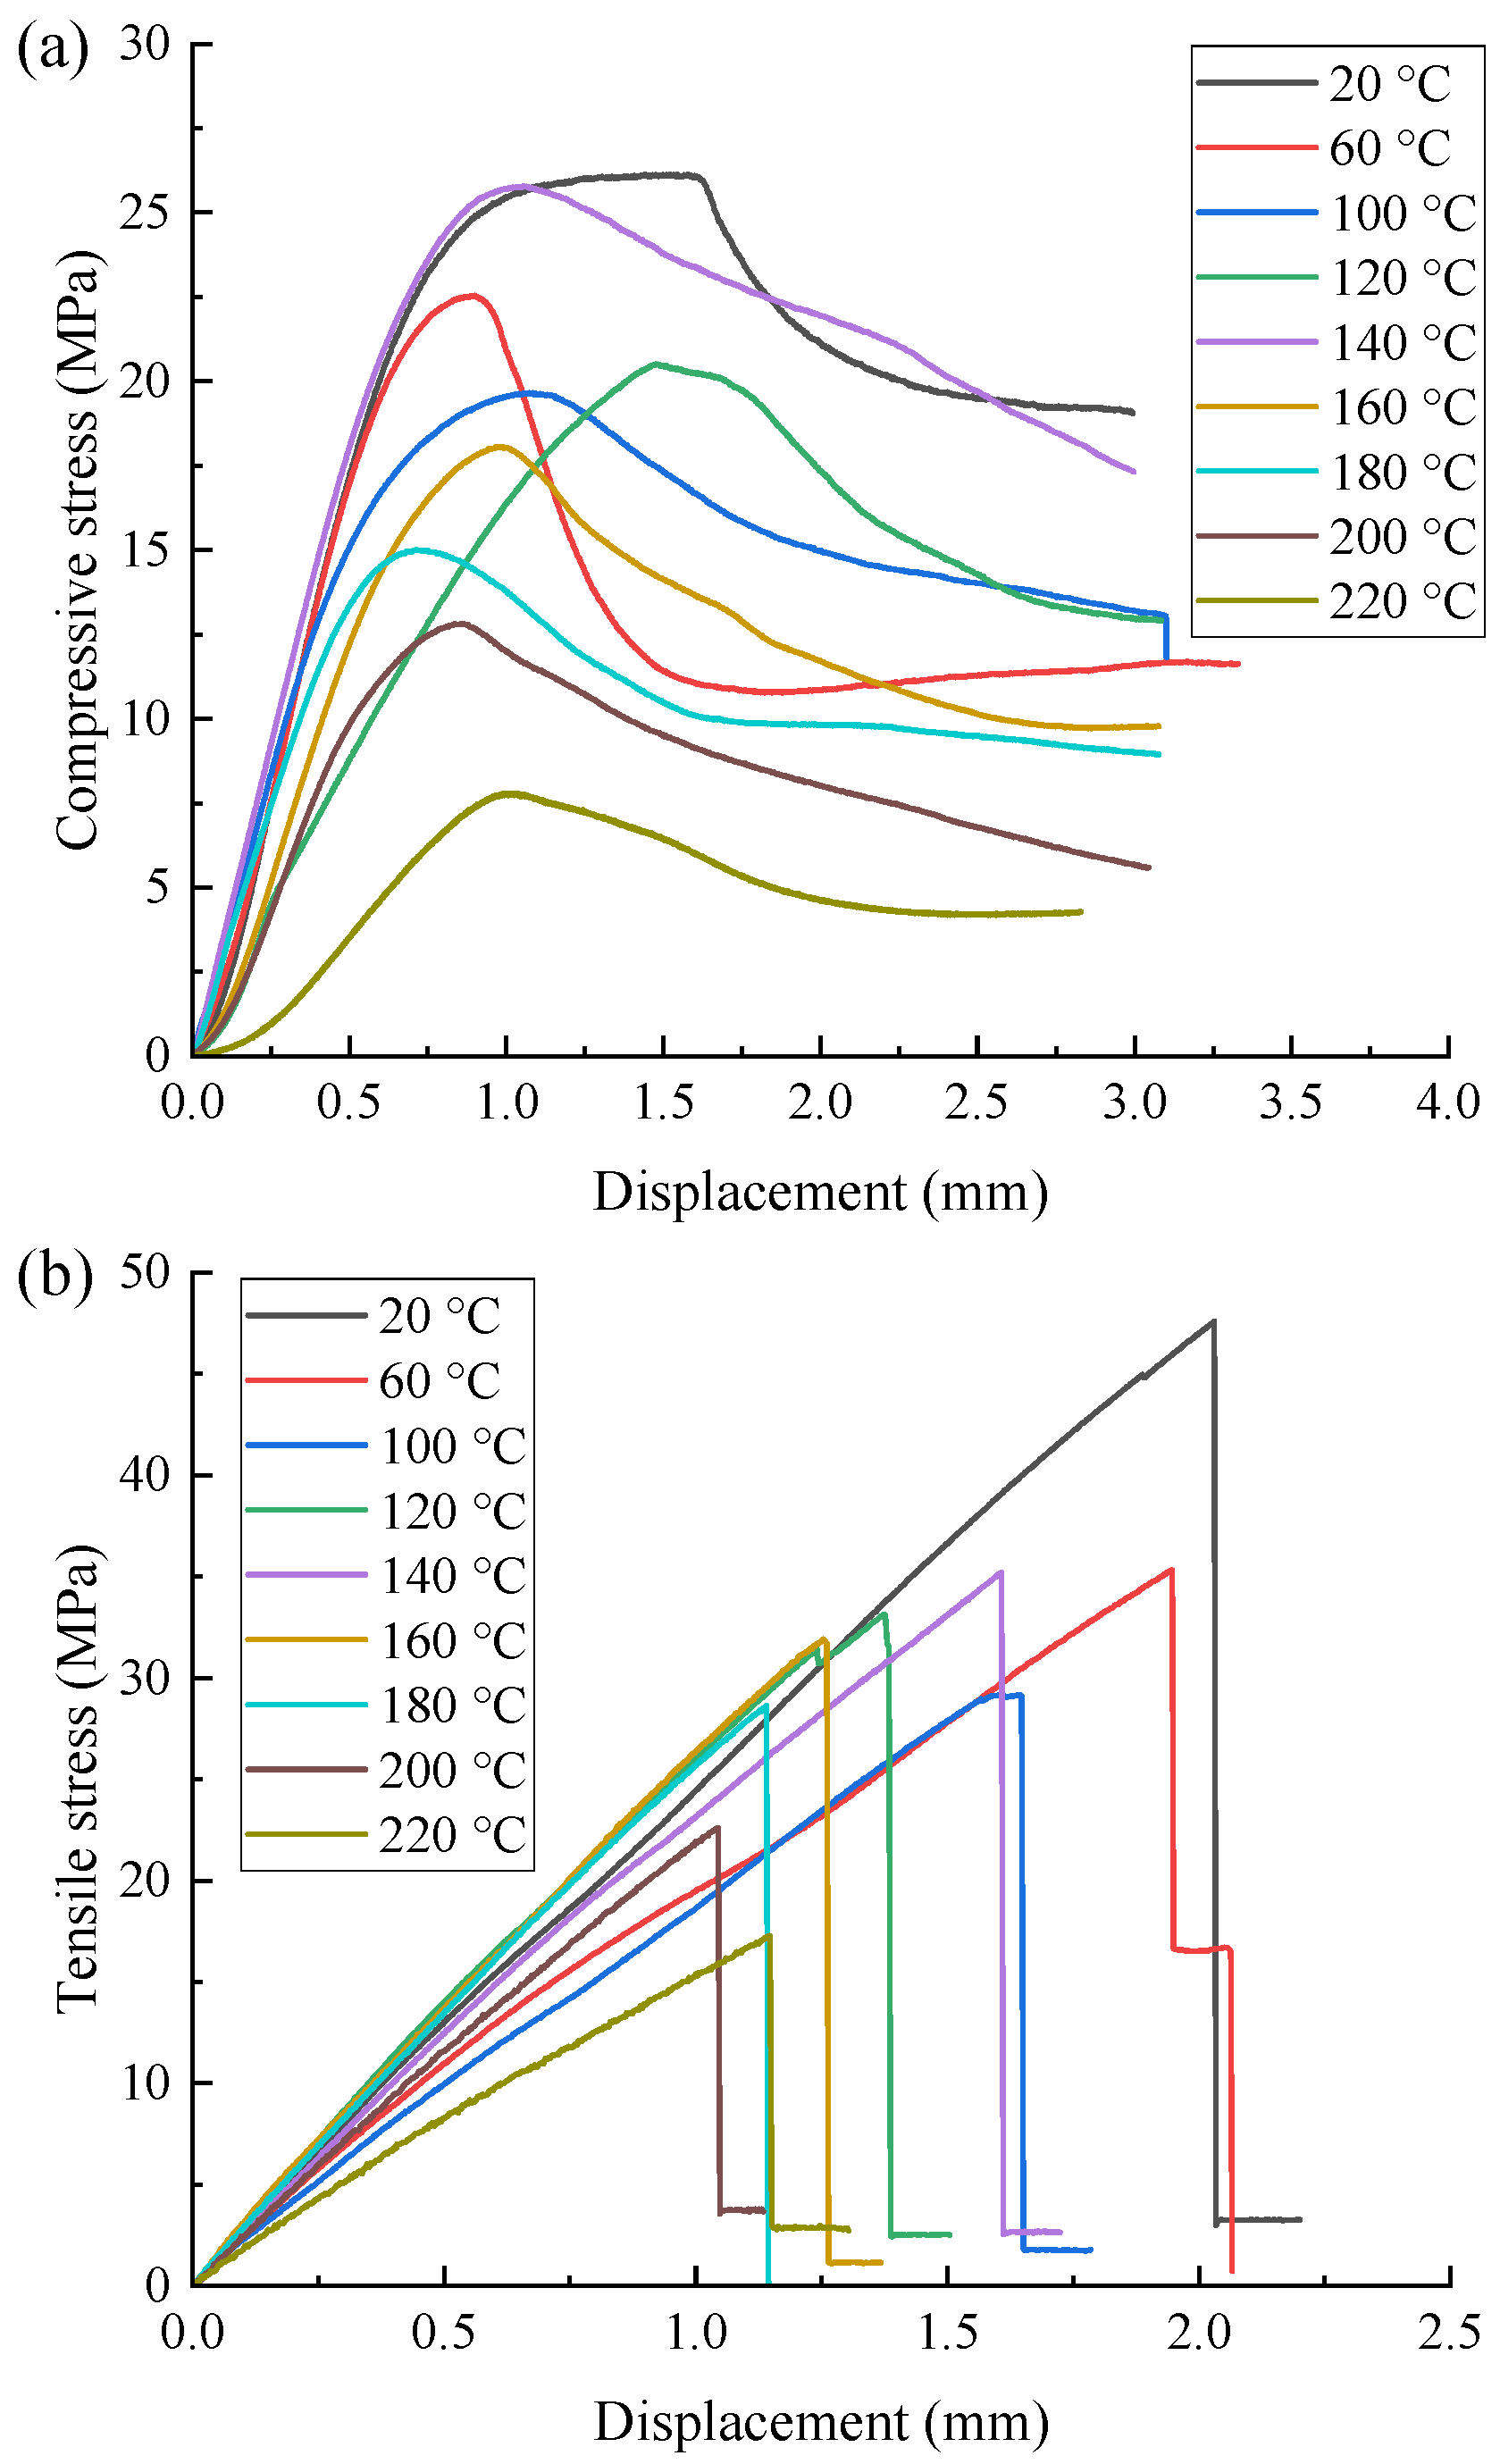
Figure 8 presents the compressive stress-displacement responses of the specimens at different temperatures. At the beginning of the test, the compressive stress linearly increased with the increase in axial displacement. Subsequently, the compressive stress increased nonlinearly up to the strength, followed by a gradual descending of the compressive stress. It should be noted that considerable dispersion was found in the curves for each target temperature. This was due to the non-uniform nature of the Paulownia wood.
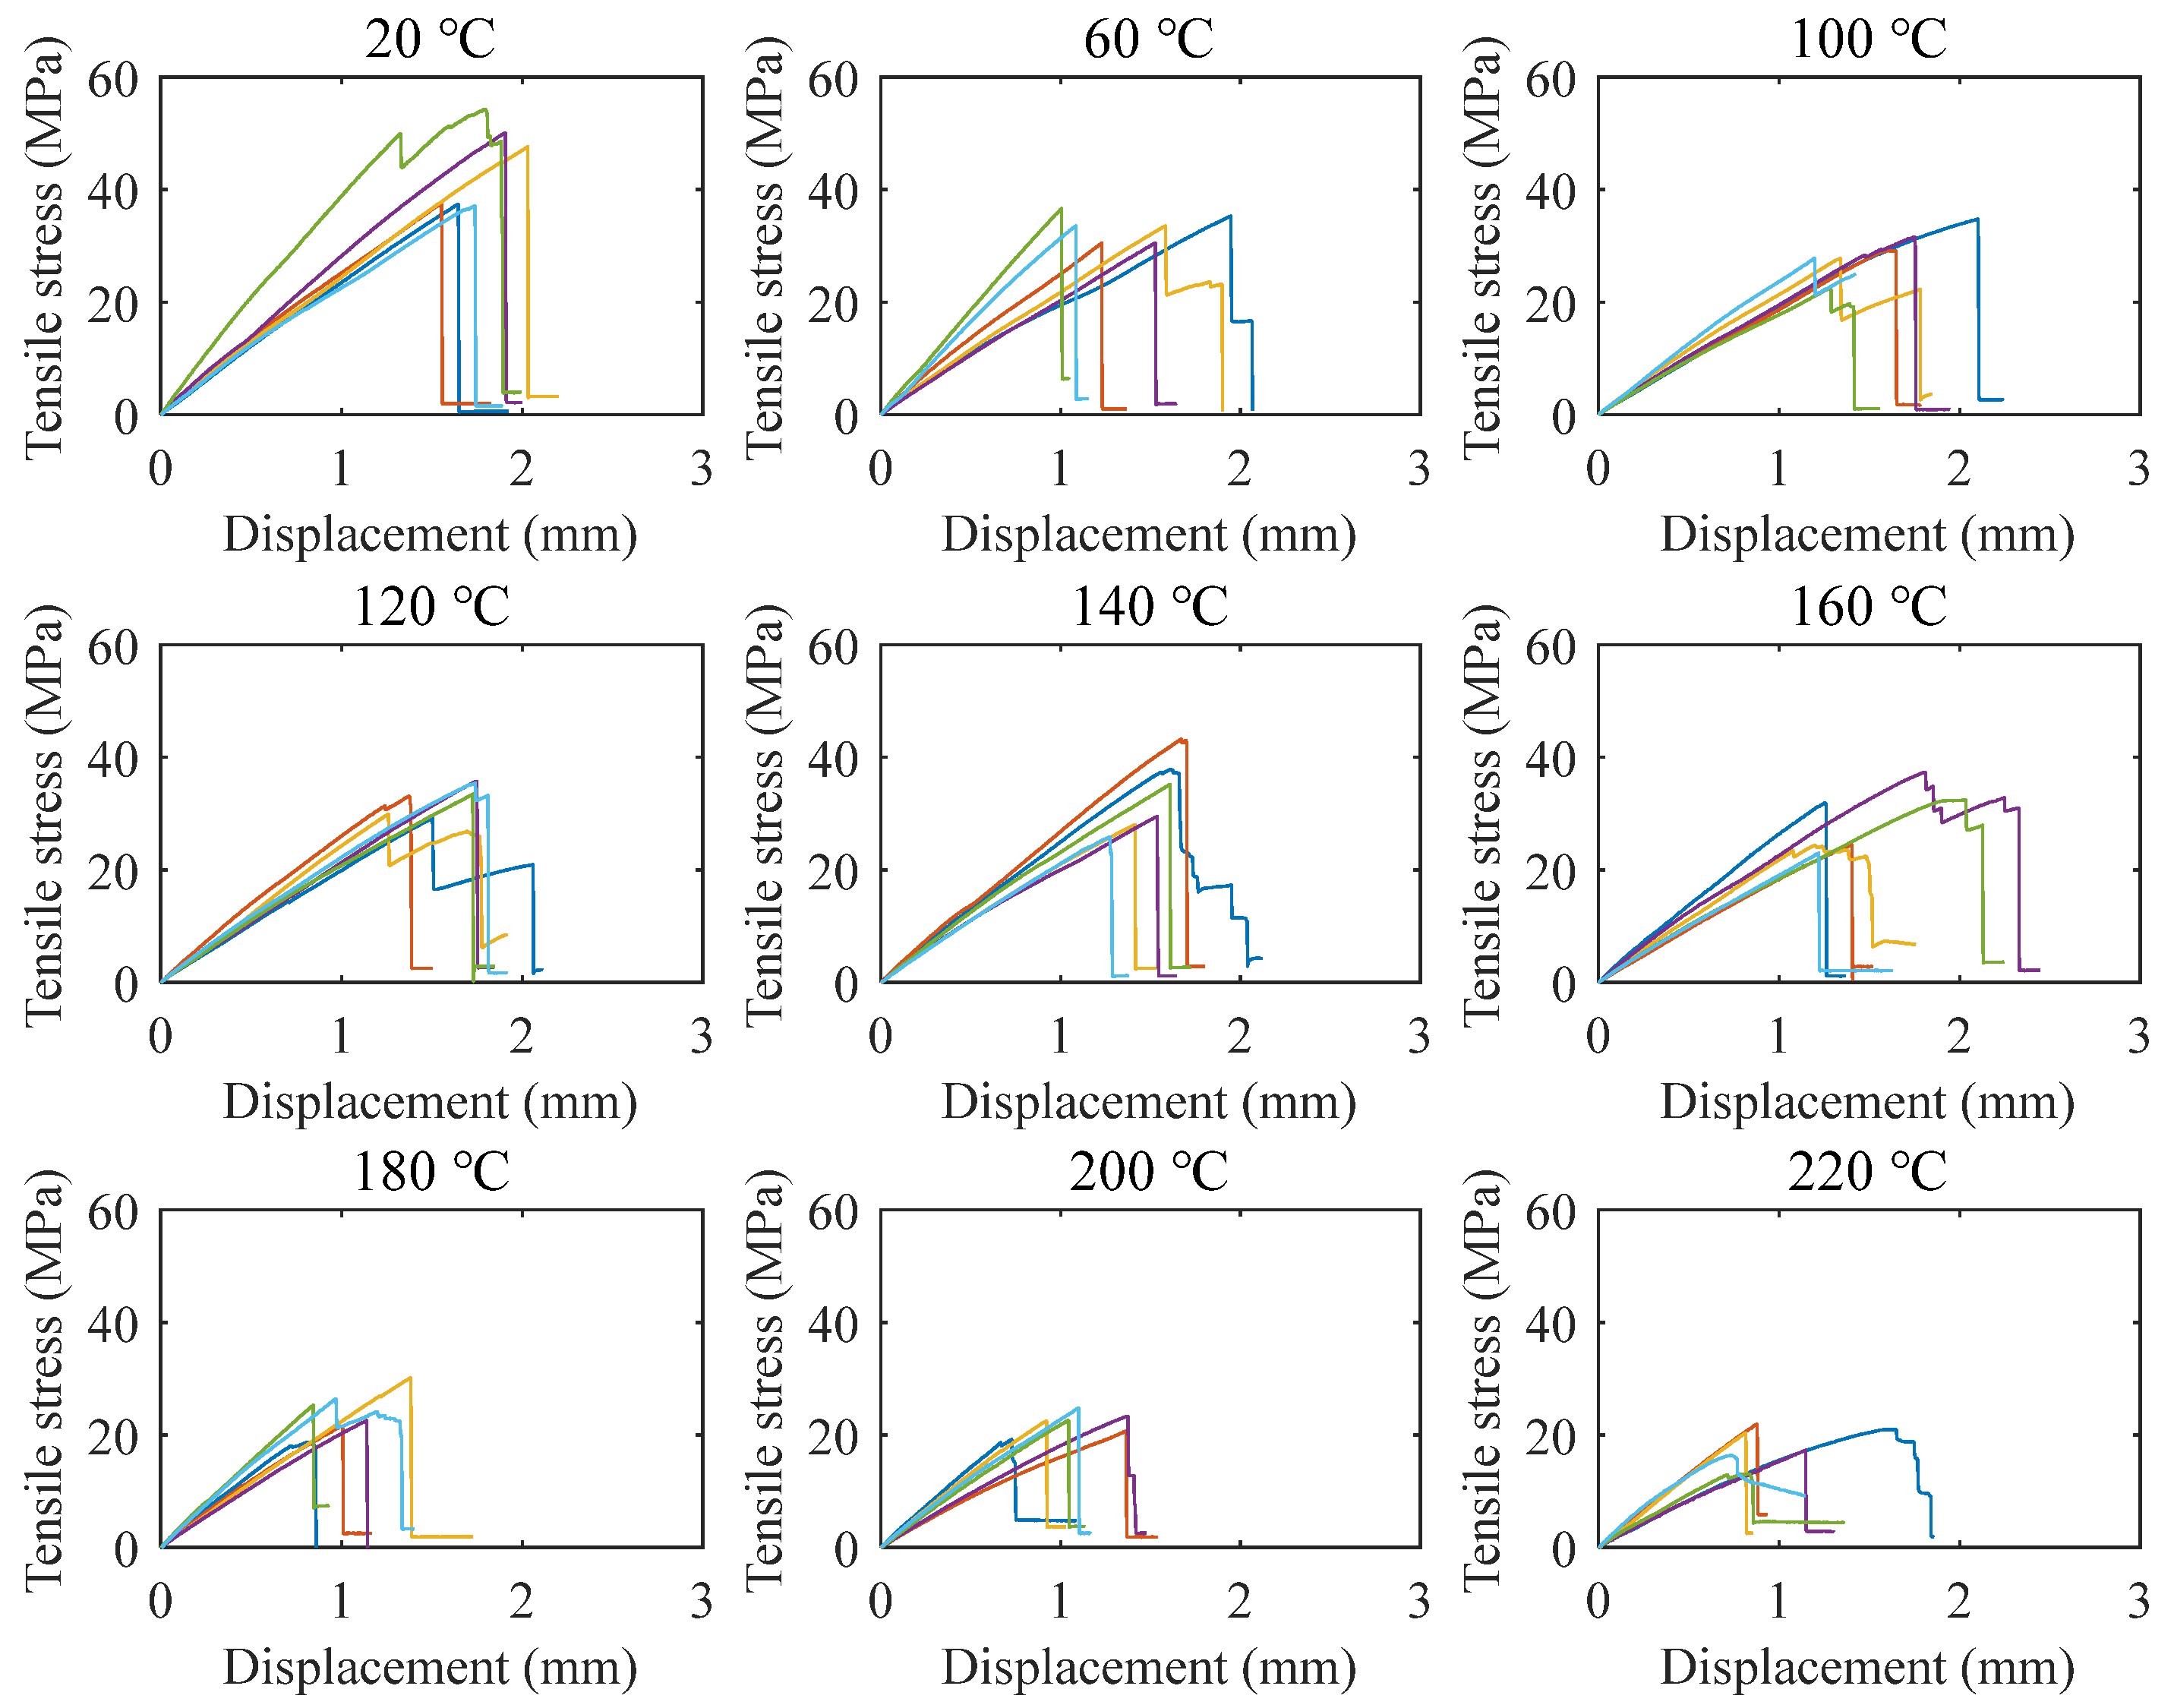
Figure 9 depicts the tensile stress-displacement responses of the specimens at ambient and elevated temperatures. The tensile stress linearly increased up to the failure of the specimen, indicating that the tensile rupture is brittle.
Figure 10a,b, respectively, show the typical compressive and tensile stress-displacement relationship of the Paulownia wood at different temperatures. The typical curve is selected based on the average strength of the specimens at each target temperature (i.e., the strength determined from the typical curve is closest to the average strength). It can be seen that the elevated temperatures had a significant effect on the stiffness (slope of the curve) of the specimens. Generally, the stiffness of the specimens decreased from 20 °C to a temperature of around 120 °C, due to the softening of the wet cellulose and lignin. However, it increased significantly from 120 °C to 140 °C. This mainly resulted from the moisture (free water) evaporation and the hardening of the dry lignin of the wood [
20]. When the temperature was higher than 140 °C, the bound water began to evaporate while the polymer components of the wood (i.e., the cellulose, hemicellulose and lignin) started to be thermally degraded. As a result, the stiffness gradually reduced as the temperature increased from 140 °C to 220 °C.
3.5. Temperature-Dependent Strengths and Deformations
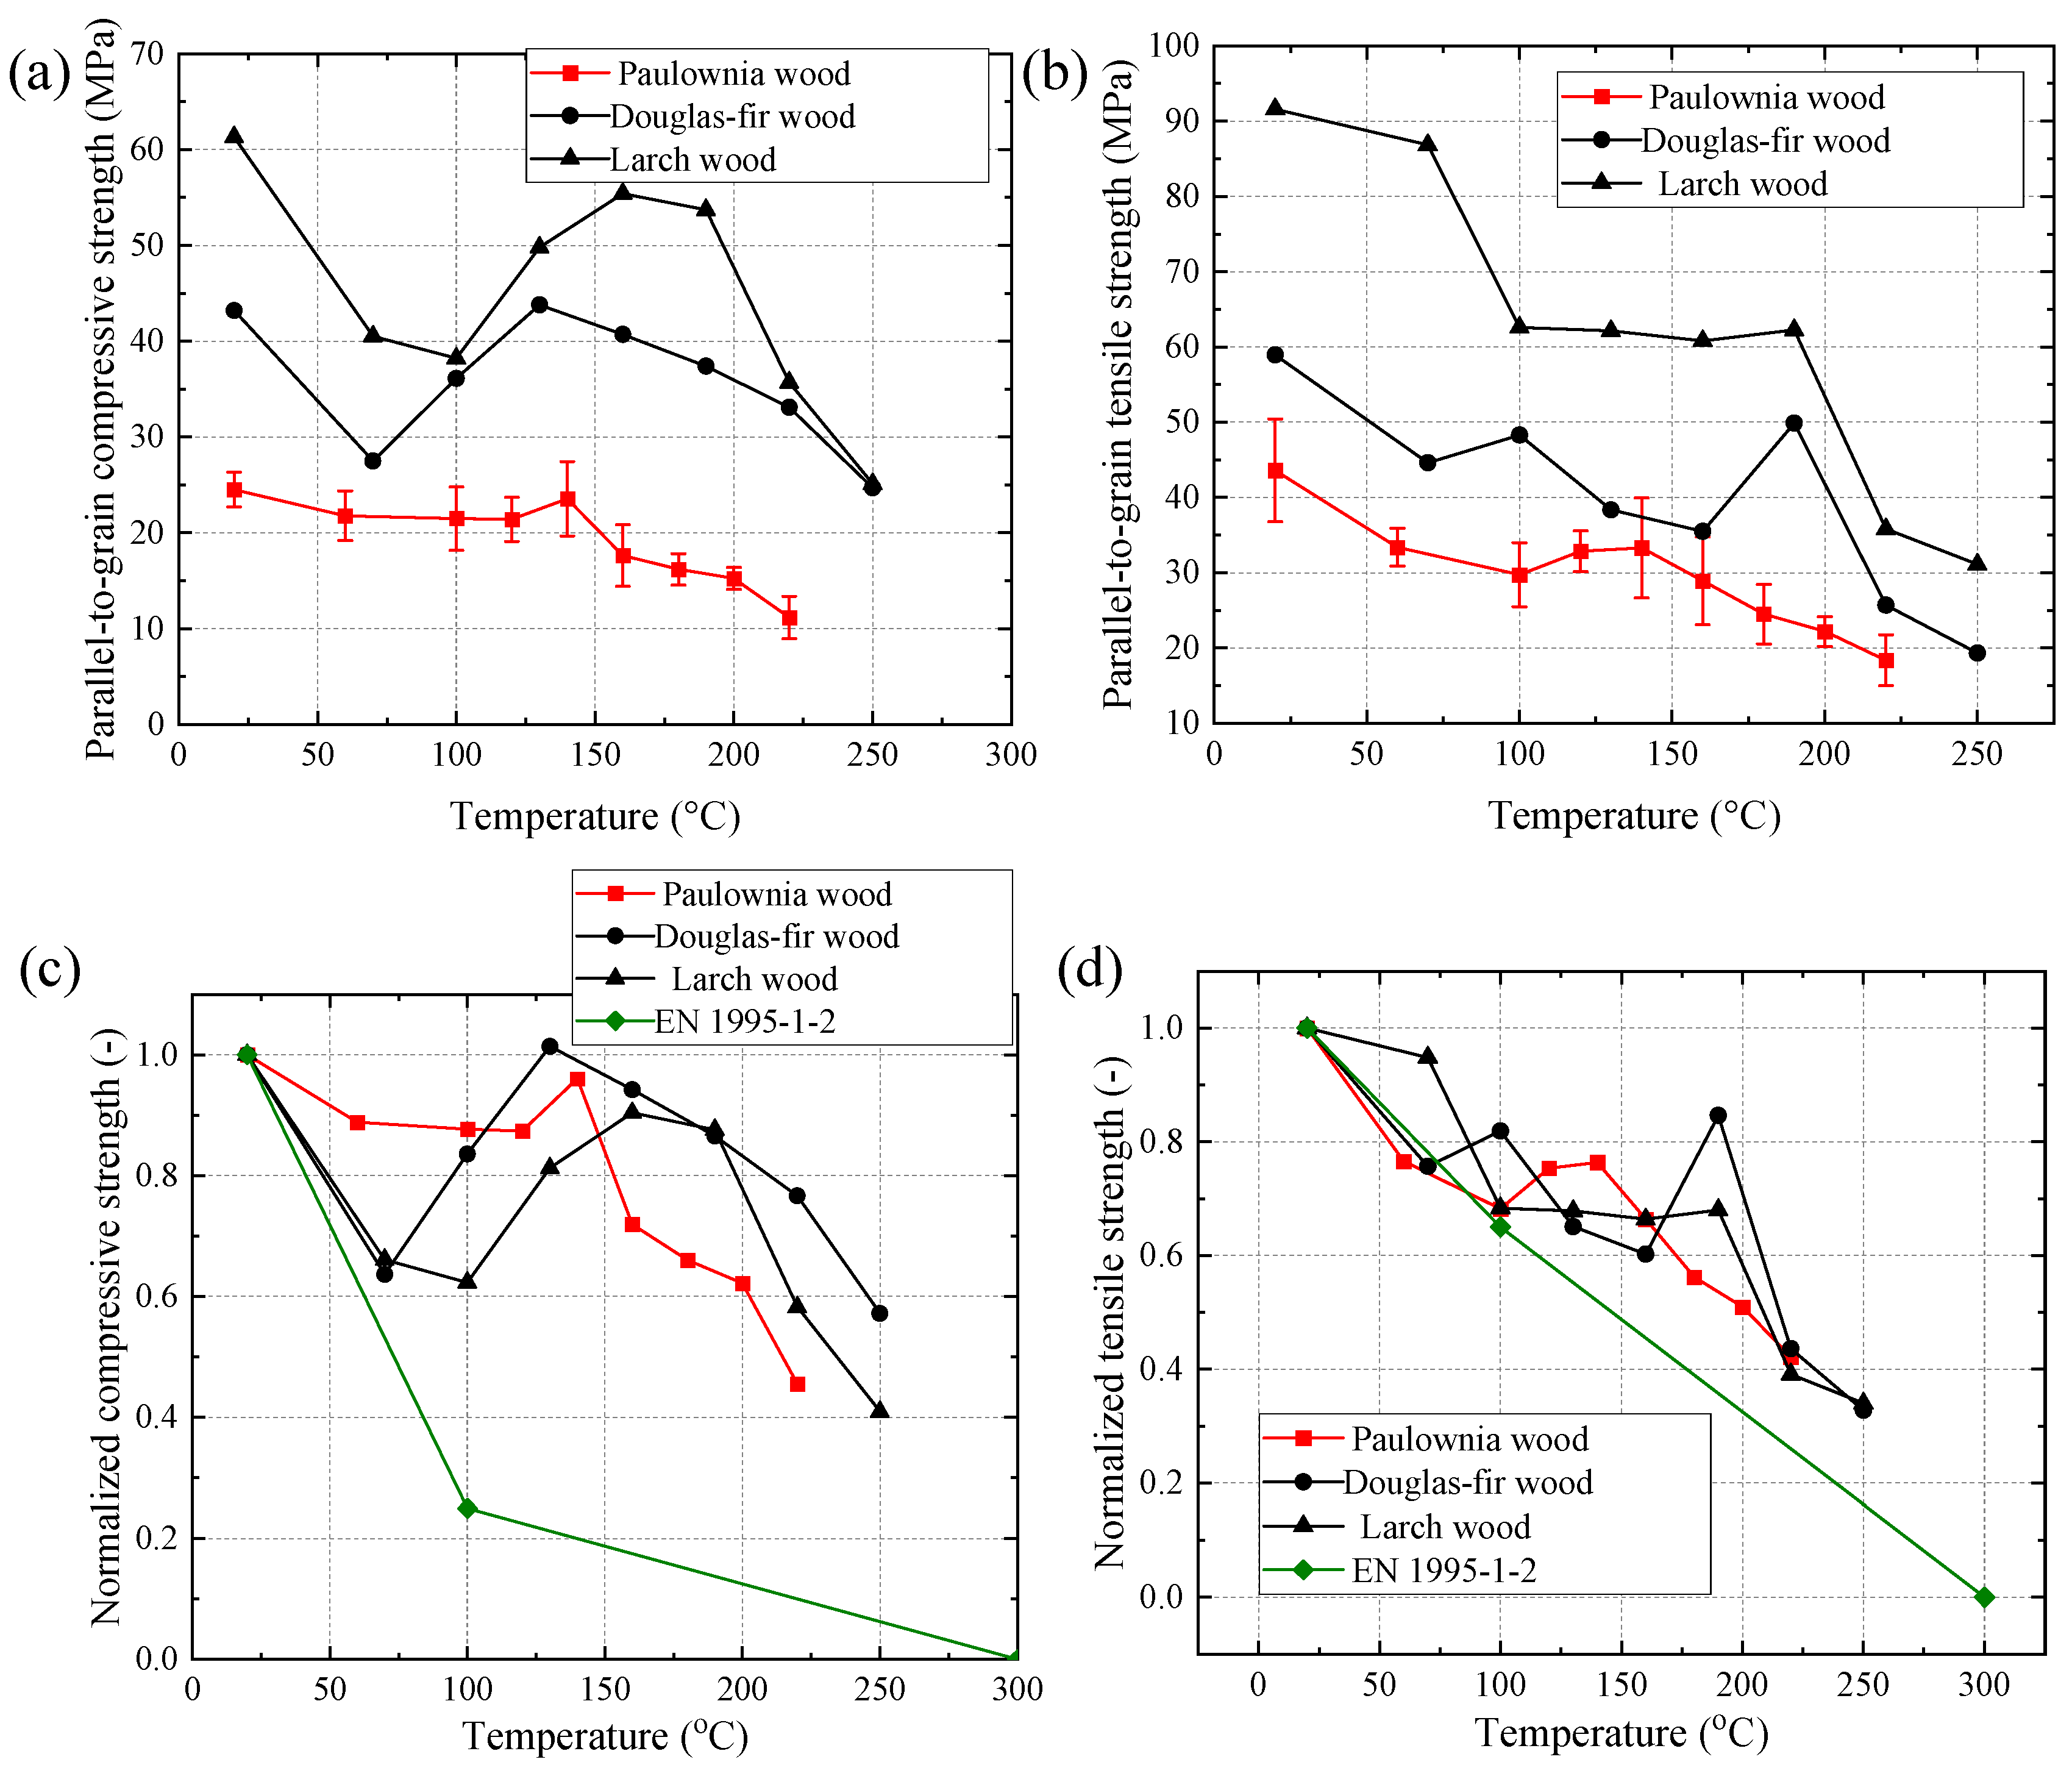
Figure 11a,b show the average parallel-to-grain compressive and tensile strengths of the Paulownia wood at different temperatures.
Figure 11c,d show the normalized compressive strength and tensile strength, respectively. As the temperature increased from 20 °C to 220 °C, the average compressive strength generally decreased. The average compressive strength of the specimens at 120 °C was 88% of that at room temperature. Moreover, the average compressive strength increased significantly from 120 °C to 140 °C. Consequently, the part of the curve at 140 °C was almost overlapped by that at 20 °C, as shown in
Figure 10a. As described before, this was mainly attributed to the hardening of the dry lignin of the wood between 120 °C and 140 °C. At 220 °C, the retention rate of the average compressive strength was only 38%. The average tensile strength decreased significantly as the temperature increased from 20 °C to 100 °C. When the temperature increased from 100 °C to 140 °C, the average tensile strength gradually increased. It is interesting to find that the tensile strength and stiffness increased at a lower temperature (100 °C) than that (120 °C) for the compressive strength and stiffness. This can be explained by the free water in the tensile specimen evaporating faster than the compressive specimen, since the tensile specimen is much thinner than the compressive specimen. Hence, the hardening degree of the dry lignin of the tensile specimen is greater than the compressive specimen. At 140 °C and above, the average tensile strength gradually decreased due to the degradation of the polymer components of the wood. The average tensile strength at 220 °C was 42% of that at room temperature.
Table 3 summarizes the average compressive strength and tensile strength, as well as the corresponding retention rate.
The average parallel-to-grain compressive and tensile strengths of the Douglas-fir wood and Larch wood at elevated temperatures from 20 °C to 250 °C are also depicted in
Figure 11a,b, respectively. At each target temperature, the average compressive (tensile) strength of the Larch wood was the highest, while that of the Paulownia wood was the lowest. This can be understood because the density of the fast-grown Paulownia wood (353 kg/m
3) is much lower than the Douglas-fir wood (486 kg/m
3) and Larch wood (596 kg/m
3). According to EN 1995-1-2, the normalized parallel-to-grain compressive strength
Pc and the tensile strength
Pt can be calculated as shown in Equations (1) and (2), respectively:
where T denotes the temperature (°C). The normalized temperature-dependent compressive strengths (retention ratios) of the Paulownia wood, Douglas-fir wood and Larch wood, as well as the design curve of the compressive strength in EN 1995-1-2 [
21] are presented in
Figure 11c. It can be found that the normalized compressive strength of the Paulownia wood decreased at a slower rate than that of the Douglas-fir wood and Larch wood when the temperature was below 140 °C. However, it reduced at a faster rate when the temperature was above 140 °C. Moreover, the design curve was much more conservative (as much as 76% for the Paulownia wood) at predicting the temperature-dependent compressive strengths of the presented woods.
Figure 11d depicts the normalized temperature-dependent tensile strengths of the woods and the design curve of the tensile strength in EN 1995-1-2. It can be found that the normalized tensile strengths reduced at a faster rate than the normalized compressive strengths. Furthermore, the design curve of the tensile strength was nonconservative for the Paulownia wood (less than 6%) and Douglas-fir wood (less than 5%) when the temperature was below 60 °C, whereas it was conservative (3–24% for the Paulownia wood) for all the woods when the temperature was above 100 °C.
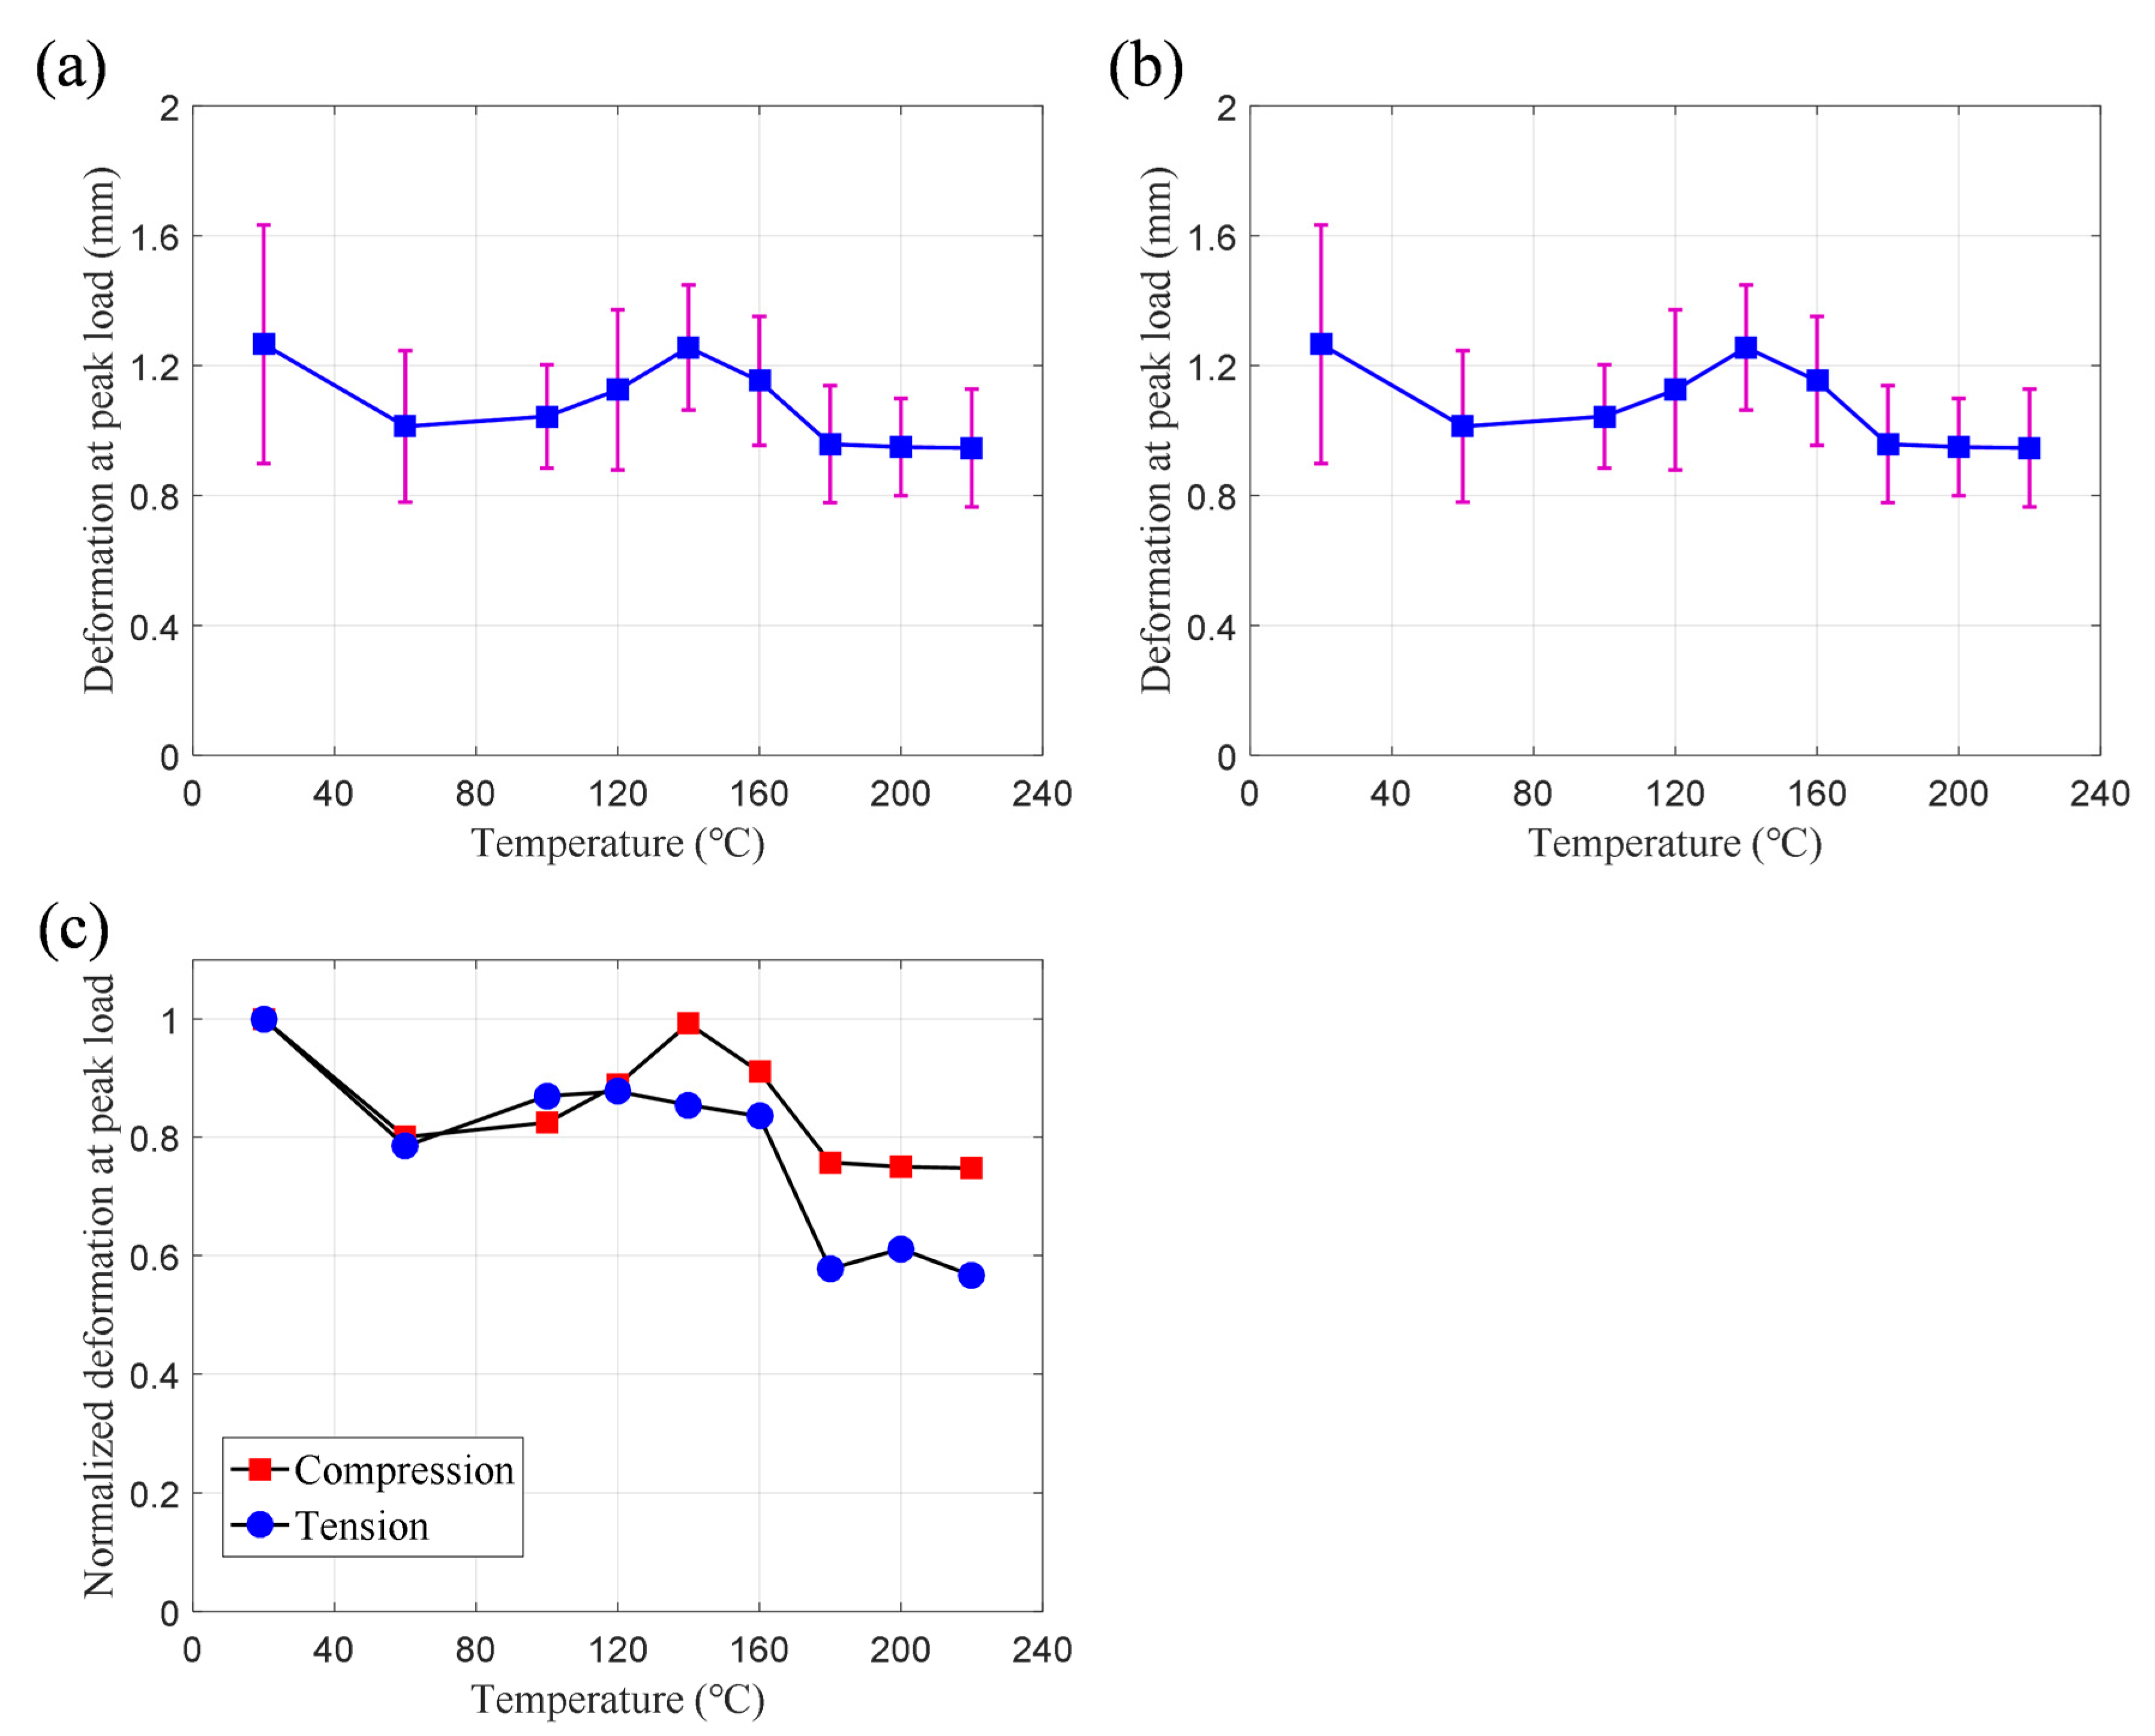
Figure 12 depicts the deformation of specimens at the peak loads (strengths) at different temperatures.
Table 3 summarizes the corresponding average values and the retention rates. The deformation of the specimens was generally related to the moisture content, physical behavior and chemical reaction of the polymer components. For the compressive specimens, the average deformation at the peak load gradually decreased as the temperature increased from 20 °C to 60 °C. This can be explained in two ways: (1) the compressive strength decreased at a faster rate than the stiffness; (2) The heat treatment of the hemicellulose component of the cell wall led to the reduction of hygroscopicity, resulting in a decrease of swell-deformation capacity [
14]. Subsequently, the average deformation increased as the temperature increased from 60 °C to 140 °C, due to the glass transition (softening) of the polymer components. It should be noted that at 140 °C the moisture was totally evaporated, indicating that the deformation capacity was mainly affected by the thermal degradation of the polymer components. As a result, the average deformation gradually decreased above 140 °C. At 180 °C, the average deformation was 76% of that at room temperature. After 180 °C, the average deformation was basically stable. As shown in
Figure 12b, the deformation variation of the tensile specimens was similar to the compressive specimens. As the temperature increased from 20 °C to 60 °C, the deformation significantly reduced. Then, the deformation gradually increased as the temperature increased to 120 °C, at which point the deformation is about 85% of that at room temperature. Subsequently, the deformation retention rate gradually decreased to 58% at 180 °C. No significant change in deformation was found between 180 °C and 220 °C. Hence, the deformation capacity (ductility) of the specimens significantly decreased when the temperature was higher than 180 °C. Moreover, as shown in
Figure 12c, the deformation retention rate of the compressive specimens was significantly higher than the tensile specimens at temperatures higher than 120 °C. This was because the compressive force can lead to the buckling and kinking of the wood fibers, resulting in a larger deformation than the tensile specimens.
4. Conclusions
In this paper, a total of 108 clear Paulownia wood specimens were tested to investigate the parallel-to-grain compressive and tensile properties at elevated temperatures from 20 °C to 220 °C. Based on the experimental results, the following conclusions can be drawn:
(1) The compressive Paulownia wood exhibited ductile failure modes. Kinking, end crushing and splitting failure modes were observed in the compressive specimens, while kinking was the main failure mode. The tensile Paulownia wood mainly exhibited a brittle failure. Transverse cracks were formed in the middle of the specimens, while a few specimens exhibited longitudinal cracks. The failure modes were generally not affected by elevated temperatures.
(2) For the Paulownia wood in compression, the parallel-to-grain compressive stress increased linearly at the initial stage. Subsequently, the parallel-to-grain compressive stress increased nonlinearly, and then decreased slowly up to the end of the test. For the specimens in tension, the parallel-to-grain tensile stress increased linearly up to the tensile failure. Moreover, the elevated temperatures had limited effect on the nonlinear- (linear-) loading behavior of the compressive (tensile) stress-displacement curve of the Paulownia wood.
(3) The parallel-to-grain tensile and compressive strengths of the Paulownia wood depended highly on the moisture content and the behavior of polymer components (i.e., cellulose, hemicellulose and lignin) at elevated temperatures from 20 °C to 220 °C. Generally, the parallel-to-grain tensile and compressive strengths decreased with the increase in temperature. At 220 °C, the retention rates of the average parallel-to-grain compressive and tensile strengths were 38% and 42%, respectively. However, due to the moisture evaporation and the hardening of the dry lignin, the average parallel-to-grain strengths significantly increased as the temperature increased from 100 °C to 140 °C.
(4) The design curve suggested by EN 1995-1-2 was very conservative (as much as 76%) at predicting the temperature-dependent compressive strengths of the Paulownia wood. However, the design curve was nonconservative (less than 6%) at estimating the tensile strengths of the Paulownia wood when the temperature was below 60 °C, whereas it was conservative (3–24%) when the temperature was above 100 °C.
(5) The maximum deformation (at the peak load) of the Paulownia wood decreased from room temperature to 60 °C. Subsequently, the maximum deformation increased as the temperature increased from 60 °C to a temperature of around 120 °C. The lowest value of the deformation was found within the temperature range of between 180 °C and 220 °C. Hence, the deformation capacity of the specimens significantly decreased when the temperature was higher than 180 °C.
Author Contributions
Conceptualization, L.Z.; methodology, Y.L.; software, B.X.; formal analysis, L.Z., K.C. and B.X.; investigation, L.Z.; data curation, K.C. and B.X.; writing—original draft, L.Z. and K.C.; writing—review and editing, L.Z., Y.L. and K.G.; funding acquisition, L.Z. All authors have read and agreed to the published version of the manuscript.
Funding
This research was funded by the National Natural Science Foundation of China, grant number 52108253.
Data Availability Statement
The data that support the findings of this study are available from the corresponding author upon reasonable request.
Conflicts of Interest
The authors declare no conflict of interest.
References
- Belgacem, N.; Pizzi, A. (Eds.) Lignocellulosic Fibers and Wood Handbook; Wiley: Hoboken, NJ, USA, 2016. [Google Scholar]
- Müller, A.; Kolb, H.-P.; Brunner, M. Modern timber houses. In Lignocellulosic Fibers and Wood Handbook; Belgacem, N., Pizzi A, Eds.; Wiley: Hoboken, NJ, USA, 2016; pp. 595–610. [Google Scholar]
- König, J. Structural fire design according to Eurocode 5—Design rules and their background. Fire Mater. 2004, 29, 147–163. [Google Scholar] [CrossRef]
- Janssens, M.L. Modeling of the thermal degradation of structural wood members exposed to fire. Fire Mater. 2004, 28, 199–207. [Google Scholar] [CrossRef]
- Anjang, A.; Chevali, V.; Kandare, E.; Mouritz, A.; Feih, S. Tension modelling and testing of sandwich composites in fire. Compos. Struct. 2014, 113, 437–445. [Google Scholar] [CrossRef]
- Feih, S.; Mathys, Z.; Gibson, A.; Mouritz, A. Modeling compressive skin failure of sandwich composites in fire. J. Sandw. Struct. Mater. 2008, 10, 217–245. [Google Scholar] [CrossRef]
- Schmid, J.; Klippel, M.; Just, A.; Frangi, A. Review and analysis of fire resistance tests of timber members in bending, tension and compression with respect to the reduced cross-section method. Fire Saf. J. 2014, 68, 81–99. [Google Scholar] [CrossRef]
- Schaffer, E. Effect of pyrolytic temperatures on the longitudinal strength of dry Douglas-fir. J. Test. Eval. 1973, 1, 319–329. [Google Scholar] [CrossRef]
- Östman, B.A.-L. Wood tensile strength at temperatures and moisture contents simulating fire conditions. Wood Sci. Technol. 1985, 19, 103–116. [Google Scholar] [CrossRef]
- Yang, C. Study on the Changes of Physical and Mechanical Properties of Wood Used for Glulam at Different Temperature. Master’s Thesis, Nanjing Tech University, Nanjing, China, 2016. [Google Scholar]
- Pearson, H.; Gabbitas, B.; Ormarsson, S. Tensile behaviour of radiata pine with different moisture contents at elevated temperatures. Holzforschung 2012, 66, 659–665. [Google Scholar] [CrossRef]
- Bednarek, Z.; Griškevičius, M.; Šaučiuvėnas, G. Tensile, compressive and flexural strength reduction of timber in fire. Eng. Struct. Technol. 2009, 1, 148–156. [Google Scholar] [CrossRef]
- Figueroa, M.J.M.; De Moraes, P.D.; Maestri, F.A. Temperature and moisture content effects on compressive strength parallel to the grain of paricá. Ambiente Construído 2015, 15, 17–27. [Google Scholar] [CrossRef]
- Manríquez, M.; Moraes, P. Influence of the temperature on the compression strength parallel to grain of paricá. Constr. Build. Mater. 2010, 24, 99–104. [Google Scholar] [CrossRef]
- GB/T 1931-2009; Method for Determination of Moisture Content of Wood. China Standard Press: Beijing, China, 2009.
- GB/T 1938-2009; Method of Testing in Tensile Strength Paralle to Grain of Wood. China Standard Press: Beijing, China, 2009.
- GB/T 1935-2009; Method of Testing in Compressive Strength Paralle to Grain of Wood. China Standard Press: Beijing, China, 2009.
- GB/T 1937-2009; Method of Testing in Shearing Strength Paralle to Grain of Wood. China Standard Press: Beijing, China, 2009.
- GB/T 15777-1995; Method for Determination of the Modulus of Elasticity Incompressive Parallel to Grain of Wood. China Standard Press: Beijing, China, 1995.
- Yue, K.; Wu, J.; Wang, F.; Chen, Z.; Lu, W. Mechanical properties of Douglas fir wood at elevated temperatures under nitrogen conditions. J. Mater. Civ. Eng. 2022, 34, 04021434. [Google Scholar] [CrossRef]
- EN 1995-1-2:2004; Eurocode 5: Design of Timber Structures—Part 1–2: General-Structural Fire Design. CEN, European Committee for Standardization: Brussels, Belgium, 2004.
| Publisher’s Note: MDPI stays neutral with regard to jurisdictional claims in published maps and institutional affiliations. |
© 2022 by the authors. Licensee MDPI, Basel, Switzerland. This article is an open access article distributed under the terms and conditions of the Creative Commons Attribution (CC BY) license (https://creativecommons.org/licenses/by/4.0/).

