1. Introduction
Motivation
The European Green Deal is a new growth strategy with the aim to transform the European Union into a fair and prosperous society with a modern, resource-efficient economy in which, by 2050, there will be no greenhouse gas emissions, and economic growth will be decoupled from resource use. Energy production and use account for more than 75% of the European Union’s (EU) greenhouse gas emissions in all sectors of the economy [
1]. The electricity sector must therefore be developed and modernized through the introduction of clean technologies based on renewable energy sources, thus gradually reducing carbon and gas emissions. With each passing year, an increasing number of power sources are being connected to an electricity grid using power electronics [
2,
3]. This electricity grid transformation poses new challenges for power system engineers, as new power-sharing solutions must be found [
4], and reliable and stable voltage and frequency management [
5] and grid stability must be ensured—from innovative controllers integrated with wind farms [
6,
7] to virtual synchronous generator inertia simulation with drops in power frequency [
8].
Synchronous generators (traditional generators), whose rotating mass forms the conventional system inertia (CSI) of the electrical power system, are reduced by the power sources connected to the electrical power system via power electronics converters. The increased use of power electronics to connect loads to the electrical power system also contributes to reduce CSI. Such a reduction in CSIs and increase in frequency volatility could pose a major problem in terms of frequency stability in the electrical power system, especially in the absence of countermeasures [
9]. The same problems have been identified in the analyses in [
10,
11,
12,
13], i.e., it has been pointed out that ever-increasing problems regarding the dynamic stability (voltage, frequency, and angle) of the electrical power system are related to the decreasing CSI.
This paper presents the methodology used to obtain an efficient SI algorithm, which is based on the output-error (OE) parametric identification method using simulated traditional generator active power output and electric power system frequency change during a large disturbance in the electric power system. The proposed SI algorithm allows for the simulation of the CSI response of a traditional generator to the electrical power system. To prove the efficiency of the presented SI algorithm, detailed dynamic calculations were carried out with the PSS/E modeling package using a large, real electrical power system mathematical model to determine the generator power, angle, voltage, and system frequency change and its angle variation in the presence of a power deficit in the electrical power system. The calculated data were used to compare the generated response of the SI algorithm with the frequency change in the electrical power system and the traditional generators.
2. Overview of Available Countermeasures to Support Low Conventional System Inertia
With each passing year, an increasing number of high-voltage direct current (HVDC) systems are being installed in the electrical power system. The increasing integration of HVDC systems into the electrical power transmission system is reducing CSIs, but efficient SI recovery technologies are not currently available in practice. Research has been ongoing for several years in an attempt to find a simple and effective solution. The articles describe many different methodologies used for the development of SI algorithms that are well established but difficult to apply in practice.
Some offshore wind farms are connected to the electrical power system via HVDC systems; therefore, one of the solutions described in the literature uses the SI algorithm and exploits the capabilities of HVDC, which allows the required amount of power to be supplied to the electricity grid at the initial time, coordinating the HVDC system and offshore wind farms [
14,
15,
16,
17]. In [
15], the authors proposed a method based on a VSC (voltage source converter)–HVDC transmission link to replicate the primary frequency response behavior of a traditional synchronous generator connected to a common coupling point (PCC). In [
17], the author presents a solution in which the kinetic energy (KE) stored in wind power plants connected via HVDC is used to maintain the frequency and simulate inertia. The algorithm adjusts the power of the HVDC system based on the grid frequency derivative feedback.
Another SI method discussed in [
18] is based on a frequency input signal. First, the HVDC system regulates the direct current (DC) voltage to control the power supply from the direct current capacitor, accounting for the frequency drop of the alternating current electrical power system. The instantaneous SI response is from the HVDC system, and after some time, the active power is supplied by the offshore wind farm. In [
19], the authors suggested the use of a DC-link capacitor to obtain SI output from renewable energy sources. This method provides SI control logic, in which the power source does not provide continuously active power, but it contributes frequency control by injecting active power proportional to the dω/dt.
In the event of a failure in the electrical power system and a change in frequency, the operation of these methods, in which SI is derived from HVDC at the initial time, may affect the rotor speed and generation efficiency of the wind farm, and it is difficult to quickly restore the nominal rotor speed.
To develop SI compilation methods, many models have been adapted to the SI control loop. The principles of fixed PID (proportional/integral/derived) application models are applied in SI control loops [
20,
21]. The KE of wind turbines is used to adjust the electrical power set point of the converter [
22]. This method allows for the frequency nadir and the rate of change of frequency (RoCoF) to be reduced [
23].
In [
24], SI is defined as the process that controls the active power of a generating source in proportion to the measured RoCoF at the terminal of that generating source. Other SI modeling principles are based on one-loop and two-loop SI modeling methods. The additional active power provided by the one-loop modeling method is only proportional to the measured RoCoF [
25,
26,
27]. To use both RoCoF and frequency deviation measurements, it is necessary to use a two-loop modeling method [
28]. One-loop or two-loop modeling methods enable wind farms to participate in frequency control, reducing the RoCoF of the electrical power system and thus preventing under-frequency load shedding in the electrical power system. The advantage of the two-loop modeling method is that it allows for the supply of additional power, which is proportional to the frequency deviation in the electrical power system. The use of frequency deviation in the two-loop model makes it possible to reproduce the behavior of the synchronous generator more accurately and thus ensure that the frequency of the electrical power system is restored to nominal values more quickly.
In modern electrical power systems, a great deal of attention is paid to the development of electricity networks using HVDC transmission lines. The use of this type of network has several aims, e.g., to optimize the losses of active power in the transmission of large power flows over long distances, and to connect the power systems of different synchronous zones. The advantages of HVDC are that it provides fast and bidirectional power control, frequency support, and blackout recovery (with VSC technology only), and it suppresses power fluctuation.
The SI algorithm method based on the frequency derivation principle of the electrical power system can also be implemented in HVDC transmission lines [
17,
29]. To reduce the number of errors, a low-order filter is used in conjunction with a derivative block, and the selection and calculation of the parameters are quite complicated. To evaluate the frequency derivative and pass the command to the VSC system, it is necessary to ensure a high-quality transmission/communication connection [
30].
The control concept of other HVDC systems that connect two power systems is explored below, one of which is the Virtual Synchronous Power (VPS) control method [
31], which is adapted to control VSC. This control method is based on the traditional generator electric operating model, which is responsible for the control of the VSC converter. The principle of the SI model is based on the motion equation of a traditional generator and a common electromechanical control loop. The power-locked loop is modeled by applying power output measurements and DC input power signal to the Power Loop Controller (PLC) to maintain the frequency of the electrical power system by simulating the rotor speed of the traditional generator. The frequency integral allows for the rotor angular velocity to be modeled, which is used to calculate the HVDC output power.
The authors of [
32] presented a method used to model a virtual synchronous machine that is applied in microgrids for the provision of SI and ancillary services. The output power is calculated according to the principles of active power frequency variation, considering the motion Equation (1), which relates the active power to the angular velocity deviation.
3. Materials and Methods
All synchronous generators connected to the electrical power system rotate at the same synchronous speed while maintaining a constant frequency. In the event of a disturbance or other abnormal event in the electrical power system that causes an imbalance between generation and load, a deviation from the normal 50 Hz frequency is observed. When enough rotating conventional generators are connected to the electrical power system, their KE prevents a sudden change in the frequency of the power system. The KE of synchronous generators is proportional to their inertia, and the term “conventional system inertia” is used to define the inertia of all rotating units (generators, turbines, motors, and all other rotating units that are not connected to the grid through power converters) connected to the electrical power system, and it describes how the frequency will change as the power balance in the power system changes. CSI can be expressed as follows:
The basic parameters affected by the CSI are RoCoF, frequency nadir, and steady-state frequency. In the event of insufficient quantities, the CSI, which is mainly generated by high-mass conventional generation sources, helps to reduce the RoCoF before the electrical power system begins to change the power output signal by activating initial frequency damping. Thus, in the event of a disturbance in the conventional electricity system and a change in the power balance, the CSI reduces the frequency nadir, and only after a certain delay takes place does the primary frequency control stabilize the frequency of the electrical power system. The secondary frequency control returns the frequency to the nominal value.
Using a large real-network mathematical model and the PSS/E, data are required for the calculation and validation of the parameters of the SI algorithm. Here, a mathematical model consisting of more than 3500 buses was used for the calculations. The simulation was performed by evaluating the high-power loss in the electrical power system with the aim to cause a change in frequency and to capture changes in frequency, active power, generator terminals, and system angles and voltage.
A dynamic model was created using standard PSS/E models. Generators were modeled using the round rotor generator model (GENROU) and salient pole generator model (GENSAL). To model turbines, the hydro turbine governor model (HYGOV), modified IEEE type 1 turbine governor model with boiler controls (TGOV5), and IEEE type 1 speed-governing model with speed deadband (IEEEG1SDU) were used. Excitation systems were modeled using IEEE type ST4B potential or a compounded source-controlled rectifier exciter (ESST4B) and a 1992 IEEE type ST1A excitation system model (ESST1A). To model the power stabilizer, a 1992 IEEE type PSS2A dual-input signal stabilizer model (PSS2A) [
33] was used.
Objectives of the methodology development and determination of its effectiveness:
Using the results of the generator mathematical model in the presence of power imbalance in the power system, develop efficient methodology to generate an SI algorithm.
Develop an efficient SI algorithm suitable for integration into the controllers of power sources connected to the power system via power electronics converters.
Evaluate the efficiency of the developed SI algorithm in ensuring the frequency stability of the electrical power system in the presence of power imbalance.
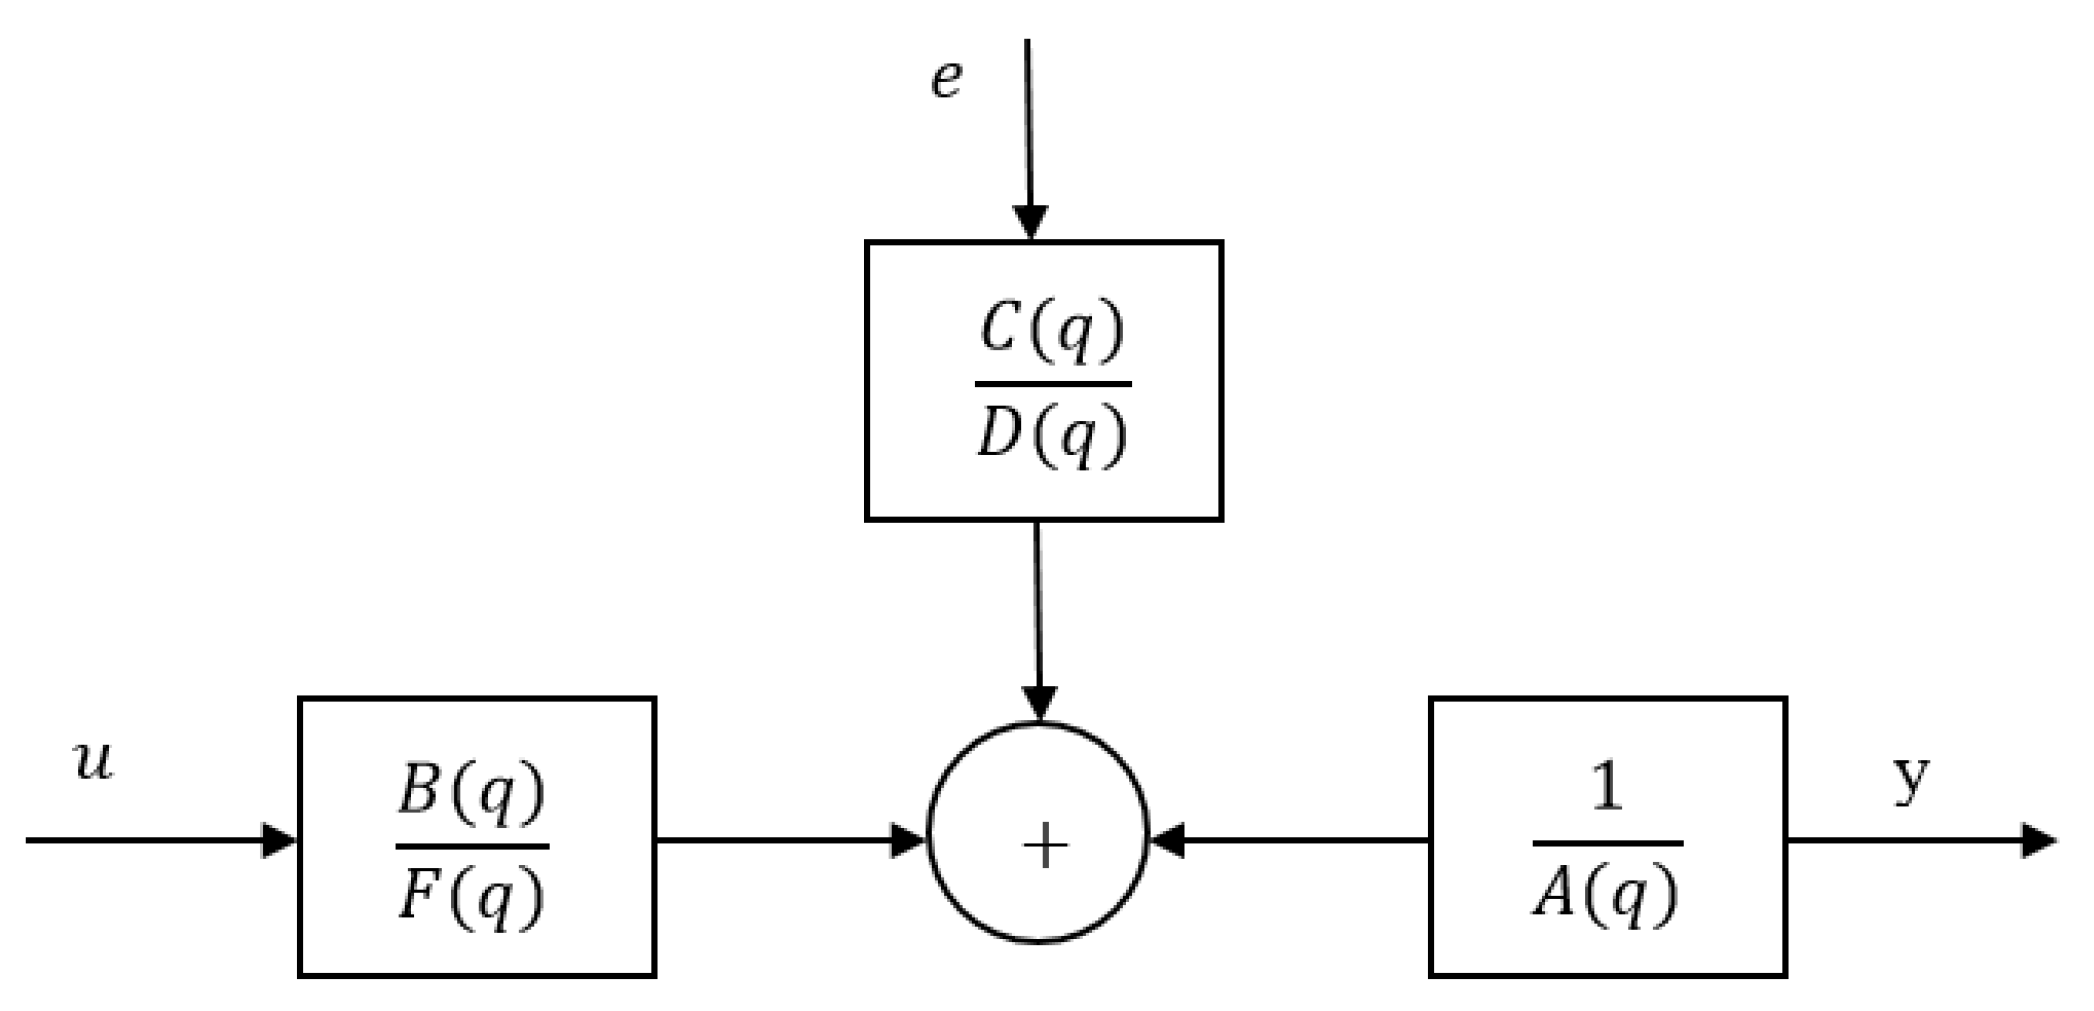
A general linear (GL) model (
Figure 1), which provides flexibility for system dynamics and stochastic dynamics, can be used for parametric identification. However, nonlinear optimization techniques are required to develop a general linear model. These methods require complex mathematical calculations, and it is unclear whether stable results can be obtained.
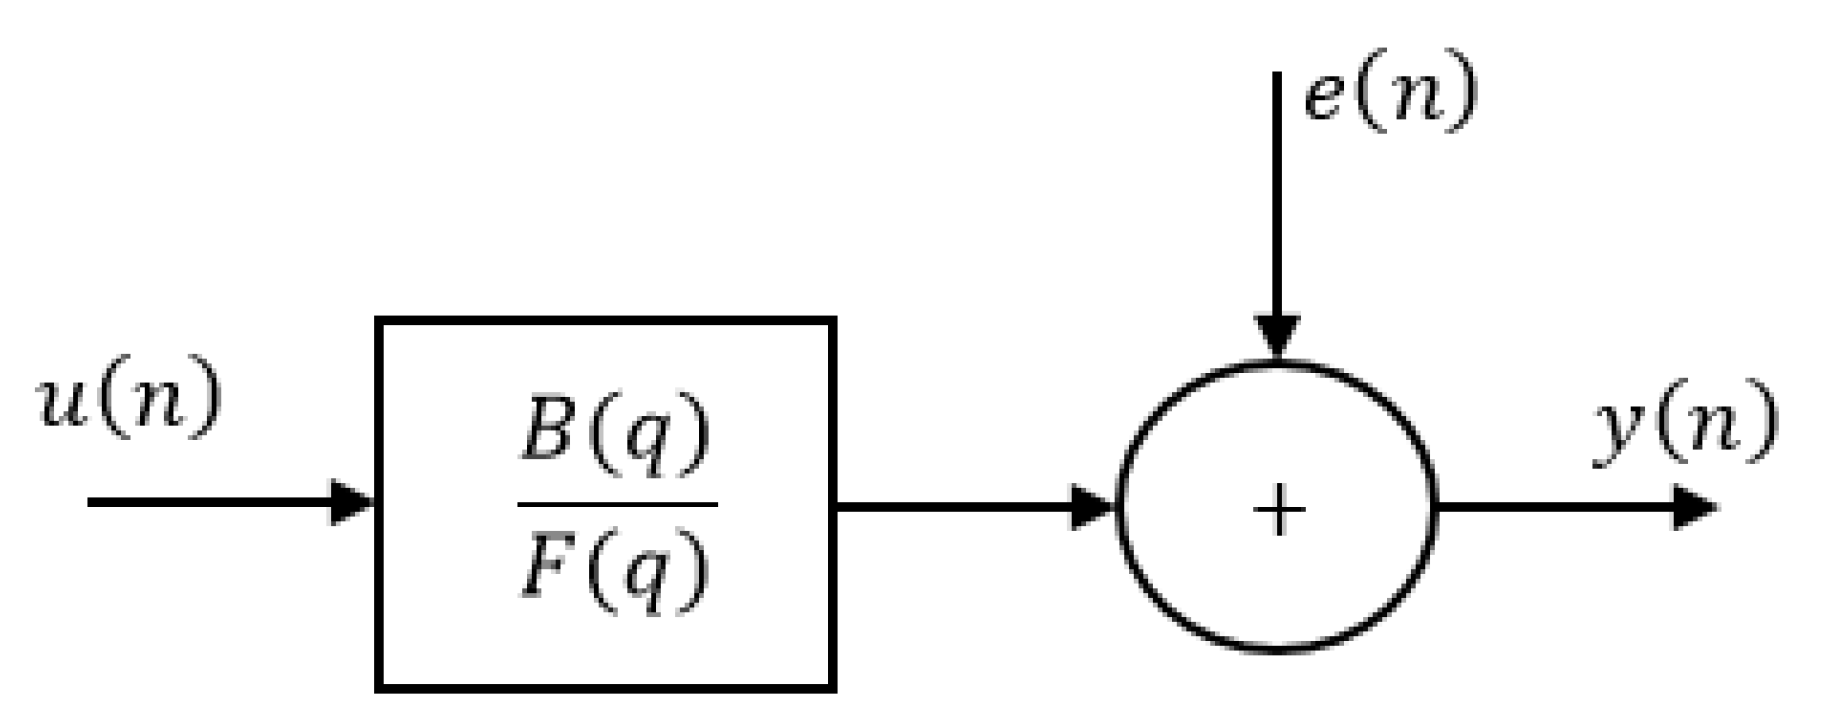
Therefore, in this paper, we chose to use a simplified output-error (OE) model. When
A(
q),
C(
q), and
D(
q) are equal to 1, then the expression for the GL polynomial model is written as the output-error (OE) model:
The signal scheme of the OE model is shown in
Figure 2.
The polynomial functions
B(
q) and
F(
q) for
q−1 can be expressed as:
The OE model is a polynomial model with simpler configuration that consists of two active polynomials—B and F. This model is a traditional transmission function that associates the measured input with output while considering white noise as an additional output interference. The OE model uses time and frequency domain data. This model describes the system dynamics without the use of interference characteristic modeling parameters. Other parametric identification models such as the estimated BJ and ARMAX can also be used.
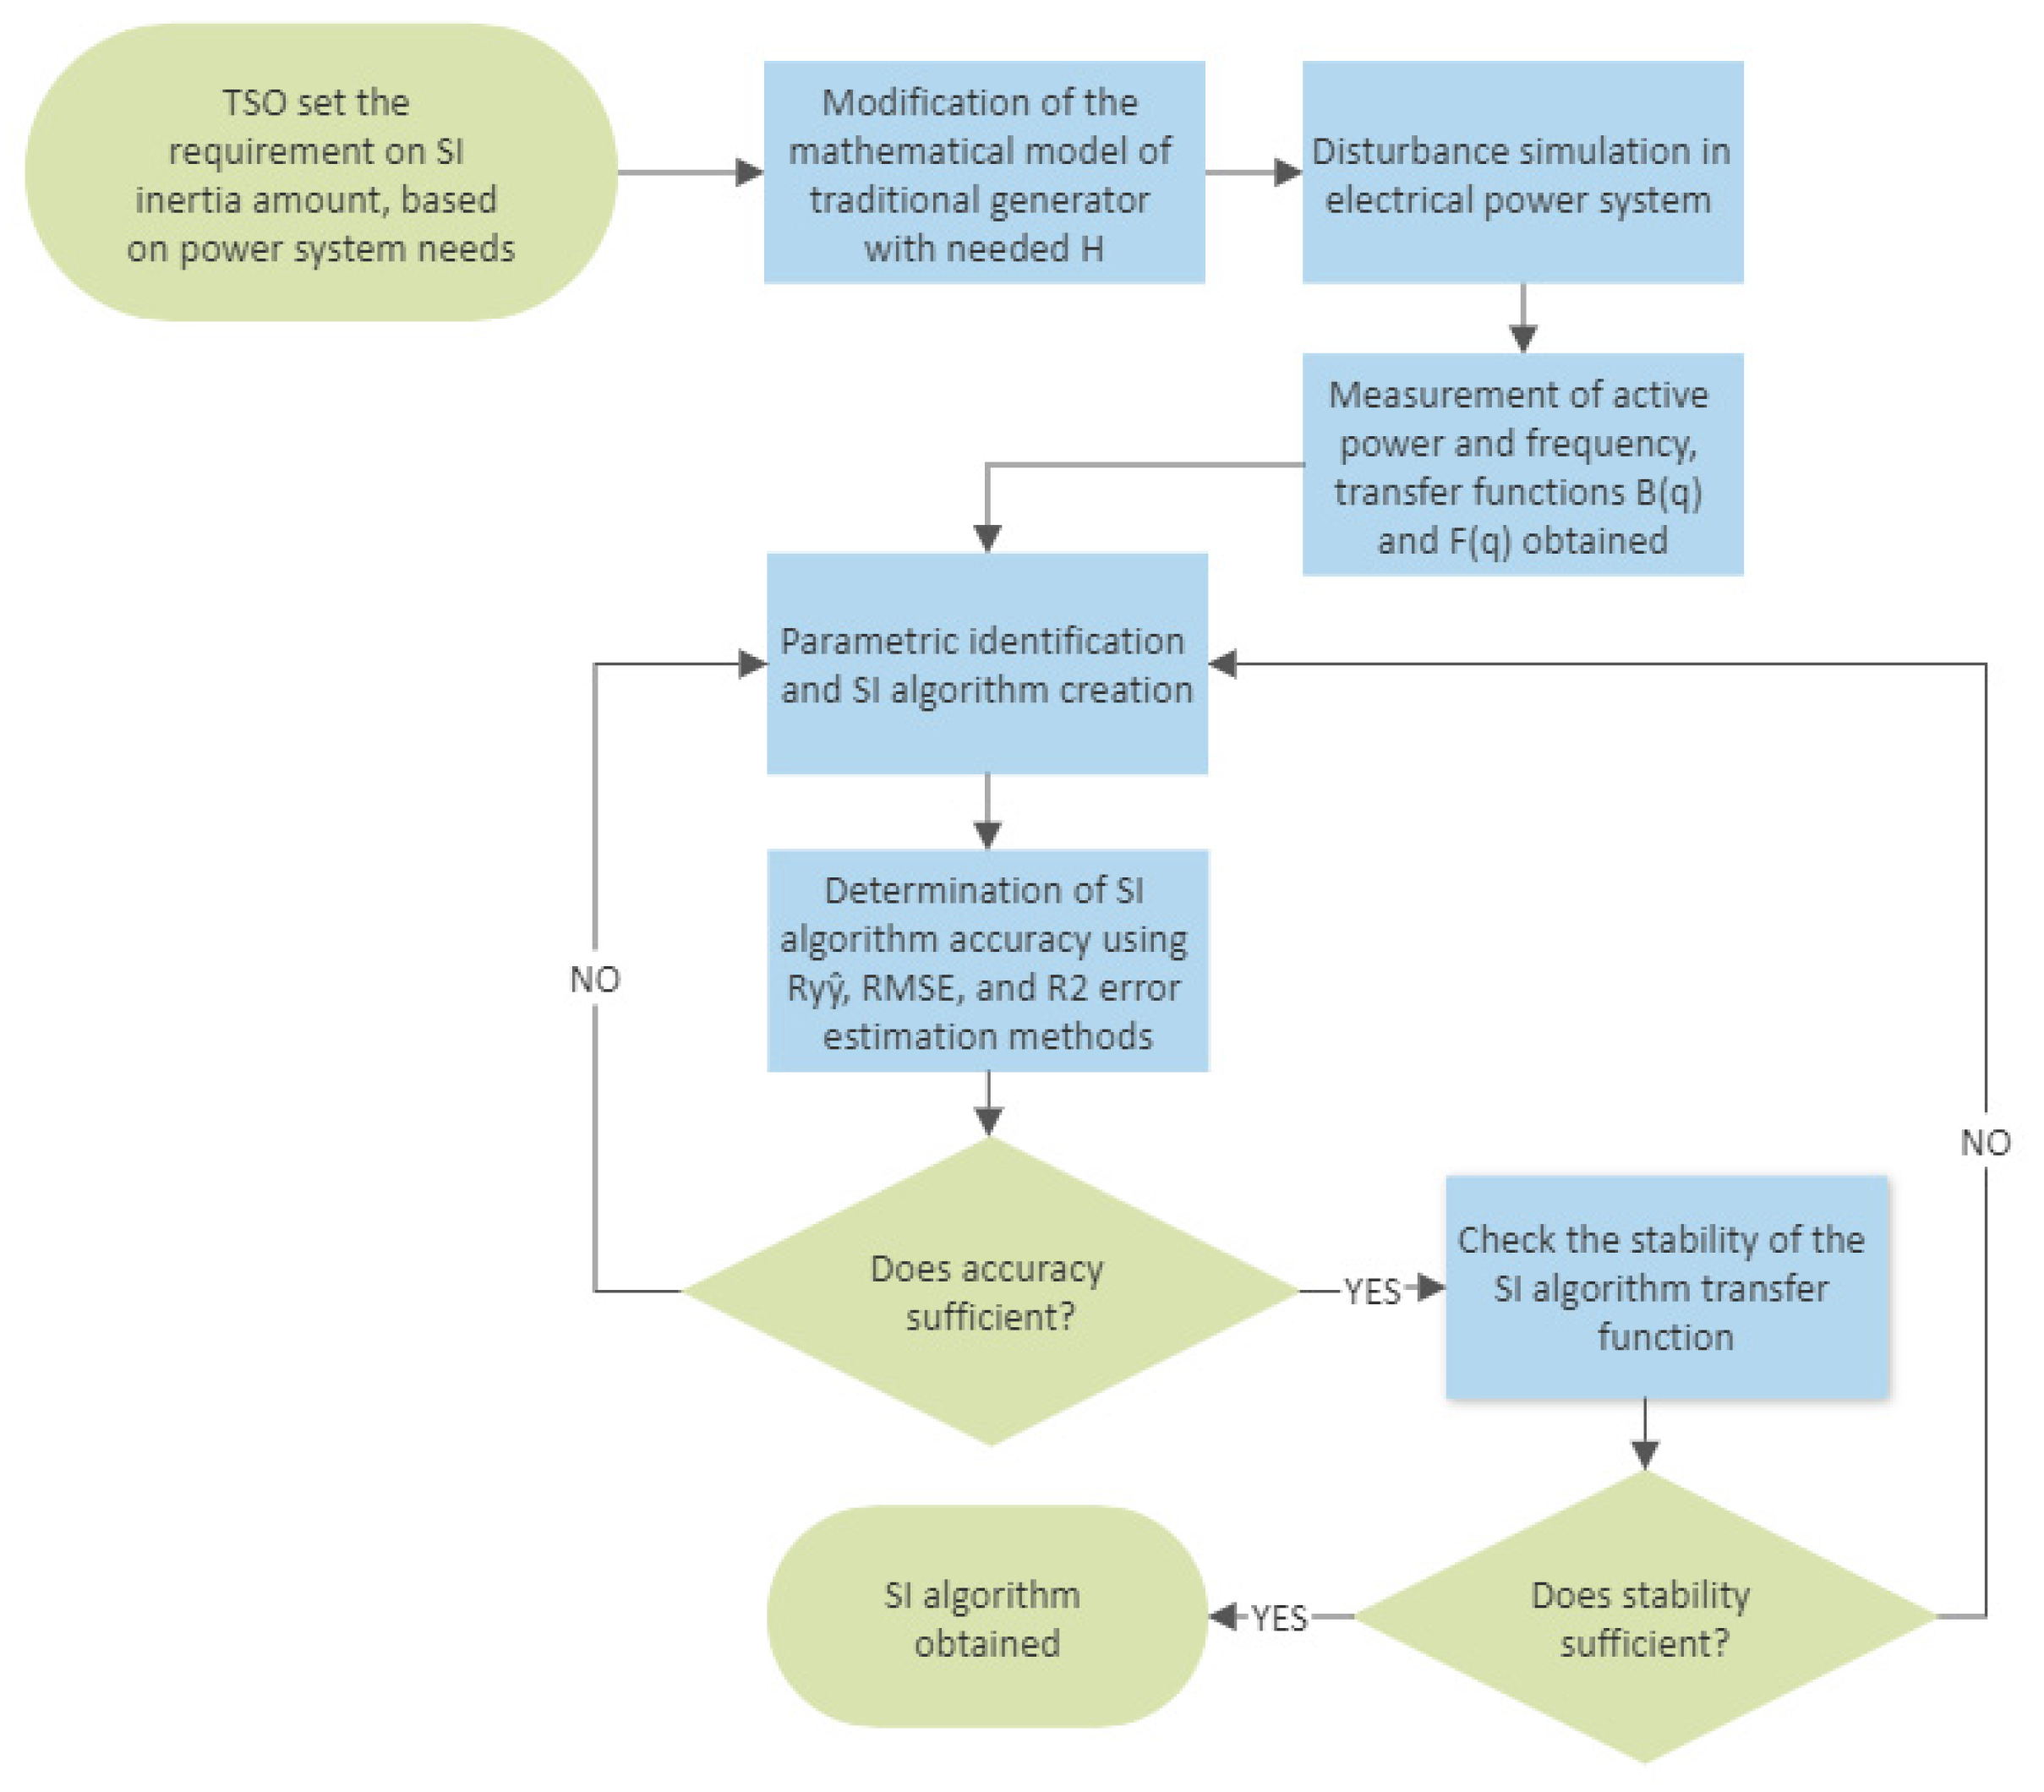
The following is the methodology for the development of the SI algorithm:
First, the mathematical model of the traditional synchronous generator is modified to extract the effect of inertia in the event of interference in the electrical power system as accurately as possible. For this purpose, the generator power system stabilizer and the governor model system are deactivated. The required inertia is also determined in the generator model.
Disturbance is modeled/simulated in the electrical power system by disconnecting the generating sources so that the frequency change differs several times in the electrical power system compared with the calculation errors (e.g., 300 mHz). It is essential that the electrical power system remains stable after the disturbance and that the transient process reaches a steady state.
The frequency change in the electric power system at the point of common coupling (PCC) and the change in the active power of the generator is recorded. The following transmission functions are created:
- 4.
Using the OE model of parametric identification and using Functions (7) and (8) obtained in the 3rd methodology point, the SI algorithm is generated with the input signal:
The second-order transmission function of the SI algorithm is as follows (11):
- 5.
The error of the output signal y(n) of the SI algorithm with the output power of the generator PG(t) is determined. Ryŷ, RMSE, and R2 error estimation methods are used to determine the accuracy of the algorithm.
The Transmission System Operator (TSO) assesses the frequency stability of the power system according to the RoCoF value and determines how many additional SI algorithms need to be implemented to ensure the stability of the electrical power system.
The flowchart provided in
Figure 3 provides the step-by-step SI algorithm methodology.
4. Results and Discussion
Based on the methodology presented in
Section 3, Materials and Methods, the low-order SI algorithm transfer function was obtained. Simulink and the PSS/E modeling software packages were used to obtain this algorithm. The input signal of this algorithm must be system frequency change (Δf), and the output signal is fed to a controller of a generating source that is connected to a power system through power converters. An advantage of this algorithm compared to the solutions provided by other authors is that no additional tuning is required after the SI algorithm is developed with appropriate inertia magnitude.
Power system frequency and comparable generator active power output calculations were performed using the PSS/E modeling environment to obtain transfer functions in the event of disturbance of the electrical power system. For this purpose, the PSS and the turbine governor were not evaluated to obtain the most accurate possible active power change due to the characteristics of the generator. The PSS was disconnected because it is a system designed for low-frequency power fluctuation damping by transmitting control signals to the excitation system to reduce influence on the active power component, which is not related to the inertia of the generator. The turbine governor was disconnected because it undergoes thermodynamic processes that are in the order of 10 to 104 s, meaning they are irrelevant to the calculations related to the SI algorithm. Thus, after the elimination of both the PSS and turbine governor, a comparable generator was obtained, and only electromechanical processes were evaluated.
Different frequency changes in the power system after disturbance were also modeled, i.e., in the case of the loss of different generating sources. In total, five different cases were modeled and calculated. To explain the principles of the methodology in this paper, we present one of the five research models developed in the Simulink (
Figure 4). The data obtained were used to compare an output signal of the SI algorithm with the active power output of the comparable generator to the network in the event of a fault. The SI algorithm was obtained using the Simulink software package according to the fourth point of the methodology presented in this paper. The results were also compared using a developed model (
Figure 4). This model simulates the acceleration block (gray square) to eliminate the delay of the controller, inverter semiconductor elements/bridge (e.g., IGBT transistors), and frequency measurements.
Three different options were calculated: Option No. 1: H = 5 s and 4173 MW loss of generation; Option No. 2: H = 5 s and 2273 MW loss of generation; Option No. 3: H = 5 s and 1263 MW disconnected load. Using the research model given in
Figure 3., all the options were compared with the output signal of the developed SI algorithm, and the results are presented in
Figure 5,
Figure 6 and
Figure 7.
We compared SI algorithm output with a comparable generator without turbine governor, i.e., the deadband of the turbine governor was increased so as not to affect the change in calculated frequency. This eliminates thermodynamic processes that do not affect SI. From the presented modeling results, we can see that the output signal of the SI algorithm reproduces the power of the comparable generator. In the case of different faults, the active power amplitude and power direction of the SI algorithm correspond to those of the comparable generator, i.e., in the case of excess active power, power is decreased, and in case of a deficit, power is increased.
In a real system, the SI algorithm should only work at the initial moment of the fault (
Figure 5b,
Figure 6b and
Figure 7b), i.e., activation is limited in time and by limiting the direction of active power change twice.
The errors were evaluated by using the models for the determination of the error estimates for R
yŷ, RMSE, and R
2, which are given below, and the results are given in
Table 1,
Table 2 and
Table 3.
As we can see from
Table 1, in all three compared options at 4173 and 2273 MW power generator disconnection and 1263 MW power load disconnection, the SI algorithm output signal was fully consistent with the comparable generator, which was based on the mathematical model of a real traditional generator, the transfer of power to the power system in the event of a fault. Based on the obtained results, we recommend using the OE model, because its structure is simpler, and more accurate estimates are obtained compared to when other models are used; therefore, the OE mathematical model is more efficient compared to the ARMAX and BJ models.
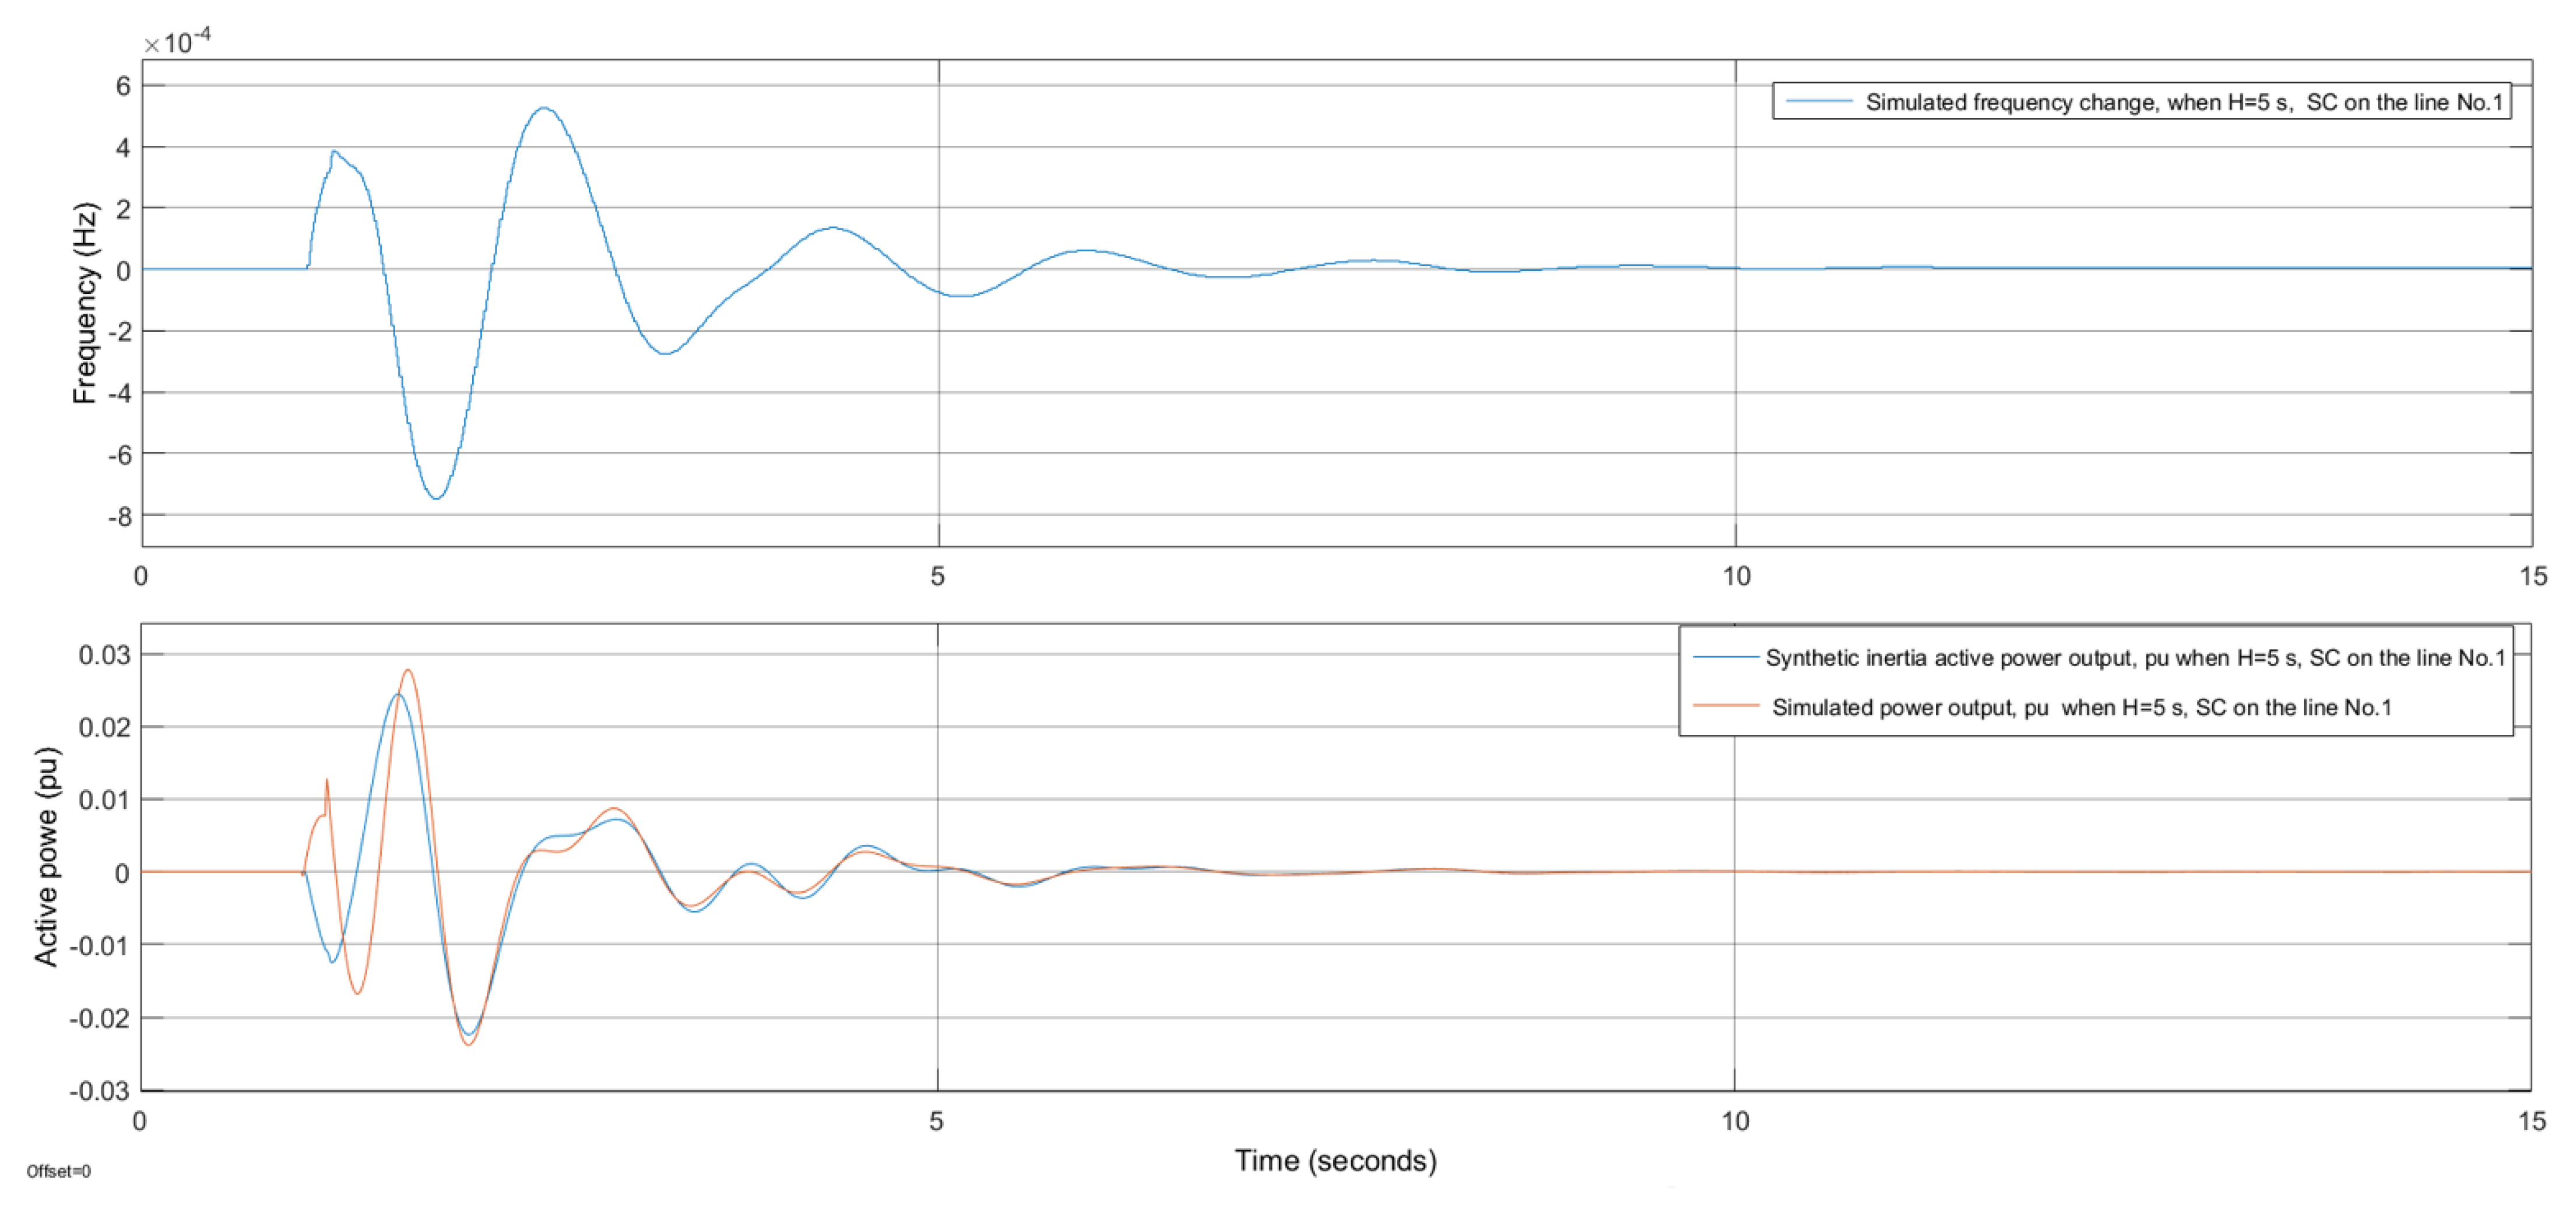
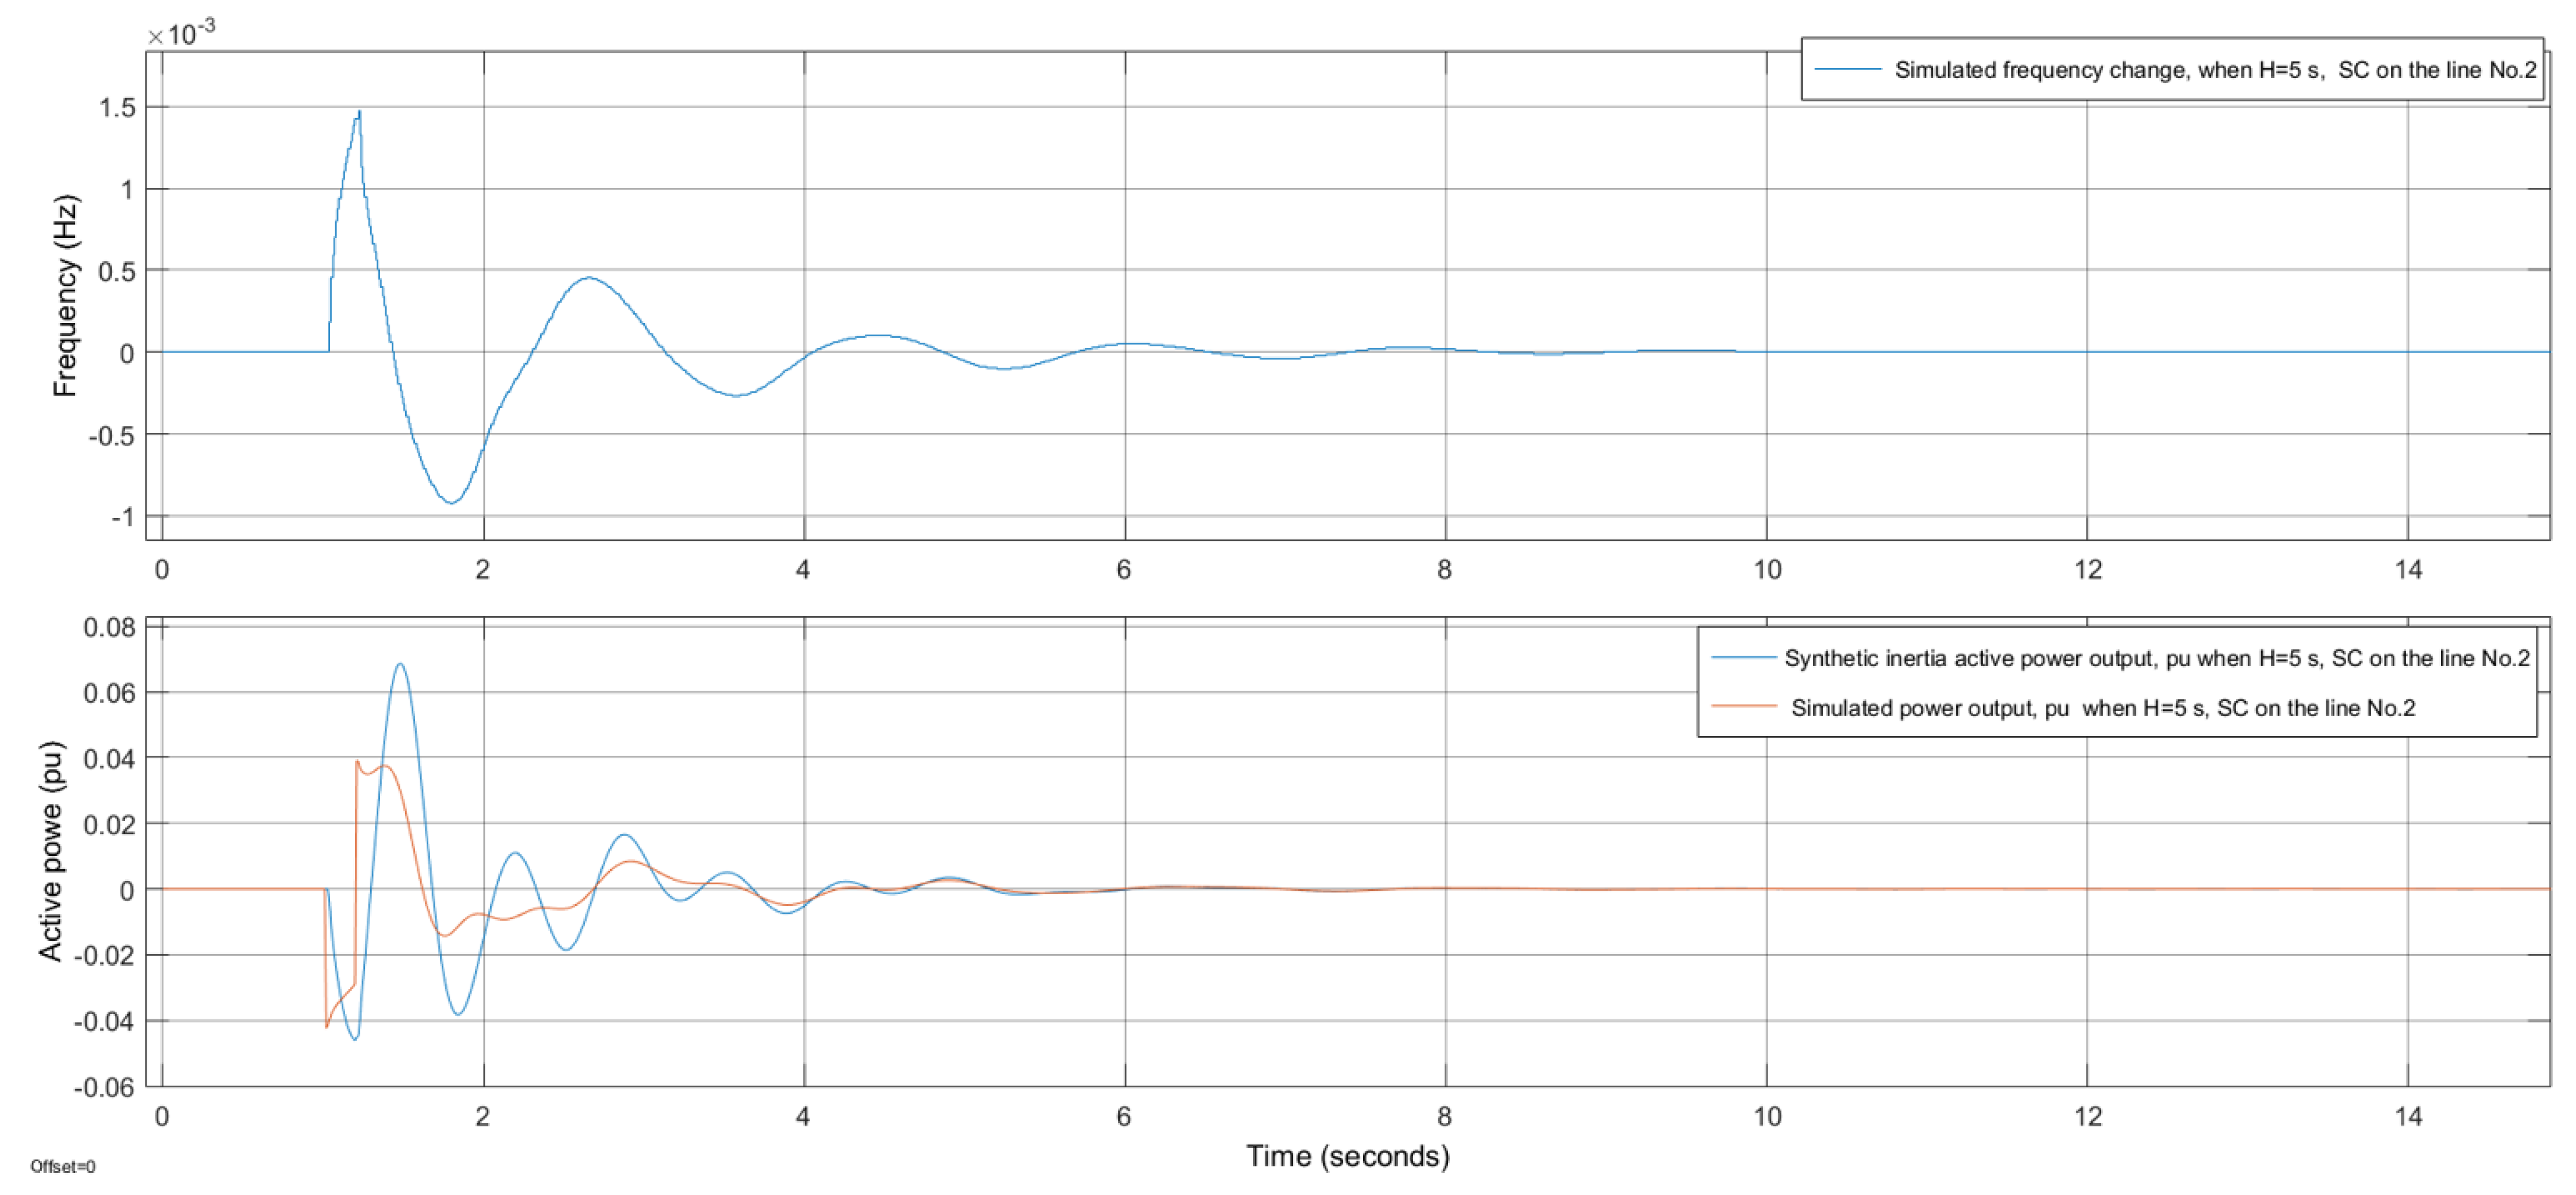
The following figures compare the performance of the developed SI algorithm with the comparable generator (CSI) in the event of a short circuit in the electrical power system. The upper figures (
Figure 8 and
Figure 9) represent the change in system frequency during a short circuit in an electrical power system, and the lower figures show the active power outputs of the SI algorithm and CSI simulated power output.
Figure 8 and
Figure 9 compare the responses of a traditional generator and the SI algorithm in an electrically relatively close three-phase short circuit in a 330 kV overhead line and an electrically relatively far three-phase short circuit. The response of a traditional generator to a short circuit was modeled in the PSS/E packet and captured the frequency, generator power, and busbar voltage. In the mathematical model of this generator, the deadband of the turbine governor is relatively large, i.e., the turbine governor does not work during the transient process. The Automatic Voltage Regulator (AVR) system was activated and modeled. Subsequently, the developed SI algorithm was modeled with the Simulink software package, and frequency change, modeled with the PSS/E, was fed to the input of the SI algorithm in the Simulink.
We observed a transient process (
Figure 8) in which the three-phase short circuit is electrically distant from the traditional generator, and then, the voltage at the generator terminals does not drop due to the AVR system, and the rotor angle increases in terms of the stator magnetic field. Due to a short circuit in the grid, voltage decreases; therefore, an excitation system is activated that tries to restore the voltage at the generator terminals, i.e., the exciter increases the current. This is the reason why the traditional generator increases active power at the initial short circuit time. In this case, SI algorithm behavior is superior to the traditional generator, because the SI algorithm decreases the active power at the initial short circuit time. Most likely, such SI algorithm behavior will help to reduce generator oscillations during the transient process. The behavior of the SI algorithm from 0.9 s is analogous to that of a synchronous generator.
We see that, in the case of a short circuit (
Figure 9), the SI algorithm decreases the power at the initial time and only disconnects the short circuit after 140 ms; the power starts to increase, and the transient process settles approximately in 5 s. This operation of the SI algorithm is superior to the generator in that it delivers active power to the electrical power grid at the initial short circuit time, thus increasing the stability of the electrical power grid. In this case, the traditional generator starts to decrease the power at the initial short circuit time, because the short circuit is electrically close (only by the transformer); therefore, the voltage at the generator terminals is significantly reduced because the resistance approaches zero, and due to the magnetic processes in the generator, the current stops increasing when a certain value is reached, meaning that the active power supplied to the electrical power grid by the traditional generator decreases.
The type of inverter and its characteristics (current or voltage source) may affect the performance of the SI algorithm.
5. SI Algorithm Verification Based on the Simple Theoretical Model of a Power System
In this paper, we present the results of the comparison of the efficiency of the SI algorithm to ensure the frequency stability of the system when the frequency change is modeled in a simple theoretical model with and without the integrated SI algorithm.
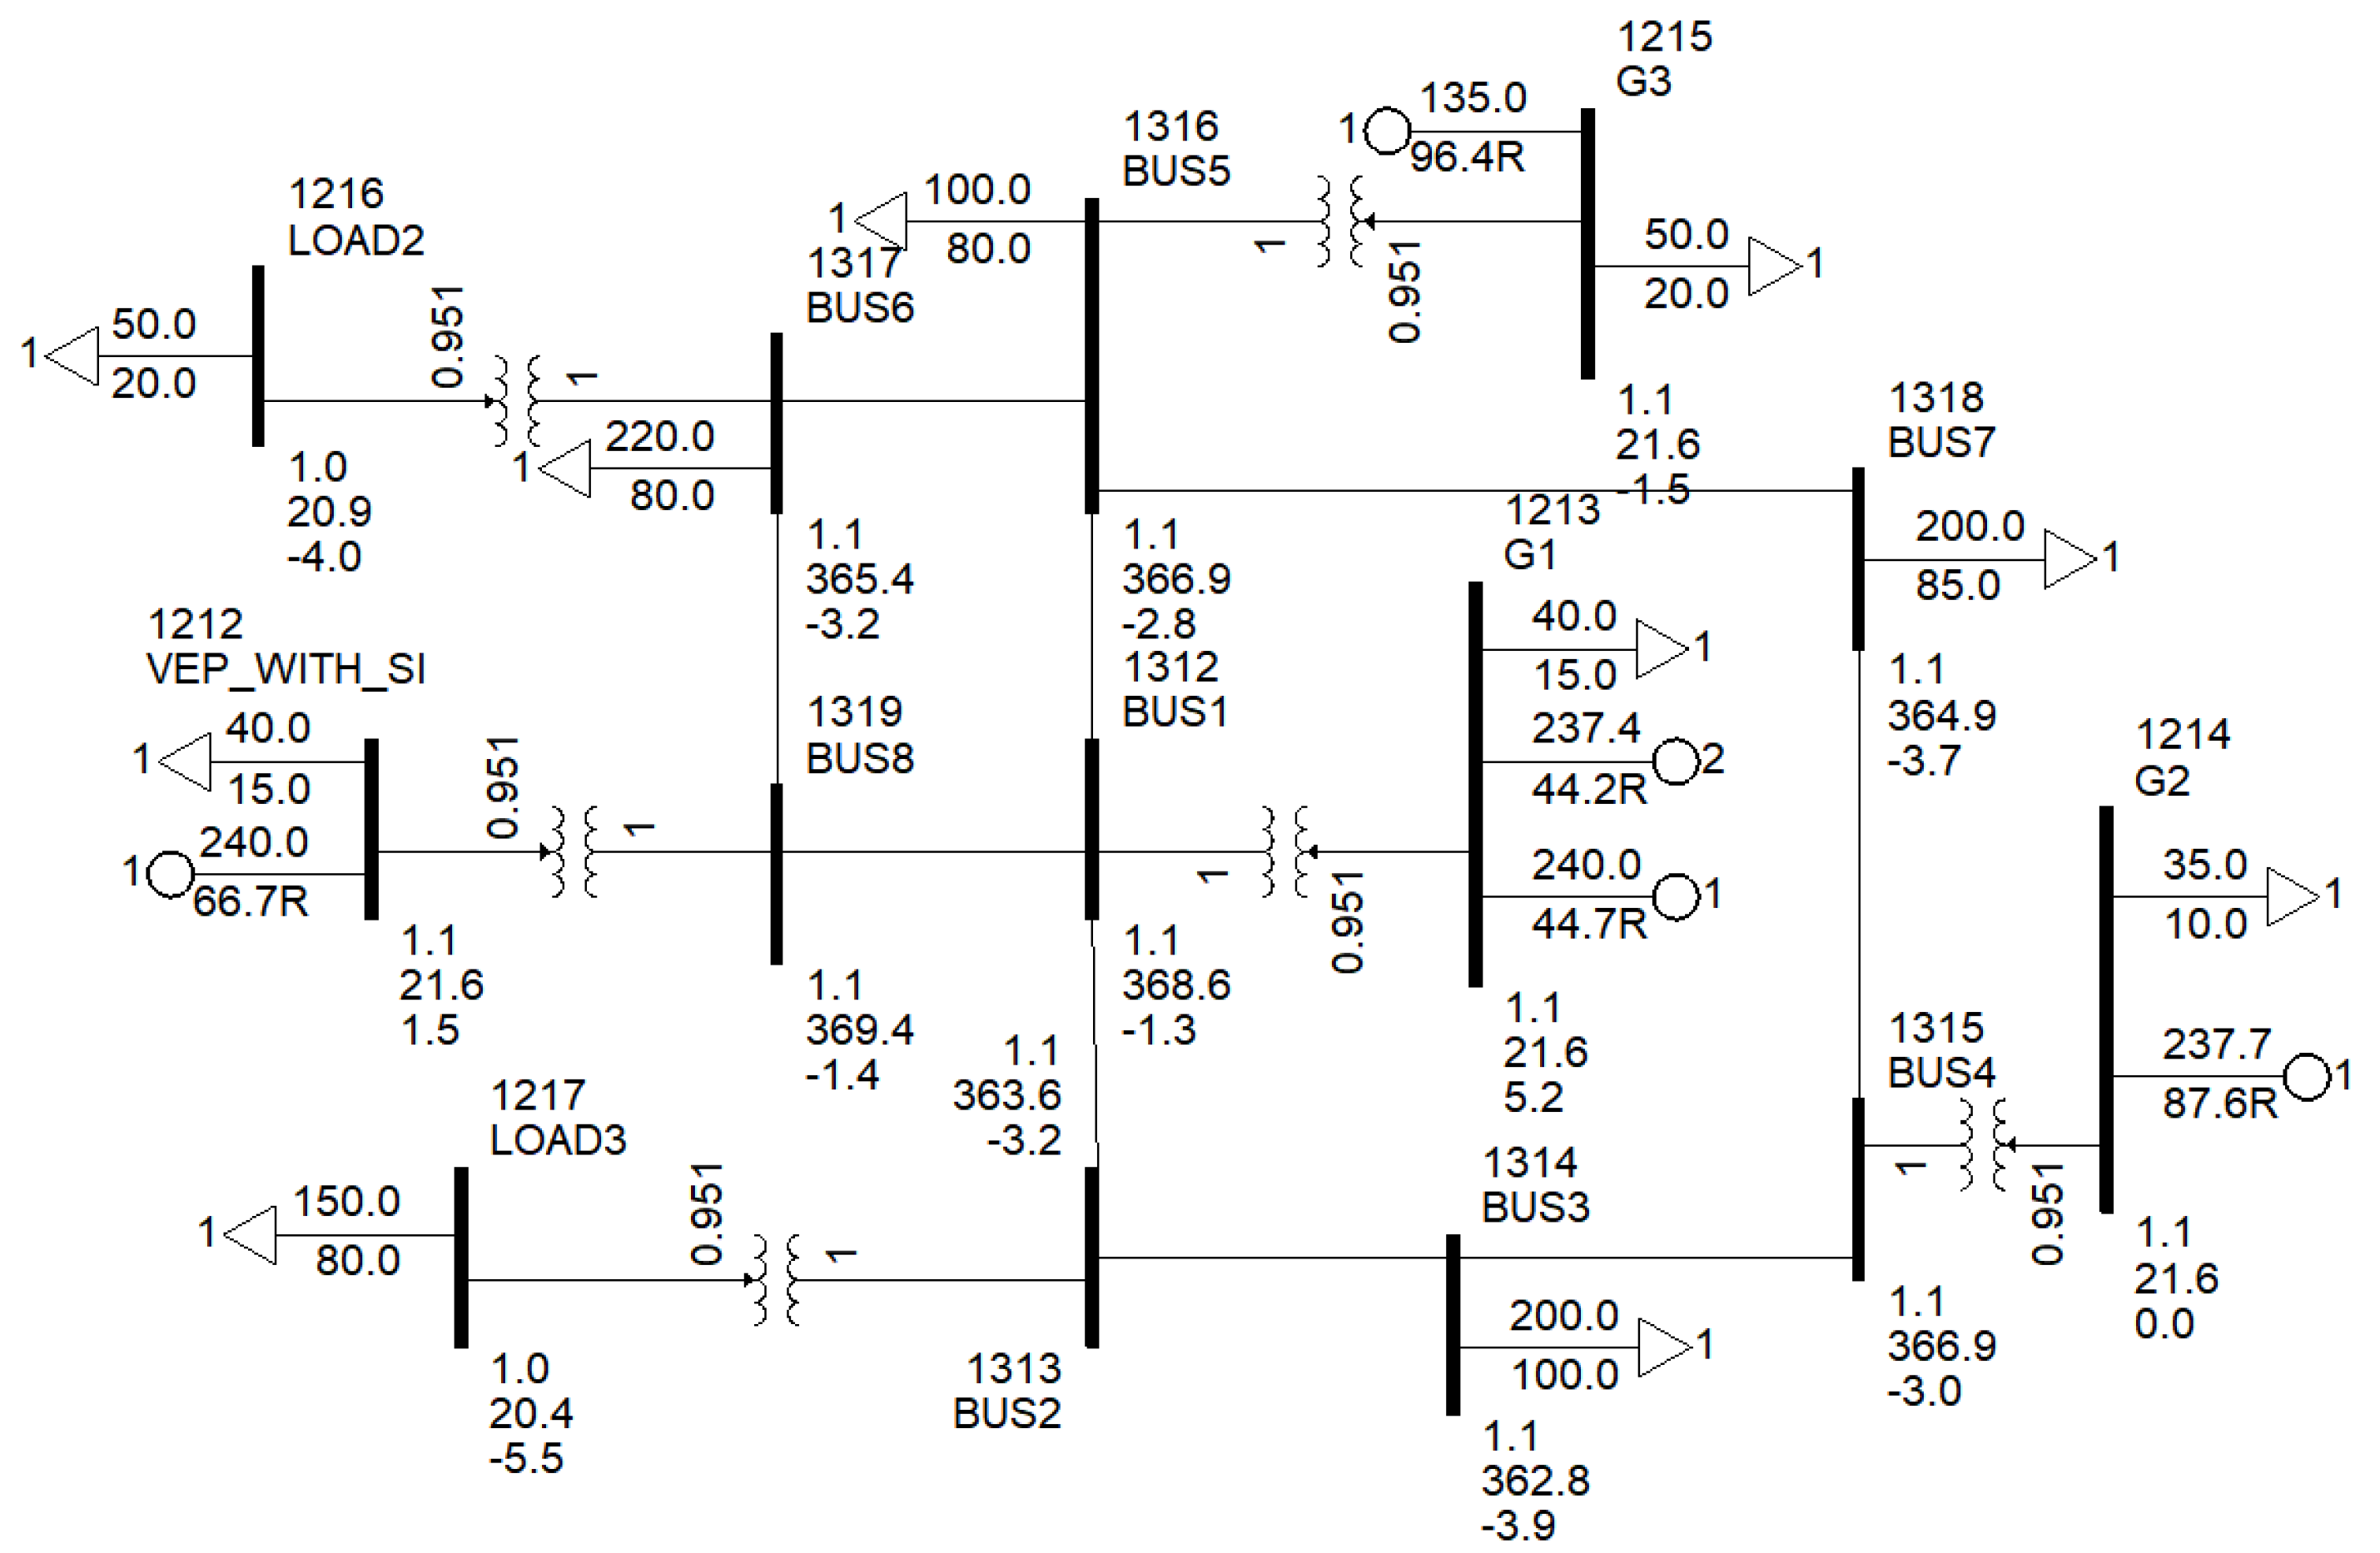
A simple theoretical model (
Figure 10) with 1090 MW of generating sources was modeled, of which 240 MW was generating sources connected to the electricity system via power converters with an integrated SI algorithm developed according to the methodology presented in this paper. The remaining generating sources were traditional generators. Calculations were performed to investigate the efficiency of the developed SI algorithm in ensuring the frequency stability of the power system in the presence of power imbalance. For this purpose, two sets of calculations were performed: first—when generating sources were connected to 1212 busbar in the research model via power converters with the integrated SI algorithm; second—without the SI algorithm. Dynamic calculations were performed in both cases when the three-phase short circuit in 1215 busbar was simulated, and the relay protection was disconnected after 140 ms.
As can be seen from the results of the calculations in
Figure 11, when 240 MW generating sources have an integrated SI algorithm with H = 5 s, a change of 525 mHz frequency is observed after a three-phase short circuit and the loss of 85 MW generation, and without the SI algorithm, when H = 0.5 s–650 mHz. Thus, when 22% (of the total power of the generators, including generating sources connected via converters) of generating sources connected via converters with the integrated SI algorithm with H = 5 s are integrated into the power system; the frequency drop is reduced by 19.2% compared to the variant when the SI algorithm is not used.
The amount of inertia can be chosen by each owner when applying to participate in the SI market or by asking the TSO to issue the terms and conditions of connection by concluding a bilateral SI service agreement with the TSO. The choice of the amount of SI depends on the type of generation source planned to be installed, the power, and the market price of the SI service. This is not addressed in this paper, as it would require a cost–benefit analysis (CBA) to be performed and the establishment of a market for SI services with service prices. It is recommended that the SI algorithm should be divided into several options, with H = 3 s and H = 5 s, which would lead to a more flexible and competitive market for SI services. Not only can generation sources with an SI algorithm participate in such a market, but traditional generators and consumers that have synchronous motors can also participate. These users could give the energy system even more flexibility.
Considering that an increasing amount of attention is being paid to smart grid (SG) systems [
35,
36], the SI algorithm presented in the article can be integrated not only into transmission system HVDC and battery energy storage systems but also into small HVDC systems producing consumers (
Figure 12), thereby contributing to the increase in the inertia of the electric energy system. This service can be provided by any user participating in the SI market.
A comparison of the SI algorithm output with the simulated synchronous generator output proved that the obtained SI algorithm identically reproduces the behavior of a traditional generator in the event of sudden disturbances in the electric power system. Thus far, all of the previous articles have provided a comparison of the obtained SI performance results with other SI system results. This does not show how well SI performs in comparison with real units that provide inertia to the electrical power system. The SI algorithm presented in this paper can be adapted to various inertia coefficient requirements and easily integrated into various systems, both for those that already exist and for those being installed, as only one controller is required, and the second-order SI algorithm transfer function shall be set up (11). Usually, the inertia (H) of modern generators is 3 s, but if higher inertia is required, for example, there could be an additional paid service. More detailed studies are required to determine the need for inertia, which is not analyzed in this article. This is a separate topic that requires additional investigation, because inertia depends on the structure and behavior/characteristics of the power system, such as RoCoF.
Stability analysis was calculated to determine the stability of the SI algorithm transfer function. Such an analysis was performed by calculating near-cancelling pole–zero pairs, and the results are displayed graphically in
Figure 11. The pole–zero map of a continuous time-identified state-space model is plotted. A pole–zero plot indicates the location in the complex plane of the poles and zeros of the SI algorithm transfer function of a dynamic system. This transfer function has two real zeros, indicated by an o and a pair of complex poles, shown by an x. In other words, the polar and zero positions in the complex plane are plotted by x and o, respectively. The results are plotted in continuous time, meaning that all poles shall be located on the left side (first and fourth quarter fraction) to ensure stability. Upon analyzing the results provided in
Figure 13, it is obvious that the SI algorithm transfer function is stable because the poles are in the left half-plane.
6. Conclusions
A methodology that allows the inertia (H) of a traditional generator to be accurately reproduced was developed. The proposed algorithm is not complicated, and it is simple to implement in a real controller. The OE mathematical model was used to obtain the SI algorithm, which provides better-estimated results than other identification models (ARMAX and BJ). The most accurate transfer function that was obtained by the OE parametric identification model was selected based on the Ryŷ and R2. The correlation coefficient was 0.9982, which was obtained between the functions of the power output of the traditional generator inertia and the obtained SI algorithm (the coefficient of determination was 0.9964). Such a high correlation coefficient proves that the obtained synthetic inertia transfer function is adequate in a traditional generator. The developed efficient SI algorithm can be implemented in real systems to improve the stability of the power system. A stability analysis was performed, and a pole-zero map was plotted, which proves that the obtained SI algorithm transfer function is stable.
