Abstract
The aim of this study is to assess the diagnostic performance of strain elastography (SE) versus 2D shear-wave elastography (2D-SWE) by providing a head-to-head comparison of the two methods. Ninety-four thyroid nodules were evaluated using conventional ultrasound (B-mode) and SE, namely, real-time elastography (RTE) with a Hitachi Preirus machine (Hitachi Inc., Tokyo, Japan) and consecutively, 2D-SWE with SuperSonic Mach30 equipment (Supersonic Imagine, Aix-en-Provence, France). The results were compared in all cases to the pathology reports. Out of the 94 nodules, 29 (30.9%) were malignant. Both SE and 2D-SWE parameters proved to have excellent diagnostic quality, with comparable results. The mean elasticity index was the best parameter for the 2D-SWE (AUC 0.912); for a cut-off value of 30.5 kPa, it predicts thyroid malignancy with a sensitivity of 79.3%, specificity of 95.38%, NPV of 91.2% and PPV of 88.5%. The best parameter for SE was the strain ratio (cutoff > 3.9; sensitivity 82.7%; specificity 92.3%; AUC 0.905). When integrated in the ultrasound risk algorithm, both elastography methods improved the diagnostic performance: AUC 0.764 vs. 0.886 vs. 0.861 for B-modes: B-mode + 2D-SWE vs. B-mode + SE. We concluded that elastography adds diagnostic value in predicting malignancy, both when Hitachi RTE and SuperSonic 2D-SWE were used.
1. Introduction
The diagnosis of thyroid nodules usually happens when the patient notices their presence, when clinically examined by a doctor or, more and more commonly, when an incidental imaging procedure is performed, such as carotid ultrasonography (US), computed tomography (CT) or magnetic resonance imaging (MRI) of the neck [1,2,3]. The diagnostic goal is to estimate the malignancy risk of each nodule at the time of the initial diagnosis in order to make an accurate, individualized therapeutic decision [1,4,5] in order to avoid an unnecessary fine-needle aspiration (FNA), or surgical treatments. Oversurveillance is often made responsible for the rising prevalence of thyroid cancer, with an increasing detection of particularly small, differentiated tumors [5], such as microcarcinomas. Ultrasound evaluation selects the nodules that need to be evaluated by FNA. Molecular testing in additional to FNA cytology is useful in nondiagnostic or indeterminate cytological results [4]. Nevertheless, it is not a routine procedure, not widely available, and a certain panel of genetic rearrangements and mutations are not well-established [6,7].
The imaging evaluation remains the main component for guiding the medical approach. Thyroid scintigraphy is not routinely recommended in the evaluation of thyroid nodules by most authorities, but rather in selected cases, when autonomous function is suspected [8]. High-resolution neck ultrasound (US) provides excellent images for thyroid morphology, and is considered the golden standard in thyroid imaging [9,10]. There is no single ultrasound characteristic predictive for malignancy, but rather, a combination of multiple US characteristics that generate different risk categories. In this regard, various stratification systems have been proposed [4,8,11,12,13]. They are continuously being improved, given the crucial role of imaging in the correct identification of the small percentage of thyroid cancers (up to 7–8%) in all thyroid nodules [14].
Elastography has been a helpful additional tool that enhances the diagnostic quality of classic ultrasound evaluation [15]. The technique provides complementary US information by detecting differences in the elastic properties of the thyroid tissue, adding stiffness as the extra quantifiable parameter to the ultrasound evaluation.
Strain elastography (SE) assesses the tissue elasticity by applying an external or internal compression (stress) and measuring the normal strain. In shear-wave elastography (SWE), a dynamic stress is applied by the device, generating perpendicular (point-SWE and 2D-SWE) or parallel (transient SWE) shear waves (SW). The measurement of shear-wave (SW) speed provides a quantitative measurement of the tissue elasticity [14]. The first 2D-SWE technique was developed by Supersonic Imagine (France) and was extensively used for the evaluation of liver fibrosis [16,17]. The operator must understand the limitations of each technique, which may affect the interpretation of the results [15]. Most clinical guidelines for thyroid pathology acknowledge elastography as an important additional tool for greyscale evaluation [4,8]. Moreover, the World Federation of Societies for Ultrasound in Medicine and Biology (WFUMB) has provided guidelines for the use of thyroid US elastography [18].
SE offers convincing evidence for detecting high-risk thyroid focal lesions [19,20,21], whereas SWE techniques still need more research to provide confidence in thyroid imaging [22,23,24]. The main aim of this paper is to assess if there are any differences in the elastography information delivered by two high-end techniques for 2D-SWE and SE in predicting the risk of malignancy of thyroid nodules, with histology as a reference. We chose to perform a head-to-head comparison of the two elastography techniques in order to demonstrate if either one of them has a general advantage, given that the vast majority of previously published comparative studies analyze different study groups, introducing evaluation biases. Furthermore, a direct head-to-head comparison of the two techniques implemented on the Hitachi Preirus and the SuperSonic Mach30 has not yet been performed.
2. Materials and Methods
2.1. Patient Inclusion and Exclusion Criteria
The study was conducted according to the guidelines of the Declaration of Helsinki and approved by the Local Ethics Committee of the County Emergency Hospital “Pius Brinzeu” Timisoara (nr. 235/2021). Informed consent was obtained from all subjects involved in the study.
This prospective study included 437 consecutive patients who presented in our ultrasound unit for the evaluation of known thyroid nodules, between 1 February and 31 August 2021 (7 months). Out of these, 215 patients had an indication for thyroid FNA, according to the ultrasound appearance: low-risk nodules if larger than 2 cm, intermediate-risk nodules if larger than 1.5 cm, and high-risk nodules if larger than 1 cm; in high-risk nodules between 0.5 and 1 cm, FNA was performed only when individual, anamnestic risk factors were present [9]. Confirmed Bethesda II nodules with a visible goiter or objective compression and nodules in Bethesda categories III-VI were referred to surgery and the pathology reports were obtained. By the end of September 2021, 90 cases had the final pathology report. The pathology report, not the FNA report, was considered the golden standard for defining thyroid cancer. Only these cases were included in the final analysis. The management decision was in accordance with the ATA guidelines for thyroid nodules [4]. The concomitant presence of autoimmune thyroid disease (AITD) was not an exclusion criterion. The patients were evaluated clinically and by means of ultrasound. Conventional US of the neck was performed in all patients, followed by examination with 2 different elastography techniques: SE and 2D-SWE, performed with a maximum interval of 6 weeks between them. All US examinations were made before performing FNA.
The following cases were excluded from the analysis: (i) nodules that did not have both elastography evaluations within 6 weeks; (ii) mixed lesions with a predominantly cystic structure; (iii) cases that did not have the pathology report at the time of inclusion; (iv) deeply located nodules.
2.2. Conventional Ultrasound
Ultrasound of the neck in B-mode (2B) was performed using Hitachi Preirus equipment (Hitachi Medical Corporation, Tokyo, Japan) with a multifrequency Hitachi L64 (5–18 MHz) linear probe, and on a SuperSonic Mach 30 machine (SuperSonic Imagine, France) with a high-resolution linear US probe of 5–18 MHz (L 18-5), by an examiner experienced in this technique (D.S.) [20]. The examination was performed with the patient in the supine position, with hyperextension of the neck, and with the application of a generous amount of coupling gel, evaluating both thyroid lobes and the isthmus morphology.
In all nodules, a comprehensive, uniform characterization of their US appearance was made before the elastographic evaluation on the same US machine (Hitachi Preirus). The following US features of each nodule were noted for each nodule: maximum dimension (cm), volume (mL), shape (taller-than-wide/wider-than-tall), composition (solid or mixed), echogenicity (iso-, hyper-, hypo-/markedly hypoechoic), homogeneity, margins (regular, irregular/blurred), thyroid capsule integrity, and the presence of calcifications (micro- or macro-, rim or absent calcifications). High-risk ultrasound features in the B-mode evaluation were considered to be: a solid pattern, marked intranodular hypoechogenicity, inhomogeneity, a taller-than-wide shape, irregular margins, capsule rupture, the presence of scattered/intranodular microcalcifications [4,25] and the presence of lymph nodes with a round shape and alteration of the hilum position/aspect [1,11,26,27,28].
All nodules were classified into three categories of risk, given by the presence of high-risk features in 2B, according to the European TIRADS (EU-TIRADS) [12]: low risk = solid, isoechoic, or hyperechoic nodule, with no other features of risk (EU-TIRADS 2 and 3); intermediate risk (EU-TIRADS 4) = solid, mildly hypoechoic lesion, without microcalcifications, irregular borders or a taller-than-wide shape; high risk (EU-TIRADS 5) = solid hypoechoic nodule, with a minimum of one very-high-risk feature, such as irregular margins, a taller-than-wide shape, extrathyroidal extension, or microcalcifications.
The percentage of the change in volume was noted in cases with a previous US evaluation. Color Doppler was used to describe the vascular pattern: predominantly perinodular, intranodular or mixed, but the parameter was not included in the risk assessment strategy [4,29]. The characteristics in the color Doppler assessment were not considered in our risk-estimation strategy. When more than one nodule was described in the same patient, the ones with the highest risk according to standard US and/or elastography features and that generated the final diagnostic, were included in the final analysis.
2.3. 2D-SWE
The 2D-SWE examination followed the conventional US evaluation, performed on a SuperSonic Mach 30 machine (SuperSonic Imagine, Aix-en-Provence, France) using a high-resolution linear 5–18 MHz US probe. The evaluation was performed by the same operator experienced in SWE imaging. This machine uses an innovative technique based on ultrasonic focused beams that interfere along a Mach cone. With the ultrafast technology, a supersonic source is generated and the resulting SW propagation is displayed at 5000 frames per second.
For the image acquisition, the box was adjusted to include the entire lesion. To acquire a stable, reliable elastogram, the examiner held the probe still for about 5 s and avoided applying external pressure. The machine does not provide a quality measure, so an experimented operator should perform the evaluation and avoid obtaining images with obvious compression artifacts such as “finger-like” artifacts or images with a completely red image (corresponding to high stiffness) [30]. Images lacking an SWE signal were also considered inadequate. The ROI was placed in the stiffest part of the nodule. The evaluation was uniform, and 5 values were registered for each lesion in longitudinal scans. The mean of the 5 measurements was considered in the analysis of the Max and Mean elasticity index (EI), measured in kPa. The QBox ratio was determined by comparing two ROIs, one in the stiffest displayed zone (without including obvious artifacts or calcifications inside the ROI) and one in the adjacent thyroid parenchyma or surrounding muscle, both placed at approximately the same depth, as shown in Figure 1. The diameter of the ROIs was set between 2–4 mm. Increased stiffness, documented by SWE evaluation, was considered as a high-risk parameter [18,20,31,32,33].
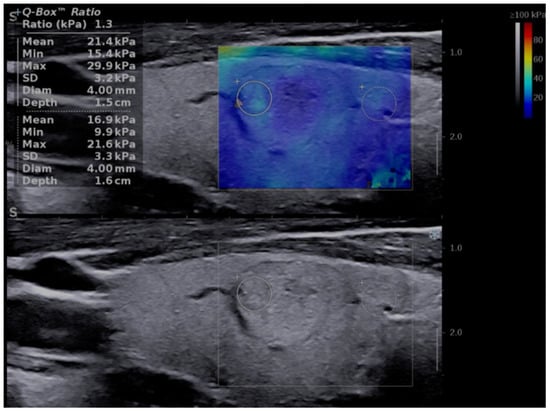
Figure 1.
Transverse US scan displaying a soft thyroid nodule in the two-dimensional shear-wave elastography (2D-SWE) evaluation, first image (up): Mean elasticity index (EI) = 21.4 kPa, nodule-to-parenchyma QBox ratio = 1.3; and in the greyscale (2B) evaluation, second image (down): low-risk, isoechoic solid nodule, with a thin halo, well-defined borders, and no features of high risk.
2.4. Strain Elastography
Similar to the previous US evaluations, SE was performed by the same operator who is experienced in strain elastography imaging, using the real-time elastography (RTE) on the Hitachi equipment detailed above [34].
A slight, repetitive, external compression–decompression movement was applied to the transducer; the machine displays a graph showing the real-time compression, which should be between −0.5 and 0.5 in order to obtain valid images without compression artifacts.
Firstly, the qualitative assessment was made based on the color map (red—soft tissue, green—intermediate stiffness and blue—hard nodules). The images were translated into a 1–4 score using the Asteria criteria, where 1 represents an entirely soft lesion; 2 represents a lesion that is mostly soft, with only a few spots of increased stiffness; 3 represents a lesion that is mostly stiff but with some soft spots; and 4, an entirely stiff one [35]. Nodules in categories 3 and 4 were considered as high risk [29].
Additionally, an objective, semiquantitative evaluation providing a numeric value was also performed: the strain ratio, which shows the ratio between two ROIs that are located at similar depths, is called the parenchyma-to-nodule ratio, as exemplified in Figure 2. Longitudinal sections are preferred in order to obtain an image displaying enough surrounding healthy thyroid tissue [36]; in order to obtain longitudinal views, the probe is held parallel to the trachea to include the maximum length of the nodule in focus. In cases with associated autoimmune disease, when the elasticity of the surrounding parenchyma might be increased [37], the semiquantitative ratio was not considered in the final analysis.
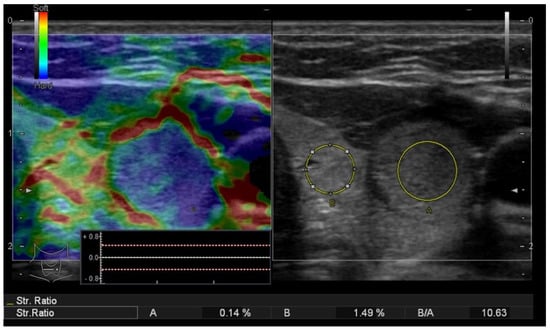
Figure 2.
Strain elastography (left) evaluation displaying a colormap overlaid on the greyscale image, Asteria score 4 (completely stiff/color blue); the nodule-to-parenchyma strain ratio (region of interest A covering the nodule and region of interest B in the healthy, adjacent thyroid parenchyma) displaying an increased value = 10.63 and the conventional ultrasound image (right) of a solid thyroid nodule.
We did not select a previously established cut-off value for the SR predicting malignant lesions, with the intention of determining the appropriate one in this study group.
An upgrade in the US risk of malignancy was made for cases with increased stiffness in both of the two elastography evaluations. No downgrade of the risk was considered when low stiffness was observed.
2.5. FNA Surgical Intervention and Pathology Examination
According to classic US criteria for the stratification of the malignancy risk [4,25], suspicious nodules that met the size criteria were addressed with FNA. Cytology results were reported in accordance with the Bethesda system. FNA was repeated in Bethesda category I; category II results were referred to surgery only in the case of compression, functional autonomy or the patient opted for surgical management due to visible goiter; whereas categories III-VI were directed to surgery. The pathological evaluation of the surgical specimen described the histological subtypes as categorized by the World Health Organization. In the cases that were treated surgically, the pathology report was transmitted to our unit and considered in the analysis. In cases where the pathology report was not received by our unit during the time of inclusion, the patient was excluded from the analysis. The same cytologist that evaluated all the FNA cases was blinded to the US results. The pathologists who evaluated the cases were blinded to the US and FNA results. The results of the US and US elastography examinations were compared to the pathology results.
2.6. Statistical Analysis
The collected data were analyzed using MedCalc Software, version 12.5.0.0 (MedCalc, Ostend, Belgium). In order to examine the distribution of the variables, the Kolmogorov–Smirnov test was performed. Numerical variables that presented a normal distribution were reported as mean values and standard deviations or median and range intervals, whereas variables that presented a non-normal distribution were presented as median and range intervals. Student’s t-test for comparing variables with a normal distribution and the Mann–Whitney test (U) was employed when normality was rejected. The Kruskal–Wallis test was used to detect statistically significant differences between groups of an independent variable. The area under the curve (AUC) was computed and the optimal cut-off values were determined using receiver operating characteristic (ROC) statistics and the Youden J index criterion. The AUC was determined in order to establish the diagnostic accuracy of conventional US and SWE US elastography (for Max, Min and Mean EI values and for the QBox ratio). The sensitivity, specificity, PPV, NPV and accuracy of diagnosis were determined for each test. For all the statistical testing, a p-value below 0.05 was established to indicate statistical significance.
3. Results
Based on the presented exclusion criteria, 94 nodules (90 patients) were considered in the final analysis, all of which had pathology reports. In patients with s multinodular goiter, only the highest-risk nodules, with a performed FNA, were included in the final analysis. The patients were mostly females (80/90), with the mean age of 47.6 ± 12.9 years. A high level of thyroid peroxidase antibodies (TPOAbs) or thyroglobulin antibodies (TgAbs) was found in 19 cases (20.2%).
The main characteristics of the group are displayed in Table 1.

Table 1.
Main characteristics of the study group.
Out of the 94 focal lesions, 29 proved to be malignant. The distribution of cancers is detailed in Table 2. All malignancies in our study group were differentiated variants. Most of the malignancies (96.8%) were forms of papillary thyroid carcinoma (PTC). The single borderline case (NIFTP) was also included in the malignancy group.
Table 2.
Distribution of malignancies in the analyzed group.
From the 65 benign lesions, 38 (58.5%) were nodular hyperplasia, 13 (20%) were follicular adenomas, 4 (6.2%) were Hurthle cell adenoma, 9 (13.8%) were lymphocytic thyroiditis and 1 (1.5%) was Riedel thyroiditis.
All thyroid focal lesions were, firstly, evaluated by means of grayscale US. The median size of the nodules was 1.9 cm (range interval 0.8–6.4 cm), with only three subcentimetric lesions. Most of the nodules were completely or almost completely solid (81.9%). The grayscale ultrasound characteristics were noted for each nodule and considered in the FNA indication (Table 3).
Table 3.
Ultrasound characteristics of the analyzed thyroid nodules.
We observed the following suspect features: moderate hypoechogenicity in 32 cases (34%), marked hypoechogenicity in 5 cases (5.3%), a taller-than-wide shape in 8 cases (8.5%), nonhomogeneity in 48 of the nodules (51%), irregular margins in 18 cases (19.1%), infiltrative margins in 3 cases (3.1%), and microcalcifications in 15 cases (15.9%). We defined 47 low-risk cases, 31 intermediate-risk cases and 16 high-risk cases.
3.1. 2D-SWE in the Evaluation of the Malignancy Risk of Thyroid Nodules
The Mean EI values provided by the US system seem to have the best diagnostic performance (AUC: 0.912, CI: 0.836 to 0.961). We retrospectively obtained a cut-off value of >30.5 kPa that predicts malignancy with a sensitivity of 79.3%, specificity of 95.38%, NPV of 91.2% and PPV of 88.5%. The Max EI is also a good test, with an AUC of 0.877; a value above 40.3 kPa has a sensitivity of 86.2%, but a specificity of 81.5% for detecting thyroid cancer.
The QBox ratio also represents a good parameter, with the AUC of 0.851 and a very good specificity of 92.3% for a cut-off value of 2.8. The data are detailed in Table 4.
Table 4.
The diagnostic performance of 2D-SWE parameters (Mean, Max and QBox ratio) for the presence of thyroid malignancy, using the pathology report as reference.
Figure 3 shows a comparison of the ROC curves for the three SWE above-mentioned parameters.
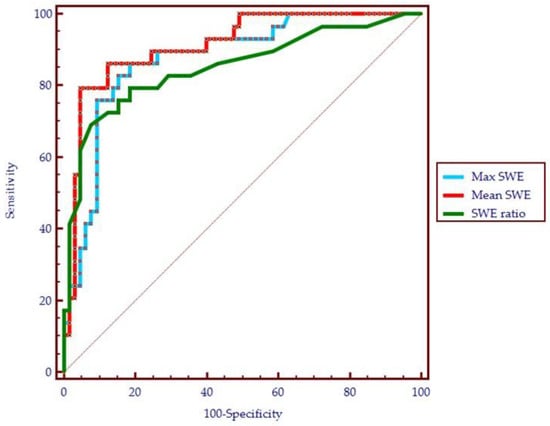
Figure 3.
The performance of shear-wave parameters in the diagnosis of thyroid cancer (receiver operating characteristic curve): the maximum elasticity index (Max SWE), mean elasticity index (Mean SWE) and the QBox ratio (SWE ratio).
An upgrade of the risk category was made in eight cases with increased stiffness, defined as values of Mean EI > 30.5 kPa. Six cases were upgraded from low to intermediate risk and ten cases from intermediate to high risk (see Figure 4).
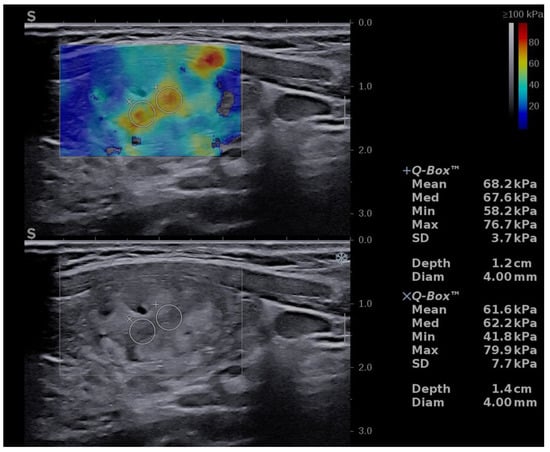
Figure 4.
Risk upgrade from intermediate risk in B-mode to high risk in B-mode + SWE due to increased stiffness (Mean EI = 68.2 kPa). Pathology report confirmed PTC.
3.2. RTE in the Evaluation of the Malignancy Risk of Thyroid Nodules
The RTE or SE parameters also showed a very good diagnostic performance. The quantitative assessment, the strain ratio, had a better performance compared to the qualitative color-code map. A cut-off value of >3.9 predicts the presence of thyroid cancer with a sensitivity of 82.7%, specificity of 92.3%, and AUC = 0.905. The ROC curve parameters for SE are detailed in Table 5 and the ROC curve is displayed below in Figure 5.
Table 5.
The diagnostic performance of SE parameters: Asteria score and strain ratio for the presence of thyroid malignancy, using the pathology report as reference.
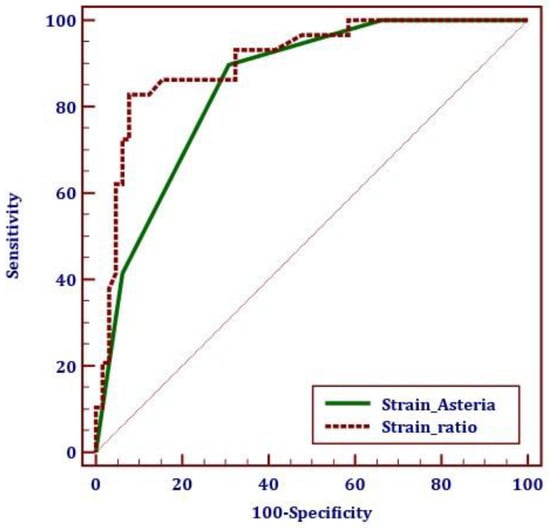
Figure 5.
The performance of SE parameters in the diagnosis of thyroid cancer (receiver operating characteristic curve): the strain ratio and Asteria score/colormap analysis.
A risk upgrade was made in 14 cases with increased stiffness, defined as values of the SR above 3.9: an upgrade of the risk category from low to intermediate was made in 4 cases and medium to high risk in 10 cases (see Figure 6).
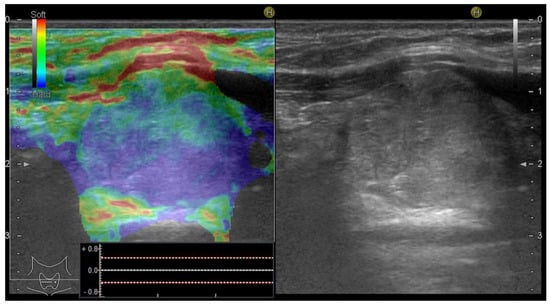
Figure 6.
Risk upgrade from intermediate risk in B-mode to high risk in B-mode + SE due to increased stiffness (Asteria 3). Pathology report confirmed PTC.
3.3. Comparison of Elastography Techniques: SE versus 2D-SWE in Diagnosing Thyroid Nodules
Following the main aim of this research, elastography parameters were compared, as displayed in Table 6 and Figure 7. Significant differences were identified between the median values in all five parameters quantifying tissue elasticity: the mean (Mean EI) and maximum (Max EI) elasticity index, the SWE ratio, the qualitative SE evaluation (Asteria score) and the strain ratio, when comparing malignant versus benign nodules.
Table 6.
Parameters of ultrasound SE and SWE elastography (median values and range interval) in the benign versus malignant thyroid nodules.
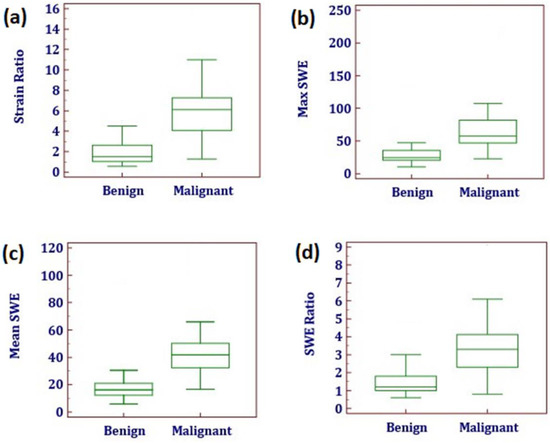
Figure 7.
The distribution (box plot) of elastography parameters in patients with benign vs. malignant histopathology results for strain elastography: (a) strain ratio (Asteria score could not be represented as box plot); for shear-wave elastography: (b) Max elasticity index (Max SWE) measured in kPa; (c) Mean elasticity index (Mean SWE) measured in kPa; (d) QBox ratio (SWE ratio).
The two parameters are comparable in terms of diagnostic accuracy (90.4% for Mean EI versus 89.3% for the strain ratio). In terms of ROC curve statistics, both tests proved to have excellent results (AUC > 0.9). The difference between the ROC curves was not significant (difference between areas, 0.0645; p-value, 0.0952). The specificity and NPV were slightly improved for the Mean EI compared to the strain ratio (95.4% and 91.2% versus 92.3% and 92.3%).
Figure 8 displays the comparison of ROC curves for the two elastography parameters: Mean EI for SWE and strain ratio for SE, for conventional US and for the combination of elastography and B-mode US, respectively.
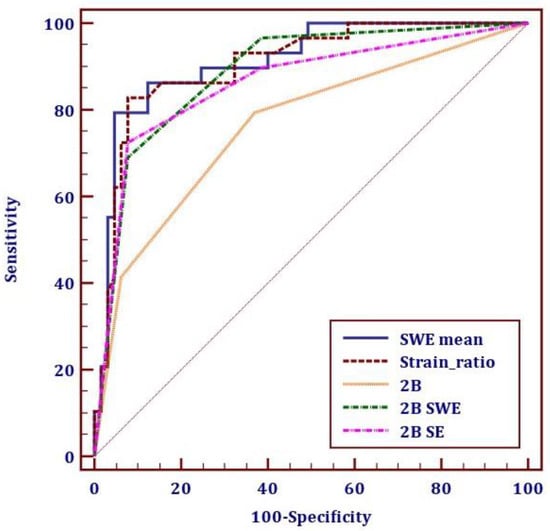
Figure 8.
The receiver operating characteristic curve for the diagnostic performance of thyroid cancer through shear-wave elastography (SWE) with the parameter Mean elasticity index (SWE Mean), strain elastography (SE) with the parameter strain ratio, conventional US (2B), 2B combined with SWE and 2B combined with SE.
The two elastography evaluations were compared using the best-performing parameters for each type of evaluation: the Mean EI value for 2D-SWE and the strain ratio for SE. The two elastography methods were compared to conventional ultrasound, and to the combined B-mode and elastography assessments, as displayed in Table 7.
Table 7.
The performance of strain and 2D shear-wave parameters alone and as additional evaluation for conventional ultrasound (2B), being compared to 2B evaluation alone.
As displayed in Table 8, the vast majority of cancers were stiff, regardless of the elastographic technique that was used. The majority of benign lesions were soft, regardless of the elastography technique that was used for measurements. There was a disagreement between the two evaluations in a total of 13 cases (13.8%).
Table 8.
Concordance of SE (strain ratio) versus 2D-SWE (Mean EI) in the benign and malignant groups.
3.4. False-Negative Results
Five thyroid cancers were found “soft” by the SE evaluation: three cases of PTC and two of microPTCs. Six malignant nodules appeared “soft” in SWE. One PTC and two microPTCs were in agreement with SE; the other three cases—one microPTC and two PTCs—were soft in SE. Thus, the disagreement between the two elastography assessments occurred in four cases of PTC and one of microPTC. Two of the PTCs misdiagnosed by SWE using the Mean EI parameter would have been correctly classified if the Max EI parameter was used.
Figure 9 illustrates the elasticity images of a thyroid nodule with a low risk in 2B that appeared soft in both SE (a) and SWE (b) and was revealed by the pathology report to be a classic variant of a papillary thyroid cancer.
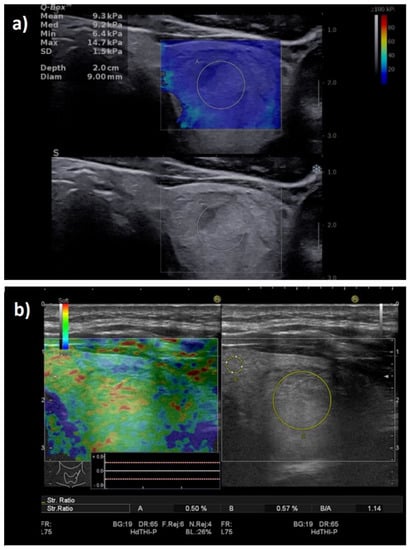
Figure 9.
False-negative elastography result in a multifocal PTC case. Entirely soft nodule in both shear-wave elastography (a): Mean elasticity index = 9.3 kPa; and strain elastography (b): strain ratio = 1.14.
3.5. False-Positive Results
Four benign lesions were hard according to the SWE evaluation and were included in the high-risk category. One of them was also stiff in SE, corresponding to a case of Riedel thyroiditis that was misinterpreted as a high-risk focal lesion (see Figure 10); the false positives in SWE were two follicular adenomas.
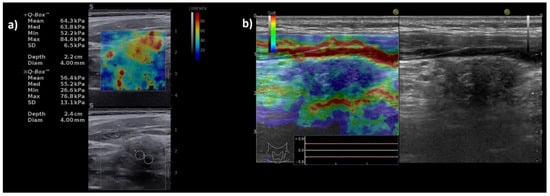
Figure 10.
Illustration of false-positive elastography results in a case with Riedel thyroiditis. Appearance of hypoechoic thyroid nodule, with increased stiffness both in (a) shear-wave elastography: Mean elasticity index = 64.3 kPa; and in (b) strain elastography: entirely stiff nodule (entirely blue), Asteria score of 4 and strain ratio = 5.5.
Six benign lesions presented increased stiffness in SE. One case, the above-mentioned Riedel thyroiditis, was in agreement with SWE; the other five cases (four follicular adenomas and one nodule in lymphocytic thyroiditis) were “soft” in the SWE examination.
4. Discussion
SE has been extensively studied in the evaluation of thyroid nodules with excellent results [21,38]. Initially, its role in replacing grayscale US was discussed, given its high diagnostic quality, but studies rapidly established its role, rather, as an additional beneficial tool, given that conventional US needs to remain the basis of evaluation [39].
The more recently developed shear-wave imaging techniques recorded over the years promising results in the assessment of the stiffness of the liver [40,41], kidney [42], spleen [43], and breast lesions [44,45], but also for the evaluation of thyroid nodules [22,24]. The techniques are constantly developing, with slightly different results varying based on the equipment and the methods that were used.
Most of the literature data provide a comparison between SE and SWE in different populations. This study intended to evaluate the diagnostic potential of the two methods and detect any significant differences between the two types of evaluation by providing a consecutive evaluation of both methods in the same population.
One meta-analysis that aimed to compare the SE and SWE evaluations, including 80 trials with a total of 16,624 subjects, revealed superior diagnostic quality for SE compared to SWE in differentiating malignant and benign thyroid nodules [46], but it did not include any comparison of the methods in the same group. An important side note is the substantial share of SE studies that were included compared to the number of studies on SWE, and the lack of uniformity in the US evaluation and SWE techniques. The meta-analysis did conclude that the techniques hold a similar diagnostic performance, which is slightly better for SE. A few small studies were recently conducted with the aim of comparing the two methods in the same populations. The results were mostly in favor of SE, although SWE had a comparable value. In one study including 64 nodules, 19 of which were malignant, the qualitative SE evaluation was compared to the Mean EI value. The authors found that for a cut-off value of 38.3 kPa for the Mean EI and for Rago scores ≥ 4 for the SE colormap, cancer is predicted with a sensitivity of 86.7% versus 84.4%, a specificity of 68.4% versus 79.0% and am accuracy of 81.3% versus 78.1% [47]. Another study on 185 patients compared stratification models including conventional US, SE and SWE. They concluded that SE and SWE proved to have a comparable diagnostic performance when compared in the same group and found no superiority for SE [48]. It is worth mentioning that the measurements were made on different devices.
Our findings are encouraging for both techniques. The results of the two elastography assessments were very similar, but not completely superposable. Although SWE tested slightly better, the differences were not statistically significant in terms of the AUC of 0.912 for the Mean EI and 0.905 for SR (p = 0.0952). In the case of SE, the value provided by the nodule-to-parenchyma or nodule-to-muscle SR proved to be a better predictor than the qualitative assessment, exhibiting the only numerical, quantitative assessment for SE. The cut-off value was established to be 3.9, similar to the previous one found in our center [35].
For the 2D-SWE evaluation, the Mean EI value was the preferred parameter. It outperformed the Max EI and QBox ratio, though all three obtained very good results. This demonstrates the superiority of a quantitative measurement of the stiffest zone in the nodule to that of a ratio. For the Mean EI, we selected a cut-off value of >30.5 kPa which predicts malignancy with a sensitivity of 79.3% and specificity of 95.38% compared to the Max EI, which showed a sensitivity of 86.2% and a specificity of 81.5% for a cut-off value of 40.3 kPa. The QBox ratio anticipated malignancy with a sensitivity of 68.9% and a specificity of 92.3% for a cut-off value of 2.8.
A wide range of cut-off values was determined by numerous studies, with the numbers varying broadly with the equipment that was used. Other studies performed with the same technique (2D-SWE, on Aixplorer machines by SuperSonic Imagine) found comparable cut-offs for the Mean EI ≥ 27.65 kPa [49], 34.5 kPa [50] and >31.2 kPa [51], with very good diagnostic quality. Given all these similar results, we suggest a rounded cut-off value of 30 kPa that is easier to use in clinical practice. Lower cut-off values for the Mean EI were established in studies that included the entire nodule in the ROI: 23.1 kPa [52]. Some studies previously undervalued the diagnostic value of SWE by showing an important overlap among benign and malignant thyroid nodules [53].
The elastography evaluation of thyroid nodules is not standardized yet, and thus, when comparing two or more studies using the same method, it should be acknowledged that the protocols that were used might slightly differ.
A considerable advantage of SWE refers to its superiority when it comes to the evaluation of nodules that coexist with autoimmune thyroid disease, whereas SE is described to have lower feasibility in this setting [39,46]. As thyroid cancers are monoclonal proliferations, finding an area with a higher risk of malignancy inside the nodule was not our goal. The aim is to find the lesions with increased stiffness which are entirely high risk, although the measurements are made from the region with the highest stiffness (excluding artifacts).
The experience of the operator is essential, particularly in the case of strain elastography. SWE usually shows better reproducibility. Nevertheless, some factors such as external compression on the transducer may interfere with the measurements. The most common type of error regarding SWE evaluation refers to operator-dependent artifacts. Accordingly, although SWE is perceived as a technique that is easier to learn, both elastography techniques should invariably be performed by trained, experienced examiners [54]. Our team described that the nodules in the proximity of the trachea, particularly located on the isthmus, may be associated with more artifacts on the SWE evaluation. For this location, SE seems to perform better. Thus, conducting another head-to-head evaluation quantifying this issue would be of interest.
The strength of this study regards the comparison of the two main elastography techniques in the same population, using high-end ultrasound equipment. Our findings showed strong agreement between the SE and 2D-SWE evaluation. Both techniques generated both false-negative and false-positive results. There was discordance between the two elastography assessments in a total of 13 cases.
The Mean EI and strain ratio had a very good diagnostic performance individually, but also acted as an additional parameter to the B-mode evaluation. The excellent results of both elastography methods support their use in everyday clinical practice if the techniques are available; however, their use is not meant to replace, but complete the conventional US evaluation.
A considerable limitation of this study was that most of the malignant nodules were PTCs; thus, the differences in SWE parameters between different thyroid malignancies could not be estimated. We intend to continue the present study on a larger group that will hopefully include a wider histopathological variation of tumors and which will also allow for a more accurate evaluation of the microcarcinoma as a separate entity.
The promising results of our study underline the importance of an experienced examiner. Our findings do not reinforce the routine use of both methods in evaluating the same patient, but rather the selection of the method that the examiner is most skilled at, in order to increase the reliability of the examination.
5. Conclusions
The present study assessed the performance of two different US elastography techniques. SE and 2D-SWE, in the same population using high-end US machines. By providing a head-to-head evaluation of the two methods, our study confirms that they both have excellent diagnostic quality with similar overall results. For 2D-SWE, the best parameter in our study was the Mean EI value, with a cut-off value of 30.5 kPa predicting the risk of malignancy with a sensitivity of 79.3% and specificity of 95.38%. For the SE evaluation, the best performing parameter was the strain ratio, with very similar results. Previously, SE was considered to have certain advantages in superficial tissues such as breast and thyroid, but performant SWE techniques, such as the one provided by the Supersonic machine, seem to have a similar performance with excellent diagnostic quality in predicting thyroid cancer. Both techniques improve the diagnostic confidence of thyroid US imaging, providing an accurate selection of the nodules that are at a higher risk of malignancy.
Author Contributions
Conceptualization, D.S., A.B. and I.S.; methodology, D.S. and L.T.; software, A.B. and L.T.; validation, I.S. and D.S.; formal analysis, A.B. and M.D.; investigation, A.B. and D.S.; resources, D.S. and M.D.; data curation, A.B. and A.P.; writing—original draft preparation, A.B.; writing—review and editing, D.S. and L.T.; visualization, M.D. and A.P.; supervision, D.S.; project administration, A.B. and D.S. All authors have read and agreed to the published version of the manuscript.
Funding
This research received no external funding.
Institutional Review Board Statement
The study was conducted according to the guidelines of the Declaration of Helsinki and approved by the Local Ethics Committee of the County Emergency Hospital “Pius Brinzeu” Timisoara (nr. 235/2021).
Informed Consent Statement
Informed consent was obtained from all subjects involved in the study.
Conflicts of Interest
The authors declare no conflict of interest.
References
- Popoveniuc, G.; Jonklaas, J. Thyroid nodules. Med. Clin. N. Am. 2012, 96, 329–349. [Google Scholar] [CrossRef]
- Krejbjerg, A.; Bjergved, L.; Pedersen, I.B.; Knudsen, N.; Jørgensen, T.; Perrild, H.; Ovesen, L.; Rasmussen, L.B.; Laurberg, P. Thyroid Nodules in an 11-Year DanThyr Follow-Up Study. J. Clin. Endocrinol. Metab. 2014, 99, 4749–4757. [Google Scholar] [CrossRef] [PubMed][Green Version]
- Hegedüs, L. Clinical practice. The thyroid nodule. N. Engl. J. Med. 2004, 351, 1764–1771. [Google Scholar] [CrossRef]
- Haugen, B.R.; Alexander, E.K.; Bible, K.C.; Doherty, G.M.; Mandel, S.J.; Nikiforov, Y.E.; Pacini, F.; Randolph, G.W.; Sawka, A.M.; Schlumberger, M.; et al. 2015 American Thyroid Association Management Guidelines for Adult Patients with Thyroid Nodules and Differentiated Thyroid Cancer: The American Thyroid Association Guidelines Task Force on Thyroid Nodules and Differentiated Thyroid Cancer. Thyroid 2016, 26, 1–133. [Google Scholar] [CrossRef] [PubMed]
- Davies, L.; Welch, H.G. Current Thyroid Cancer Trends in the United States. JAMA Otolaryngol. Head Neck Surg. 2014, 140, 317–322. [Google Scholar] [CrossRef] [PubMed]
- Sahli, Z.T.; Smith, P.W.; Umbricht, C.B.; Zeiger, M.A. Preoperative Molecular Markers in Thyroid Nodules. Front. Endocrinol. 2018, 9, 179. [Google Scholar] [CrossRef]
- Nylén, C.; Mechera, R.; Maréchal-Ross, I.; Tsang, V.; Chou, A.; Gill, A.J.; Clifton-Bligh, R.J.; Robinson, B.G.; Sywak, M.S.; Sidhu, S.B.; et al. Molecular Markers Guiding Thyroid Cancer Management. Cancers 2020, 12, 2164. [Google Scholar] [CrossRef]
- Gharib, H.; Papini, E.; Paschke, R.; Duick, D.S.; Valcavi, R.; Hegedüs, L.; Vitti, P. American Association of Clinical Endocrinologists, Associazione Medici Endocrinologi, and European Thyroid Association medical guidelines for clinical practice for the diagnosis and management of thyroid nodules. J. Endocrinol. Investig. 2010, 33, 287–291. [Google Scholar] [CrossRef]
- Gharib, H.; Papini, E.; Garber, J.R.; Duick, D.S.; Harrell, R.M.; Hegedus, L.; Paschke, R.; Valcavi, R.; Vitti, P. American association of Clinical Endocrinologists, American college of endocrinology, and Associazione Medici Endocrinologi medical guidelines for clinical practice for the diagnosis and management of thyroid nodules—2016 update. Endocr. Pract. 2016, 22, 1–60. Available online: www.aace.com/reprints (accessed on 10 April 2021). [CrossRef]
- Garber, J.R.; Papini, E.; Frasoldati, A.; Lupo, M.A.; Harrell, R.M.; Parangi, S.; Patkar, V.; Baloch, Z.W.; Pessah-Pollack, R.; Hegedus, L.; et al. American Association of Clinical Endocrinology And Associazione Medici Endocrinologi Thyroid Nodule Algorithmic Tool. Endocr. Pract. 2021, 27, 649–660. [Google Scholar] [CrossRef]
- Yi, K.H. The Revised 2016 Korean Thyroid Association Guidelines for Thyroid Nodules and Cancers: Differences from the 2015 American Thyroid Association Guidelines. Endocrinol. Metab. 2016, 31, 373–378. [Google Scholar] [CrossRef] [PubMed]
- Russ, G.; Bonnema, S.J.; Erdogan, M.F.; Durante, C.; Ngu, R.; Leenhardt, L. European Thyroid Association Guidelines for Ultrasound Malignancy Risk Stratification of Thyroid Nodules in Adults: The EU-TIRADS. Eur. Thyroid J. 2017, 6, 225–237. [Google Scholar] [CrossRef] [PubMed]
- Horvath, E.; Majlis, S.; Rossi, R.; Franco, C.; Niedmann, J.P.; Castro, A.; Dominguez, M. An Ultrasonogram Reporting System for Thyroid Nodules Stratifying Cancer Risk for Clinical Management. J. Clin. Endocrinol. Metab. 2009, 94, 1748–1751. [Google Scholar] [CrossRef] [PubMed]
- Pellegriti, G.; Frasca, F.; Regalbuto, C.; Squatrito, S.; Vigneri, R. Worldwide Increasing Incidence of Thyroid Cancer: Update on Epidemiology and Risk Factors. J. Cancer Epidemiol. 2013, 2013, 965212. [Google Scholar] [CrossRef]
- Gao, L.; Parker, K.; Lerner, R.; Levinson, S. Imaging of the elastic properties of tissue—A review. Ultrasound Med. Biol. 1996, 22, 959–977. [Google Scholar] [CrossRef]
- Dioguardi Burgio, M.; Grégory, J.; Ronot, M.; Sartoris, R.; Chatellier, G.; Vilgrain, V. 2D-shear wave elastography: Number of acquisitions can be reduced according to clinical setting. Insights Imaging 2021, 12, 145. [Google Scholar] [CrossRef]
- Popa, A.; Bende, F.; Șirli, R.; Popescu, A.; Bâldea, V.; Lupușoru, R.; Cotrău, R.; Fofiu, R.; Foncea, C.; Sporea, I. Quantification of Liver Fibrosis, Steatosis, and Viscosity Using Multiparametric Ultrasound in Patients with Non-Alcoholic Liver Disease: A “Real-Life” Cohort Study. Diagnostics 2021, 11, 783. [Google Scholar] [CrossRef]
- Cosgrove, D.; Barr, R.; Bojunga, J.; Cantisani, V.; Chammas, M.C.; Dighe, M.; Vinayak, S.; Xu, J.-M.; Dietrich, C.F. WFUMB Guidelines and Recommendations on the Clinical Use of Ultrasound Elastography: Part 4. Thyroid. Ultrasound Med. Biol. 2017, 43, 4–26. [Google Scholar] [CrossRef]
- Cantisani, V.; D’Andrea, V.; Biancari, F.; Medvedyeva, O.; Di Segni, M.; Olive, M.; Patrizi, G.; Redler, A.; Enrico De Antoni, E.; Masciangelo, R.; et al. Prospective evaluation of multiparametric ultrasound and quantitative elastosonography in the differential diagnosis of benign and malignant thyroid nodules: Preliminary experience. Eur. J. Radiol. 2012, 81, 2678–2683. [Google Scholar] [CrossRef]
- Stoian, D.; Cornianu, M.; Dobrescu, A.; Lazăr, F. Nodular thyroid cancer. Diagnostic value of real time elastography. Chirurgia 2012, 107, 39–46. [Google Scholar]
- Bojunga, J.; Herrmann, E.; Meyer, G.; Weber, S.; Zeuzem, S.; Friedrich-Rust, M. Real-Time Elastography for the Differentiation of Benign and Malignant Thyroid Nodules: A Meta-Analysis. Thyroid 2010, 20, 1145–1150. [Google Scholar] [CrossRef] [PubMed]
- Lin, P.; Chen, M.; Liu, B.; Wang, S.; Li, X. Diagnostic performance of shear wave elastography in the identification of malignant thyroid nodules: A meta-analysis. Eur. Radiol. 2014, 24, 2729–2738. [Google Scholar] [CrossRef] [PubMed]
- Samir, A.E.; Dhyani, M.; Anvari, A.; Prescott, J.; Halpern, E.F.; Faquin, W.C.; Stephen, A. Shear-Wave Elastography for the Preoperative Risk Stratification of Follicular-patterned Lesions of the Thyroid: Diagnostic Accuracy and Optimal Measurement Plane. Radiology 2015, 277, 565–573. [Google Scholar] [CrossRef] [PubMed]
- Bojunga, J.; Dauth, N.; Berner, C.; Meyer, G.; Holzer, K.; Voelkl, L.; Herrmann, E.; Schroeter, H.; Zeuzem, S.; Friedrich-Rust, M. Acoustic Radiation Force Impulse Imaging for Differentiation of Thyroid Nodules. PLoS ONE 2012, 7, e42735. [Google Scholar] [CrossRef] [PubMed]
- Russ, G.; Royer, B.; Bigorgne, C.; Rouxel, A.; Bienvenu-Perrard, M.; Leenhardt, L. Prospective evaluation of thyroid imaging reporting and data system on 4550 nodules with and without elastography. Eur. J. Endocrinol. 2013, 168, 649–655. [Google Scholar] [CrossRef]
- Giovanella, L.; Treglia, G.; Trimboli, P. Thyroid Imaging. Encyclopedia of Endocrine Diseases. pp. 545–564. Available online: https://www.sciencedirect.com/science/article/pii/B9780128012383652327?via%3Dihub (accessed on 26 March 2020).
- Rago, T.; Vitti, P. Role of thyroid ultrasound in the diagnostic evaluation of thyroid nodules. Best Pract. Res. Clin. Endocrinol. Metab. 2008, 22, 913–928. [Google Scholar] [CrossRef]
- Zhang, J.-Z.; Hu, B. Sonographic Features of Thyroid Follicular Carcinoma in Comparison with Thyroid Follicular Adenoma. J. Ultrasound Med. 2014, 33, 221–227. [Google Scholar] [CrossRef]
- Borlea, A.; Borcan, F.; Sporea, I.; Dehelean, C.; Negrea, R.; Cotoi, L.; Stoian, D. TI-RADS Diagnostic Performance: Which Algorithm Is Superior and How Elastography and 4D Vascularity Improve the Malignancy Risk Assessment. Diagnostics 2020, 10, 180. [Google Scholar] [CrossRef]
- Dighe, M.; Hippe, D.S.; Thiel, J.; Med, U.; Author, B. Artifacts in Shear-wave elastography images of thyroid nodules HHS Public Access Author manuscript. Ultrasound Med. Biol. 2018, 44, 1170–1176. [Google Scholar] [CrossRef]
- Kwak, J.Y.; Kim, E.-K. Ultrasound elastography for thyroid nodules: Recent advances. Ultrasonography 2014, 33, 75–82. [Google Scholar] [CrossRef]
- El-Hariri, M.A.; Ali, T.F.T.; Tawab, M.A.; Magid, A.M.; El-Shiekh, A.-F. The clinical value of ultrasound elastography in predicting malignant thyroid nodules. Egypt. J. Radiol. Nucl. Med. 2014, 45, 353–359. [Google Scholar] [CrossRef]
- Chang, N.; Zhang, X.; Wan, W.; Zhang, C.; Zhang, X. The Preciseness in Diagnosing Thyroid Malignant Nodules Using Shear-Wave Elastography. Med. Sci. Monit. 2018, 24, 671–677. Available online: https://pubmed.ncbi.nlm.nih.gov/29391387 (accessed on 10 April 2021). [CrossRef] [PubMed]
- Stoian, D.; Timar, B.; Derban, M.; Pantea, S.; Varcus, F.; Craina, M.; Craciunescu, M. Thyroid Imaging Reporting and Data System (TI-RADS): The impact of Quantitative Strain Elastography for better stratification of cancer risks. Med. Ultrason. 2015, 17, 327–332. [Google Scholar] [CrossRef] [PubMed]
- Sigrist, R.M.S.; Liau, J.; Kaffas, A.E.; Chammas, M.C.; Willmann, J.K. Ultrasound Elastography: Review of Techniques and Clinical Applications. Theranostics 2017, 7, 1303–1329. [Google Scholar] [CrossRef] [PubMed]
- Aydin, R.; Elmali, M.; Polat, A.V.; Danaci, M.; Akpolat, I. Comparison of muscle-to-nodule and parenchyma-to-nodule strain ratios in the differentiation of benign and malignant thyroid nodules: Which one should we use? Eur. J. Radiol. 2014, 83, e131–e136. [Google Scholar] [CrossRef] [PubMed]
- Cepeha, C.; Paul, C.; Borlea, A.; Borcan, F.; Fofiu, R.; Dehelean, C.; Stoian, D. The Value of Strain Elastography in Predicting Autoimmune Thyroiditis. Diagnostics 2020, 10, 874. [Google Scholar] [CrossRef]
- Lippolis, P.V.; Tognini, S.; Materazzi, G.; Polini, A.; Mancini, R.; Ambrosini, C.E.; Dardano, A.; Basolo, F.; Seccia, M.; Miccoli, P.; et al. Is Elastography Actually Useful in the Presurgical Selection of Thyroid Nodules with Indeterminate Cytology? J. Clin. Endocrinol. Metab. 2011, 96, E1826–E1830. [Google Scholar] [CrossRef]
- Shuzhen, C. Comparison analysis between conventional ultrasonography and ultrasound elastography of thyroid nodules. Eur. J. Radiol. 2012, 81, 1806–1811. [Google Scholar] [CrossRef]
- Herrmann, E.; De Lédinghen, V.; Cassinotto, C.; Chu, W.C.W.; Leung, V.Y.-F.; Ferraioli, G.; Filice, C.; Castera, L.; Vilgrain, V.; Ronot, M.; et al. Assessment of biopsy-proven liver fibrosis by two-dimensional shear wave elastography: An individual patient data-based meta-analysis. Hepatology 2018, 67, 260–272. [Google Scholar] [CrossRef]
- Popa, A.; Șirli, R.; Popescu, A.; Bâldea, V.; Lupușoru, R.; Bende, F.; Cotrău, R.; Sporea, I. Ultrasound-Based Quantification of Fibrosis and Steatosis with a New Software Considering Transient Elastography as Reference in Patients with Chronic Liver Diseases. Ultrasound Med. Biol. 2021, 47, 1692–1703. [Google Scholar] [CrossRef]
- Maralescu, F.-M.; Chiodan, M.; Sircuta, A.; Schiller, A.; Petrica, L.; Bob, F. Are the Currently Available Elastography Methods Useful in the Assessment of Chronic Kidney Disease? A Systematic Review and a Meta-Analysis. Appl. Sci. 2022, 12, 2359. Available online: https://www.mdpi.com/2076-3417/12/5/2359 (accessed on 15 July 2022). [CrossRef]
- Fofiu, R.; Bende, F.; Popescu, A.; Şirli, R.; Lupușoru, R.; Ghiuchici, A.-M.; Sporea, I. Spleen and Liver Stiffness for Predicting High-Risk Varices in Patients with Compensated Liver Cirrhosis. Ultrasound Med. Biol. 2020, 47, 76–83. [Google Scholar] [CrossRef] [PubMed]
- Eremici, I.; Dumitru, C.; Navolan, D.; Craina, M.; Ivan, V.; Borcan, F.; Dehelean, C.A.; Mozos, I.; Stoian, D. Diagnostic Value of Different Risk-Stratification Algorithms in Solid Breast Lesions. Appl. Sci. 2020, 10, 6943. Available online: https://www.mdpi.com/2076-3417/10/19/6943 (accessed on 22 April 2021). [CrossRef]
- Youk, J.H.; Gweon, H.M.; Son, E.J. Shear-wave elastography in breast ultrasonography: The state of the art. Ultrasonography 2017, 36, 300–309. [Google Scholar] [CrossRef]
- Tian, W.; Hao, S.; Gao, B.; Jiang, Y.; Zhang, X.; Zhang, S.; Guo, L.; Yan, J.; Luo, D. Comparing the Diagnostic Accuracy of RTE and SWE in Differentiating Malignant Thyroid Nodules from Benign Ones: A Meta-Analysis. Cell. Physiol. Biochem. 2016, 39, 2451–2463. [Google Scholar] [CrossRef] [PubMed]
- Liu, B.-X.; Xie, X.-Y.; Liang, J.-Y.; Zheng, Y.-L.; Huang, G.-L.; Zhou, L.-Y.; Wang, Z.; Xu, M.; Lu, M.-D. Shear wave elastography versus real-time elastography on evaluation thyroid nodules: A preliminary study. Eur. J. Radiol. 2014, 83, 1135–1143. [Google Scholar] [CrossRef]
- Chen, Y.-S.; Liao, L.-J.; Chen, H.-W.; Hsu, W.-L. Comparison of strain elastography, shear wave elastography, and conventional ultrasound in diagnosing thyroid nodules. J. Med. Ultrasound 2019, 27, 26–32. [Google Scholar] [CrossRef]
- Chen, M.; Zhang, K.-Q.; Xu, Y.-F.; Zhang, S.-M.; Cao, Y.; Sun, W.-Q. Shear wave elastography and contrast-enhanced ultrasonography in the diagnosis of thyroid malignant nodules. Mol. Clin. Oncol. 2016, 5, 724–730. [Google Scholar] [CrossRef]
- Li, X.; Yu, J.; Han, Z.-Y.; Zhai, H.-Y.; Liang, P.; Duan, S.-B. Diagnostic value of two-dimensional shear wave elastography in papillary thyroid microcarcinoma. OncoTargets Ther. 2016, 9, 1311–1317. [Google Scholar] [CrossRef]
- Tabatabaei, S.A.; Farghadani, M.; Barikbin, R.; Shahsanai, A.; Riahinezhad, M.; Jafarpishe, S. Comparing the Sensitivity and Specificity of Two-Dimensional Shear Wave Elastography and Fine Needle Aspiration in Determining Malignant Thyroid Nodules. Adv. Biomed. Res. 2019, 8, 30. [Google Scholar] [CrossRef]
- Baig, F.N.; Liu, S.Y.W.; Lam, H.-C.; Yip, S.-P.; Law, H.K.W.; Ying, M. Shear Wave Elastography Combining with Conventional Grey Scale Ultrasound Improves the Diagnostic Accuracy in Differentiating Benign and Malignant Thyroid Nodules. Appl. Sci. 2017, 7, 1103. [Google Scholar] [CrossRef]
- Swan, K.Z.; Bonnema, S.J.; Jespersen, M.L.; Nielsen, V.E. Reappraisal of shear wave elastography as a diagnostic tool for identifying thyroid carcinoma. Endocr. Connect. 2019, 8, 1195–1205. [Google Scholar] [CrossRef] [PubMed]
- Zhao, C.-K.; Xu, H.-X. Ultrasound elastography of the thyroid: Principles and current status. Ultrasonography 2019, 38, 106–124. Available online: https://pubmed.ncbi.nlm.nih.gov/30690960 (accessed on 16 May 2021). [CrossRef] [PubMed]


Publisher’s Note: MDPI stays neutral with regard to jurisdictional claims in published maps and institutional affiliations. |
© 2022 by the authors. Licensee MDPI, Basel, Switzerland. This article is an open access article distributed under the terms and conditions of the Creative Commons Attribution (CC BY) license (https://creativecommons.org/licenses/by/4.0/).