Systematic Review

Are the Currently Available Elastography Methods Useful in the Assessment of Chronic Kidney Disease? A Systematic Review and a Meta-Analysis

1
Department of Internal Medicine II, Division of Nephrology, “Victor Babeș” University of Medicine and Pharmacy, 300041 Timișoara, Romania
2
Centre for Molecular Research in Nephrology and Vascular Disease, “Victor Babeș” University of Medicine and Pharmacy, 300041 Timișoara, Romania
*
Author to whom correspondence should be addressed.
Appl. Sci. 2022, 12(5), 2359; https://doi.org/10.3390/app12052359
Submission received: 24 January 2022 / Revised: 11 February 2022 / Accepted: 23 February 2022 / Published: 24 February 2022
(This article belongs to the Special Issue Elastography and Applications)

Abstract

:
Background: We require an quantitative imaging technique for the diagnosis and assessment of chronic kidney disease (CKD). Renal elastography has been widely used in recent years in different studies; however, the results across them are not consistent and, as a result, we conducted a meta-analysis of the published literature on this topic. Methods: The databases of PubMed, Medscape, Medline were searched for all studies published in English from 2010 until November 2021 that evaluated kidney shear wave speed (SWS) by elastography in patients with CKD. Trial design, methodological information, patient characteristics, interventions, results, and outcome data were all collected from each study according to a set protocol. Results: We found 37 publications, yet only 18 studies that utilized point shear wave elastography (Virtual Touch Quantification—VTQ system) were compared because the values achieved using different types of elastography are not evaluable. Finally, 1995 attendees (1241 patients with CKD versus 781 healthy subjects as the control group) were included. When comparing mean values of kidney SWS between studies we found increased heterogeneity Q = 513.133; DF = 10; p < 0001, I2 (inconsistency) = 98.12% (95% CI for I2 97.52–98.57%). With a standardized mean difference of −0.216, patients with CKD have a lower kidney SWS than healthy controls. A positive association between kidney SWS and eGFR was also discovered across the presented studies, with a pooled correlation coefficient of 0.38 (Z = 10.3, p < 0.001), Q = 73.3, DF = 5, p < 000.1, I2 = 93.18% (95% CI for I2 87.86 to 96.18). The pooled area under the ROC curve for kidney SWS to predict chronic kidney disease was 0.831 (95% CI, p < 0.001), Q = 28.32, DF = 6, p = 0.0001, I2 = 78.8% (95% CI for I2 56.37 to 89.72). In the four articles that used the Elast-PQ method, the data presented were insufficient for statistical analysis: area under the curve (AUC) values are used to compare distinct characteristics (differentiating kidney SWS between mildly and moderately impaired kidneys, between non-diabetic/prediabetic/diabetic patients, or kidney SWS between the CKD and control group), therefore not being suitable for further evaluation. Conclusions: The results show that patients with CKD have a lower kidney SWS than healthy controls. However, the number of studies involving renal elastography that have been published is limited and show an increased heterogeneity. Further research is needed to determine which factors actually influence kidney SWS in CKD patients and, as a result, to specify the role and indication of renal elastography in clinical practice.

1. Introduction

Chronic kidney disease (CKD) is becoming more prevalent, and its progression is linked to increased morbidity, mortality, and healthcare costs. [1] As a consequence, it is essential to diagnose CKD earlier and accurately measure the disease’s progression using several markers (biomarkers, histology, imaging). The kidneys are evaluated using conventional ultrasound; however, this method only gives us a few pieces of quantifiable information regarding the renal size and parenchyma thickness, which both decrease as CKD develops. Ultrasound additionally provides us with some non-quantifiable evidence on the echogenicity of the renal cortex, which increases when fibrosis advances in the later stages of CKD when the kidneys stiffen. However, the diagnostic value of the use of conventional ultrasound in the assessment of chronic kidney disease is limited [2]. The diagnostic accuracy of conventional ultrasound remains low even after quantifying renal parenchyma echogenicity by using a software that assesses the mean pixel density [3].
Elastography as a technique for measuring the elasticity of biological tissues was first proposed in 1991 by Ophir [4]. Elasticity is a feature of a tissue that allows it to deform after an initial load and then return to its original shape.
Ultrasound elasticity imaging technology has been widely used in the differential diagnosis of benign and malignant superficial organs, such as the breast and thyroid [5], or liver fibrosis and cirrhosis [6].
In recent years, elastography has started to be used as a non-invasive approach for the assessment of diffuse kidney disorders, the main purpose being the diagnosis and the assessment of the progression of chronic kidney disease. The importance of using this method could be the potential detection of renal damage in the early stages of chronic kidney disease when, due to the strong compensatory capacity of the kidney, the results of multiple renal indicators, such as glomerular filtration rate and urinary albumin/ creatinine ratio, can still be in the normal range if the kidney damage is not serious [7].
Transient elastography (TE), point shear-wave elastography (p-SWE), and two-dimensional shear wave elastography (2D-SWE) are the three types of ultrasound-based elastography. Because TE is known to be inadequate for evaluating kidney stiffness (KS), published studies focused on p-SWE and 2D-SWE, both methods based on acoustic radiation force impulse (ARFI).
In ARFI-based elastography, a transducer similar to the one integrated into an ultrasound machine is used to generate shear waves inside the organ that propagate through the soft tissue. The speed of these shear waves (SWS) is progressively reduced, and this is corresponding to tissue stiffness. The obtained result is either an average value inside a region of interest (pSWE) or a color-coded map, inside which the measurement can be performed (2D-SWE) [8].
It is necessary to understand what influences the obtained results to establish a role for renal elastography in clinical practice. Across different studies, different factors, such as age, gender, measurement depth, and urine pressure, have been mentioned to influence the renal shear wave speed measured using different elastography methods [9]. The relationship between renal function, fibrosis, and renal stiffness assessed through different elastographic methods does not show consistency across the different studies. Not all studies showed an increase in renal stiffness in more advanced renal disease. Changes in renal blood flow appear to influence renal elastography, and a decrease in renal blood could be the reason for the decrease in shear wave speed, as well as having a greater impact on elastography than renal fibrosis [10].
We performed a meta-analysis in order to compare different results obtained using elastography in the assessment of chronic kidney disease.

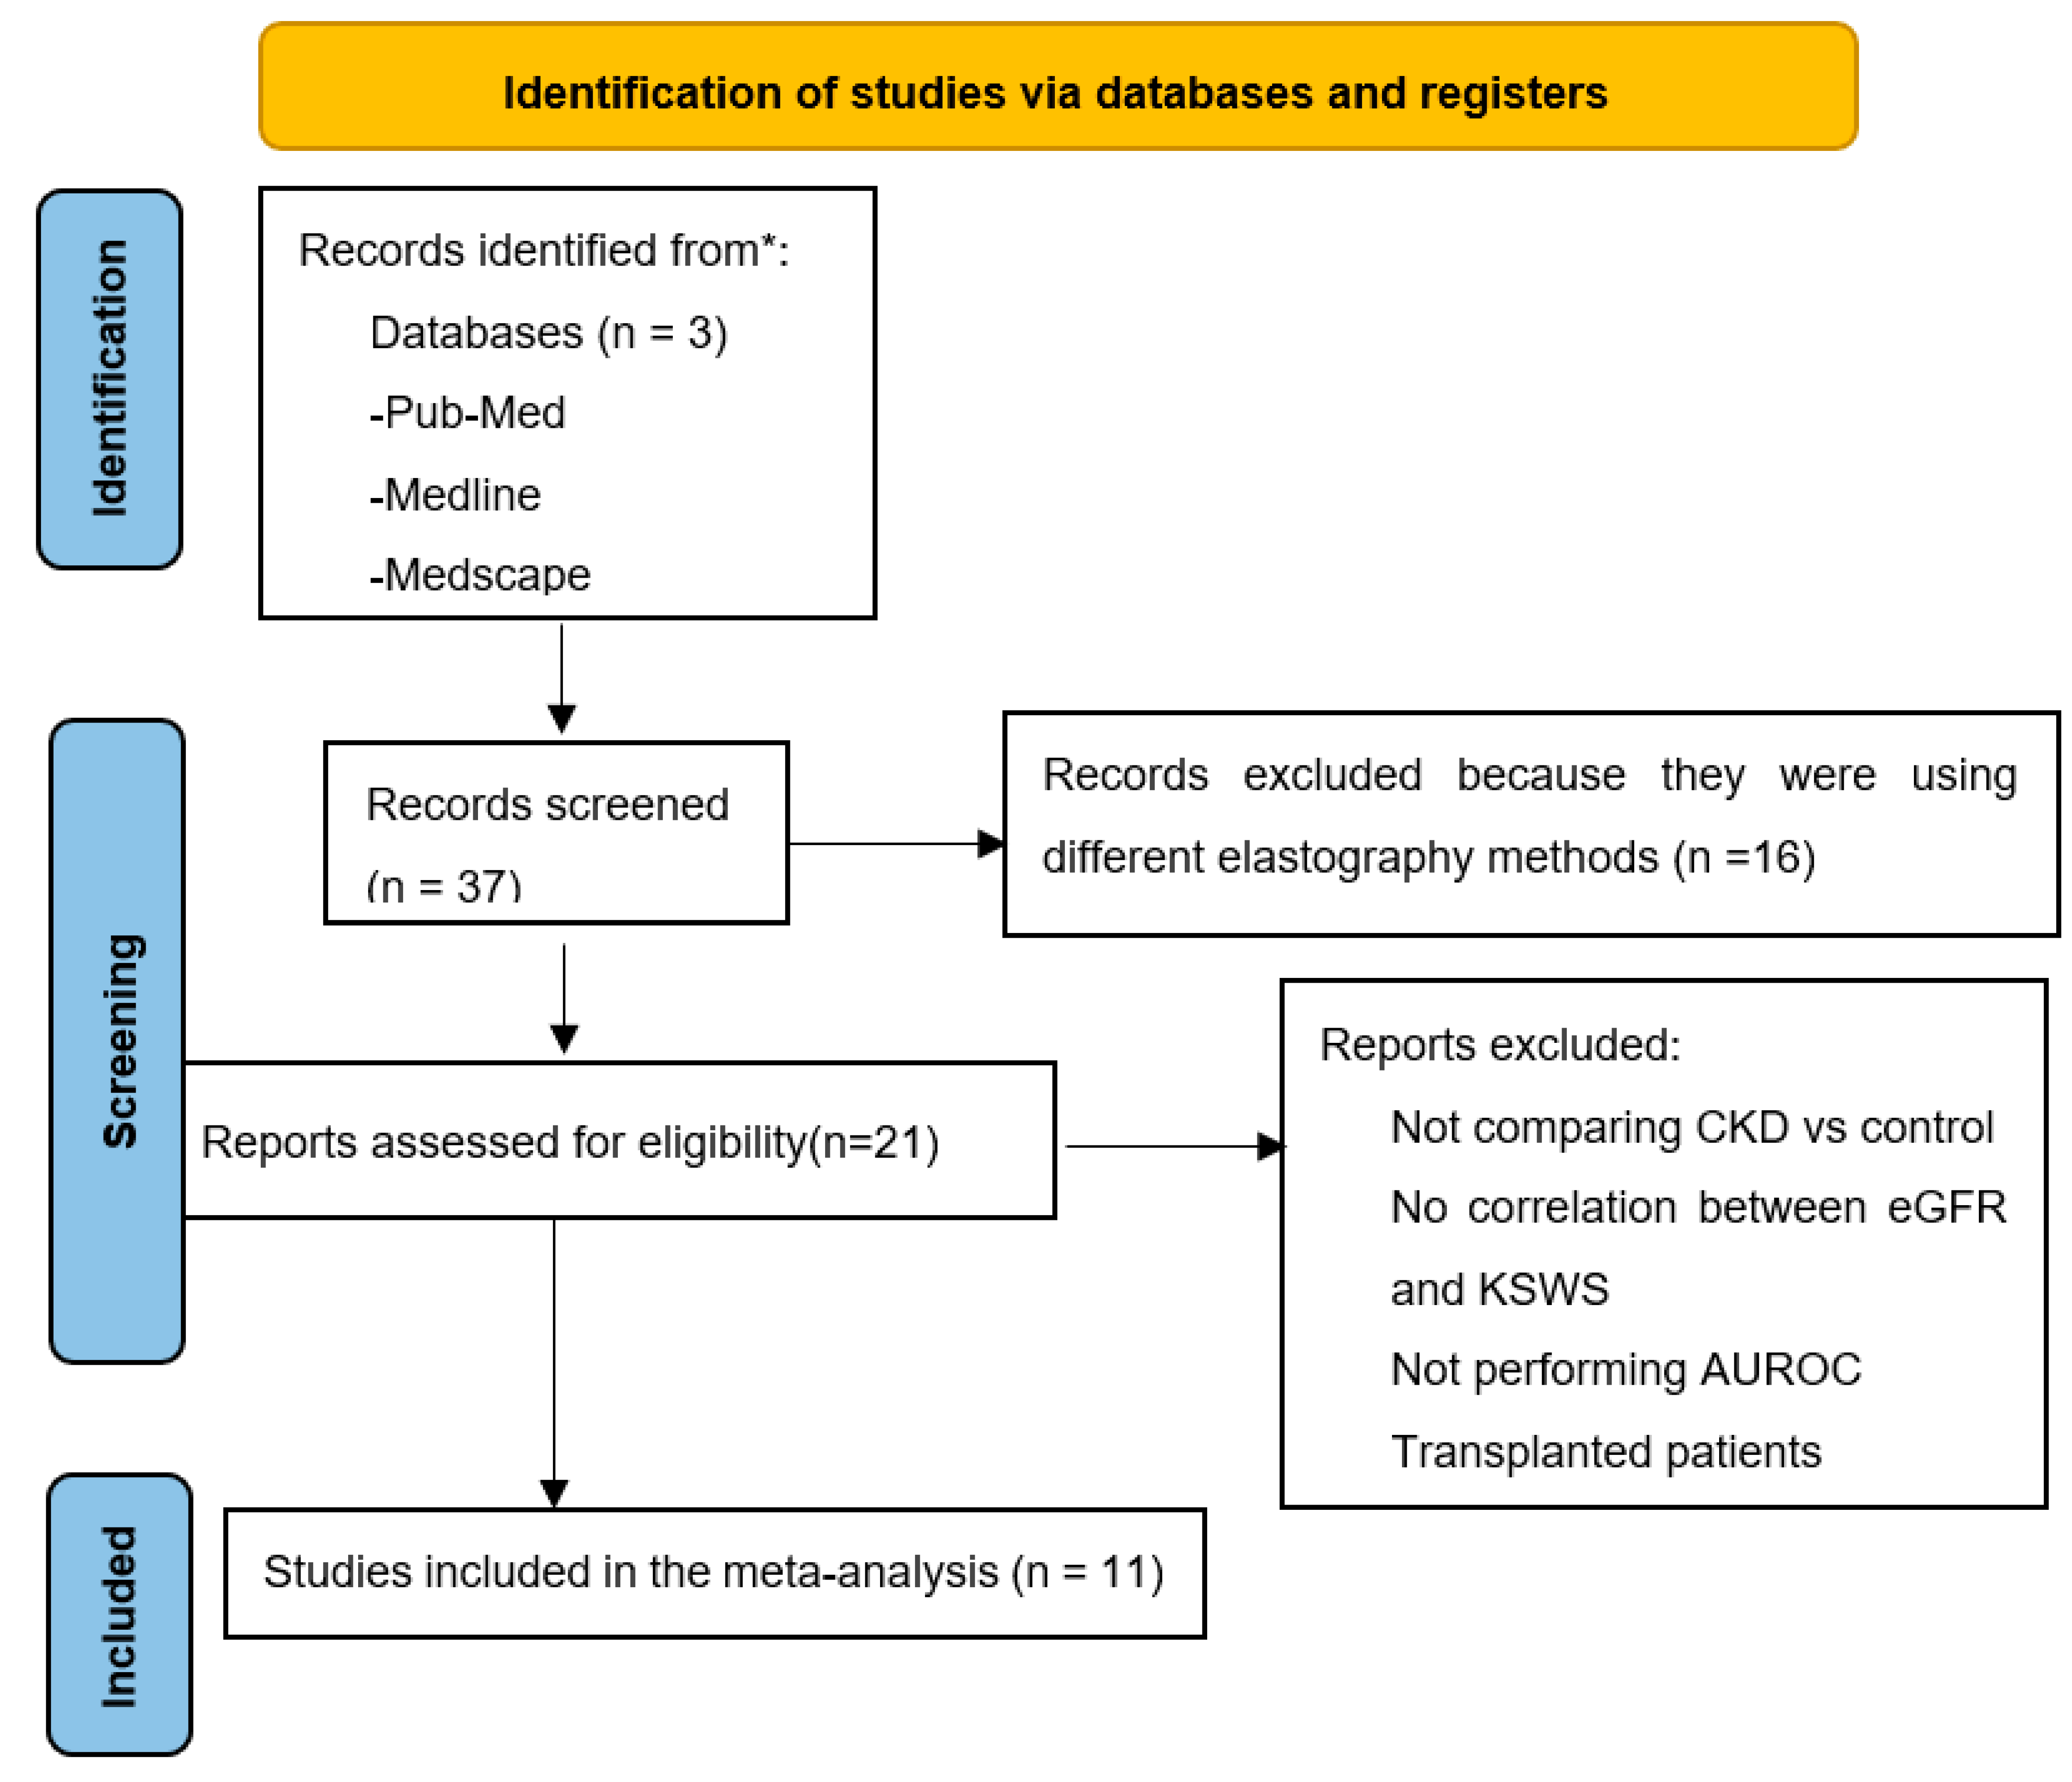
2. Materials and Methods

2.1. Eligibility Criteria

All studies (full-length publications) published in English from 2010 to November 2021 that performed kidney elastography were included using the following keywords: renal elastography, ARFI, Virtual touch tissue quantification, kidney stiffness, kidney fibrosis.
If the article did not provide the necessary information (the data presented were insufficient for statistical analysis), the article was not included in the analysis.

2.2. Data Sources and Searches

Studies that evaluated stiffness using elastography of the kidneys were searched in databases of PubMed, Medline, Medscape using the following search terms: kidney or renal elastography, kidney shear wave speed, ARFI, VTQ, 2D-SWE.

2.3. Study Selection and Data Extraction

Titles were assessed for potential eligibility by two authors (F.M. and F.B.) separately, and complete texts were screened for final eligibility. Country of origin, year of publication, patients, etiology of chronic kidney disease, technical failures, renal biopsy used for the evaluation of fibrosis in CKD, the quality of specimen obtained in renal biopsy, the correlation coefficient between kidney SWS and eGFR, the area under the curve (AUC) (if provided) and cut-off values for predicting CKD were all extracted.
We found 37 kidney elastography studies, which are presented in Table 1.
The results obtained using different types of elastography are not comparable, and no correlation tables are available, so out of the 37 titles found during the original search, only 21 studies that used point shear wave elastography (Virtual Touch Quantification-VTQ system) were compared.
We were primarily looking for a specific comparison of CKD patients to a control group (mean measures of KSWS and their standard deviation (SD)), also for a statistically significant correlation coefficient between eGFR and kidney stiffness, as well as AUC and a cut-off value of KSWS potentially useful for the diagnosis of CKD.
Finally, 11 studies (11 full-length publications) involving 1214 CKD patients versus 781 healthy controls examined using VTQ to determine renal stiffness were evaluated. (Figure 1.)
We attempted to analyze the 4 studies performed by Wang et al., 2014 [47], Cui et al., 2014 [25], Bob et al., 2015 [26], Sasaki et al., 2018 [33] performed only on CKD patients (without controls) using VTQ, but unfortunately, the results presented show no correlation between renal function and kidney SWS. Cui et al. (2014) [25] found that the VTQ values of the mild and moderate fibrosis groups were substantially higher than those of the non-fibrosis group, but there was no significant difference between the VTQ values of the mild and moderate fibrosis groups.
We also attempted to evaluate the four articles that used the Elast-PQ method, but the data presented were insufficient for statistical analysis. Sumbul et al., 2020 [40] was the only study that achieved a statistically significant correlation coefficient between eGFR and kidney SWS. Between studies, AUC values are used to compare distinct characteristics (differentiating kidney SWS between mildly and moderately impaired kidneys, between non-diabetic/prediabetic/diabetic patients, or kidney SWS between CKD and control groups), therefore not being suitable for further evaluation.
All three studies that used 2D-SWE-SSI reported elevated kidney SWS in patients with CKD; however, only two of them compared CKD to a control group, while the other one performed elastography in patients with idiopathic nephrotic syndrome.

3. Results

This analysis includes 1995 patients from 11 different publications. With a standardized mean difference of −0.216, patients with CKD have a lower kidney SWS than healthy controls. The number of cases with CKD, the mean kidney SWS in CKD, and the mean SD in CKD was compared to the same outcomes in the control group. The VTQ-detected shear wave velocity was substantially higher in healthy volunteers than in CKD patients, and it was related to eGFR. With a Q = 531.13, DF 10, p < 000.1, I2 = 98.12% (95% CI for I2 97.52 to 98.57) the analysis shows an increased heterogeneity as expected (Figure 2).
We also discovered a positive association in six studies that looked at the correlation coefficient between eGFR and kidney SWS with a pooled correlation coefficient of 0.383 (Z = 10.387, p < 0.001). However, heterogeneity still rose among them with a D = 73.3, DF = 5, and I2 (inconsistency) = 93.1 % (95% CI for I2 87.86 to 96.18). In total, 681 patients with CKD were included in this analysis (Figure 3).
A pooled area under the ROC curve to predict chronic kidney disease was also performed. Seven studies including 589 patients with CKD provided measures for AUC and were therefore included in this analysis. Across the studies, the pooled area under the ROC curve for kidney SWS to predict chronic kidney disease was 0.831 (95% CI, p < 0.001) with a statistically significant level of p = 0.0001, Q = 28.3, DF = 6, I2 (inconsistency) = 78.82% (95% CI for I2 56.37 to 89.72) also preserving the inconsistency (Figure 4). A limitation of this pooled analysis is the different method of diagnosing CKD that has been used across the seven studies [18,21,22,26,29,31,34]: either the level of eGFR < 60 mL/min [18,26,29,31], or the presence of fibrosis in the renal biopsy [21,34].

4. Discussion

Throughout our research, we discovered 37 renal elastography studies, out of which only 11 were suitable for our pooled analysis.
The relationship between the level of kidney SWS and renal disease was quite distinct in different studies using VTQ. We found that in some studies, kidney SWS was increased in patients with CKD (5 studies) [19,22,25,34,36], while in others it was decreased (12 studies) [18,23,27,28,29,31,35,37,38], and four studies showed no relationship between kidney SWS and renal disease [20,32,33,47]. Overall, we found that patients with CKD have a lower kidney SWS than healthy controls with a standardized mean difference of −0.216. In addition, the results of research utilizing different elastography devices were also inconclusive. Out of the four studies that employed the Elast-PQ method, two reported a high KSWS in relationship with CKD while the other two reported low kidney SWS in relation to CKD. Only three studies were performed using the 2D-SWE method but all of them reported high kidney SWS in correlation with CKD.
Regarding the relationship between CKD stages and kidney SWS, this has been approached in some studies; however, no statistically significant correlations have been found, despite the tendency of kidney SWS to decrease as the CKD stage rises. It could be concluded that elastography (at least VTQ) is not suitable for differentiating between CKD stages [29].
The connection between kidney SWS and eGFR is debatable as well. Out of our 37 studies, only 13 correlated them with statistical significance. Different studies proposed renal stiffness cut-off values to predict advanced stages of CKD. A total of 19 studies performed AUC and obtained a cut-off value for predicting CKD for differentiating between diabetic and nondiabetic patients, or comparison between different stages of CKD. Across the VTQ studies, the pooled area under the ROC curve for kidney SWS to predict chronic kidney disease was 0.831, p < 0.0001; however, as already mentioned, CKD has been diagnosed using different criteria across the mentioned studies.
An unexplained aspect relates to the fact that kidney SWS in CKD is high in some investigations but also reduced in the majority of them even though they were using the same method (VTQ) for measuring the same type of patients (with CKD and healthy participants). The question remains why CKD seems to be associated to lower kidney SWS because fibrosis should lead to an increase in tissue stiffness.
There are some studies that compare elastography with renal histology (eight studies). However, when it came to kidney SWS in CKD, there was no significant difference between the mild and moderate fibrosis groups. Two studies reported mean KSWV in severely impaired kidneys (biopsy proven) being considerably lower than in slightly impaired, moderately impaired, and healthy kidneys [2,21]. According to one experimental study, the stiffness of the kidney increases as the amount of fibrosis increases [38]. The inconsistent relationship between histological changes and renal stiffness could be due to the fact that histological changes in renal diseases are heterogenous, consisting of changes in the different compartments of the renal tissue (glomerular, vascular, or tubulointerstitial) that are not uniformly involved in different renal diseases.
Because intrarenal blood flow decreases as fibrosis progresses, alterations in renal perfusion may influence renal stiffness and explain some inconsistencies in results. As a consequence, a decrease in renal blood flow may be the cause of stiffness reduction as CKD progresses and it may have a greater impact on stiffness than renal fibrosis [23].
Although there are some advantages to using elastography in the assessment of the kidneys, such as the fact that the image is obtained in real time without the need for special prior preparation of the subjects and without procedure complications, the use of elastography in the assessment of the kidneys is more difficult than in other organs. This is confirmed by the increased heterogeneity that we have found between the studies that have been included in the present meta-analysis [10,23].
We found in the literature only two other meta-analyses regarding renal elastography. The first one by Wu et al., 2020 proposes looking into whether ARFI could accurately diagnose kidney masses [48], and the second one by Hwang et al., 2021 [49] determined the technical performance of ARFI imaging for evaluating renal parenchymal stiffness. The percentage of technical fault and intrasubject correlation coefficient indicated good agreement in both native and transplanted kidneys, but also that the region of interest location represented a significant factor of heterogeneity in transplanted kidneys.
The good inter-operator agreement of p-SWE in native kidney studies is also pointed out in the EFSUMB guidelines published by Saftoiu et al., 2018 [9] for non-hepatic applications. Despite the good reproducibility of renal elastography, no evidence-based recommendation for the practical use of renal elastography can be offered so far.
The present study is the first meta-analysis that examines the relationship between kidney SWS and renal function, and the presented results, even when comparing studies performed with the same method, are characterized by high heterogeneity.
One of the causes of this could be anisotropy. The architecture of the renal tissue, which is characterized by a high degree of anisotropy, has an impact on the measured kidney SWS, making the results difficult to interpret [41]. In addition to anisotropy, another problem related to renal elastography is the depth of the kidneys. The placement of the ROI within native kidneys is a major challenge in renal elastography and the ability of current elastography methods to evaluate deep tissues is constrained. ARFI-based approaches have been reported to have a 7 cm target anatomical depth limitation [50].
In order to improve the performance of renal elastography, different improvements to the technique have been proposed. An experimental elastography-based method is two-dimensional time-harmonic ultrasound elastography. This method uses a vibration bed that produces continuous vibrations and thus the 2D-SWE elastography allows for deeper measurements (up to 13 cm) and provides elastograms that cover the entire kidney rather than just a region of interest [51]. Using this enhanced elastography method CKD could be diagnosed as early as stage 1, the same method underlying the influence of renal blood flow [52].
Another improvement could be obtained through the analysis of raw data of the different elastography systems used. The results of the study published by Barr et al. in 2020 [53] show that the three machines used for renal elastography do not provide accurate shear wave displacement curves and the conclusion is that improved processing algorithms are required to obtain more accurate renal stiffness data from an elastographic device.
Although one vendor has released technology that claims to be able to effectively measure shear wave displacements, there are currently just a few studies using 2D-SWE techniques in kidney assessment for this to be accepted.
The main limitation of the present study is the limited number of studies that could be introduced in the meta-analysis. The choice of the main method assessed (VTQ) was made because it was the only method for which the number of published studies so far was sufficient to perform the statistical analysis.

5. Conclusions

The analysis of the different renal elastography studies shows that, overall, patients with CKD have a lower kidney SWS. However, although renal elastography could be an attractive tool for monitoring the progression of CKD, studies to date show an increased heterogeneity, at least regarding VTQ technique, and therefore this method is not compelling enough to be introduced into routine practice. Perhaps the improvement of the technique (time harmonic ultrasound elastography or modified processing algorithms of raw data) could be helpful in order to lead to a wider practical use.

Author Contributions

Conceptualization, F.-M.M. and F.B.; methodology, F.B.; software, F.-M.M.; validation, M.C., A.S. (Alexandru Sircuta) and A.S. (Adalbert Schiller); formal analysis, L.P.; investigation, F.-M.M.; resources, F.B.; data curation, F.B.; writing—original draft preparation, F.-M.M.; writing—review and editing, F.B.; visualization, F.-M.M.; supervision, F.B.; project administration, F.-M.M.; funding acquisition, F.B. All authors have read and agreed to the published version of the manuscript.

Funding

The APC was funded by Frederic Yuan in collaboration with Stoian Dana.

Institutional Review Board Statement

Ethical review and approval were waived for this study.

Informed Consent Statement

Informed consent was obtained from subjects involved in the studies included in the analysis.

Data Availability Statement

Not applicable.

Conflicts of Interest

The authors declare no conflict of interest.

References

  1. Turner, N.; Lameire, N.; Goldsmith, D.J.; Winearls, C.G.; Himmelfarb, J.; Remuzzi, G. Oxford Textbook of Clinical Nephrology, 4th ed.; Oxford University Press: Oxford, UK, 2016. [Google Scholar]
  2. Hu, Q.; Zhang, W.J.; Lin, Z.Q.; Wang, X.Y.; Zheng, H.Y.; Wei, H.M.; He, H.G. Combined acoustic radiation force impulse and conventional ultrasound in the quantitative assessment of immunoglobulin a nephropathy. Ultrasound Med. Biol. 2019, 45, 2309–2316. [Google Scholar] [CrossRef] [PubMed]
  3. Moghazi, S.; Jones, E.; Schroepple, J.; Arya, K.; Mcclellan, W.; Hennigar, R.A.; O’Neill, W.C. Correlation of renal histopathology with sonographic findings. Kidney Int. 2005, 67, 1515–1520. [Google Scholar] [CrossRef] [PubMed] [Green Version]
  4. Ophir, J.; Ccspedes, I.; Ponnekanti, H.; Yazdi, Y.; Li, X. Elastography: A quantitative method for imaging the elasticity of biological tissues. Ultrason. Imaging 1991, 13, 111–134. [Google Scholar] [CrossRef] [PubMed]
  5. Hou, X.J.; Sun, A.X.; Zhou, X.L.; Ji, Q.; Wang, H.B.; Wei, H.; Sun, J.W.; Liu, H. The application of Virtual Touch tissue quantification (VTQ) in diagnosis of thyroid lesions: A preliminary study. Eur. J. Radiol. 2013, 82, 797–801. [Google Scholar] [CrossRef]
  6. Nierhoff, J.; Chávez Ortiz, A.A.; Herrmann, E.; Zeuzem, S.; Friedrich-Rust, M. The efficiency of acoustic radiation force impulse imaging for the staging of liver fibrosis: A meta-analysis. Eur. Radiol. 2013, 23, 3040–3053. [Google Scholar] [CrossRef]
  7. Chen, C.; Wang, C.; Hu, C.; Han, Y.; Zhao, L.; Zhu, X.; Xiao, L.; Sun, L. Normoalbuminuric diabetic kidney disease. Front. Med. 2017, 11, 310–318. [Google Scholar] [CrossRef]
  8. Shiina, T.; Nightingale, K.R.; Palmeri, M.L.; Hall, T.J.; Bamber, J.C.; Barr, R.G.; Castera, L.; Choi, B.I.; Chou, Y.H.; Cosgrove, D.; et al. WFUMB guidelines and recommendations for clinical use of ultrasound elastography: Part 1: Basic principles and terminology. Ultrasound Med. Biol. 2015, 41, 1126–1147. [Google Scholar] [CrossRef] [Green Version]
  9. Săftoiu, A.; Gilja, O.H.; Sidhu, P.S.; Dietrich, C.F.; Cantisani, V.; Amy, D.; Bachmann-Nielsen, M.; Bob, F.; Bojunga, J.; Brock, M.; et al. The EFSUMB guidelines and recommendations for the clinical practice of elastography in non-hepatic applications: Update 2018. Ultraschall Der Med. 2019, 40, 425–453. [Google Scholar] [CrossRef] [Green Version]
  10. Bob, F.; Grosu, I.; Sporea, I.; Timar, R.; Lighezan, D.; Popescu, A.; Sirli, R.; Buzas, R.; Petrica, L.; Munteanu, M.; et al. Is Kidney stiffness measured using elastography influenced mainly by vascular factors in patients with diabetic kidney disease? Ultrason. Imaging 2018, 40, 300–309. [Google Scholar] [CrossRef]
  11. Arndt, R.; Schmidt, S.; Loddenkemper, C.; Grünbaum, M.; Zidek, W.; Van Der Giet, M.; Westhoff, T.H. Noninvasive evaluation of renal allograft fibrosis by transient elastography—A pilot study. Transpl. Int. 2010, 23, 871–877. [Google Scholar] [CrossRef]
  12. Lukenda, V.; Mikolasevic, I.; Racki, S.; Jelic, I.; Stimac, D.; Orlic, L. Transient elastography: A new noninvasive diagnostic tool for assessment of chronic allograft nephropathy. Int. Urol. Nephrol. 2014, 46, 1435–1440. [Google Scholar] [CrossRef] [PubMed]
  13. Nakao, T.; Ushigome, H.; Nakamura, T.; Harada, S.; Koshino, K.; Suzuki, T.; Ito, T.; Nobori, S.; Yoshimura, N. Evaluation of renal allograft fibrosis by transient elastography (fibro scan). Transplant. Proc. 2015, 47, 640–643. [Google Scholar] [CrossRef] [PubMed]
  14. Sommerer, C.; Scharf, M.; Seitz, C.; Millonig, G.; Seitz, H.K.; Zeier, M.; Mueller, S. Assessment of renal allograft fibrosis by transient elastography. Transpl. Int. 2013, 26, 545–551. [Google Scholar] [CrossRef] [PubMed]
  15. Menzilcioglu, M.S.; Duymus, M.; Citil, S.; Avcu, S.; Gungor, G.; Sahin, T.; Boysan, S.N.; Altunoren, O.; Sarica, A. Strain wave elastography for evaluation of renal parenchyma in chronic kidney disease. Br. J. Radiol. 2015, 88, 20140714. [Google Scholar] [CrossRef] [PubMed] [Green Version]
  16. Menzilcioglu, M.S.; Duymus, M.; Citil, S.; Gungor, G.; Saglam, M.; Gungor, O.; Boysan, S.N.; Sarıca, A.; Avcu, S. The comparison of resistivity index and strain index values in the ultrasonographic evaluation of chronic kidney disease. Radiol. Med. 2016, 121, 681–687. [Google Scholar] [CrossRef]
  17. Lin, H.Y.H.; Lee, Y.L.; Lin, K.D.; Chiu, Y.W.; Shin, S.J.; Hwang, S.J.; Chen, H.C.; Hung, C.C. Association of renal elasticity and renal function progression in patients with chronic kidney disease evaluated by real-time ultrasound elastography. Sci. Rep. 2017, 7, 43303. [Google Scholar] [CrossRef]
  18. Guo, L.H.; Xu, H.X.; Fu, H.J.; Peng, A.; Zhang, Y.F.; Liu, L.N. Acoustic radiation force impulse imaging for noninvasive evaluation of renal parenchyma elasticity: Preliminary findings. PLoS ONE 2013, 8, e68925. [Google Scholar] [CrossRef] [Green Version]
  19. Stock, K.F.; Klein, B.S.; Cong, M.T.; Regenbogen, C.; Kemmner, S.; Büttner, M.; Wagenpfeil, S.; Matevossian, E.; Renders, L.; Heemann, U.; et al. ARFI-based tissue elasticity quantification and kidney graft dysfunction: First clinical experiences. Clin. Hemorheol. Microcirc. 2011, 49, 527–535. [Google Scholar] [CrossRef]
  20. Syversveen, T.; Brabrand, K.; Midtvedt, K.; Strøm, E.H.; Hartmann, A.; Jakobsen, J.A.; Berstad, A.E. Assessment of renal allograft fibrosis by acoustic radiation force impulse quantification—A pilot study. Transpl. Int. 2011, 24, 100–105. [Google Scholar] [CrossRef]
  21. Hu, Q.; Wang, X.Y.; He, H.G.; Wei, H.M.; Kang, L.K.; Qin, G.C. Acoustic radiation force impulse imaging for non-invasive assessment of renal histopathology in chronic kidney disease. PLoS ONE 2014, 9, e115051. [Google Scholar] [CrossRef] [Green Version]
  22. Yu, N.; Zhang, Y.; Xu, Y. Value of Virtual Touch tissue quantification in stages of diabetic kidney disease. J. Ultrasound Med. 2014, 33, 787–792. [Google Scholar] [CrossRef] [PubMed]
  23. Asano, K.; Ogata, A.; Tanaka, K.; Ide, Y.; Sankoda, A.; Kawakita, C.; Nishikawa, M.; Ohmori, K.; Kinomura, M.; Shimada, N.; et al. Acoustic radiation force impulse elastography of the kidneys: Is shear wave velocity affected by tissue fibrosis or renal blood flow? J. Ultrasound Med. 2014, 33, 793–801. [Google Scholar] [CrossRef]
  24. Wang, L.; Xia, P.; Lv, K.; Han, J.; Dai, Q.; Li, X.M.; Chen, L.M.; Jiang, Y.X. Assessment of renal tissue elasticity by acoustic radiation force impulse quantification with histopathological correlation: Preliminary experience in chronic kidney disease. Eur. Radiol. 2014, 24, 1694–1699. [Google Scholar] [CrossRef] [PubMed]
  25. Cui, G.; Yang, Z.; Zhang, W.; Li, B.; Sun, F.; Xu, C.; Wang, K. Evaluation of acoustic radiation force impulse imaging for the clinicopathological typing of renal fibrosis. Exp. Ther. Med. 2013, 7, 233–235. [Google Scholar] [CrossRef] [PubMed] [Green Version]
  26. Bob, F.; Bota, S.; Sporea, I.; Sirli, R.; Popescu, A.; Schiller, A. Relationship between the estimated glomerular filtration rate and kidney shear wave speed values assessed by acoustic radiation force impulse elastography: A pilot study. J. Ultrasound Med. 2015, 34, 649–654. [Google Scholar] [CrossRef] [PubMed]
  27. Bob, F.; Bota, S.; Sporea, I.; Sirli, R.; Petrica, L.; Schiller, A. Kidney shear wave speed values in subjects with and without renal pathology and inter-operator reproducibility of acoustic radiation force impulse Elastography (ARFI)—Preliminary results. PLoS ONE 2014, 9, e113761. [Google Scholar] [CrossRef] [Green Version]
  28. Takata, T.; Koda, M.; Sugihara, T.; Sugihara, S.; Okamoto, T.; Miyoshi, K.; Matono, T.; Hosho, K.; Mae, Y.; Iyama, T.; et al. Renal shear wave velocity by acoustic radiation force impulse did not reflect advanced renal impairment. Nephrology 2016, 21, 1056–1062. [Google Scholar] [CrossRef]
  29. Alan, B.; Göya, C.; Aktan, A.; Alan, S. Renal acoustic radiation force impulse elastography in the evaluation of coronary artery disease. Acta Radiol. 2017, 58, 156–163. [Google Scholar] [CrossRef]
  30. Bob, F.; Grosu, I.; Sporea, I.; Bota, S.; Popescu, A.; Sima, A.; Şirli, R.; Petrica, L.; Timar, R.; Schiller, A. Ultrasound-based shear wave elastography in the assessment of patients with diabetic kidney disease. Ultrasound Med. Biol. 2017, 43, 2159–2166. [Google Scholar] [CrossRef]
  31. Bilgici, M.C.; Bekci, T.; Genc, G.; Tekcan, D.; Tomak, L. Acoustic radiation force impulse quantification in the evaluation of renal parenchyma elasticity in pediatric patients with chronic kidney disease: Preliminary results. J. Ultrasound Med. 2017, 36, 1555–1561. [Google Scholar] [CrossRef]
  32. Grass, L.; Szekely, N.; Alrajab, A.; Bui-Ta, T.T.T.; Hoffmann, G.F.; Wühl, E.; Schenk, J.P. Point shear wave elastography (pSWE) using Acoustic Radiation Force Impulse (ARFI) imaging: A feasibility study and norm values for renal parenchymal stiffness in healthy children and adolescents. Med. Ultrason. 2017, 19, 366–373. [Google Scholar] [CrossRef] [Green Version]
  33. Sasaki, Y.; Hirooka, Y.; Kawashima, H.; Ishikawa, T.; Takeshita, K.; Goto, H. Measurements of renal shear wave velocities in chronic kidney disease patients. Acta Radiol. 2018, 59, 884–890. [Google Scholar] [CrossRef] [PubMed]
  34. Yang, X.; Yu, N.; Yu, J.; Wang, H.; Li, X. Virtual touch tissue quantification for assessing renal pathology in idiopathic nephrotic syndrome. Ultrasound Med. Biol. 2018, 44, 1318–1326. [Google Scholar] [CrossRef] [PubMed]
  35. Lee, J.; Oh, Y.T.; Joo, D.J.; Ma, B.G.; Lee, A.L.; Lee, J.G.; Song, S.H.; Kim, S.U.; Jung, D.C.; Chung, Y.E.; et al. Acoustic radiation force impulse measurement in renal transplantation: A prospective, longitudinal study with protocol biopsies. Medicine 2015, 94, e1590. [Google Scholar] [CrossRef] [PubMed]
  36. Yoǧurtçuoǧlu, B.; Damar, Ç. Renal elastography measurements in children with acute glomerulonephritis. Ultrasonography 2021, 40, 575–583. [Google Scholar] [CrossRef] [PubMed]
  37. Caraba, A.; Munteanu, A.; Iurciuc, S.; Iurciuc, M. Renal acoustic radiation force impulse elastography in hypertensive nephroangiosclerosis patients. Appl. Sci. 2021, 11, 612. [Google Scholar] [CrossRef]
  38. Grosu, I.; Bob, F.; Sporea, I.; Popescu, A.; Şirli, R.; Schiller, A. Correlation of point shear wave velocity and kidney function in chronic kidney disease. J. Ultrasound Med. 2018, 37, 2613–2620. [Google Scholar] [CrossRef] [Green Version]
  39. Liu, Q.Y.; Duan, Q.; Fu, X.H.; Fu, L.Q.; Xia, H.W.; Wan, Y.L. Value of elastography point quantification in improving the diagnostic accuracy of early diabetic kidney disease. World J. Clin. Cases 2019, 7, 3945–3956. [Google Scholar] [CrossRef]
  40. Sumbul, H.E.; Koc, A.S.; Gülümsek, E. Renal cortical stiffness is markedly increased in pre-diabetes mellitus and associated with albuminuria. Singap. Med. J. 2020, 61, 435–442. [Google Scholar] [CrossRef]
  41. Leong, S.S.; Wong, J.H.D.; Md Shah, M.N.; Vijayananthan, A.; Jalalonmuhali, M.; Chow, T.K.; Sharif, N.H.; Ng, K.H. Shear wave elastography accurately detects chronic changes in renal histopathology. Nephrology 2021, 26, 38–45. [Google Scholar] [CrossRef]
  42. Grenier, N.; Poulain, S.; Lepreux, S.; Gennisson, J.L.; Dallaudière, B.; Lebras, Y.; Bavu, E.; Servais, A.; Meas-Yedid, V.; Piccoli, M.; et al. Quantitative elastography of renal transplants using supersonic shear imaging: A pilot study. Eur. Radiol. 2012, 22, 2138–2146. [Google Scholar] [CrossRef] [PubMed]
  43. Samir, A.E.; Allegretti, A.S.; Zhu, Q.; Dhyani, M.; Anvari, A.; Sullivan, D.A.; Trottier, C.A.; Dougherty, S.; Williams, W.W.; Babitt, J.L.; et al. Shear wave elastography in chronic kidney disease: A pilot experience in native kidneys. BMC Nephrol. 2015, 16, 119. [Google Scholar] [CrossRef] [PubMed] [Green Version]
  44. Radulescu, D.; Peride, I.; Petcu, L.C.; Niculae, A.; Checherita, I.A. Supersonic shear wave ultrasonography for assessing tissue stiffness in native kidney. Ultrasound Med. Biol. 2018, 44, 2556–2568. [Google Scholar] [CrossRef] [PubMed] [Green Version]
  45. Yang, X.; Hou, F.L.; Zhao, C.; Jiang, C.Y.; Li, X.M.; Yu, N. The role of real-time shear wave elastography in the diagnosis of idiopathic nephrotic syndrome and evaluation of the curative effect. Abdom. Radiol. 2020, 45, 2508–2517. [Google Scholar] [CrossRef]
  46. Grosu, I.; Bob, F.; Sporea, I.; Popescu, A.; Sirli, R.; Schiller, A. Two-dimensional shear-wave elastography for kidney stiffness assessment. Ultrasound Q. 2021, 37, 144–148. [Google Scholar] [CrossRef]
  47. Wang, L. New insights on the role of anisotropy in renal ultrasonic elastography: From trash to treasure. Med. Hypotheses 2020, 143, 110146. [Google Scholar] [CrossRef]
  48. Wu, J.F.; Ge, L.J.; Ye, X.B.; Sun, Y.; Wang, Y.L.; Wang, Z.P. Can acoustic radiation force impulse imaging (ARFI) accurately diagnose renal masses?: A protocol of systematic review and meta-analysis. Medicine 2020, 99, e21500. [Google Scholar] [CrossRef]
  49. Hwang, J.; Kim, H.W.; Kim, P.H.; Suh, C.H.; Yoon, H.M. Technical performance of acoustic radiation force impulse imaging for measuring renal parenchymal stiffness: A systematic review and meta-analysis. J. Ultrasound Med. 2021, 40, 2639–2653. [Google Scholar] [CrossRef]
  50. Cosgrove, D.; Piscaglia, F.; Bamber, J.; Bojunga, J.; Correas, J.M.; Gilja, O.H.; Klauser, A.S.; Sporea, I.; Calliada, F.; Cantisani, V.; et al. EFSUMB guidelines and recommendations on the clinical use of ultrasound elastography. Part 2: Clinical applications. Ultraschall Der Med. 2013, 34, 238–253. [Google Scholar] [CrossRef] [Green Version]
  51. Garcia, S.R.M.; Grossmann, M.; Lang, S.T.; Trong, M.N.; Schultz, M.; Guo, J.; Hamm, B.; Braun, J.; Sack, I.; Tzschätzsch, H. Full-Field-of-view time-harmonic elastography of the native kidney. Ultrasound Med. Biol. 2018, 44, 949–954. [Google Scholar] [CrossRef]
  52. Grossmann, M.; Tzschätzsch, H.; Lang, S.T.; Guo, J.; Bruns, A.; Dürr, M.; Hoyer, B.F.; Grittner, U.; Lerchbaumer, M.; Nguyen Trong, M.; et al. US time-harmonic elastography for the early detection of glomerulonephritis. Radiology 2019, 292, 676–684. [Google Scholar] [CrossRef] [PubMed]
  53. Barr, R.G. Can accurate shear wave velocities be obtained in kidneys? J. Ultrasound Med. 2020, 39, 1097–1105. [Google Scholar] [CrossRef] [PubMed]
Figure 1. Flowchart of the selection of studies. The “*” from records identified can be deleted.
Applsci 12 02359 g001
Figure 2. Forest plot for mean kidney SWS between 11 studies comparing CKD versus a control group.
Applsci 12 02359 g002
Figure 3. Forest plot for the correlation coefficient (between eGFR and kidney SWS).
Applsci 12 02359 g003
Figure 4. Forest plot for the pooled AUC.
Applsci 12 02359 g004
Table 1. Primary elastography research in kidneys that have been published.
Nr.StudyElastography MethodCKD PatientsHealthy SubjectsKidney SWS in CKDCKD vs. Control GroupCorrelation Coefficient Kidney SWS < >eGFR(p < 0.05)AUROC/Cut-Off Values
1.Arndt et al., 2010 [11]TE57 transplanted patients-High-Correlated-
2.Lukenda V et al., 2014 [12]TE23 transplanted patients-High-Correlated-
3.Nakao et al., 2015 [13]TE27 transplanted patients-High-Correlated-
4.Sommerer et al., 2013 [14]TE164 transplanted patients - High---
5.Menzilcioglu et al., 2015 [15]SE5840HighYes-Performed
6.Menzilcioglu et al., 2016 [16]SE12140HighYes-Performed
7.Lin et al., 2017 [17]RTE148277LowYesCorrelated-
8.Guo et al., 2013 [18]VTQ64327LowYesCorrelatedPerformed
9.Stock et al., 2011, [19]VTQ18 transplanted patients-High---
10.Syversveen et al., 2011, [20]VTQ30 transplanted patients - No relationship---
11.Hu et al., 2014 [21]VTQ16332LowYesCorrelatedPerformed
12.Yu et al., 2014 [22]VTQ12030HighYes-Performed
13.Asano K et al., 2014 [23]VTQ30914Low-Correlated-
14.Wang et al., 2014 [24]VTQ45-No relationship---
15.Cui et al., 2014 [25]VTQ76-HighYes-Performed
16.Bob et al., 2015 [26]VTQ4658Low-Correlated-
17.Bob et al., 2015 [27]VTQ20-LowYes-Performed
18.Takata et al., 2015 [28]VTQ9039LowYes--
19.Alan et al., 2016 [29]VTQ7679LowYes--
20.Bob et al., 2017 [30]VTQ8084LowYesCorrelated-
21.Bilgici et al., 2017 [31]VTQ30 pediatric patients38LowYes-Performed
22.Grass et al., 2017 [32]VTQ-264 healthy childrenNo relationship---
23.Sasaki et al., 2018 [33]VTQ187-No relationship---
24.Yang et al., 2018 [34]VTQ90 idiopathic nephrotic syndrome30HighYes-Performed
25.Hu et al., 2019 [2]VTQ14639LowYes-Performed
26.Lee et al., 2015 [35]VTQ73(biopsies of kidney donors before transplant)-Low-Correlated-
27.Yoǧurtçuoǧlu et al., 2021 [36]VTQ30 acute glomerulonephritis30HighYes--
28.Caraba et al., 2021 [37]VTQ8050LowYesCorrelatedPerformed
29.Grosu et al., 2018 [38]Elast-PQ10222LowYesCorrelated (but with no statistical performance)Performed (CKD vs. control group)
30.Liu et al., 2019 [39]Elast-PQ10222Low--Performed (only patients with type 2 diabetes)
31.Sumbul et al., 2020 [40]Elast-PQ22103HighYesCorrelatedPerformed(non-diabetic, pre-diabetic, diabetic patients)
32.Leong et al., 2021 [41]ElastPQ75-HighYes-Performed (differentiating between mildly and moderately impaired kidneys)
33.Grenier et al., 2012 [42]2D SWE-SSI43 transplanted patients-No relationship---
34.Samir et al., 2015 [43]2D SWE-SSI2520HighYes-Performed
35.Radulescu et al., 2018 [44]2D-SWE-SSI3222HighYes-Performed
36.Yang et al., 2020 [45]2D-SWE-SSI120 idiopathic nephrotic syndrome-HighYes-Performed
37.Grosu et al., 2021 [46]2D-SWE-GE4250LowYes-Performed
The keywords “high” and “low” refer to a statistically significant change in the KSWV in CKD patients compared to the control group, or in more advanced stages of CKD compared to less advanced stages. (TE = transient elastography, VTQ = virtual touch quantification, SE = strain elastography, RTE = real time elastography, 2D-SWE-SSI/GE = 2D shear wave elastography supersonic image/general electric).
Publisher’s Note: MDPI stays neutral with regard to jurisdictional claims in published maps and institutional affiliations.

