Abstract
This study uses the API of Upbit, one of Korea’s cryptocurrency exchanges, to predict continuous time series for a limited period and cryptocurrencies using LSTM, a machine learning technique. The trading (buying and selling) point algorithm presented in this study was used to conduct experimental research on efficient profit creation for cryptocurrency investment. Several related studies have shown the results of time series prediction for long-term forecasts, such as a week or several months. Still, they have not attempted to make an ultra-short-term prediction in units of one minute. This paper attempts such a 1 min prediction. This is an experiment to create efficient profits by setting efficient trading (buying and selling) points using machine learning techniques and repeating these operations by an algorithm. Applying it to cryptocurrency shows the possibility of time series prediction.
1. Introduction
Although the global economic market has recently been slowing due to COVID-19, the blockchain and cryptocurrency market is rapidly growing as part of the fourth industrial revolution. In addition, as interest rates are reduced due to the global economic market’s slow growth, making it challenging to prepare for retirement or raise funds through bank deposits, investment in various financial products, including stocks and cryptocurrencies, is rapidly increasing.
In the stock market, the price is the result of reflecting all the information in the market. Many studies have been conducted to predict the stock index using various economic techniques and chart analyses after discovering price patterns using stock price fluctuations [1]. However, in the stock market, stock price fluctuations are frequently unexplainable due to the pricing mechanism, in which the interrelationship of a company’s internal and external factors significantly influences stock price formation. Therefore, a method that can reflect both internal changes in the market and external events is required to predict the stock market. In other words, since the stock market responds to technical and macroeconomic indicators and a wide range of news and prices, research to predict stock prices using big data is currently in progress [2].
Technical analysis is an approach to predicting the future direction of stock prices by analyzing past indicators such as stock prices and trading volume. Since stock prices are moving with trends, technical indicators are used to identify trends and suggest appropriate investment strategies. Technical indicators are divided into trend indicators and reverse trend indicators. A trending approach is to obtain profits by entering a buy or sell position in the direction of the trend, judging that the movement will proceed further when a trend occurs above a certain level in the stock price. On the other hand, the reverse trend strategy is a strategy that seeks profit through trading in the opposite direction to the trend by finding a point where the stock price is expected to change direction without continuing the movement because the stock price rises or falls sufficiently.
Investment strategy approaches in the stock market are primarily divided into fundamental and technical analyses. Fundamental analysis is a method of investing by estimating the intrinsic value of a stock price and comparing it to the trading price in the market. At the same time, technical analysis is a method of investing by analyzing past price or volume movements. A trading system is a series of automated systems that analyze market information, such as stock prices and trading volumes, in real-time using a computer and execute trading orders through an investment strategy algorithm [3].
Cryptocurrency price analysis and prediction is a complex and challenging research area in time series analysis. However, in this study, we propose and attempt to analyze the profitability of a trading system for Bitcoin and Ethereum that exhibits high price volatility and liquidity. Its complexity and difficulty allow important predictions of cryptocurrency time series. Such time series forecasting is to generate predictions about certain future events or events by analyzing historical data. It is divided into the temporal classification of medium-term and long-term.
Therefore, in this study, we intend to make time series predictions for Bitcoin and Ethereum only with an ultra-short period (1 min) classification using LSTM. This time series analysis of cryptocurrencies is also an approach to predicting future prices by analyzing indicators, such as past trading prices and trading volume, just like the technical analysis applied to cryptocurrencies. We want to use the minute-by-minute forecast.
2. Theoretical Background Study
2.1. Blockchain and Cryptocurrency
Cryptocurrency is a compound word of crypto, meaning ‘encryption,’ and currency means ‘money.’ It is a digital asset that can be verified, and it is also called “virtual currency”, “digital currency”, or “electronic money”. These cryptocurrencies operate on a distributed ledger based on a blockchain or directed acyclic graph (DAG).
Bitcoin is a cryptocurrency based on blockchain technology created in October 2008 by a programmer under the pseudonym Satoshi Nakamoto, whose identity is unknown. It is designed so that financial transactions, such as remittances, can be freely performed between individuals in a peer-to-peer (P2P) way across the globe without a central bank [4].
A cryptocurrency exchange or digital currency exchange is an exchange where users can exchange cryptocurrencies, such as Bitcoin and Ethereum, and the operation method is like the stock exchange.
In addition, blockchain technology is a representative technology to prevent the hacking of cryptocurrencies. This blockchain is for P2P transactions beyond the existing financial system that secures and manages all transactions in financial institutions. P2P is a communication network connecting personal computers without a server or client. It is a way to play a role and share information.
Financial companies have kept transaction records in the existing financial system on a central server. In contrast, in a blockchain-based P2P method, transaction information is stored in blocks, connected, and shared by all participants. Many cryptocurrencies, such as Bitcoin and Ethereum, represent blockchain technology. Bitcoin first appeared in a paper titled “Bitcoin: A Peer-to-Peer Electronic Cash System,” published online in October 2008 by a programmer (or group) known as Satoshi Nakamoto. According to this paper, Bitcoin was designed as a reaction to each country’s central bank system and arbitrary monetary policy monopolizing the issuance of money.
2.2. LSTM
Extended short-term memory models (LSTM) [5,6,7] are a type of recurrent neural network (RNN) and is an algorithm that has recently been in the spotlight along with convolutional neural networks (CNN).
RNN is an artificial neural network in which directed edges connect hidden nodes to form a directed cycle. This algorithm is a model suitable for processing data that appears sequentially, such as voice and text.
It is known that the RNN’s learning ability is significantly reduced as the gradient during backpropagation gradually decreases when the distance between the relevant information and the point where the information is used is long. This is called a vanishing gradient problem. To address this issue, LSTM was created. LSTM is a structure that adds a cell state to the hidden form of RNN.
LSTM recurrent neural network is a model that has emerged to overcome the gradient loss and gradient explosion problems of RNN. On the other hand, LSTM makes erase gates, input gates, and output gates to continuously add inputs to long-term memory so they can be remembered for a long time. In addition, LSTM is a model created to compensate for the shortcomings of RNN. The RNN has a problem because the font information cannot be transmitted backward as the time step extends, so the LSTM supplements this by adding a cell state. In addition, LSTM has the characteristic of erasing bulky memories by adding input gates, forgetting gates, and output gates to the memory cells of the hidden layer and storing things to be remembered.
A characteristic of LSTM is the ability to perform learning that requires a long-term dependence period while maintaining past data by introducing the cell state concept to solve the vanishing gradient problem of RNNs. In addition, LSTM has the advantage that it is easy to process time series and sequence data by storing information for a long time. However, there is a disadvantage in that the operation speed is slow.
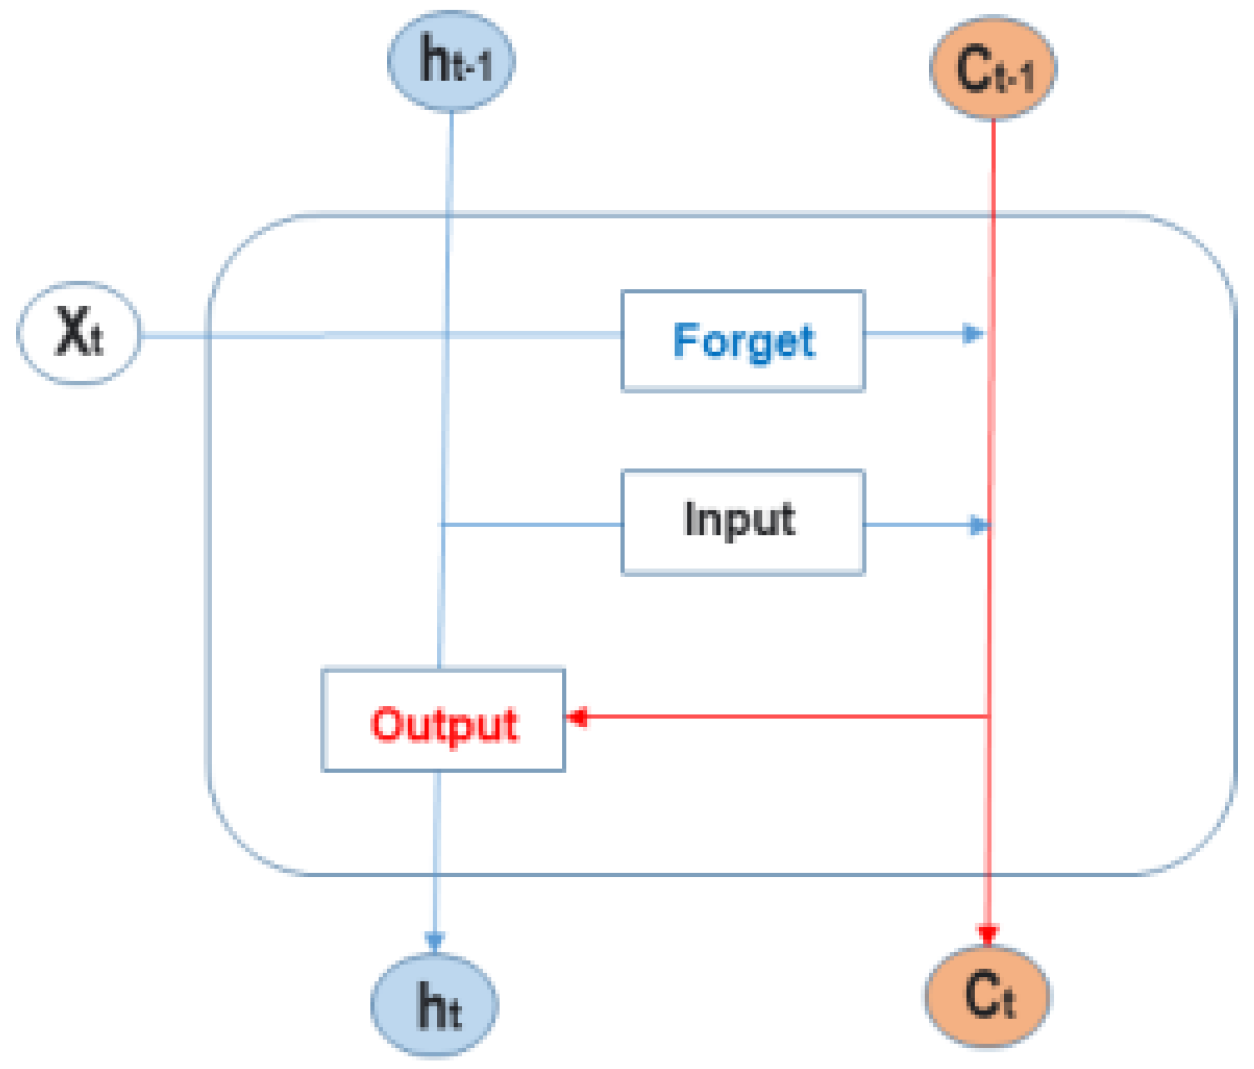
In addition, LSTM has a chain-like structure similar to RNN, but unlike only hidden states, LSTM is designed to exchange information uniquely called cell states. As can be seen from the LSTM structure in Figure 1, the cell state includes a forget gate that determines which of the past information about the input data passed from the previous cell to reflect, an input gate that determines how much of the current input information will be remembered, It consists of an output gate that determines how much data will be reflected in the data to be transmitted to the next cell [8].
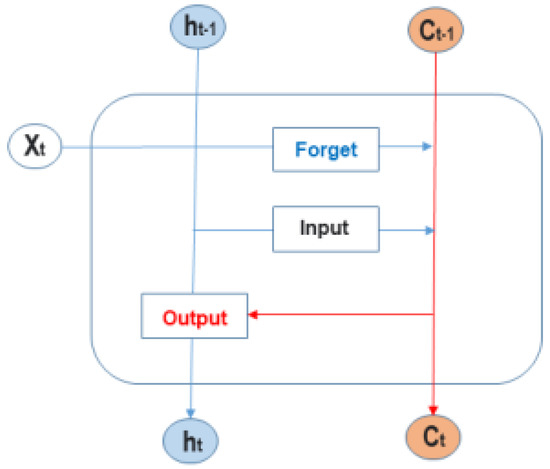
Figure 1.
The basic structure of LSTM.
Once again, the above structure is described as follows. In the LSTM structure, ht is a short-term state, and ct is a long-term state. The memory cell ct stores the LSTM memory at time t. It is assumed that the memory required from the past to time t is stored. Based on this memory containing all the necessary information, the hidden state ht is output to the outer layer. At this time, the output ht is the value converted by the tanh function, as shown in the following figure. Here, tanh means to apply the tanh function to each element. Additionally, the core of this structure is that the hidden state ht is calculated using ct obtained using three inputs (xt, ht−1, ct−1).
3. Related Research
3.1. Time Series Prediction [9]
In this research, we utilized machine learning to anticipate bitcoin prices using the time series prediction method. The primary goal of time series analysis is to forecast the future, with forecasting defined as an assertion about an unknown event occurring in the future as it has a significant impact on decision making. Therefore, to rationally design plans and reduce the losses as much as possible, accurate forecasts for the future are necessary.
These time series prediction methods can be divided into quantitative, qualitative, and judgmental. The first quantitative forecasting method is predicting by estimating the empirical law necessary for forecasting using the information in the observed past data. It is applied when the following conditions are satisfied. First, it is assumed that information about the past exists. In the second stage, the data can be presented as quantitative data. Second, it is assumed that past patterns will continue in the future.
The ‘explanatory model (causal model)’, which assumes that the variable to be predicted has a causal link with one or more variables and the expected value is based on preliminary data or errors that are the subject of prediction, is set up in this way for quantitative prediction. Please check the statement. The idea is not complete. That is, it is assumed that the output variable of the explanatory model appears through a causal relationship with the input variable. In contrast, the time series model’s output variable appears through the input variable’s self-generation process.
The time series model predicts by establishing a model under the assumption that a particular pattern will be found in the past data of the variable to be expected, and the pattern will be repeated without losing its characteristics in the future.
3.2. Existing Studies on Time Series Prediction of Financial Markets
As the stock price already reflects all information known at a specific point in time, we were skeptical of the existing analysis methodologies because it was argued that it was impossible to predict the stock price. However, recent research results in machine learning suggest that it is possible to achieve profits that exceed the market average through stock price prediction by combining artificial neural networks and technical analysis [10,11,12,13].
Deep learning is machine learning that mimics the structure of the human brain and is used in various fields such as image recognition, voice recognition, natural language processing, and future prediction by improving the problems of artificial neural networks. Unlike other types of machine learning, deep learning learns the feature pattern of the input data as it is, so there is a big difference in the prediction results depending on the feature pattern of the input data before learning [14].
Bitcoin and Ethereum are two examples of blockchain-based cryptocurrencies that are gaining much interest worldwide and are experiencing considerable volatility as their prices fluctuate. Because of its significant fluctuations, it can sometimes be viewed as a risk factor by many investors, resulting in social issues. The cost of Bitcoin and Ethereum is primarily affected by changes in the global environment and responds quickly. Therefore, it is critical to respond to a variety of real-time data. However, in the case of ordinary customers, obtaining such information promptly and efficiently is complex, making it impossible to determine the cooperative purchasing and selling points and making the investing approach extremely challenging.
Artificial neural network deep learning algorithms, such as LSTM, are being applied in many fields such as finance, medicine, image recognition, and speech recognition. In the financial sector, artificial neural networks are used for bankruptcy, credit evaluation, and stock market prediction. These days, the main research areas are stock price prediction, technical analysis, and cryptocurrency prediction.
Modern financial markets are characterized by a rapid flow of information, a vast number of participants having diversified investment horizons, and multiple feedback mechanisms, which collectively lead to the emergence of complex phenomena, for example, speculative bubbles or crashes. As such, they are considered one of the most complex systems known. Numerous studies have illuminated stylized facts, also called complexity characteristics, which are observed across the vast majority of financial markets. These include the so-called ‘‘fat tails’’ of the return’s distribution, volatility clustering, the ‘‘long memory’’, strong stochasticity alongside non-linear correlations, persistence, and the effects resembling fractality and even multifractality. The striking development of the cryptocurrency market over the last few years—from being entirely peripheral to capitalizing at the level of an intermediate-size stock exchange—provides a unique opportunity to observe its evolution in a short period [15].
Since all information known at a specific time has already been reflected in the stock price, we were skeptical of the existing analysis methodologies because it was argued that it was impossible to predict the stock price. However, recent research results in the field of machine learning suggest that it is possible to achieve profits that exceed the market average through stock price prediction by combining artificial neural networks and technical analysis.
In addition, deep learning is machine learning that imitates the structure of the human brain and is used in various fields such as image recognition, voice recognition, natural language processing, and future prediction by improving the problems of artificial neural networks. Unlike other types of machine learning, deep learning learns the feature pattern of the input data as it is, so there is a big difference in the prediction result depending on the feature pattern of the input data before learning.
Chong [16] compresses data through principal component analysis (PCA), using an autoencoder, and a limited Boltzmann machine (RBM) using 5 min price change data of KOSPI 20 stocks. Auto-regressive, artificial neural network (ANN), and deep neural network (DNN) models were used to predict the price rise and fall, and the performance was compared with NMSE, RMSE, and MAE.
Sak [17] conducted a study to apply time series data, such as speech recognition data, to an RNN-based LSTM model that solved the gradient loss problem of a recurrent artificial neural network(RNN) suitable for time series data analysis. In this study, we showed that the LSTM model converges quickly. Moreover, it provides a state-of-the-art speech recognition performance for models of relatively small size.
3.3. Discussion of Study
We intend to use this section to present the study’s key findings, including the meaning of the findings and the insights derived from them.
At the time of trading, cryptocurrency’s price was determined by supply and demand, and the price fluctuation of cryptocurrency reflects all political and economic information, such as technical, fundamental, emotional, psychological, and financial markets. Furthermore, if minor changes are ignored, the trading price of cryptocurrencies tends to move in the same direction for an extended period.
Another study on a machine learning approach using LSTM for this purpose is as follows [18].
- (i)
- Experiments were conducted to evaluate various statistical and machine learning approaches to study the short-term ability to predict the exchange rate (volatility measurement) of the Bitcoin market against the US dollar [19].
- (ii)
- In a previous study, machine learning techniques such as RNN and LSTM were used to predict the Bitcoin pricing process, and the results were compared with those obtained using the ARIMA model [20].
- (iii)
- Karakoyun et al. (2018) compared the ARIMA time series model and the LSTM deep learning algorithm for Bitcoin price prediction [21].
This model of the trading price of cryptocurrency reflects the psychology of investment. If the psychological properties of investment do not change, the pattern will likely be repeated in the future. In general, technical analysis is a method of predicting the future price by analyzing changes in the trading price using the one-time trading price or trading volume.
Considering the various points of this discussion, this study did not apply many emotional parts that affect the price fluctuations of cryptocurrencies. We wanted to make a time series forecast for two cryptocurrencies. Additionally, we considered not to optimize LSTM. The reason to use this as a basis without optimizing separately was because it requires a standard when learning with data updated every minute.
4. Research Design
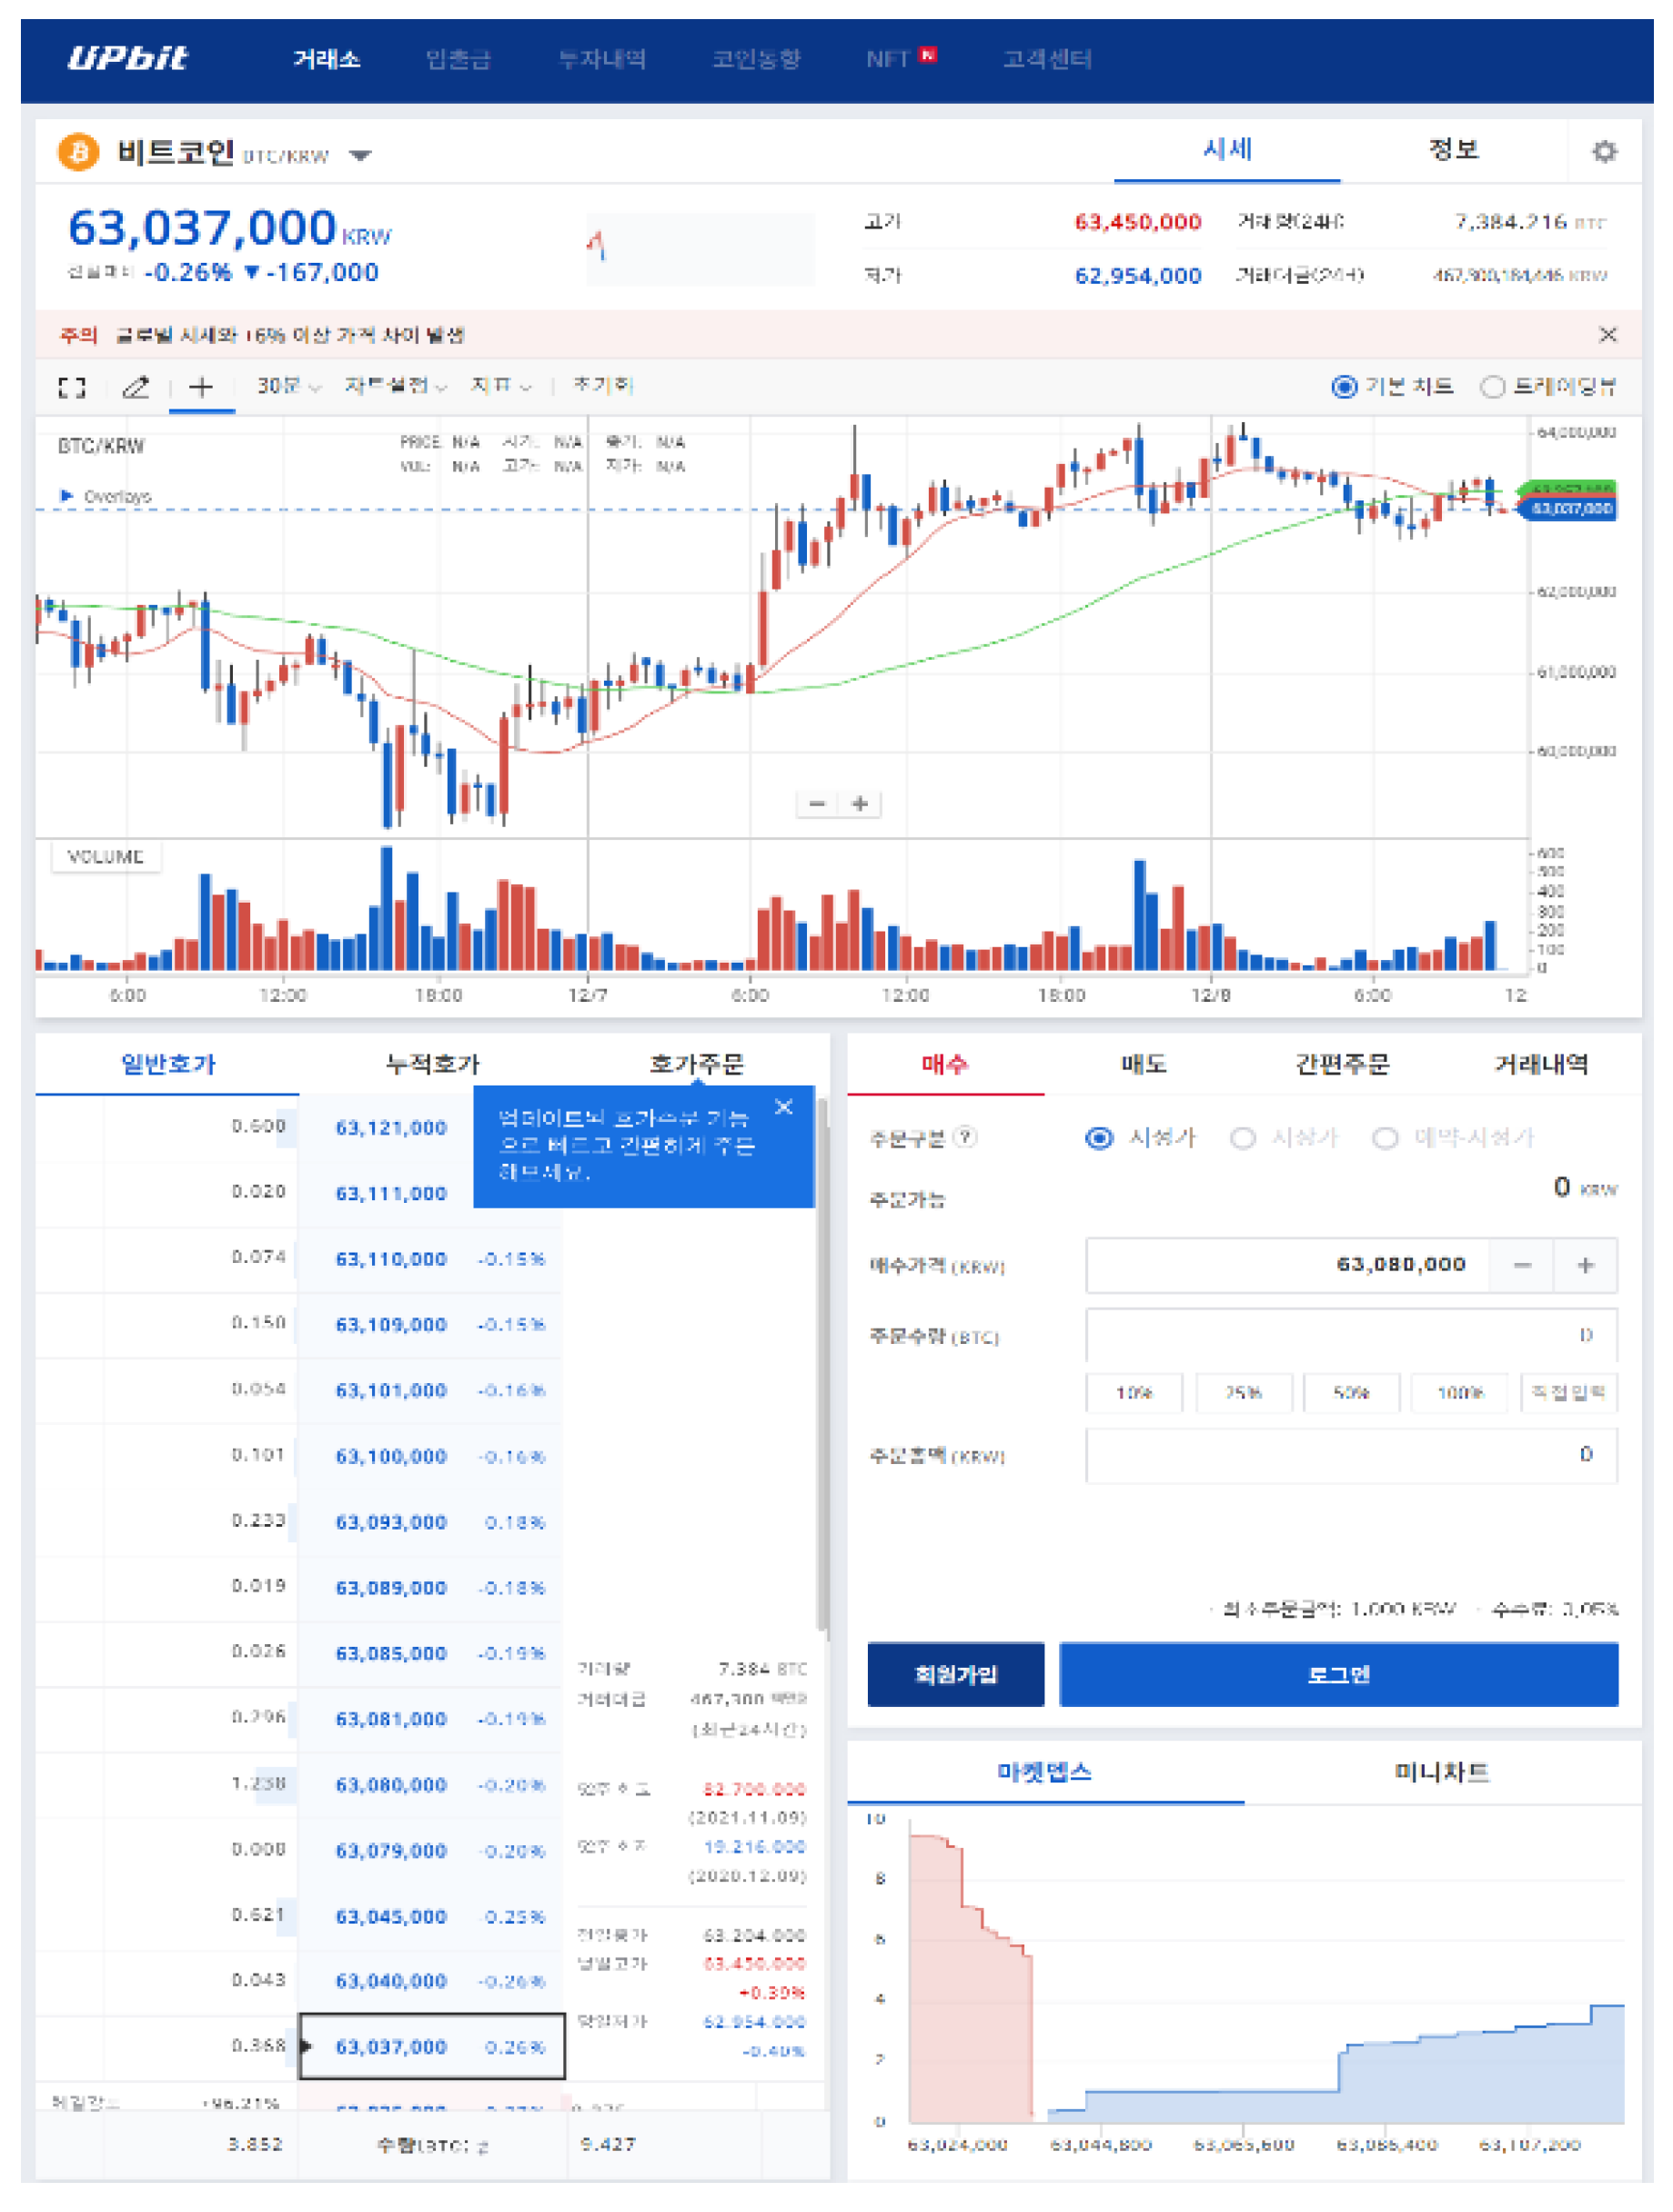
This study focused on the 1 min time series prediction for cryptocurrencies, Bitcoin and Ethereum, in the Upbit market (Figure 2), one of Korea’s online cryptocurrency exchanges. Figure 3 depicts some step screens for the vital issuance service for API.
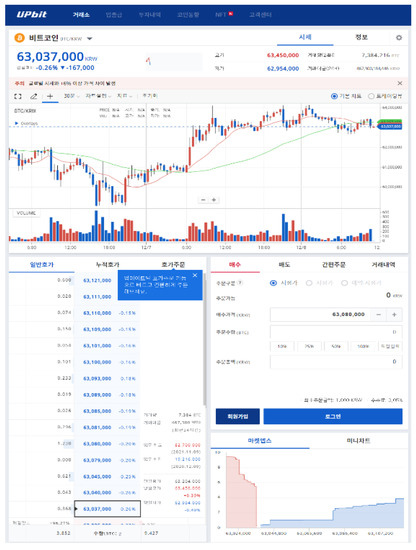
Figure 2.
Interface screen of Upbit, one of the Korean cryptocurrency exchange markets.

Figure 3.
API key issuance screen in Upbit.
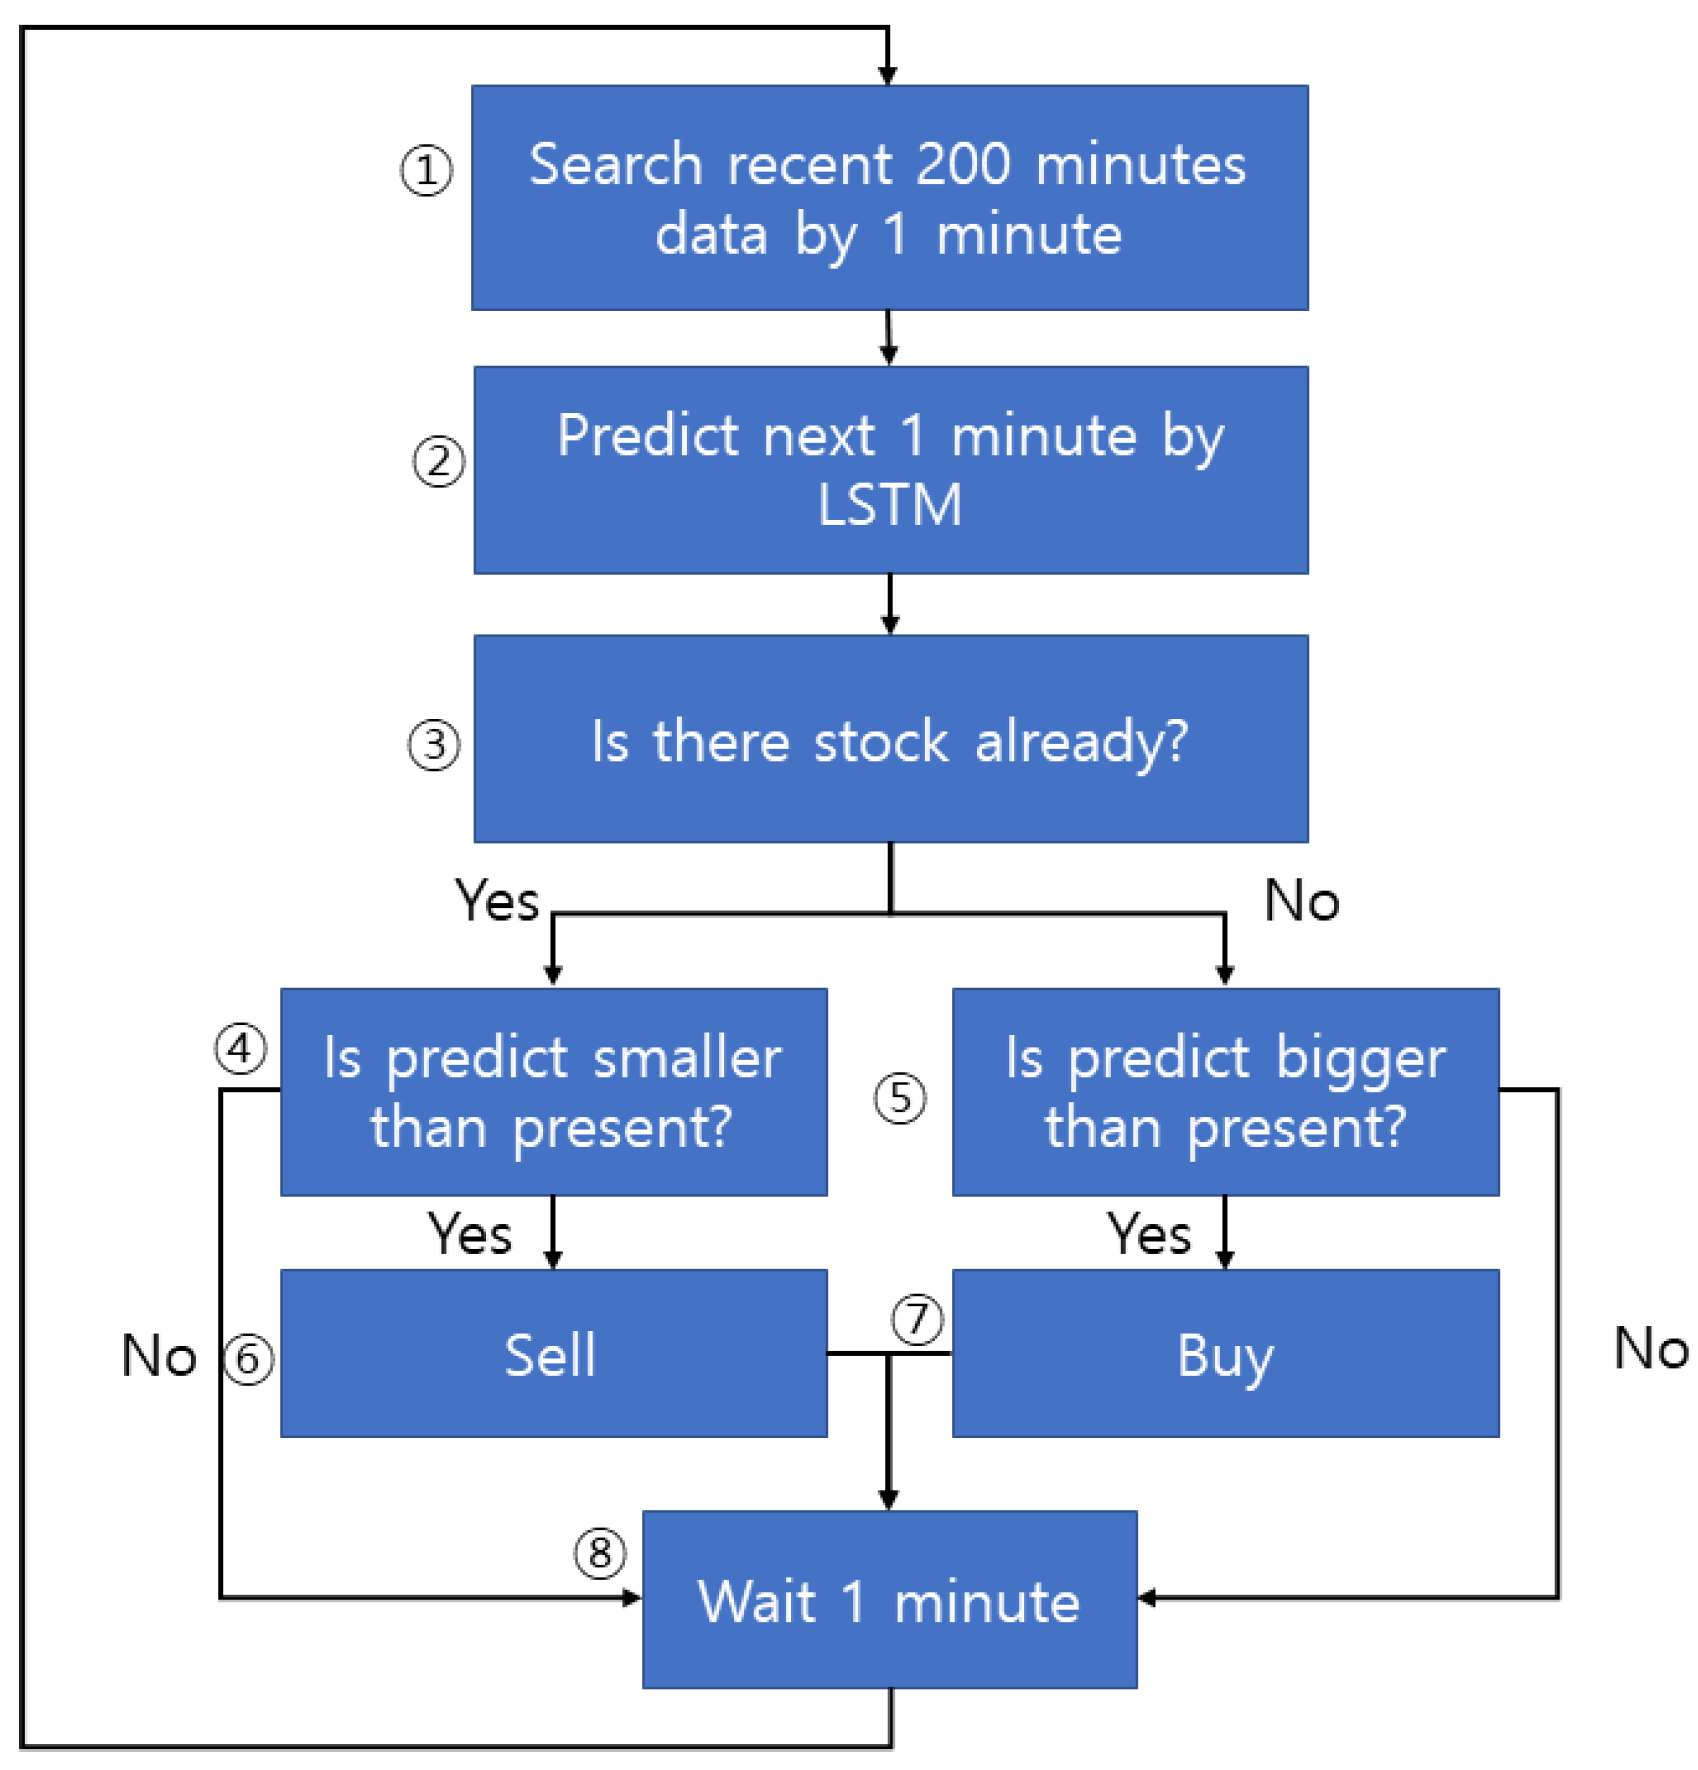
Figure 4 shows the core algorithm of this study, and it goes through a total of eight steps. Accordingly, the explanation of each step is as follows. As shown in (1), the latest 200 cryptocurrency data are imported. Through the Upbit API, only 200 pieces of data for the last minute can be provided; that is, 200 min of data can be secured.
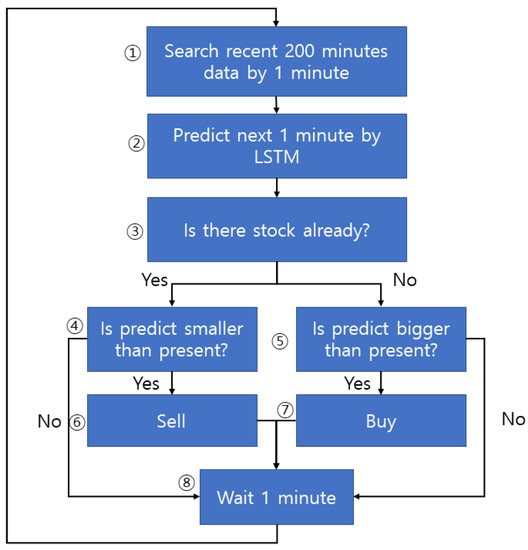
Figure 4.
Cryptocurrency time series analysis algorithm in 1 min units using LSTM.
Furthermore, because it is a Korean site, all bitcoin transactions are conducted in Korean Won (KRW). Each open shown in Table 1 and Table 2 means the market price per minute, high means the highest price per minute, and low means the lowest price per minute. Close refers to the closing price per minute, while volume refers to the cryptocurrency trading volume per minute. Through these 200 pieces of data, the next 1 min LSTM time series prediction is performed, as shown in (2). Then, step (3) checks whether we already have cryptocurrency. Moreover, if we do not have cryptocurrency, as in (5), the predicted value after 1 min is compared to the current value. If the expected value is not greater than the current value, wait 1 min at (8), then go back to (1) and load the following 200 cryptocurrency data.

Table 1.
Examples of the latest five accurate data per minute for Bitcoin.

Table 2.
Examples of the latest five accurate data per minute for Ethereum.
If the predicted value exceeds the current value, buy the cryptocurrency at the current discount as in (7), wait 1 min in (8), then go to (1) and load the following 200 cryptocurrencies. As in (4), if we have cryptocurrency, compare whether the predicted value after 1 min is smaller than the current value. If the expected value is not smaller than the current value, wait 1 min at (8), then go back to (1) and load the following 200 cryptocurrency data. If the predicted value is smaller than the current value, sell the cryptocurrency at the current value as in (6), wait 1 min in (8), go back to (1), and go through the process of retrieving the following 200 cryptocurrencies, and repeat this process.
5. Research Results and Verification
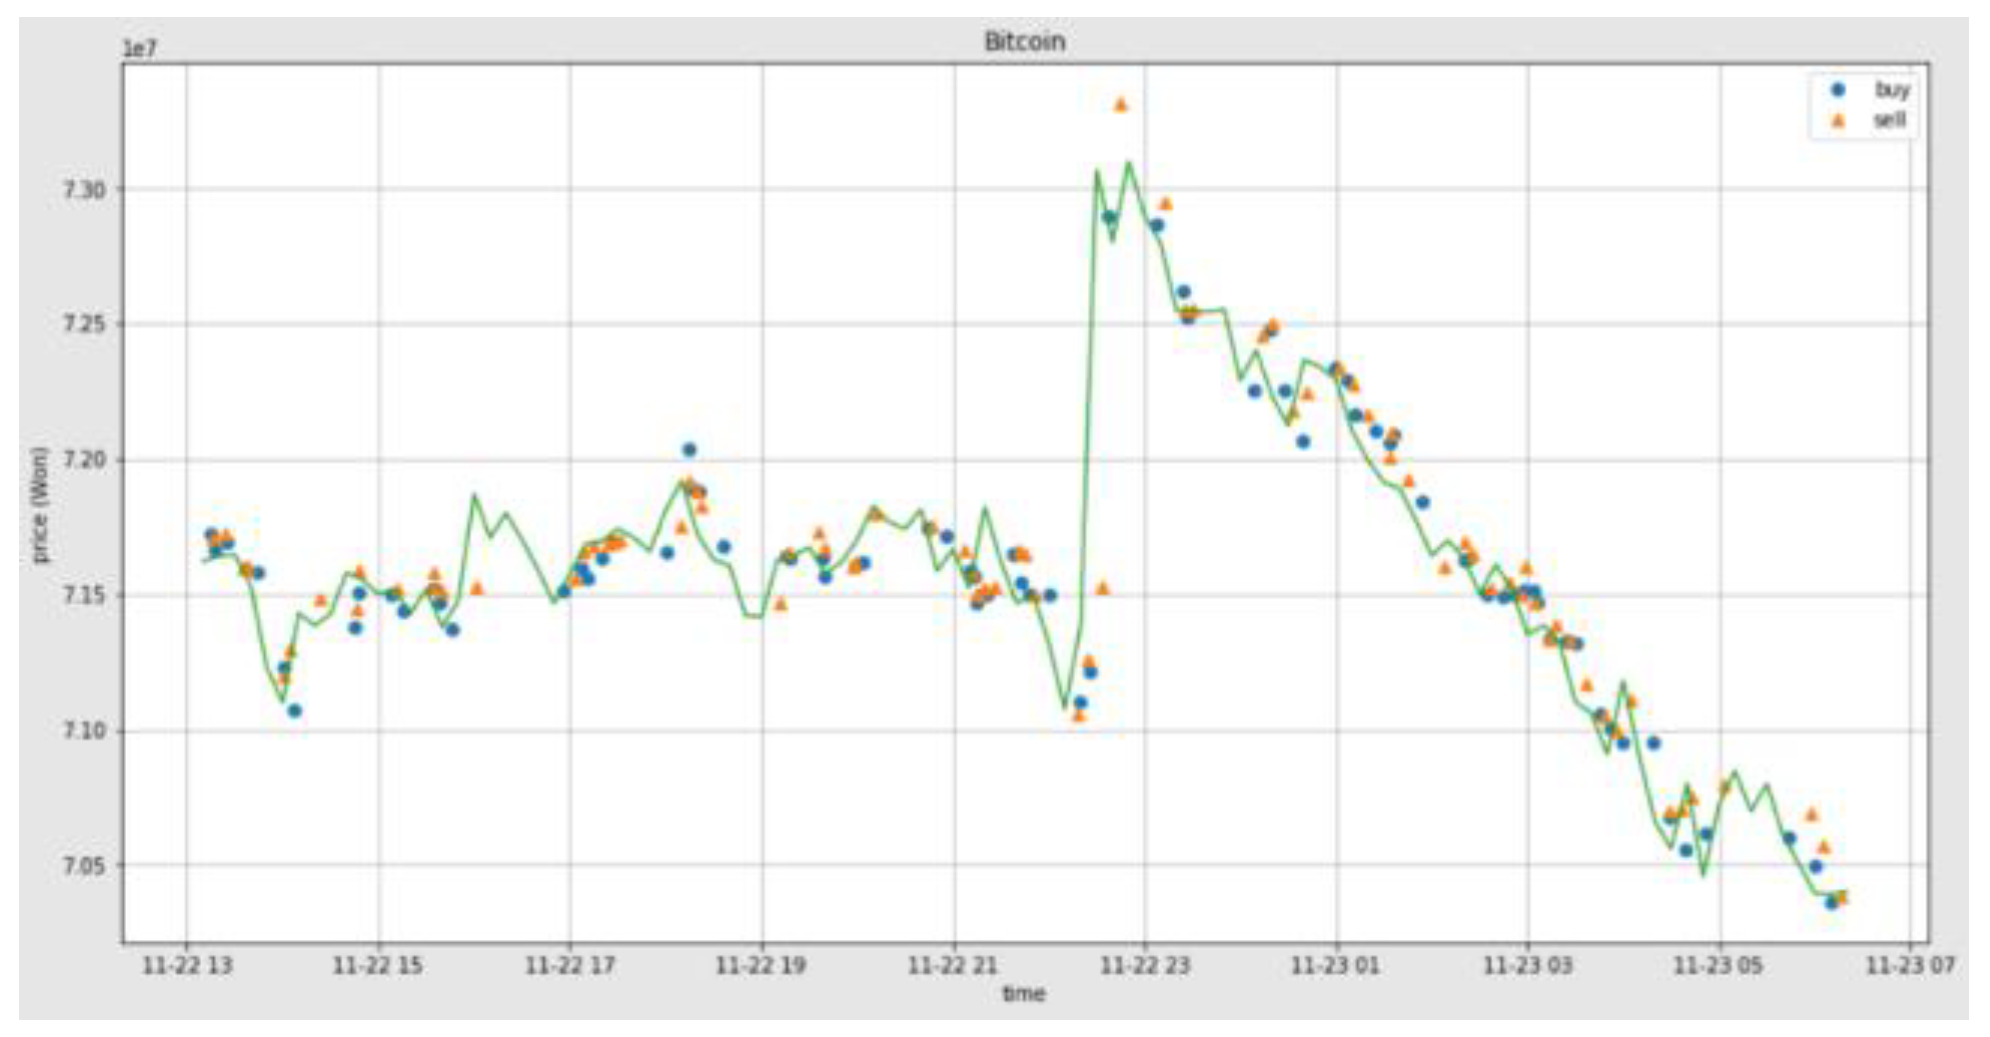
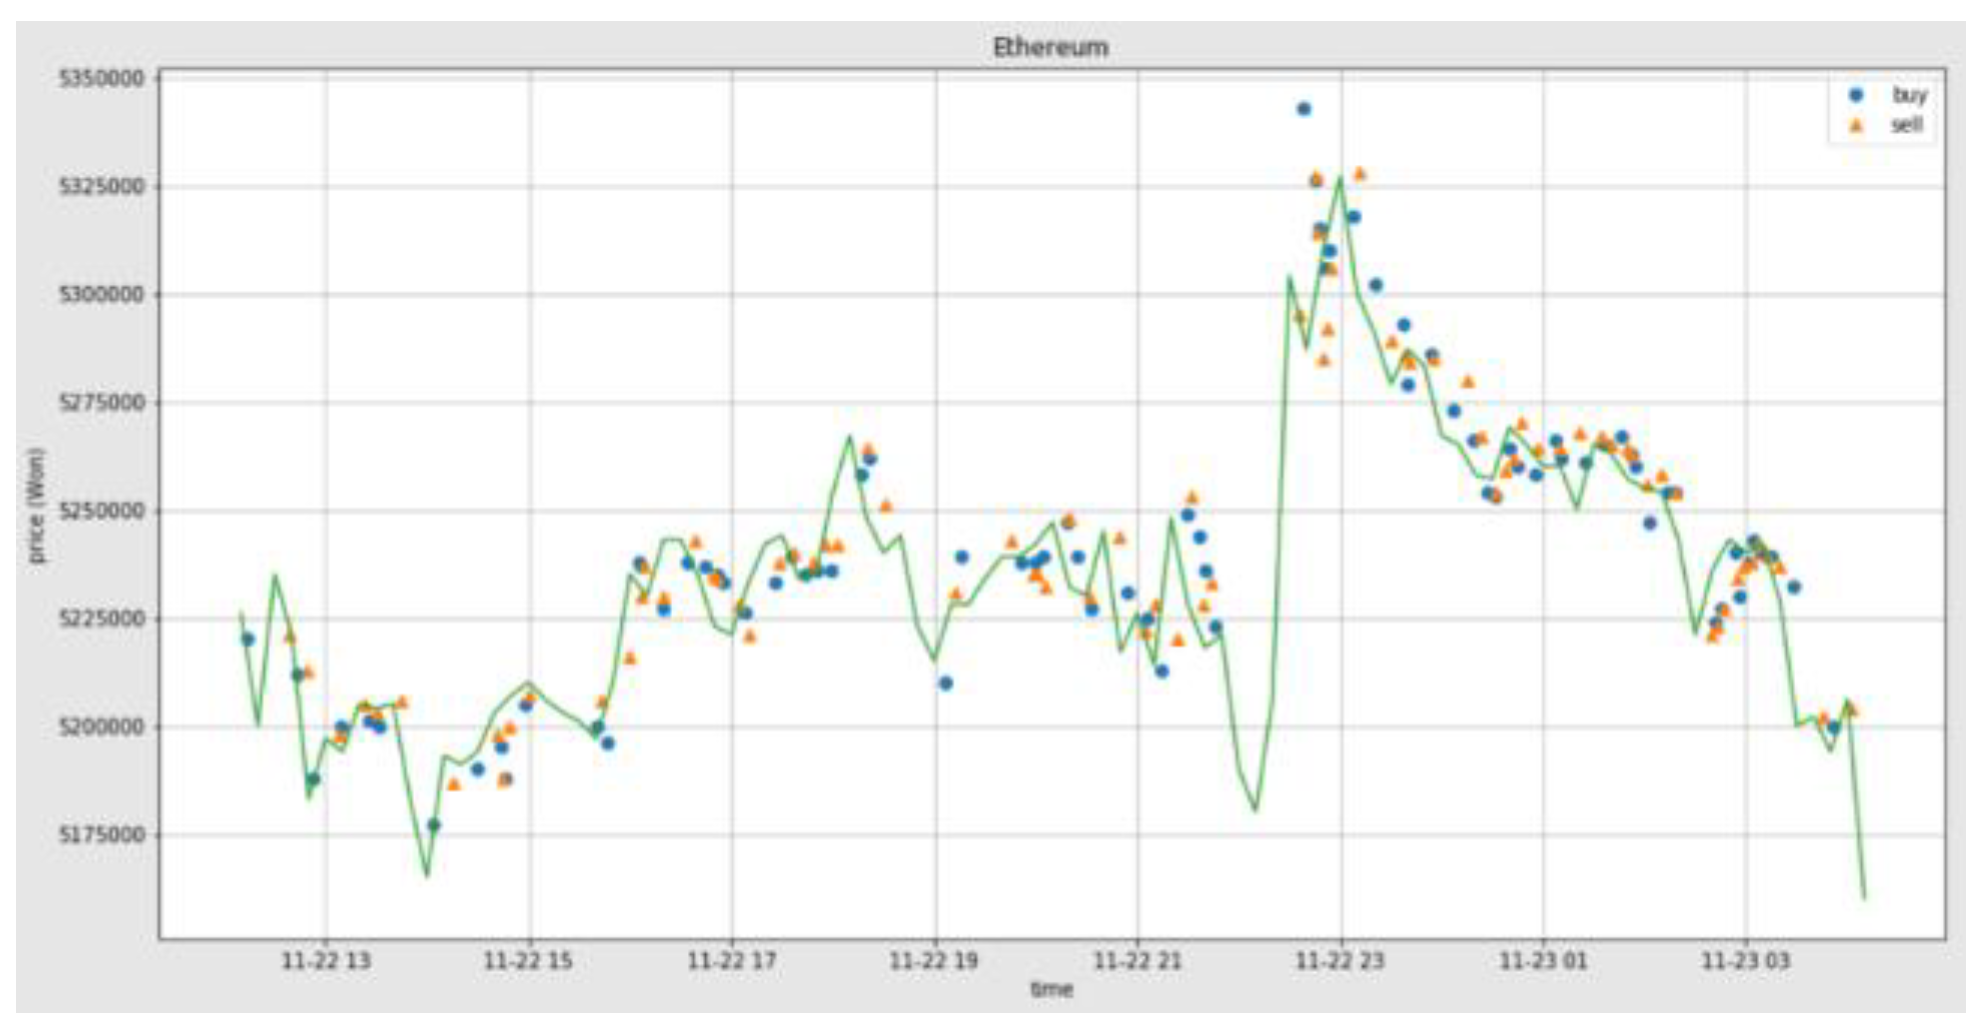
This chapter is a step to verify the contents of the cryptocurrency time series analysis algorithm in 1 min units using LSTM. For this purpose, two cryptocurrencies, Bitcoin (BTC) and Ethereum (ETH) within a limited period were applied to this algorithm and demonstrated. In other words, the uptrend or the downtrend in the next minute was predicted through the latest 200/200 data in units of one minute. Following this prediction, the actual trading of 80 pairs (80 purchasing, 80 selling) was carried out, and the number of trading cases was compared with the experimental results presented in Table 1 and Table 2 as well as Figure 5 and Figure 6.
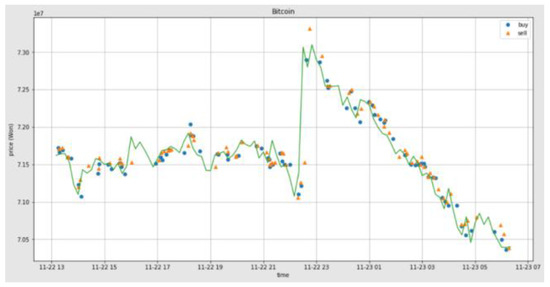
Figure 5.
80 pairs of Bitcoin trading per minute graph.
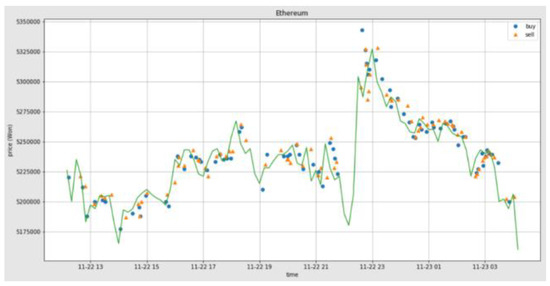
Figure 6.
80 pairs of Ethereum trading per minute graph.
As a result, the values of two cryptocurrencies, Bitcoin and Ethereum, fell somewhat within a limited period. Still, it was confirmed that there was some gain in the experimental results of applying LSTM.
Table 1 shows the latest five accurate data per minute of Bitcoin as an example. Date1 indicates the date and time of purchase and buy suggests the purchase price. Moreover, date2 represents the date and time of selling, and sell represents the selling price. Then, date3 shows the date and time in units of 10 min to show the graph as in Figure 5 and shows the actual price in units of 10 min. In the chart in Figure 5, the circle (blue) indicates buying. Meanwhile, the triangle (red) indicates selling. In addition, date1 and date2 each have 80 data, but only five are shown in Table 1 as examples.
As shown in Figure 5, from 13:10 on 22 November 2021, to 12:50 on 23 November 2021, through 80 pairs of Bitcoin transactions, it is as follows. It returns from an uptrend to a downtrend to buy and sell. 62.5% of the asking price was higher than the asking price, and 78.75% of the next bid price was lower than the asking price.
Table 3 shows the evaluation metrics of Bitcoin buying and selling points. The buying point was 3 for MAE, 0.234375 for MSE, and 0.484122918275927 for RMSE, the selling point was 1.7 for MAE, 0.19375 for MSE, and 0.440170421541475 for RMSE. Here, it was confirmed that a positive gain was taken by selling +12.5% (62.5–50) and buying +28.75% (78.5–50) based on the average value of buying and selling (50%).

Table 3.
Evaluation metrics of result.
If we bought Bitcoin on 22 November 2021, at 13:15 and sold it on 23 November 2021, at 6:16, it would come out at −1,339,000 won. Using the proposed method, a gain of 3,185,000 won was confirmed compared to the previous.
If these parts were summarized in a simple formula, as follows, the result of the actual data for about 24 h in this experiment confirmed that there was a gain of +4.44% as follows.
- a
- The purchase price of the starting point was 71,725,000 won (The buy value of date1 in the first row (No. 1) in Table 1)
- b
- Last selling price of the natural transaction, –1,339,000 won
- c
- The final selling price of this experiment to which LSTM was applied, KRW 1,846,000
- d
- difference of c-b (gain), 3,185,000 won
- e
- Profit rate of this study applying LSTM compared to natural transaction-based on the starting purchase price (percentage of d), +4.44%
Table 2 shows the latest five accurate data per minute of Ethereum as an example. date1 indicates the date and time of purchase and buy the purchase price. Additionally, date2 represents the date and time of selling, and sell represents the selling price. Additionally, date3 shows the date and time in units of 10 min to show the graph as in Figure 5 and shows the actual price in units of 10 min. In the chart in Figure 6, the circle (blue) indicates buying, and the triangle (red) indicates selling. In addition, although date1 and date2 each have 80 data, Table 2 shows only five each as an example.
As shown in Figure 6, buy the selling price when returning to a downtrend after the following bull market through 80 Ethereum trading pairs from 12:13 on 22 November 2021, to 4:02 on 23 November 2021. 58.75% of the purchase price was higher than the selling price, and 62.5% of the following buying price was lower than the selling price.
Table 3 shows the evaluation metrics of Ethereum buying and selling points. The buying point was 3.3 for MAE, 0.3998946875 for MSE, and 0.632301105091554 for RMSE, the selling point was 3 for MAE, 0.234375 for MSE, and 0.484122918275927 for RMSE. Here, based on the average value (50%) of buying and selling, it was confirmed that positive points for gain took the lead of +8.75% (58.75–50) in selling and +12.5% (62.5–50) in buying. This proved that it affects the total gain (+1.36%).
If we bought Ethereum on 22 November 2021, at 12:13 and sold it on 23 November 2021, at 4:02, it would come out at −16,000 won. Using the proposed method, a gain of KRW 71,000 was confirmed compared to the existing process.
If these parts were summarized in a simple formula, as follows, the result of the actual data for about 28 h in this experiment confirmed that there was a gain of +1.36% as follows.
- a
- The purchase price of the starting point was KRW 5,220,000 (The buy value of date1 in the first row (No. 1) in Table 2)
- b
- Last selling price of the natural transaction, –16,000 won
- c
- The final selling price of this experiment to which LSTM is applied was 55,000 won
- d
- difference of c-b (gain), 71,000 won
- e
- Profit rate of this study applying LSTM compared to natural transaction-based on the starting purchase price (percent of d), +1.36%
6. Discussion
Due to the limited data in this study, it is necessary to continue the research to increase the precision by using more types of virtual currency and data of a longer period. Furthermore, it is necessary to study various methods for evaluation. It is also necessary to analyze the flow of the cryptocurrency market in response to economic flows and events across the world.
7. Conclusions
Recently, cryptocurrency has been recognized as money and a commodity with investment value, similar to stocks. Many studies of time series prediction using machine learning and deep learning have shown research results for long-term forecasts, such as daily or weekly. Still, the short-term prediction of 1 min has not been attempted. This study that attempted such a 1 min prediction.
In general, there are many risks in stock investment, and the cryptocurrency market also has a much faster rate of change and a broader scope than the stock market. It is an experiment on efficient trading by determining efficient trading points using machine learning techniques and repeating the LSTM algorithm proposed in this paper. This shows the possibility of time series prediction.
The procedure in the research stage of this study is to determine an efficient trading point using machine learning techniques and then repeat the 1 min cryptocurrency time series analysis algorithm using the LSTM suggested in this work. Although this research primarily focused on equities, this study shows how these algorithms might be used to predict time series in cryptocurrency.
In this study, the uptrend or downtrend in the next minute is predicted through the latest 200/200 data in units of 1 min and compared to the actual number of sales of 80 pairs (80 buys, 80 sells). As a result, the values of two cryptocurrencies, Bitcoin and Ethereum, fell somewhat within a limited period. Still, it was confirmed that there was some gain in the experimental results of applying LSTM.
Author Contributions
Conceptualization, Y.K.; Data curation, Y.K.; Formal analysis, Y.K.; Funding acquisition, Y.-C.B.; Investigation, Y.-C.B.; Methodology, Y.K.; Software, Y.K.; Writing—original draft, Y.K.; Writing—review & editing, Y.-C.B. All authors have read and agreed to the published version of the manuscript.
Funding
This research was financially supported by the Ministry of Small and Medium-sized Enterprises (SMEs) and Startups (MSS), Korea, under the “Regional Specialized Industry Development Plus Program (R&D, S3246057)” supervised by the Korea Institute for Advancement of Technology (KIAT). Additionally, this work was also supported by the Korea Institute for Advancement of Technology (KIAT) grant funded by the Korea Government (MOTIE) (P0016977, The Establishment Project of Industry–University Fusion District).
Conflicts of Interest
The authors declare no conflict of interest.
References
- Jang, E.; Choi, H.; Lee, H. Stock prediction using a combination of BERT sentiment Analysis and Macroeconomy index. J. Korea Soc. Comput. Inf. 2020, 25, 47–56. [Google Scholar] [CrossRef]
- Hong, T.; Kim, E.; Cha, E. The prediction of Dow Jones and S&P500 Index Using SVM and News Sentiment Analysis. J. Internet Electron. Commer. Res. 2017, 17, 23–36. [Google Scholar]
- Kim, S.W. Profitability of Trading System for Cryptocurrency. J. Digit. Contents Soc. 2021, 22, 555–562. [Google Scholar] [CrossRef]
- Available online: https://terms.naver.com/entry.naver?docId=5138095%20&cid=40942&categoryId=32848 (accessed on 9 March 2017).
- Understanding RNNs and LSTMs! Available online: https://ratsgo.github.io/natural%20language%20processing/2017/03/09/rnnlstm/ (accessed on 9 March 2017).
- Hochreiter, S.; Schmidhuber, J. Long Short-Term Memory. Neural Comput. 1997, 9, 1735–1780. [Google Scholar] [CrossRef] [PubMed]
- Understanding LSTM Networks, Retrieve. 2019. Available online: http://colah.github.io/posts/2015-08-Understanding-LSTMs/ (accessed on 9 March 2017).
- Kim, S.-J.; Shon, T.-S. LSTM Autoencoder-Based Insider Data Leak Detection. J. Digit. Contents Soc. 2022, 23, 1159–1166. [Google Scholar] [CrossRef]
- Time Series Analysis. Available online: https://terms.naver.com/entry.naver?docId=839742&cid%20=50376&%20ategoryId=50376 (accessed on 9 March 2017).
- Fischer, T.; Krauss, C. Deep learning with long short-term memory networks for financial market prediction. FAU Discuss. Pap. Econ. 2017, 310–342. [Google Scholar] [CrossRef]
- Lee, J.W. A stock Trading System based on Supervised Learning of Highly Volatile Stock Price Patterns. J. Korean Inst. Inf. Sci. Eng. 2013, 19, 23–29. [Google Scholar]
- Hsu, C. A hybrid procedure for stock price prediction by integrating self-organizing map and genetic programming. Expert Syst. Appl. 2011, 38, 14026–14036. [Google Scholar] [CrossRef]
- Kwon, Y.K.; Choi, S.S.; Moon, B.R. Stock prediction based on financial correlation. In Proceedings of the 7th Annual Conference on Genetic and Evolutionary Computation, Washington, DC, USA, 25–29 June 2005; pp. 2061–2066. [Google Scholar] [CrossRef]
- An, S.M. Deep Learning Architectures and Applications. Korea intelligent information system society, brilliant information study. J. Intell. Inf. Syst. 2016, 22, 127–142. [Google Scholar] [CrossRef]
- Wątorek, M.; Drożdż, S.; Kwapień, J.; Minati, L.; Oświęcimka, P.; Stanuszek, M. Multiscale characteristics of the emerging global cryptocurrency market. Phys. Rep. 2021, 901, 1–82. [Google Scholar] [CrossRef]
- Chong, E.; Han, C.; Park, F.C. Deep learning networks for stock market analysis and prediction: Methodology, data representations, and case studies. Expert Syst. Appl. 2017, 83, 187–205. [Google Scholar] [CrossRef]
- Sak, H.; Senior, A.; Beaufays, F. Long short-term memory recurrent neural network architectures for large scale acoustic modeling. In Proceedings of the Fifteenth Annual Conference of the International Speech Communication Association, Singapore, 14–18 September 2014. [Google Scholar] [CrossRef]
- Wu, C.-H.; Ma, Y.-F.; Lu, C.C.; Lu, R.-S. A New Forecasting Framework for Bitcoin Price with LSTM. In Proceedings of the 2018 IEEE International Conference on Data Mining Workshops (ICDMW), Singapore, 17–20 November 2018. [Google Scholar]
- Guo, T.; Antulov-Fantulin, N. An experimental study of Bitcoin fluctuation using machine learning methods. arXiv 2018, arXiv:1802.04065. [Google Scholar]
- McNally, S.; Roche, J.; Caton, S. Predicting the Price of Bitcoin Using Machine Learning. In Proceedings of the 2018 26th Euromicro International Conference on Parallel, Distributed and Network-Based Processing (PDP), Cambridge, UK, 21–23 March 2018; pp. 339–343. [Google Scholar]
- Karakoyun, E.S.; Cibikdiken, A.O. Comparison of ARIMA Time Series Model and LSTM Deep Learning algorithm for Bitcoin Price Forecasting. In Proceedings of the 13th Multidisciplinary Academic Conference (The 13th MAC 2018), Prague, Czech Republic, 7–9 December 2018; pp. 171–180. [Google Scholar]
Publisher’s Note: MDPI stays neutral with regard to jurisdictional claims in published maps and institutional affiliations. |
© 2022 by the authors. Licensee MDPI, Basel, Switzerland. This article is an open access article distributed under the terms and conditions of the Creative Commons Attribution (CC BY) license (https://creativecommons.org/licenses/by/4.0/).

