Abstract
The determination of existing cable forces is essential for evaluating the performance of bridges. The vibration technique is preferred among available practical methods because it is simple, fast, and economical. To apply this method, many researchers introduced analytical and empirical formulas considering bending rigidity, cable length, and boundary conditions. Nevertheless, most existing procedures to determine cable forces are for single cables, which are unsuitable for cable networks. To measure the cable forces of the cable networks, engineers should remove any cross-ties before conducting field tests. However, the removal of cross-ties separates the cable network into two independent cables, which does not reflect the actual behavior of the cable network. Hence, to save time and improve accuracy, this paper introduces a method to directly identify the cable tensions of a two-cable network without removing any cross-ties. This technique can precisely estimate the cable forces of the two-bending cable networks with arbitrary boundary conditions with an error of less than 1.0 percent.
1. Introduction
Cable forces in cable-stayed bridges may vary in design values due to the adjustment of the cable tension during construction to fit geometric designs. Furthermore, the cable tension may be changed in the service stage due to bridge modifications, such as the change of pavement layers and barriers. Moreover, the cable loading capacity could decrease due to fatigue, anchor damage, and corrosion. If bridge maintenance engineers cannot determine the current cable conditions, failure may occur, such as the collapse of the Nanfangao bridge in Taiwan in 2019. Hence, diagnosing the current cable conditions, including tendon force, anchor rigidity, and bending rigidity, is crucial to bridge safety evaluation at certain confidence levels. Among the known NDT methods for cable force measurements, the vibration technique is simple, fast, and economical. Thus, the vibration technique was used by many researchers, such as Casas [1], Russell and Lardner [2], Cunha et al. [3], Geier [4], and Li et al. [5]. For practical applications, Fang and Wang [6], Marcelo and Carlos [7], Zui et al. [8], and Ren et al. [9] introduced empirical formulas to calculate cable tensions by considering the bending stiffness, the cable length, and the boundary conditions.
Nevertheless, these functional equations are derived for a single cable and, therefore, inappropriate for cable networks where flexible or rigid cross-ties interconnect two or more cables. Suppose the measured frequencies of the cable networks are inputted in these equations to obtain the cable forces of the cable network. In that case, the estimated cable forces are significantly different from the cable network’s actual cable forces because the natural frequencies of the cable networks are much different from those of the single cables. For instance, a cable network is created from two simply supported cables AB and CD, with cable lengths L1 and L2, cable tensions T1 and T2, and interconnected by a rigid cross-tie at nodes N1 and N2 at location l11 and l21 from the left restraints of cable AB and CD, respectively, as shown in Figure 1. (x11, v11), (x12, v12), (x21, v21), and (x22, v22) are the local axes of cable segments 1–1, 1–2, 2–1, and 2–2, respectively. Axis (x, z) is the global coordinate of the cable system. The comparison of the natural frequencies of the cable network and the single cable is shown in Figure 2. The natural frequencies fN at point S1 and S2 on cables AB and CD of the cable network are identical but different from the natural frequency fS at point S1 on single cable 1. Noticeably, the subscript N denotes the cable network and the subscript S denotes the single cable. Since many terms of “frequency” are used in this paper, three terms are defined to classify their uses. The term “computed frequency” is used for the cable frequency computed using backward analysis. The term “natural frequency” is used for the cable frequency obtained from solving the eigenvalue problem. The term “measured frequency” is used for the cable frequency obtained from the field measurements or the finite element models.
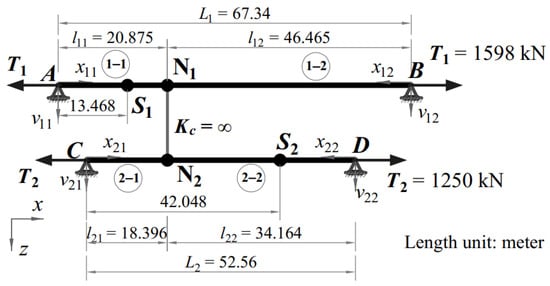
Figure 1.
An example of cable network configuration.
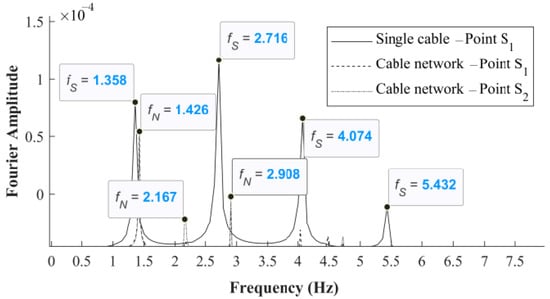
Figure 2.
Comparison of modal frequency spectrum between network cable and single cable.
To apply existing vibration techniques for the cable networks, engineers have to release the cross-ties to separate the cable networks into single cables. Each cable is excited under free vibration to identify the cable tensile force. However, removing the cross-ties will increase the inspection cost and not reflect the cable network’s actual behaviors. Thus, developing a new method to identify the cable forces of a cable network without removing the cross-ties to preserve the accuracy of cable-force identification and reduce the inspection cost is worthy of attention.
Nevertheless, most existing research about cable networks uses forward analysis. In this research, the analytical solutions of cable networks with fixed-end boundary conditions [10,11,12,13,14,15,16,17,18,19], dampers [10,11,17,18], distributed cross-ties [16], and flexible or rigid cross-ties [12,13,14,15] are used to calculate the networks’ natural frequencies from given cable tensions. These analytical solutions are based on string theory and do not consider the cable bending rigidity, which may limit their application to cables with high bending stiffness. Chen et al. [20] and Younespour and Cheng [21] first presented the effect of cable bending stiffness on the behavior of the cable network. The cables were modeled as axially tensioned beams with fixed-end boundary conditions in their cable network models. However, since the boundary conditions of cables are fixed-end, their models may not be appropriate to estimate the internal cable forces of an existing cable network where its boundary conditions are rarely fixed-ends. Hence, it is necessary to develop a method to identify cable forces of cable networks considering cable bending rigidity and actual boundary conditions.
Many previous studies introduced methods to estimate the cable forces of a single cable with partly fixed boundary conditions. Chen et al. [22], Yu [23], and Syamsi et al. [24] introduced a method to determine the cable forces of a cable stayed-bridge based on the effective vibration length with a two-frequency approach. The effective vibration length is the equivalent length that leads the dynamic behaviors of a cable with non-hinged-end supports to be similar to those of a cable with hinged-end supports. Thus, cable force can be obtained from a cable with hinged-end supports and the effective vibration length instead of the cable with partly fixed-end supports and the actual length. In the real application, Chen et al. [22] suggested that the rubber-to-rubber length can be treated as the effective vibration length if multiple measurements are difficult to be conducted. When multiple measurements can be performed, Chen et al. [22] suggested using the vibration signals at five sensor locations to determine the effective vibration length of the cables. However, their technique is appropriate for a single cable.
Wang et al. [25] studied the dynamic behaviors of two bending cable networks with hinged-end boundary conditions. They combined their analytical solution and the ideas of cable vibration effective length [22] to determine the natural frequencies and mode shapes of two bending cable networks with partly fixed-end boundary conditions, which are similar to those of actual cables. This study will follow the combined method promoted by Wang et al. [25] to develop an inverse analysis to identify the cable forces of cable networks with actual boundary conditions, i.e., partly fixed ends, through measured frequencies.
In conclusion, there are many techniques to determine the cable forces of single cables, but few researchers study methods to identify cable forces of cable networks while considering cable bending rigidity and arbitrary boundary conditions. Hence, this study will develop a technique to determine the cable forces of two-bending cable networks with actual boundary conditions without repeated removals of cross-ties. This method is necessary because it can preserve the accuracy of cable-force identification and reduce bridge health monitoring costs.
2. Formulation of Analytical Solution
This Section describes the analytical solution for the dynamic behavior of two bending cable networks interconnected by an inclined flexible cross-tie. Then, the analytical solution will be applied to the backward analysis to identify the cable forces of the cable networks.
2.1. Modeling the Cable System
Two simply supported cables, AB and CD, with cable lengths of Li, average mass per unit lengths of , bending rigidity of EIi,, and cable tension of Ti (i = 1,2), have the same material properties. Notably, i denotes the cable i-th. An inclined flexible cross-tie connects the cables at locations li1 from the left support of cable i-th. The cross-tie has axial stiffness Kc and inclined angle θc. The cross-tie divides each cable into two segments labeled i–j (i, j = 1, 2) with segment length lij. Notably, i–j denotes the segment j-th on the cable i-th. The positive directions of the transverse displacements of each cable segment vij are shown in Figure 3.
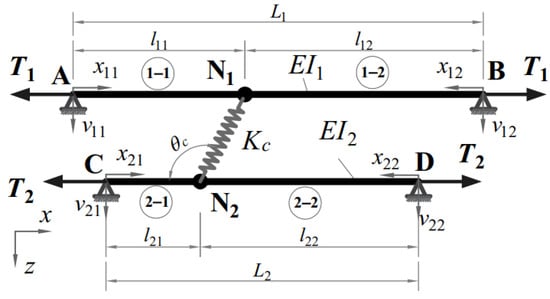
Figure 3.
Network cables modeled as two simply supported cables and a flexible cross-tie.
2.2. Governing Equation of Free Vibration System
To describe the governing equation of the two-bending cable network interconnected using cross-ties, five assumptions are adopted similar to those in research promoted by Wang et al. [25].
By applying Hamilton’s principle to the total energy of the cable system, the governing differential equations of the motion for the axially tensioned beams [26] under free vibration can be obtained:
The solutions of the system can be assumed by using the separation of the variable method as:
where represents the local mode shape of the j-th segment of the i-th cable and h(t) is the time function that indicates the vibration type.
The governing equations for the local mode shape functions can be obtained:
where ω is also the natural frequency of the cable networks.
By solving Equation (3), the local mode shapes of cable segment i–j can be obtained and shown in Equation (4).
where Cij,k (i, j = 1, 2; k = 1, 2, …, 4) are constants and the auxiliary wave number parameters are defined as follows:
Equation (4) has 16 unknown coefficients. Thus, 16 equations of boundary conditions, continuities, and force equilibriums are acquired to determine these unknowns. The boundary conditions of the vertical displacements and curvatures of the cables at the hinged supports are equal to zero.
By applying the boundary condition in Equation (5), the constants Cij,1 and Cij,3 can be determined to equal zero. Hence, 16 unknown constants reduce to 8 unknowns. Then, the local mode shapes of cable segment i–j are rewritten as
For continuity conditions, the vertical displacements and curvatures of the left-side segments equal those of the right-side segments at the cross-tie location. However, the cable slopes are opposite because the positive directions of the xi1 and xi2 (i = 1, 2) axes are reversed. Moreover, the difference between the lateral displacements of Segment 2–1 at x21 = l21 and Segment 1–1 at x11 = l11 equals the vertically projected axial deformation in the cross-tie, as shown in Equation (8). Noticeably, the details of the derivation of Equation (8) may be found in Appendix A.
For the force equilibrium at nodes N1 and N2, as shown in Figure 4, the total vertically projected shears, tensions, and axial force in the cross-tie must equal zero.
where ; θij is small deformation, and then .

Figure 4.
Free body diagram of a cable system. (a) At node N1, (b) At node N2.
In Figure 4, symbols Ti, Vij, Mij,, and θij are the tensions, shears, moments, and slopes of the four segments at location lij, respectively.
The conditions in Equation (7)–(10) are substituted into Equation (6) to solve the 8 unknowns. These equations are written in matrix form, as shown in Equation (11). More details of the matrix form are shown in Appendix B.
For a nontrivial solution of C, the determinant of matrix R must be equal to zero. The analytical expression of the characteristic equation of the two-bending-cable network can be obtained by calculating the determinant of matrix R. The solution is shown in Equation (12)
3. Methodology
This Section will introduce a backward analysis to obtain the cable forces of the cable network and the axial stiffness of the cross-tie by applying the analytical solution described in Section 2. Besides, this section introduces a method to remove bias results of cable force and cross-tie axial stiffness, which may occur during the procedure.
3.1. Statistic Method to Remove Outliers
In this paper, the cable tensions and cross-tie axial stiffness are identified from cable network frequencies that are obtained from acceleration signals at an arbitrary location on the cables of a cable network system under free vibration or ambient vibration. Since some errors may occur during the measurement of cable frequency, estimated cable forces and cross-tie axial stiffness might be biased. Hence, this paper will apply the median absolute deviation (MAD) method in statistics to remove the outliers and improve the method’s accuracy. The median absolute deviation or absolute deviation from the median was discovered and introduced by Hampel [27]. The median (M), similar to the mean value of a data set, has the benefit of being less effective in the occurrence of outliers. The MAD method helps to determine the range that most data points condense. Huber [28] defined the MAD value as follows:
where xi is the data point and b is “a constant linked to the assumption of normality of the data, disregarding the abnormality induced by outliers” [28]. Constant b usually equals 1.4826.
The criteria to detect outliers depend on the researchers’ definition and justification. In general, the decision criteria are defined in Equation (14). If a data point xi is out of the detected range, it is considered an outlier.
where c, varying from 2.0 to 3.0, is a constant related to the researchers’ decision. Leys [29] strongly recommended a threshold of 2.5 as a reasonable choice. Thus, this paper also uses this c constant equal to 2.5 to remove outliers.
3.2. Identification of Cable Forces
The procedure to identify the cable forces of the cable network system is summarized as shown in Figure 5. The procedure contains six steps that are explained as follows:
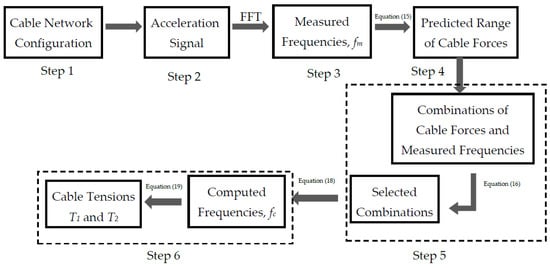
Figure 5.
The cable force identification procedure by using measured vibration data.
Step 1: Collect all necessary information about the cable network, such as material properties (e.g., Young’s modulus E and mass density γ), section properties (e.g., cross-section area A, inertia moment I), the network configuration (e.g., the lengths of two cables Li, four segments lij (i, j = 1, 2) and cross-tie Lc, the inclined angle of the cross-tie θc), cable boundary conditions, and initial cable tensile forces (if possible) of two cables from design documents or field inspection. When the cable boundary conditions differ for hinged–hinged ends, the effective vibration lengths Leff should be determined forehand.
Step 2: Record the acceleration signal at an arbitrary location on the cables of a cable network system under ambient vibration from field measurement. Nevertheless, this paper will generate acceleration signals from a finite element model with known cable internal forces for study purposes. Hence, the accuracy and effectiveness of this method can be verified easily by comparing the obtained cable tensile forces and the known cable tensile forces.
Step 3: Transfer the acceleration signal obtained in Step 2 in the time domain to those in the frequency domain by using the Fast Fourier Transform (FFT) to obtain the measured frequencies fm of the cable networks. For illustration, this study uses ABAQUS code to create a cable network model and obtain the measured frequencies of the cable network.
Step 4: Substitute the measured frequencies in Step 3 and corresponding mode orders into Equation (15) to calculate the mean cable forces. Notably, Equation (15) is the equation to determine the cable force of a single cable with hinged–hinged supports. Nevertheless, if the design documents can provide the initial cable forces of the cable network, this step can be ignored. Then, the predicted ranges of the cable network tensile forces T1 and T2 equal the mean cable forces ± 10% or the designed cable tensions ± 10%.
where, , Li, and EIi are the average mass per unit length, cable length, and cable bending rigidity of cable i (i = 1,2), respectively. n-th is the mode order related to the vibration mode of separated cables. N is the number of modes used to calculate the cable forces of separated cables. is the measured frequency of the cable network obtained from the field measurement or numerical simulation at mode n-th. For cables with full or partly fixed ends, the cable length L is replaced by the effective vibration length Leff.
Step 5: Create numerous combinations of T1, T2,, and the measured frequencies (in Step 3). Then, these combinations are substituted in Equation (16) to identify the cable tensions. Only the combinations that satisfy the condition F(T1, T2, fm) = 0 are selected. If the cable forces of the selected combinations are in the predicted range of the cable force (in Step 4), they could be the cable forces (i.e., T1 and T2) of the cable network. Notably, the values T1 and T2 should vary in a wide range of cable forces to cover the possible cable forces. Nonetheless, the existing cable forces are expected in the predicted ranges. The ranges of T1 and T2 can be, therefore, reduced to the predicted ranges to save computational time.
For cables with fixed or partly fixed ends, the cable lengths Li and segment lengths lij are replaced by the cable effective vibration length Leff,i and leff,ij, respectively. The auxiliary wave number parameters are defined as follows:
Step 6: Substitute the cable forces, i.e., T1 and T2, of the selected combinations (in Step 5) in Equation (18) to compute the cable network frequencies. This study will occupy the mean absolute percentage error (MAPE) method to select the pair of cable tensions T1 and T2 in which the computed frequencies are the closest to the measured frequencies. If T1 and T2 in any combination can provide the minimum MAPE between measured and calculated frequencies, they are identified as the cable tensions of the cable network. The minimum MAPE between measured frequencies fm and the computed frequencies fc are defined as in Equation (19). Notably, the MAPE method is occupied because it is more robust to data with bias measured frequencies. Additionally, the non-zero values of cable network frequencies are suitable for applying the MAPE method. Moreover, the MAPE method can provide relative errors between the measured and computed frequencies. The relative errors are instrumental in judging the error size.
where N is the number of used modes to calculate the cable forces, k indicates the mode k-th, and p indicates the selected combination p-th.
3.3. Identification of the Cross-Tie Axial Stiffness
Since this paper introduces a method to identify the cable forces of the cable network without removing the cross-tie, the axial stiffness of the cross-tie, an important parameter, needs to be determined beforehand. The axial stiffness of the cross-tie can be directly determined from the design document or the relationship among three measured parameters of the cross-tie: the cross-section area, length, and material Young’s modulus. Nevertheless, the material Young’s modulus is difficult to obtain directly from the field measurement. The cross-tie must be released and sent to a material laboratory to acquire the Young’s modulus using a tensile test. This procedure is time-consuming and the tensile test also damages the cross-tie sample. Hence, this paper will introduce a dynamic method to determine the axial stiffness of the cross-tie from the measured frequencies of the cable network. This dynamic method can directly obtain the cross-tie’s axial stiffness at the inspection field and does not damage it. The procedure to obtain the axial stiffness of the cross-tie from the dynamic measurement is described as follows:
The cross-tie is released to transform the cable network into two independent cables. Each cable is excited by an impulse load to obtain acceleration signals under free vibration at five locations. The acceleration signals at five locations are used to determine the measured cable frequency, cable force, cable vibration effective length, and cable bending rigidity.
The cross-tie is reconnected to form the cable network. Then, the cable network is excited by an impulse load to obtain an acceleration signal under free vibration at any location on Cable 1 or 2. The acceleration signals are transferred in the time domain to those in the frequency domain by using FFT to obtain the measured frequencies. Since the cable force, cable vibration effective length, and measured cable frequencies are known, the cross-tie axial stiffness can be obtained using Equation (20). For cables with full or partly fixed ends, the cable lengths Li and segment lengths lij are replaced by the cable effective vibration length Leff,i and leff,ij, respectively.
Equation (20) can be reformed as follows:
where A, B, and C variables are defined as follows:
Since this study uses the measured frequencies to obtain the axial stiffness of the cross-tie by Equation (21), some abnormal axial stiffness values may occur due to the error of the measured frequencies. These abnormal axial stiffness values are treated as outliners and can be removed using the MAD method.
4. Application of Cable Force Identification Method
In this Section, this paper will do two numerical examples to explain and verify the accuracy and efficiency of this method in identifying the cable forces of a two-cable network. The Matlab program is employed for calculating the cable force, cross-tie axial stiffness, and data statistics. As mentioned in Section 3, this study uses ABAQUS code to create a cable network model and obtain the measured frequencies. The pretension cables with initial stress are modeled using 100 B21 beam elements. The cross-tie is modeled using a T2D2 truss element. The cable boundary conditions are dependent on the study cases described in Section 4.1 and Section 4.2. The measured frequencies and acceleration data are extracted from the ABAQUS results.
4.1. A Two-Cable Network with Hinged-End Supports
In this case study, two cables have similar cross-sections and materials but vary in cable lengths and tensions. The cable properties are selected from the cable network of the stay cables on the Fred Hartman Bridge [14]. The flexible cross-tie is located at the position of 0.400L1 and 0.429L2 from the left-side supports of Cables 1 and 2, respectively. The boundary conditions of the two cables are hinged ends, as shown in Figure 6.
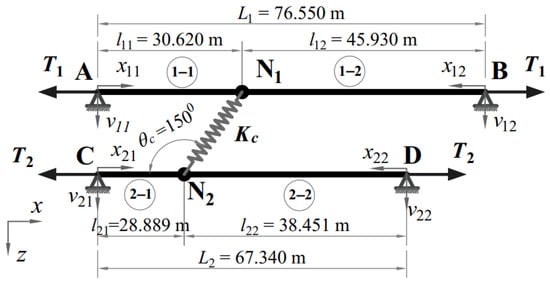
Figure 6.
Cable network’s configuration with hinged-end supports.
Step 1: All necessary information on the cable network is listed as follows:
Step 2 + 3: The cable network model is created in ABAQUS to obtain measured frequencies at the first 10 modes, as shown in Table 1.

Table 1.
Measured frequencies of the cable network with hinged-end support determined by ABAQUS.
Step 4: In the following step, the predicted cable forces are calculated using Equation (15). From the observation of many study cases of two-cable networks, we found that the fundamental natural frequency of the cable network is usually closest to the fundamental natural frequencies of the single Cables 1 and 2. Hence, we use the fundamental measured frequency of the cable network to compute the predicted range of cable forces 1 and 2. For higher modes, the mode order is selected by the smallest difference between the cable forces obtained from the fundamental measured frequency and those obtained from the other measured frequencies and the corresponding mode order. For example, the second measured frequency of the cable network, i.e., 2.2564 Hz, is used to calculate the predicted cable force of single Cable 1. If the mode order equal to 1 is selected, the predicted cable force of the single Cable 1 is 5711.79 kN. If the mode order equal to 2 is selected, the predicted cable force of the single Cable 1 is 1410.90 kN. Since the cable force difference of 1974.93 kN and 5711.79 kN is larger than that of 1974.93 kN and 1410.90 kN, the selected mode order is 2. Higher modes follow the same procedure. The predicted value of cable forces is shown in Table 2.

Table 2.
The predicted values of cable forces.
By applying the MAD technique, the detected ranges of the cable forces are from 1498.83 kN to 2355.9 kN for the first single cable and from 1022.23 kN to 1995.03 kN for the second single cable. The cable forces out of the detected ranges are removed, and the cable forces inside the detected ranges are shown in Table 3

Table 3.
The refinement of the predicted values of cable forces.
Finally, the cable forces of Cable 1 are predicted from 1784.69 kN to 2181.28 kN (1982.98 kN ± 10%), and those of Cable 2 are predicted from 1281.69 kN to 1734.05 kN (1507.87 kN ± 10%).
Step 5: In this step, the measured frequencies of the cable network from mode 1 to mode 10 and the cable forces T1 and T2 varying from 1784.69 kN to 2181.28 kN and from 1281.69 kN to 1734.05 kN are used to create numerous combinations, such as (1784.69 kN, 1715.42 kN, 1.3278 Hz), (1919.67 kN, 1588.03 kN, 2.6883 Hz), (1784.69 kN, 1293.34 kN, 6.6917 Hz), etc. These combinations are substituted into Equation (16) to find the combinations that satisfy the condition F(T1,T2,fm) = 0. Thirty examples in numerous satisfied combinations are listed in Table 4 for reference.

Table 4.
Thirty combinations in numerous satisfied combinations.
Step 6: For identifying the most appropriate cable tensions, T1 and T2 in numerous selected combinations obtained in Step 5 are introduced in Equation (18) to calculate the cable network frequencies. The MAPE values of thirty satisfying combinations are shown in Table 5 for reference. The combination with the minimum MAPE of computed frequencies, as defined in Equation (19), provides the most accurate cable tensions T1 and T2. The combination with T1 = 1899.82 kN and T2 = 1589.19 kN has the minimum MAPE of computed frequencies at 0.11%. Hence, the cable tensions, i.e., T1 = 1899.82 kN and T2 = 1589.19 kN with errors of 0.00% and 0.55%, respectively, are identified as the cable forces of the cable network. Noticeably, the relative errors are calculated by comparing the obtained cable forces in this stage and the known cable forces in Step 1. This method is proved effective and precise in identifying the cable tensions of a general cable network with an inclined flexible cross-tie at arbitrary locations.

Table 5.
MAPE of thirty satisfying combinations.
4.2. A Two-Cable Network with Mixed Boundary Conditions
In this case study, the cable network configurations are similar to those in the previous case study but different in the boundary conditions. The supports of Cables 1 and 2 are fixed–fixed ends and hinged–fixed ends, respectively, as shown in Figure 7. The cable forces and axial stiffness of the cross-tie are assumed to be unknown. The values of the cable forces and the cross-tie axial stiffness shown below are just for verifying this method.
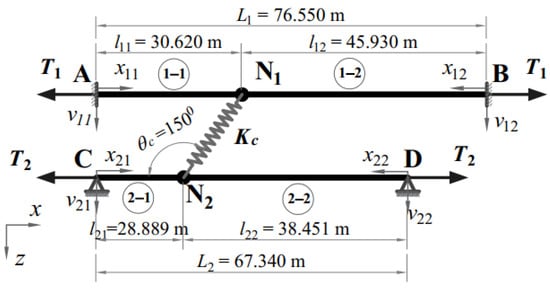
Figure 7.
Cable network’s configuration with mixed boundary conditions.
Step 1: All necessary information on the cable network is listed as follows
Since the boundary conditions of Cable 1 are not hinged–hinged supports, the analytical solutions in Equation (16) and (18) are not suitable for identifying the cable forces and computed frequencies of the cable network. For applying the solutions of the model with hinged-end supports, the effective vibration length of Cable 1 must be determined beforehand. Then, the actual cable length is replaced with the effective vibration length to transform Cable 1 with fixed-end supports into the cable with hinged-end supports. The effective vibration length of Cable 1 is determined by the technique proposed by Chen et al. [22]. However, since their technique is appropriate for a single cable, the cables of the cable network need to be separated by releasing the cross-tie. Although the cross-tie is required to be removed in this stage, it is necessary to obtain the effective vibration length and other unknown parameters of the cable network, such as the axial stiffness of the cross-tie and the current cable forces. It is noted that the cross-tie is required to be removed one time only. For later measurements such as cable health monitoring, the cable forces can be identified directly without further removing the cross-tie. The effective vibration length of Cable 1 is determined by using the vibration signals at five sensor locations. The cable configurations and sensor locations on Cable 1 are shown in Figure 8. The measured frequency spectra of the single Cable 1 at five sensor locations under free vibration are shown in Figure 9.

Figure 8.
Five sensor locations on Cable 1.

Figure 9.
Measured frequency spectra of the single cable at five sensor locations on Cable 1.
By applying the Chen et al. [22] method, the cable effective vibration lengths and cable tensions of single Cables 1 and 2 at the first five modes are obtained and shown in Table 6. The mean value of effective vibration lengths in five modes is the equivalent lengths of Cable 1 with hinged–hinged supports. Since the supports of Cable 2 are hinged-ends, the effective vibration lengths of Cable 2 are equal to the actual length of Cable 2, namely 67.34 m.

Table 6.
Cable effective vibration lengths of the single Cable 1.
By replacing the actual cable lengths with the effective vibration lengths and fixed-end supports with hinged-end supports, the original configuration of the cable network is transferred to the equivalent configuration, as shown in Figure 10.
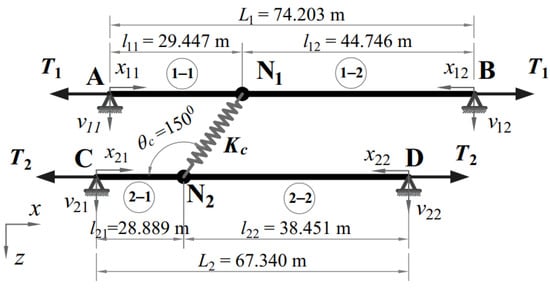
Figure 10.
Equivalent configuration of the cable network.
In the following step, this study determines the axial stiffness of the cross-tie for cable force identification later. The cable network obtained from the ABAQUS simulation is shown in Table 7.

Table 7.
Measured frequencies of the cable network obtained from free vibration.
By introducing cable forces, cable effective vibration length, and measured frequencies obtained from the previous step into Equation (21) the axial stiffness of the cross-tie Kc can be estimated and shown in Table 8.

Table 8.
Estimated axial stiffness of the cross-tie.
Since the axial stiffness of the cross-tie is always positive, the estimated Kc at modes 1 and 9 can be ignored. By applying the MAD method, the detected range of the cross-tie axial stiffness is from 2758.9 kN to 4732.2 kN. Thus, the estimated Kc at modes 3, 5, and 7 can also be ignored. The mean value of the other estimated Kc is 3884.98 kN, approximately 13.43% error compared to the exact value of Kc. The error of the estimated Kc, namely more than 10%, is acceptable because it does not affect the cable force identification much. The explanation will be discussed later. Then, this paper uses the estimated Kc equal to 3884.98 kN to identify the cable forces of the cable network.
Step 2 + 3: The measured frequencies obtained from the ABAQUS simulation are shown in Table 7.
Since the supports of Cable 1 in this case study are fixed-end supports, the measured frequencies of the cable network in this case study are slightly higher than those in the previous study case.
Step 4: Since the cable forces of single cables are determined in Step 1, these values are beneficial for calculating the cable network’s predicted range of cable forces. Then, we can expect the cable forces from 1705.91 kN to 2085.00 kN (1895.45 kN ± 10%) for Cable 1 and from 1436.87 kN to 1756.17 kN (1596.52 kN ± 10%) for Cable 2.
Step 5: In this step, the cable network’s measured frequencies from mode 1 to mode 10 and the cable forces T1 varying from 1705.91 kN to 2085.00 kN, and T2 varying from 1436.87 kN to 1756.17 kN are used to create numerous combinations, such as (1744.02 kN, 1755.80 kN, 1.3498 Hz), (1705.91 kN, 1680.99 kN, 2.7178 Hz), (1833.19 kN, 1627.74 kN, 5.5268 Hz), etc. These combinations are substituted into Equation(16) to find the combinations that satisfy the condition F(T1,T2,fm) = 0. Thirty examples in numerous satisfied combinations are listed in Table 9 for reference.

Table 9.
Thirty combinations in numerous satisfied combinations.
Step 6: Cable forces T1 and T2 in numerous selected combinations obtained in Step 5 are introduced in Equation (18) to calculate the cable network frequencies. The MAPE values of thirty satisfying combinations are shown in Table 10 for reference. The combination with T1 = 1892.02 kN and T2 = 1597.78 kN has the minimum MAPE of the computed frequencies at 0.07%. Hence, the cable tensions, namely T1 = 1892.02 kN and T2 = 1597.78 kN with errors of 0.42% and 0.01%, respectively, are identified as the cable forces of the cable network. Noticeably, the relative errors are calculated by comparing the obtained cable forces in this step and the known cable forces in Step 1.

Table 10.
MAPE of thirty satisfied combinations.
Although the error of the estimated Kc is more than 10.0%, the error of the identified cable forces is less than 1.0%. To evaluate the effect of the error size of the estimated Kc on the correctness of the cable force identification, the authors will vary the error of the estimated Kc in a wide range from −40% to 50%. The relationship between the relative error of Kc and the relative errors of T1 and T2 is shown in Figure 11. Though the relative error of the estimated Kc is significant, the effect on the correctness of the cable force identification is minor. The relative error of the estimated Kc does not affect the relative error of the cable force identification of Cable 1. Nevertheless, the relative error of the estimated Kc has a slightly inverted influence on the cable force identification of Cable 2. Since this study uses the equivalent cable network configuration, the intersection point of lines T1 and T2 occurs at −13.43% of Kc error. For the cable network with all hinged-end supports, the intersection point of lines T1 and T2 will occur at 0.0% of Kc error.
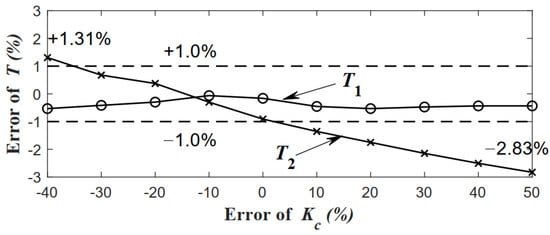
Figure 11.
Relationship between the relative error of Kc and relative errors of T1 and T2.
5. Conclusions
This current search attempts to develop a method to determine the cable forces of a two-bending cable network interconnected by a flexible cross-tie. Errors of less than 1.0 percent prove the method’s accuracy. The following conclusions can be drawn.
For estimating the predicted range of cable forces, it is better to use the value from the design document or field measurement of a single cable. In the case of insufficient information, the measured frequencies of cable networks could be used to calculate the predicted cable tensions using Equation (15). For determining the cable’s effective vibration lengths, it is better to use the vibration signals at five sensor locations. However, if multiple measurements are difficult to be conducted, the effective vibration lengths can be obtained from the rubber-to-rubber lengths of the cables.
The dynamic experiment can determine the axial stiffness of the cross-tie without damaging the cross-tie. The accuracy of the axial stiffness determination just lightly affects the accuracy of the cable force identification. Hence, the cross-tie axial stiffness can be determined approximately. Although this method requires the release of the cross-tie to obtain the precise cable effective vibration lengths and axial stiffness of the cross-tie, this requirement is performed only once. Hence, this method can avoid repeated cross-tie removal, which helps preserve the accuracy of cable-force identification and reduce the bridge health monitoring cost.
Author Contributions
C.-Y.W.: Advisor, Conceptualization, Methodology, Writing—Review and Editing. V.-S.N.: Conceptualization, Methodology, Formal Analysis, Numerical Simulation, Validation, Data Curation, Visualization, and Writing—Original draft. M.I.S.: Software, Data curation, and Visualization. H.-L.W.: Conceptualization, Writing—Review and Editing. All authors have read and agreed to the published version of the manuscript.
Funding
This research received no external funding.
Institutional Review Board Statement
Not applicable.
Informed Consent Statement
Not applicable.
Data Availability Statement
Not applicable.
Conflicts of Interest
The authors declare no conflict of interest.
Appendix A
This section derives the continuity condition as shown in Equation (8).
Figure A1 presents the deformation of the cables and cross-tie at the cross-tie location. Because the axial deformation of the cables is ignored, the horizontal distance N1N2 is constant during the vibration. Hence, we will have the relationship:
The vertical displacement of the cross-tie during the system vibration is calculated as:
The deformed length of the cross-tie during the system vibration can be obtained as:
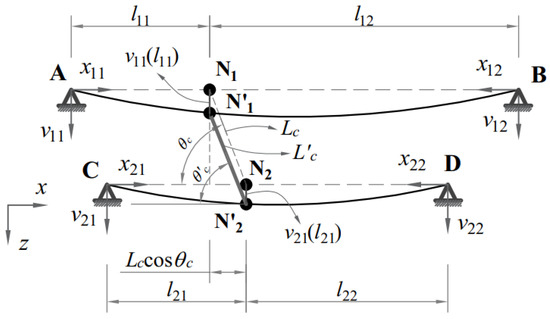
Figure A1.
Deformed shape of the cables and cross-tie.
For the flexible cross-link as in cable-stayed bridges, due to the restrain of the cross-tie, the relative vertical displacement of two adjacent cables is minimal compared to the length of the cross-link, i.e., . Hence, for small deformation, the deformed length of the cross-tie can be approximately determined by neglecting the high-order term and using the approximation .
Since the axial deformation of the cross-tie equals the ratio of axial force Tc and axial stiffness Kc, we will have the relationship as in Equation (A6):
Appendix B
This section derives the analytical solution of the two-cable network. Considering the boundary conditions, continuity conditions and force equilibrium are substituted in Equation (6) to determine the 8 unknown constants, that is Cij,k (i, j = 1, 2; k = 2, 4).
The mode shape function of the cable segment is rewritten as:
The continuity condition of the lateral displacements at xij = lij, namely , is introduced to Equation (A8) to obtain:
The continuity condition of the cable slopes at xij = lij, namely , is introduced to Equation (A8) to obtain:
The continuity condition of the cable curvatures at xij = lij, namely , is introduced to Equation (A8) to obtain:
From the force equilibrium in the vertical direction at node N1 in Equation (9) and the condition in Equation (8), we have:
Differentiating the mode shapes in Equation (A8) and introducing them into Equation (A12) to obtain:
From the force equilibrium in the vertical direction at node N2 in Equation (10) and the condition in Equation(8), we have:
Differentiating the mode shapes in Equation (A8) and introducing them into Equation (A15) to obtain:
Equations from (A9) to (A17) are presented in matrix form for a better expression:
where
For a nontrivial solution of C, the determinant of matrix R must equal zero. The determinant of matrix R is shown in Equation (A19):
References
- Casas, J.R. A Combined Method for Measuring Cable Forces: The Cable-Stayed Alamillo Bridge, Spain. Struct. Eng. Int. 1994, 4, 235–240. [Google Scholar] [CrossRef]
- Russell, J.C.; Lardner, T.J. Experimental determination of frequencies and tension for elastic cables. J. Eng. Mech. 1998, 124, 1067–1072. [Google Scholar] [CrossRef]
- Cunha, A.; Caetano, E.; Delgado, R. Dynamic tests on large cable-stayed bridge. J. Bridge Eng. 2001, 6, 54–62. [Google Scholar] [CrossRef]
- Geier, R.; de Roeck, G.; Flesch, R. Accurate cable force determination using ambient vibration measurements. Struct. Infrastruct. Eng. 2006, 2, 43–52. [Google Scholar] [CrossRef]
- Li, H.; Zhang, F.; Jin, Y. Real-time identification of time-varying tension in stay cables by monitoring cable transversal acceleration. Struct. Control Health Monit. 2013, 21, 1100–1117. [Google Scholar] [CrossRef]
- Fang, Z.; Wang, J.Q. Practical Formula for Cable Tension Estimation by Vibration Method. J. Bridge Eng. 2012, 17, 161–164. [Google Scholar] [CrossRef]
- Marcelo, A.C.; Carlos, A.P. Determination of the axial force on stay cables accounting for their bending stiffness and rotational end restraints by free vibration tests. J. Sound Vib. 2008, 317, 127–141. [Google Scholar] [CrossRef]
- Zui, H.S.; Shinke, T.; Namita, Y.S. Practical Formulas for Estimation of Cable Tension by Vibration Method. J. Struct. Eng. 1996, 122, 651–665. [Google Scholar] [CrossRef]
- Ren, W.X.; Chen, G.; Hu, W.H. Empirical Formulas to Estimate Cable Tension by Cable Fundamental Frequency. Struct. Eng. Mech. 2005, 20, 363–380. [Google Scholar] [CrossRef]
- Ahmad, J.; Cheng, S.; Ghrib, F. Combined effect of external damper and cross-tie on the modal response of hybrid two-cable networks. J. Sound Vib. 2018, 417, 132–148. [Google Scholar] [CrossRef]
- Zhou, H.J.; Yang, X.; Sun, L.; Xing, F. Free vibrations of a two-cable network with near-support dampers and a cross-link. Struct. Control Health Monit. 2015, 22, 1173–1192. [Google Scholar] [CrossRef]
- Ahmad, J.; Cheng, S. Effect of cross-link stiffness on the in-plane free vibration behaviour of a two-cable network. Eng. Struct. 2013, 52, 570–580. [Google Scholar] [CrossRef]
- Caracoglia, L.; Jones, N.P. In-plane dynamic behavior of cable networks. Part 1: Formulation and basic solutions. J. Sound Vib. 2005, 279, 969–991. [Google Scholar] [CrossRef]
- Caracoglia, L.; Jones, N.P. In-plane dynamic behavior of cable networks. Part 2: Prototype prediction and validation. J. Sound Vib. 2005, 279, 993–1014. [Google Scholar] [CrossRef]
- Ahmad, J.; Cheng, S. Analytical study on in-plane free vibration of a cable network with straight alignment rigid cross-ties. J. Vib. Control 2013, 21, 1299–1320. [Google Scholar] [CrossRef]
- Jing, H.Q.; He, X.H.; Zou, Y.F.; Wang, H.F. In-plane modal frequencies and mode shapes of two stay cables interconnected by uniformly distributed cross-ties. J. Sound Vib. 2018, 417, 38–55. [Google Scholar] [CrossRef]
- Sun, L.M.; Hong, D.X.; Chen, L. In-plane free vibrations of shallow cables with cross-ties. Struct. Control Health Monit. 2019, 26, e2421. [Google Scholar] [CrossRef]
- Gian, F.G.; Luca, C. Effects of modeling nonlinearity in cross-ties on the dynamics of simplified in-plane cable networks. Struct. Control Health Monit. 2012, 19, 348–369. [Google Scholar] [CrossRef]
- Gian, F.G.; Bernardo, B.; Luca, C. Stochastic unilateral free vibration of an in-plane cable network. J. Sound Vib. 2015, 340, 95–111. [Google Scholar] [CrossRef]
- Chen, W.; Zhang, Z.; Zhen, X.; Li, M. Effect of bending stiffness on the in-plane free vibration characteristics of a cable network. J. Mech. Sci. Technol. 2020, 34, 4439–4463. [Google Scholar] [CrossRef]
- Younespour, A.; Cheng, S. In-plane modal responses of two-cable networks considering cable bending stiffness effect. Eng. Struct. 2021, 230, 111691. [Google Scholar] [CrossRef]
- Chen, C.C.; Wu, W.H.; Huang, C.H.; Lai, G. Determination of stay cable force based on effective vibration length accurately estimated from multiple measurements. Smart Struct. Syst. 2013, 11, 411–433. [Google Scholar] [CrossRef]
- Yu, C.P. Tension prediction of straight cables based on effective vibration length with a two-frequency approach. Eng. Struct. 2020, 222, 111121. [Google Scholar] [CrossRef]
- Syamsi, M.I.; Wang, C.Y.; Nguyen, V.S. Tension force identification for cable of various end-restraints using equivalent effective vibration lengths of mode pairs. Measurement 2022, 197, 111319. [Google Scholar] [CrossRef]
- Wang, C.Y.; Nguyen, V.S.; Syamsi, M.I.; Wang, H.L. Vibration of two in-plane simply supported bending cables interconnected by a flexible cross-link. J. Mech. 2022, 38, 345–366. [Google Scholar] [CrossRef]
- Rao, S.S. Vibration of Continuous Systems; John Wiley & Sons, Inc.: Hoboken, NJ, USA, 2007; pp. 352–357. [Google Scholar]
- Hampel, F.R. The influence curve and its role in robust estimation. J. Am. Stat. Assoc. 1974, 69, 383–393. [Google Scholar] [CrossRef]
- Huber, P.J. Robust Statistics; John Wiley: New York, NY, USA, 1981. [Google Scholar]
- Leys, C.; Ley, C.; Klein, O.; Bernard, P.; Licata, L. Detecting outliers: Do not use standard deviation around the mean, use absolute deviation around the median. J. Exp. Soc. Psychol. 2013, 49, 764–766. [Google Scholar] [CrossRef]
Publisher’s Note: MDPI stays neutral with regard to jurisdictional claims in published maps and institutional affiliations. |
© 2022 by the authors. Licensee MDPI, Basel, Switzerland. This article is an open access article distributed under the terms and conditions of the Creative Commons Attribution (CC BY) license (https://creativecommons.org/licenses/by/4.0/).