1. Introduction
Cancer is a physical disease in which some human body cells get out of control and spread to other parts of the body. Many types of lung cancer are found in men, women, and children and are the leading cause of death. According to the World Health Organization (WHO) [
1], there were 2.09 million cases of lung cancer registered in 2018, and 1.76 million people died of lung cancer. The most common cause of cancer-related death is lung cancer. Cancer of the lungs can start in the windpipe, central airway, or lungs. It is brought on by the unregulated growth and spread of certain organisms. People who have a lung ailment, such as emphysema and prior chest problems, have a higher risk of being diagnosed with lung cancer [
2].
In males and women’s excessive tobacco use, cigarettes, and beads are the leading causes of lung cancer. There are relatively few smokers, indicating fewer smoker additional elements that contribute to the development of lung cancer. Time plays an essential role in diagnosing the disease. Late detection of lung cancer is the leading cause of death from lung cancer. Treatment of a patient’s disease depends on the diagnosis of the disease and the type of disease. Primary lung cancer begins in the lungs, whereas secondary lung cancer begins in the lungs and spreads to other body regions. Dimensions of cancer stage are determined by the size of the tumor and how far it has spread [
3].
Researchers have used several methods to detect cancer before symptoms appear, such as early-stage examination. In addition, new strategies for predicting the success of cancer therapy have been developed [
4]. Massive datasets for cancer have been collected and made available to medical researchers due to the advancement of new tools in medicine. The most difficult challenge, however, is precisely forecasting disease outcome. As a result, current research focuses on using machine-learning techniques to discover and identify models and relationships between them from large datasets. The data are analyzed to extract helpful information supporting disease prediction and to improve models that accurately predict patient health [
5].
Large datasets frequently harm machine-learning systems’ performance and accuracy levels. Datasets with high-dimensional characteristics have a higher processing complexity and predictions take longer. A solution to the problem posed by complex datasets is ranking and selection [
6]. In the machine-learning sector, several attribute and selection strategies have been presented. The primary goal of these approaches is to eliminate unnecessary, misleading, or redundant features, as these attributes increase the size of the search area, making it impossible to analyze data further and frustrating the learning process. The process of selecting the best traits from all the attributes used to distinguish classes is known as attribute and ranking selection [
7].
To overcome the issue, early detection of lung cancer benefits therapy choices and increases the odds of a patient surviving a lung cancer infection. Using a Hybrid Genetic and Support Vector Machine (GA-SVM) methodology, this study proposes a method for identifying lung cancer patients. To estimate postoperative life expectancy, ensemble machine-learning techniques were applied. The article also presents a strategy for estimating a patient’s life expectancy following thoracic surgery after the detection of cancer. To perform the prediction, hybrid machine-learning methods were applied. In ensemble machine-learning algorithms, attribute ranking and selection are critical components of robust health outcome prediction. To enhance the efficacy of algorithms in health data analysis, we propose three attribute ranking and selection procedures. Compared to other machine-learning techniques, GA-SVM achieves an accuracy of 85% and a higher F1 score of 0.92. The proposed algorithm was compared with two recent state-of-the-art techniques and its performance level was ranked superior to those of its counterparts.
The rest of the paper is structured as follows:
Section 2 provides a brief overview of machine-learning algorithms and attribute ranking and selection approaches used for illness diagnosis and prediction.
Section 3 treats of the specifics of the suggested methodologies and the dataset. The findings of the experiments are presented in
Section 4.
Section 5 and
Section 6 contain the results and the conclusions.
2. Related Work
Machine-learning takes AI software further by allowing intelligent components to learn based on past work or data extrapolations. A program performs complex decision-making procedures and learns from past activity as it moves along. The following summarizes the research publications on lung cancer diagnosis using various machine-learning techniques [
6], comparing techniques such as Decision Trees, Naive Bayes, and Artificial Neural Networks for predicting postoperative life expectancy in lung cancer patients by utilizing predictive data mining algorithms.
The researchers used a stratified 10-fold cross-validation comparison analysis; accuracy was tested using the earlier algorithms for each classifier, and a calculation was made [
7]. With the lung cancer dataset presented in this paper, distinct outcomes were produced for each classifier. KNN, SVM, NN, and Random Forest classifiers were implemented, and the appropriate accuracy rates were obtained. With 85% accuracy, the GA-SVM approach is the most accurate. The proposed method was tested on a medical dataset, and it assisted clinicians to make more accurate decisions.
Various segmentation techniques have been discussed, such as Naive Bayes, Hidden Markov Models, and others [
8]. A thorough explanation of how and why various segmentation algorithms are utilized to detect lung tumors has been provided [
9]. It was demonstrated how to make a basic flowchart for a brain tumor detection system. The three most extensively used statistical approaches for predicting survival or complications for LCPs are Kaplan–Meier curves, multivariable logistic regression, and Cox regression [
10]. Mangat and Vig [
11] suggested an association rule approach based on a dynamic particle swarm optimizer, with an accuracy of 82.18% in classification. Saber Iraji [
12] examined the accuracy of adaptive fuzzy neural networks, extreme learning machines, and neural networks in predicting LCP survival one year after surgery.
The boosted support vector machine (SVM) technique was utilized by Tomczak et al. [
13] to predict the postoperative survival of LCPs. The problem of class imbalance occurs when one class of data in a dataset is much bigger than the others [
14]. The subject of unbalanced data categorization has been widely discussed and extensively explored during the last few decades. There are two primary study paths discussed in the available articles on unbalanced data processing methods: data-level and algorithm-level paths [
15]. By resampling the input data, the data-level processing methods establish a balanced class distribution.
Ensemble learning and cost-sensitive learning are the two fundamental features of algorithm-level processing approaches. The synthetic minority oversampling technique (SMOTE) is one of the most extensively utilized unbalanced data-processing methods because it is both easy and effective [
16]. When SMOTE is employed alone, however, it is likely to be unsatisfactory or even counterproductive, because its blind oversampling overlooks sample distribution, such as the presence of noise [
17,
18].
Two types of data mining strategies were discussed along with their categorization methods; Naive Bayes and SVM are two statistical approaches:
Methods of data compression: decision trees, neural networks;
Discussions on various datasets were held.
2.1. Genetic Algorithm
There are three essential design options when using a GA to address an issue. A candidate solution representation must be chosen and encoded on the GA chromosome, a fitness function must be specified to evaluate the quality of each candidate solution, and, finally, GA run parameters must be specified, including which genetic operators to use, such as crossover, mutation, selection, and the probability of risk. For the SVM classifier, a GA technique was utilized to choose a set of suitable finite feature subsets [
19].
2.2. Support Vector Machine
SVMs (Support Vector Machines) are binary linear regression types that are not probabilistic. If a set of training data has been identified as one of two sets, the method displays them in space and specifies a hyper-plane that is the furthest away from both to divide them. “The maximal margin hyper-plane” is the name of the plane. If a linear separation is not achievable, the approach uses kernel methods to provide a non-linear mapping to the feature space. In this method, a non-linear decision boundary in the input space is represented by the hyper-plane in the feature space. When the data are noisy, one disadvantage of SVMs is that they are prone to overfitting. The following expression is used to calculate the fitness probability of a single chromosome:
where
shows the fitness probability of the
chromosome and
shows the fitness value of the
chromosome.
3. Proposed Methodology
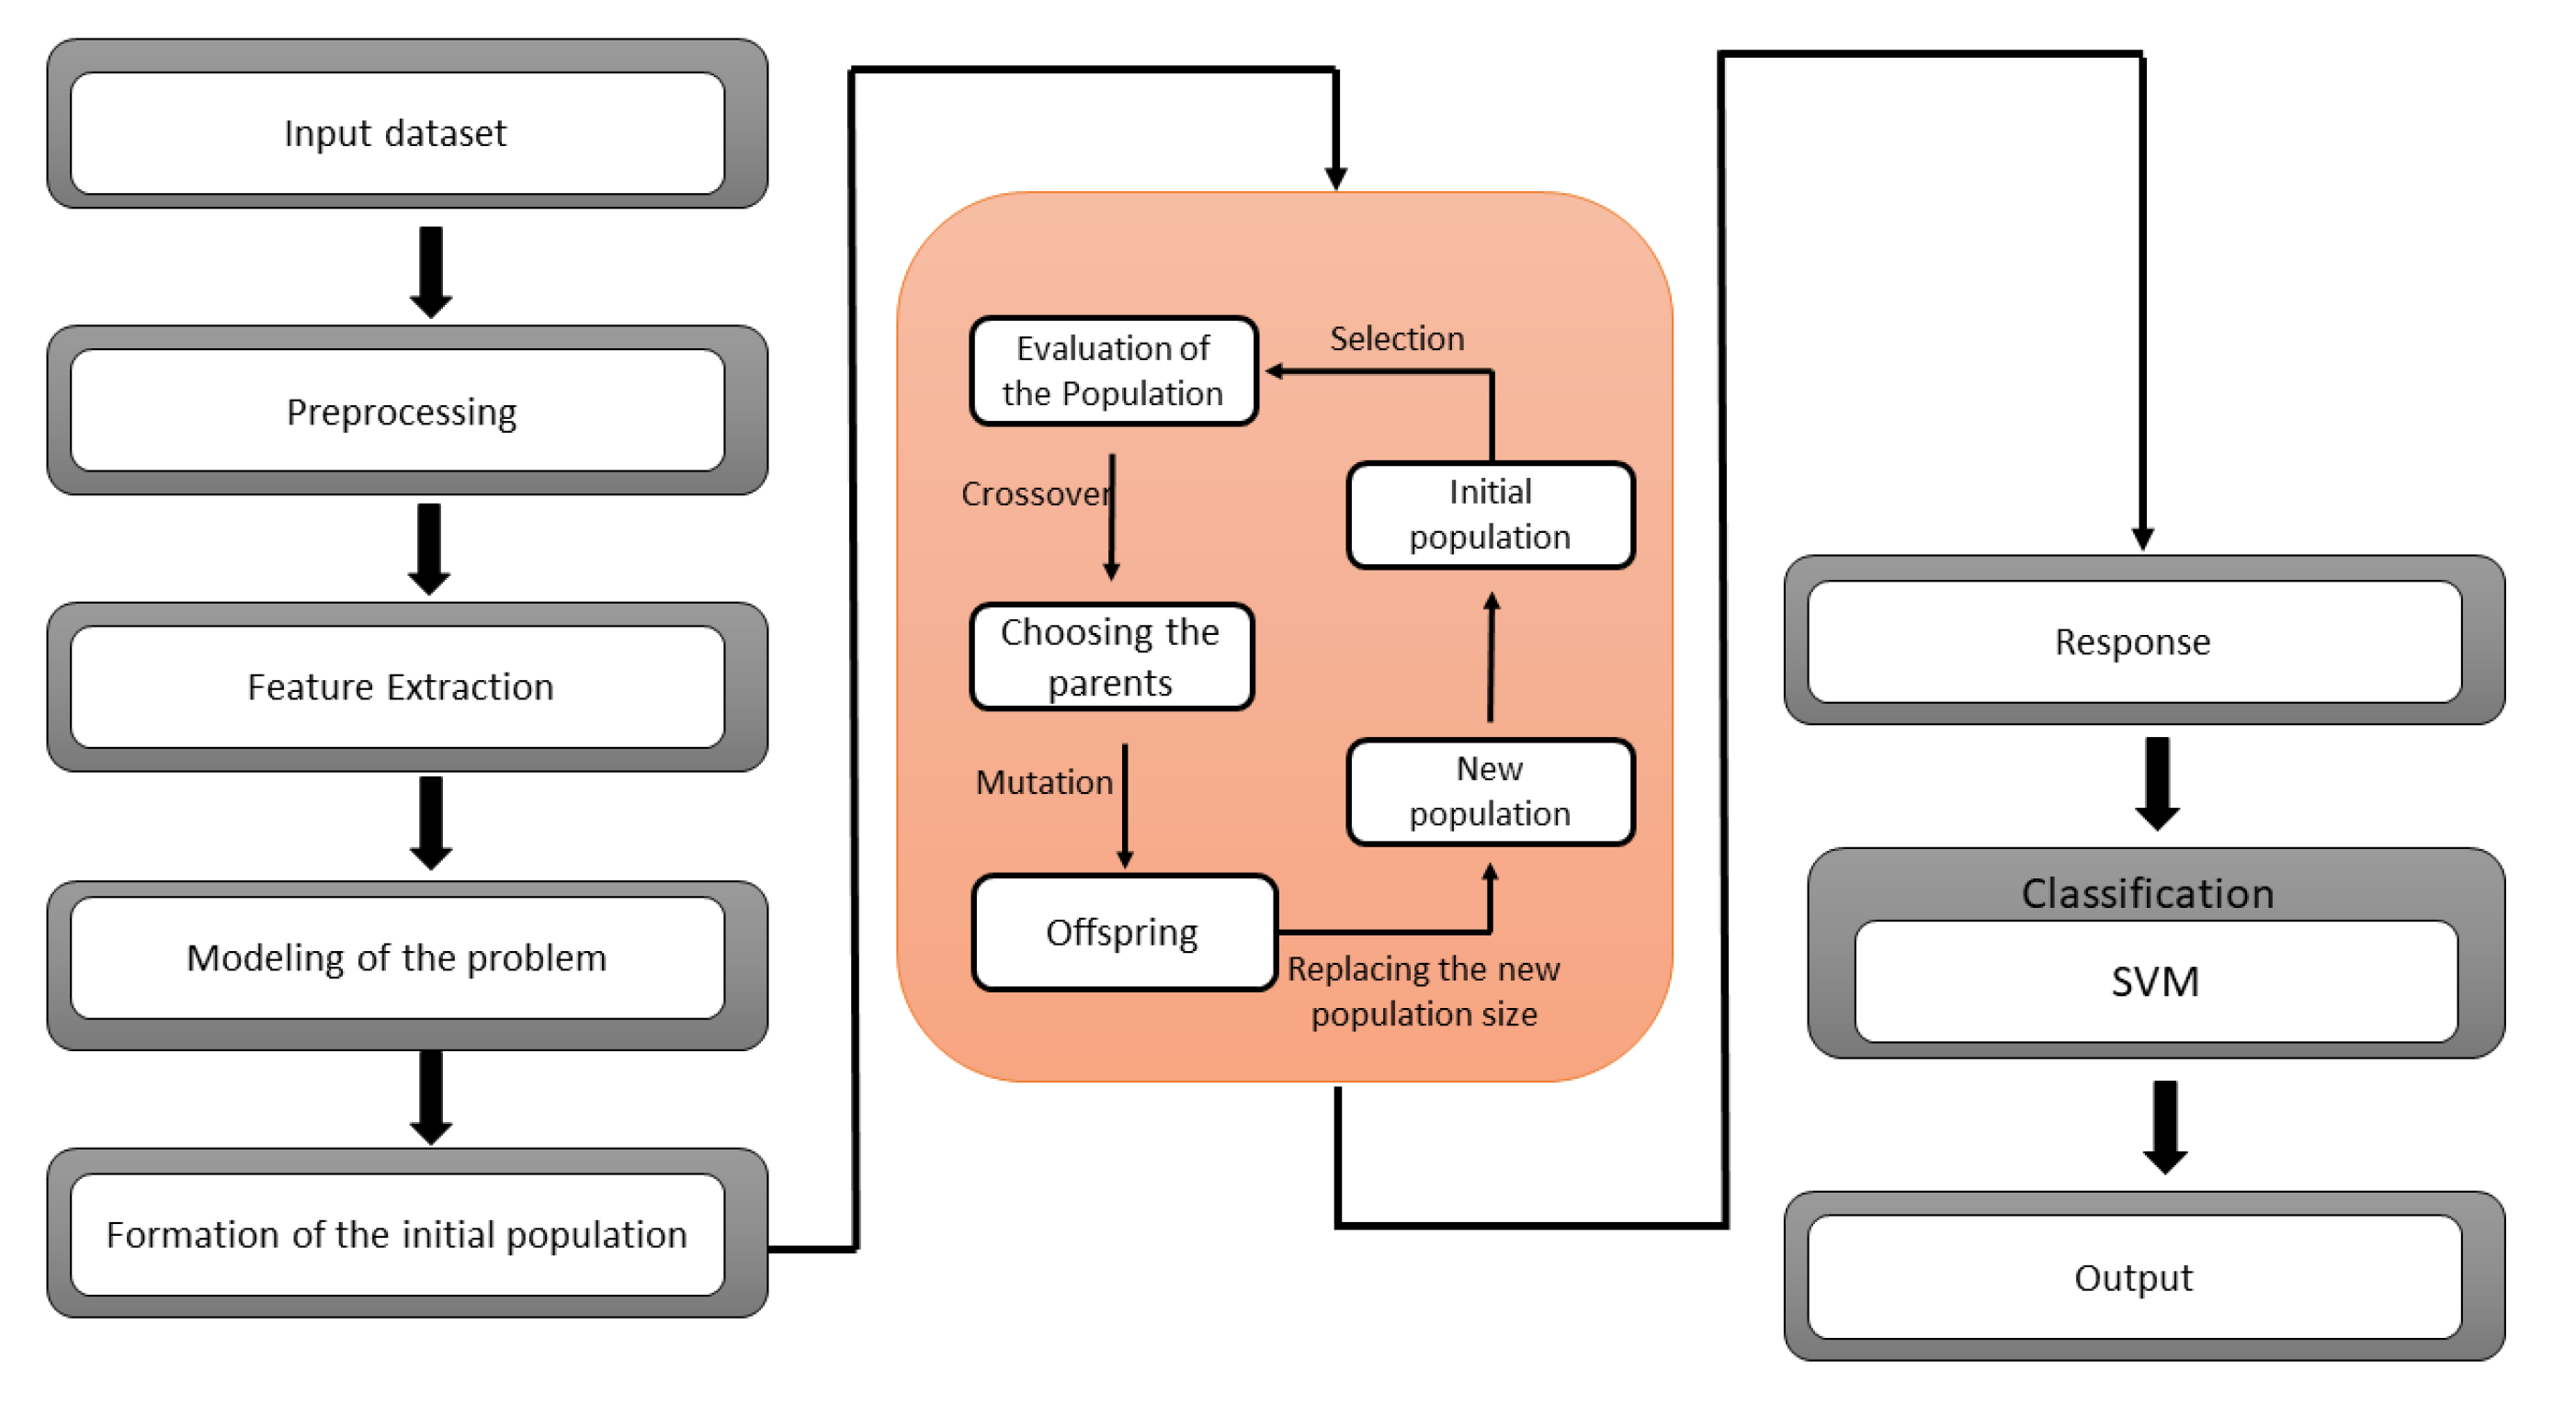
A GA-SVM hybrid model is presented to classify the lung cancer dataset. Genetic algorithm has been utilized in the feature selection problem to redact the high-dimensional dataset. One of the drawbacks of this technique is that it cannot build associations between the features when selecting the optimal features. The possibility of selecting a subset with redundancy has been increased. To overcome this issue, the boosted genetic algorithm has been proposed for the finest selection of a feature subset from a multi-dimensional dataset. The proposed approach splits the chromosome into numerous classifications for local management. So, mutation and crossover operators have been used on stated groups to eliminate invalid chromosomes. The Support Vector Machine (SVM) seeks to represent multi-dimensional datasets in a space divided by a hyper-plane that separates data components belonging to distinct classes. On unseen data, the SVM classifier can minimize the generalization error. The optimal hyper-plane is also known as the separating hyper-plane. The SVM has been demonstrated to be effective for binary classification but ineffective for noisy data. Learning machine features might be challenging due to the SVM’s shallow design.
The SVM is a binary classifier, while GA is a feature extractor. A hybrid GA-SVM model is suggested in this paper, in which the SVM is utilized as a binary classifier, and the SoftMax layer of the GA is replaced with the SVM.
Figure 1 shows the architecture of the proposed hybrid GA-SVM model.
SVM Parameter Optimization Using GA
SVM classification accuracy may be improved by adequately selecting parameters in addition to feature selection. To achieve a high classification rate, the choice of best feature and the kernel parameter is critical. These settings are usually fine-tuned by hand. We employ genetic algorithms to automate this decision. Since the SVM parameters are accurate, which must encode using binary chains; we set two search frequencies for each variable.
4. Experimental Study
The suggested experiment evaluated the proposed hybrid GA-SVM model for predicting survival in lung cancer patients. The steps in the experimental setup were as follows:
4.1. Dataset Preparation
The original dataset can be found in the UCI Machine Learning Repository [
20]. Other dataset were used for comprehensive comparisons, namely, the Haberman dataset and the appendicitis dataset [
21]. According to the leading repository site, the data were collected prospectively at Wroclaw Thoracic Surgery Center for patients who had undergone significant lung resections for primary lung cancer in 2007–2011.
4.2. Dataset Preprocessing
When looking at the information in the data collection, several columns appear to be object strings for T and F values. PRE7, PRE8, PRE9, PRE10, PREll, PRE17, PRE19, PRE25, PRE30, PRE32, and Risk1Yr are among them. The T and F object data types were transformed to 1 and 0 int data types in these columns. Data in a string with an int value were stored in the columns DGN, PRE6, and PRE14. After reviewing the column data description, it was concluded that the string value was unnecessary and that the int value would be more beneficial for analysis in the future.
As a result, these three columns were changed to only have the int value as a data type int. The id column was eliminated since it was redundant and provided no valuable information about each patient. For identifying individual row values, the indices were sufficient. Instead of the original codes, the column names were renamed in a more human-readable language. There were no missing values in the original dataset to deal with. The only numeric columns to examine for outliers were PRE4, PRE5, and AGE. The use of box plots and scatter plots to analyze the data revealed 16 notable anomalies.
The box plots indicated several outliers in the FEV1 column and one outlier in the Age column at roughly 20, significantly outside the data range. With scatter plots, it is clear that the Age outlier stands out from the rest of the data. The gap between the FEV1 outliers and the rest of the dataset is also visible. More research is needed on the two spots in the FVC boxplot.
The data analysis revealed that most FEV1 data were below 8; hence, the remaining 15 values were considered outliers and eliminated from the dataset. The majority of the data for Age falls between the ages of 40 and 80; thus, the one outlier at 20 was eliminated. Despite eliminating 16 outliers, the new dataset comprises 454 occurrences instead of the original 470, indicating that it is large enough for analysis.
4.3. Exploratory Data Analysis
In the dataset, 69 patients died over a year, while 385 survived, resulting in a mortality rate of 15.20 percent.
Table 1 below compares the various qualities and the two separate death and live classes for one year.
There were aspects with substantial differences and others with modest differences when comparing the means of the two patient groups. However, a normalization step was conducted for percentage discrepancies to make it easier to compare the numbers between classes.
4.4. Classification
A Machine Classifier was used for the supervised classification challenge. We discovered which features were relevant in determining the mean differences between individuals who lived and died in one year following surgery using EDA and hypothesis testing to acquire p-values. The test was to be focused on two separate X datasets. The first dataset eliminated the goal variable, Death 1 year, and the two characteristics MI 6 months and Asthma, which had a low presence in the data. X was the name given to this information. Performance, Dyspnoea, Cough, Tumor Size, and Diabetes Mellitus were the sole qualities of significance determined by the hypothesis testing in the EDA section. X2 was the name of this data collection.
5. Results and Discussions
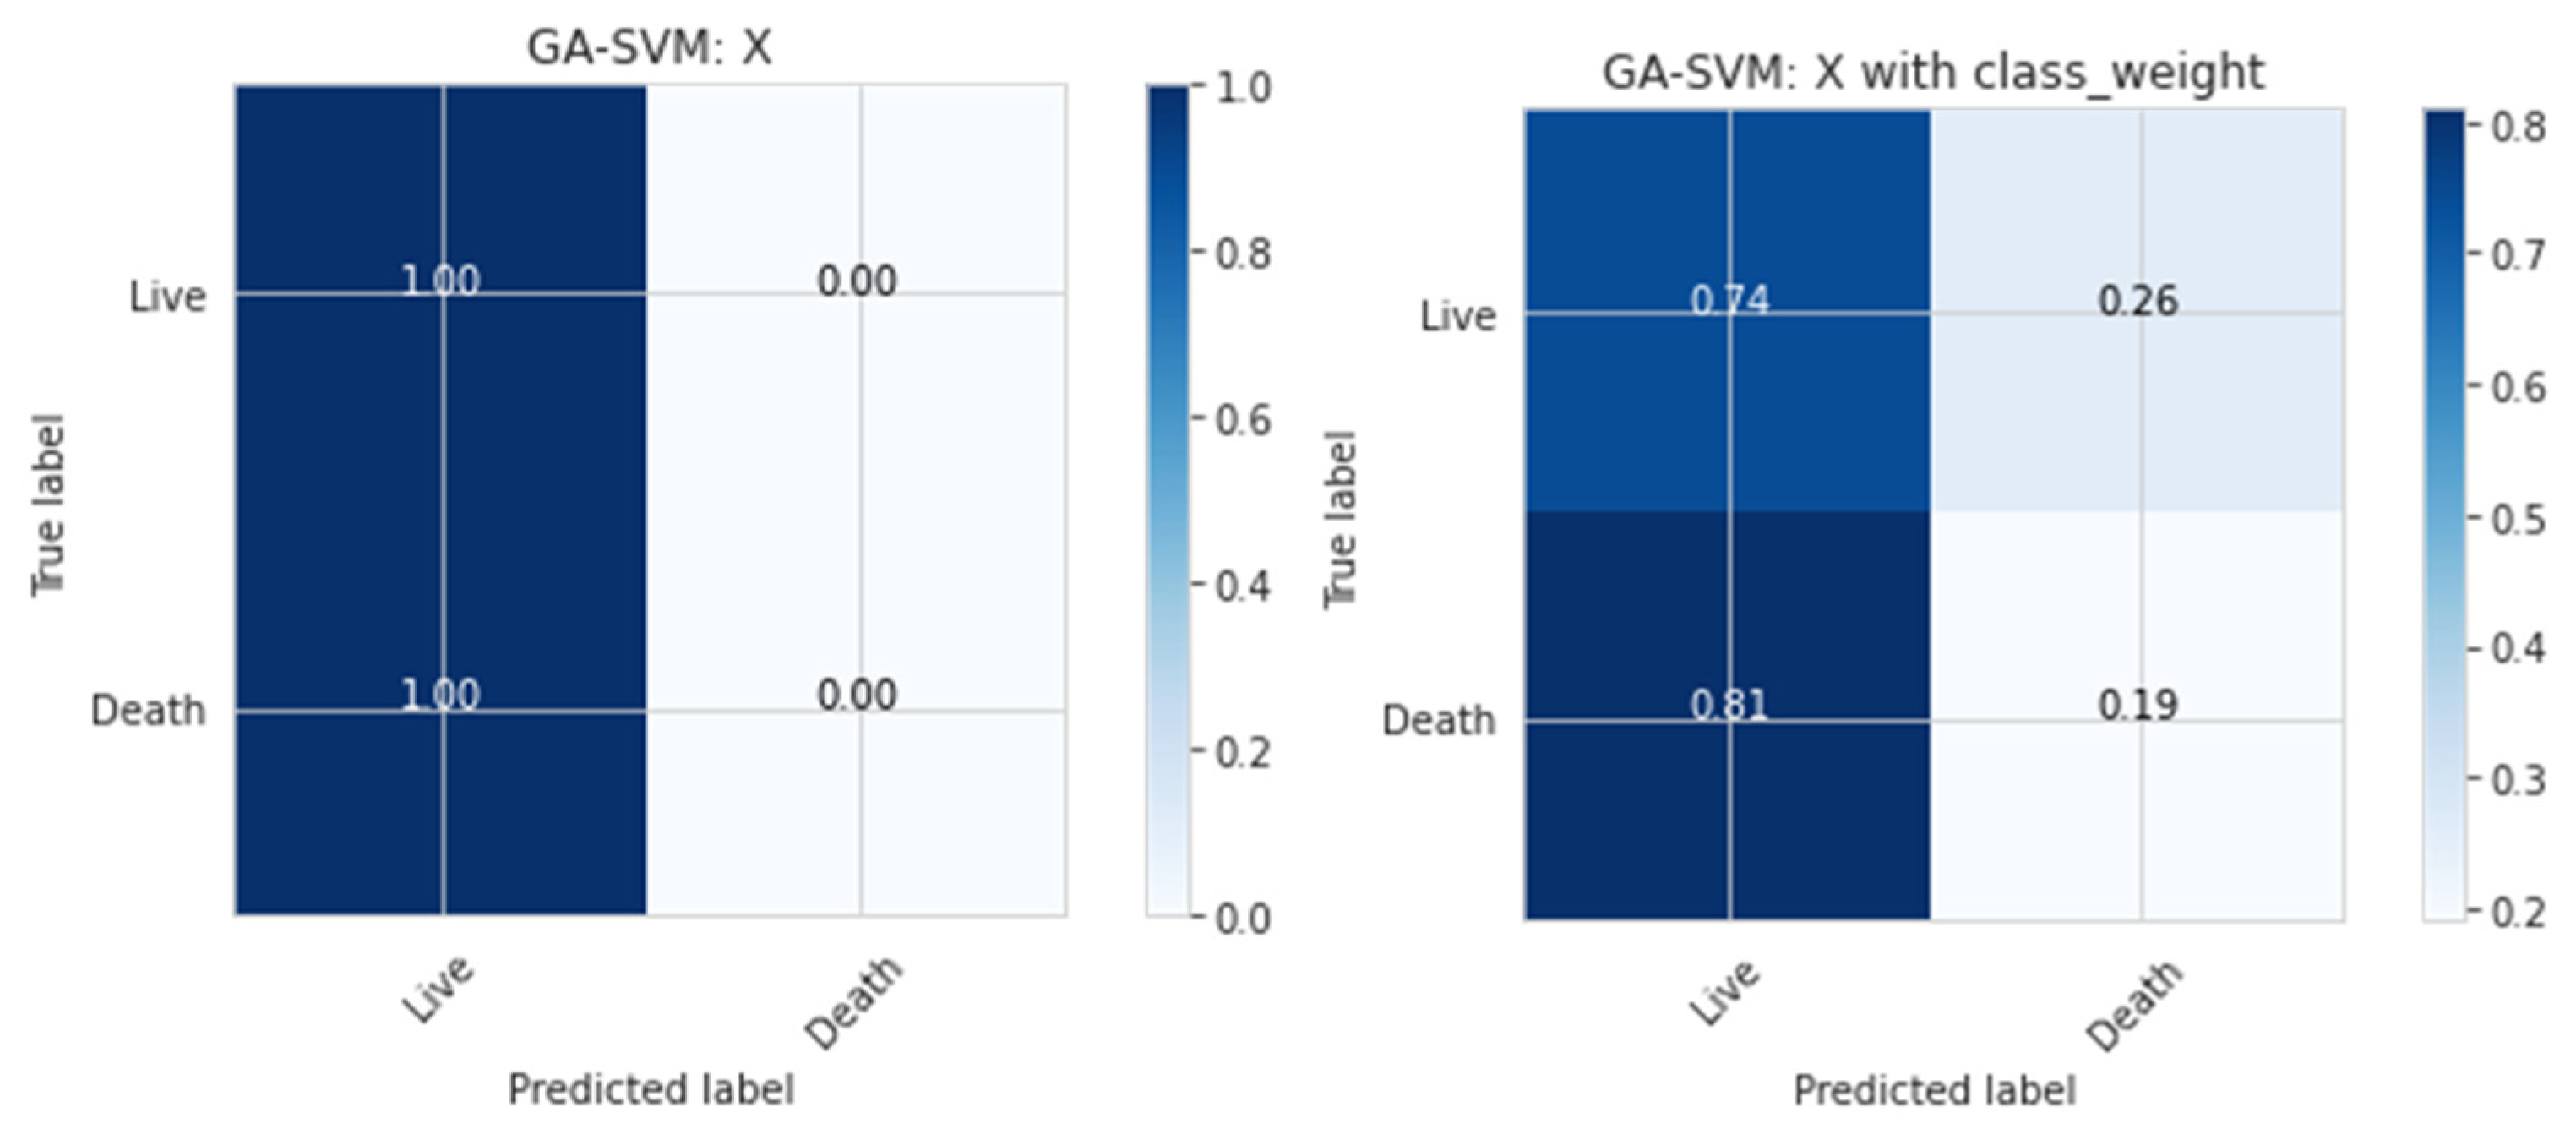
We focused on using the Genetic Algorithm and the Support Vector. The dataset is unbalanced and consists mainly of living patients (85%); only predicting all live patients would result in a high accuracy score of 85%. As a result, accuracy would not be an acceptable score method for the model, and average precision score was used, which summarizes the precision–recall curve. There are also alternatives for balancing the classes, such as down-sampling or modifying class weights. Modification of the class weights was concentrated on because down-sampling would result in a tiny dataset to deal with, while up-sampling may have further confused the data.
The death prediction rate and accuracy level increased with the class weight parameter at the expense of live-patient prediction. The average accuracy score also served as a decent summary of the precision–recall curve in this scenario.
Figure 2 illustrates the confusion matrix or classification report that may be used to examine death predictions to understand how effective the model is for present purposes.
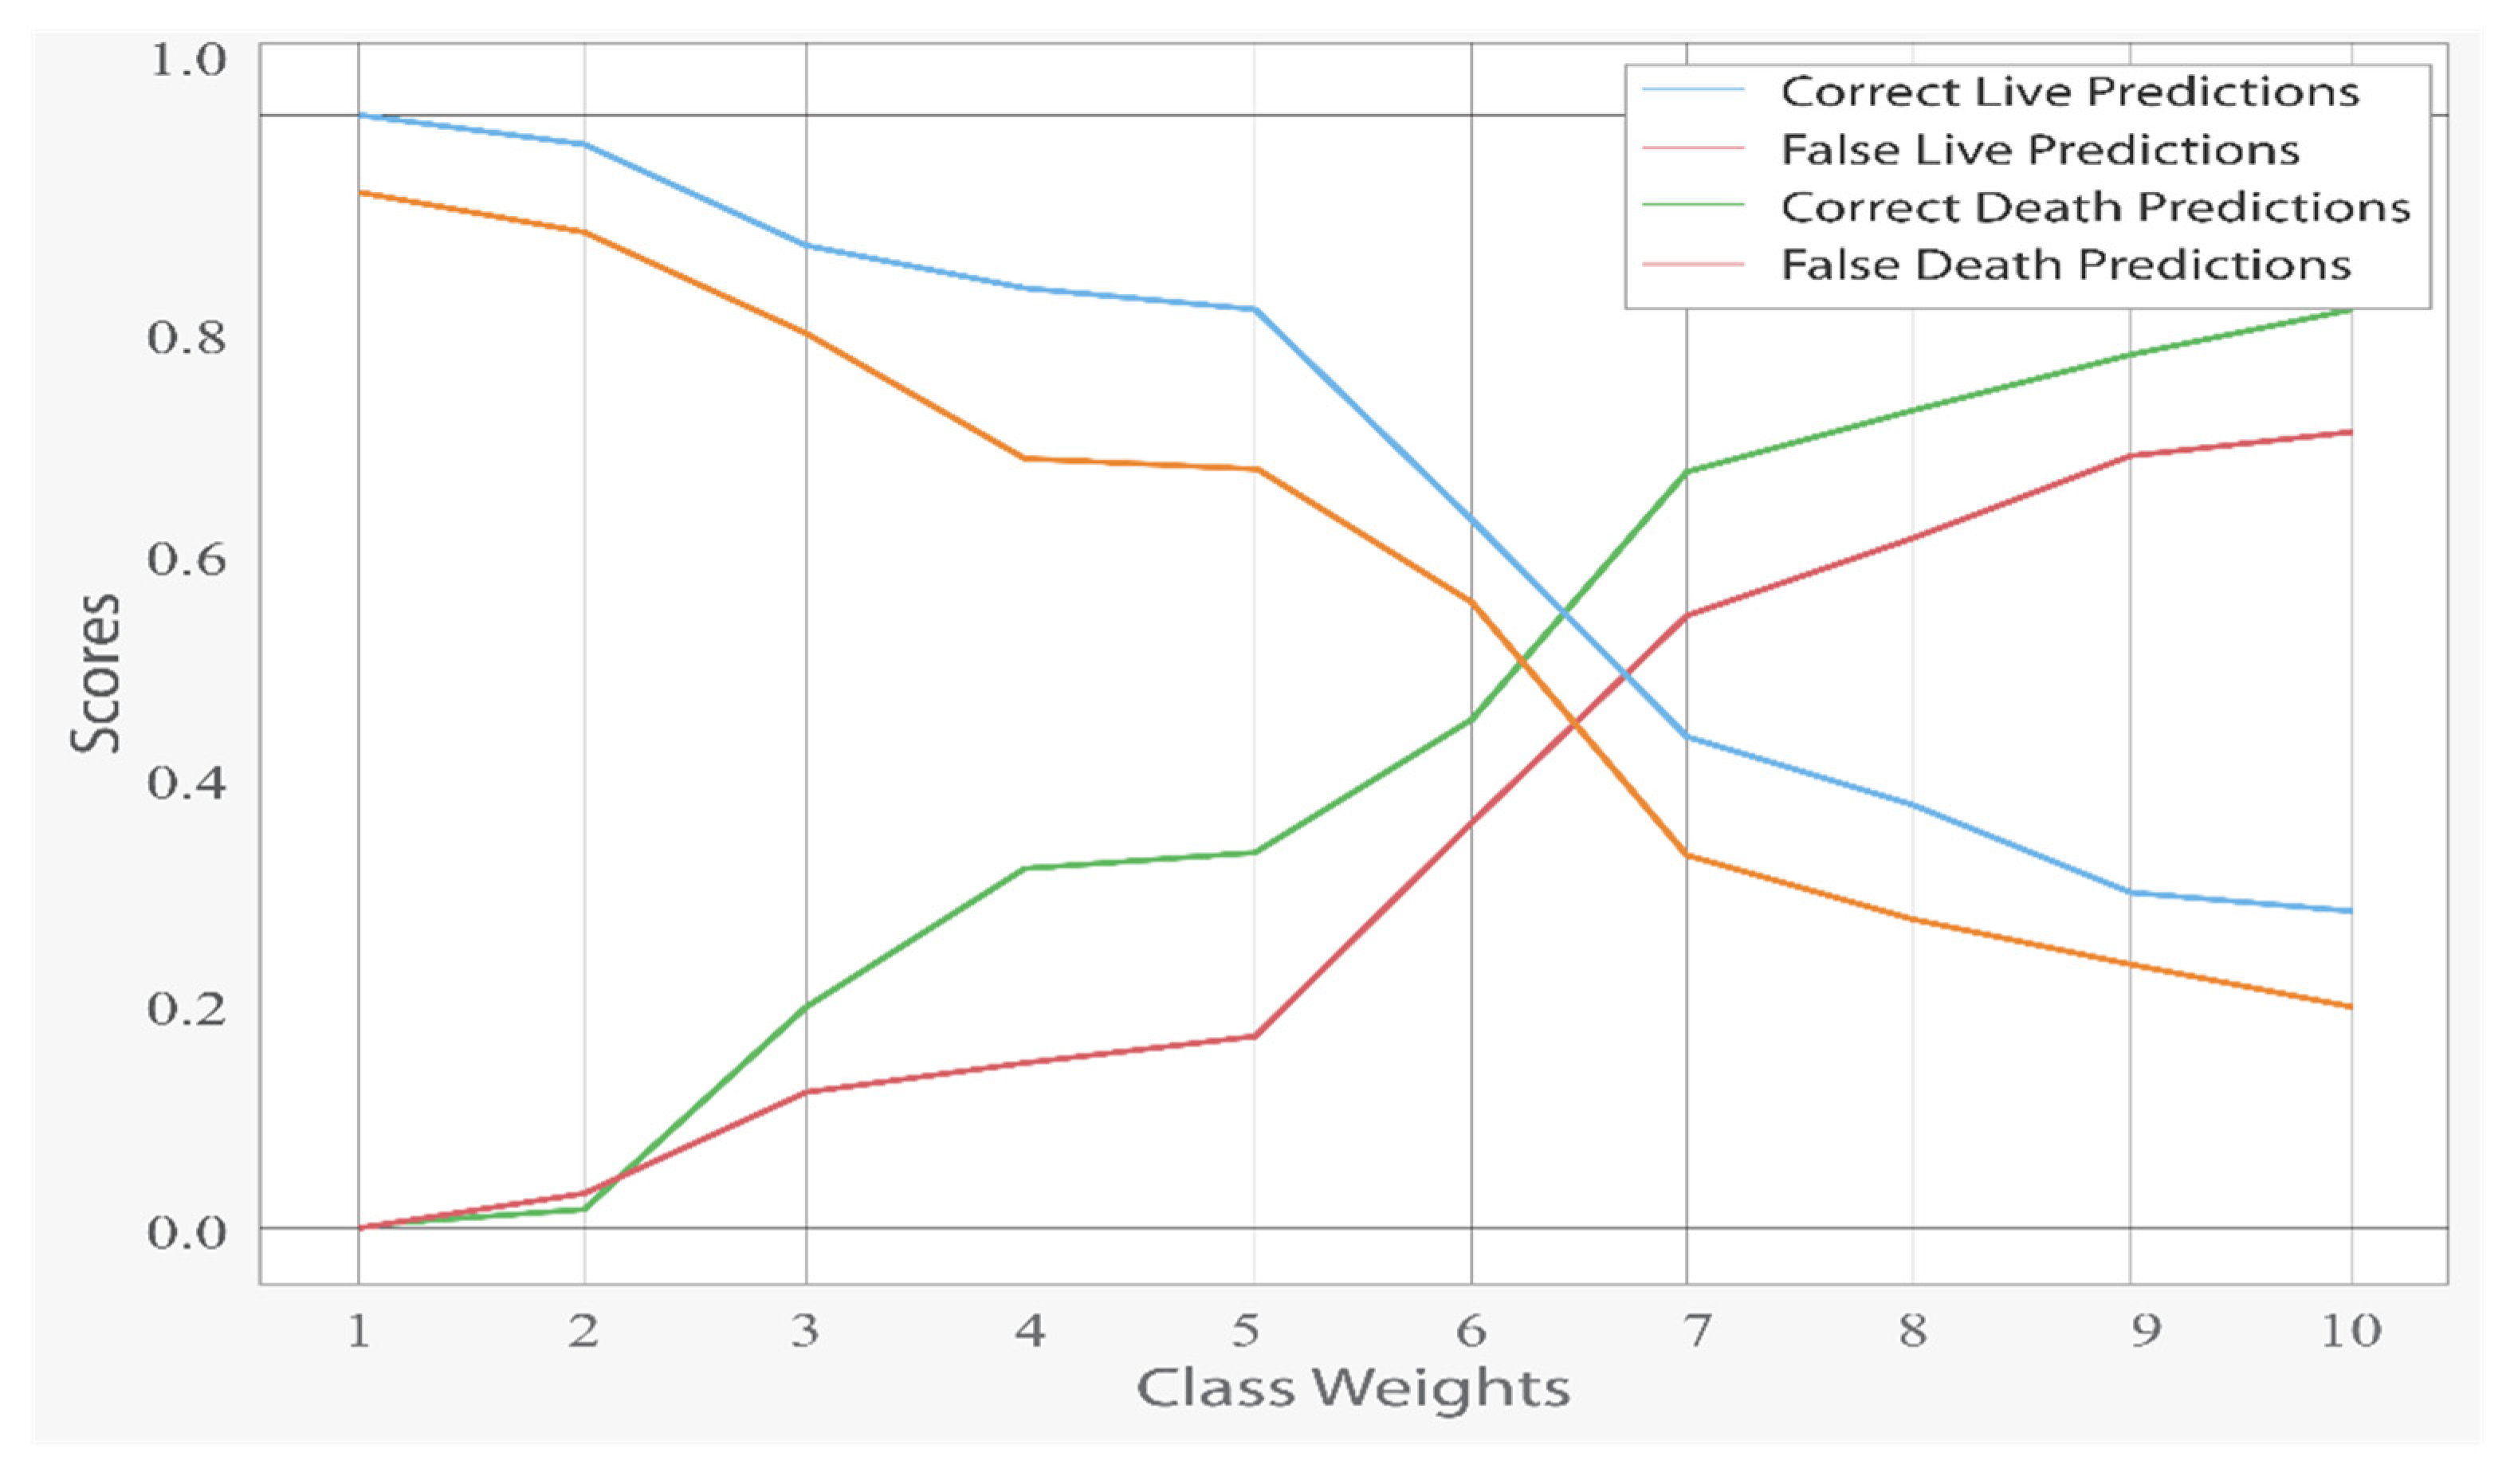
To balance the death-to-life ratio, which was 15 to 85, the class weight argument was set to ‘balanced.’ The ramifications of changing this argument’s ratio may be observed in
Figure 3.
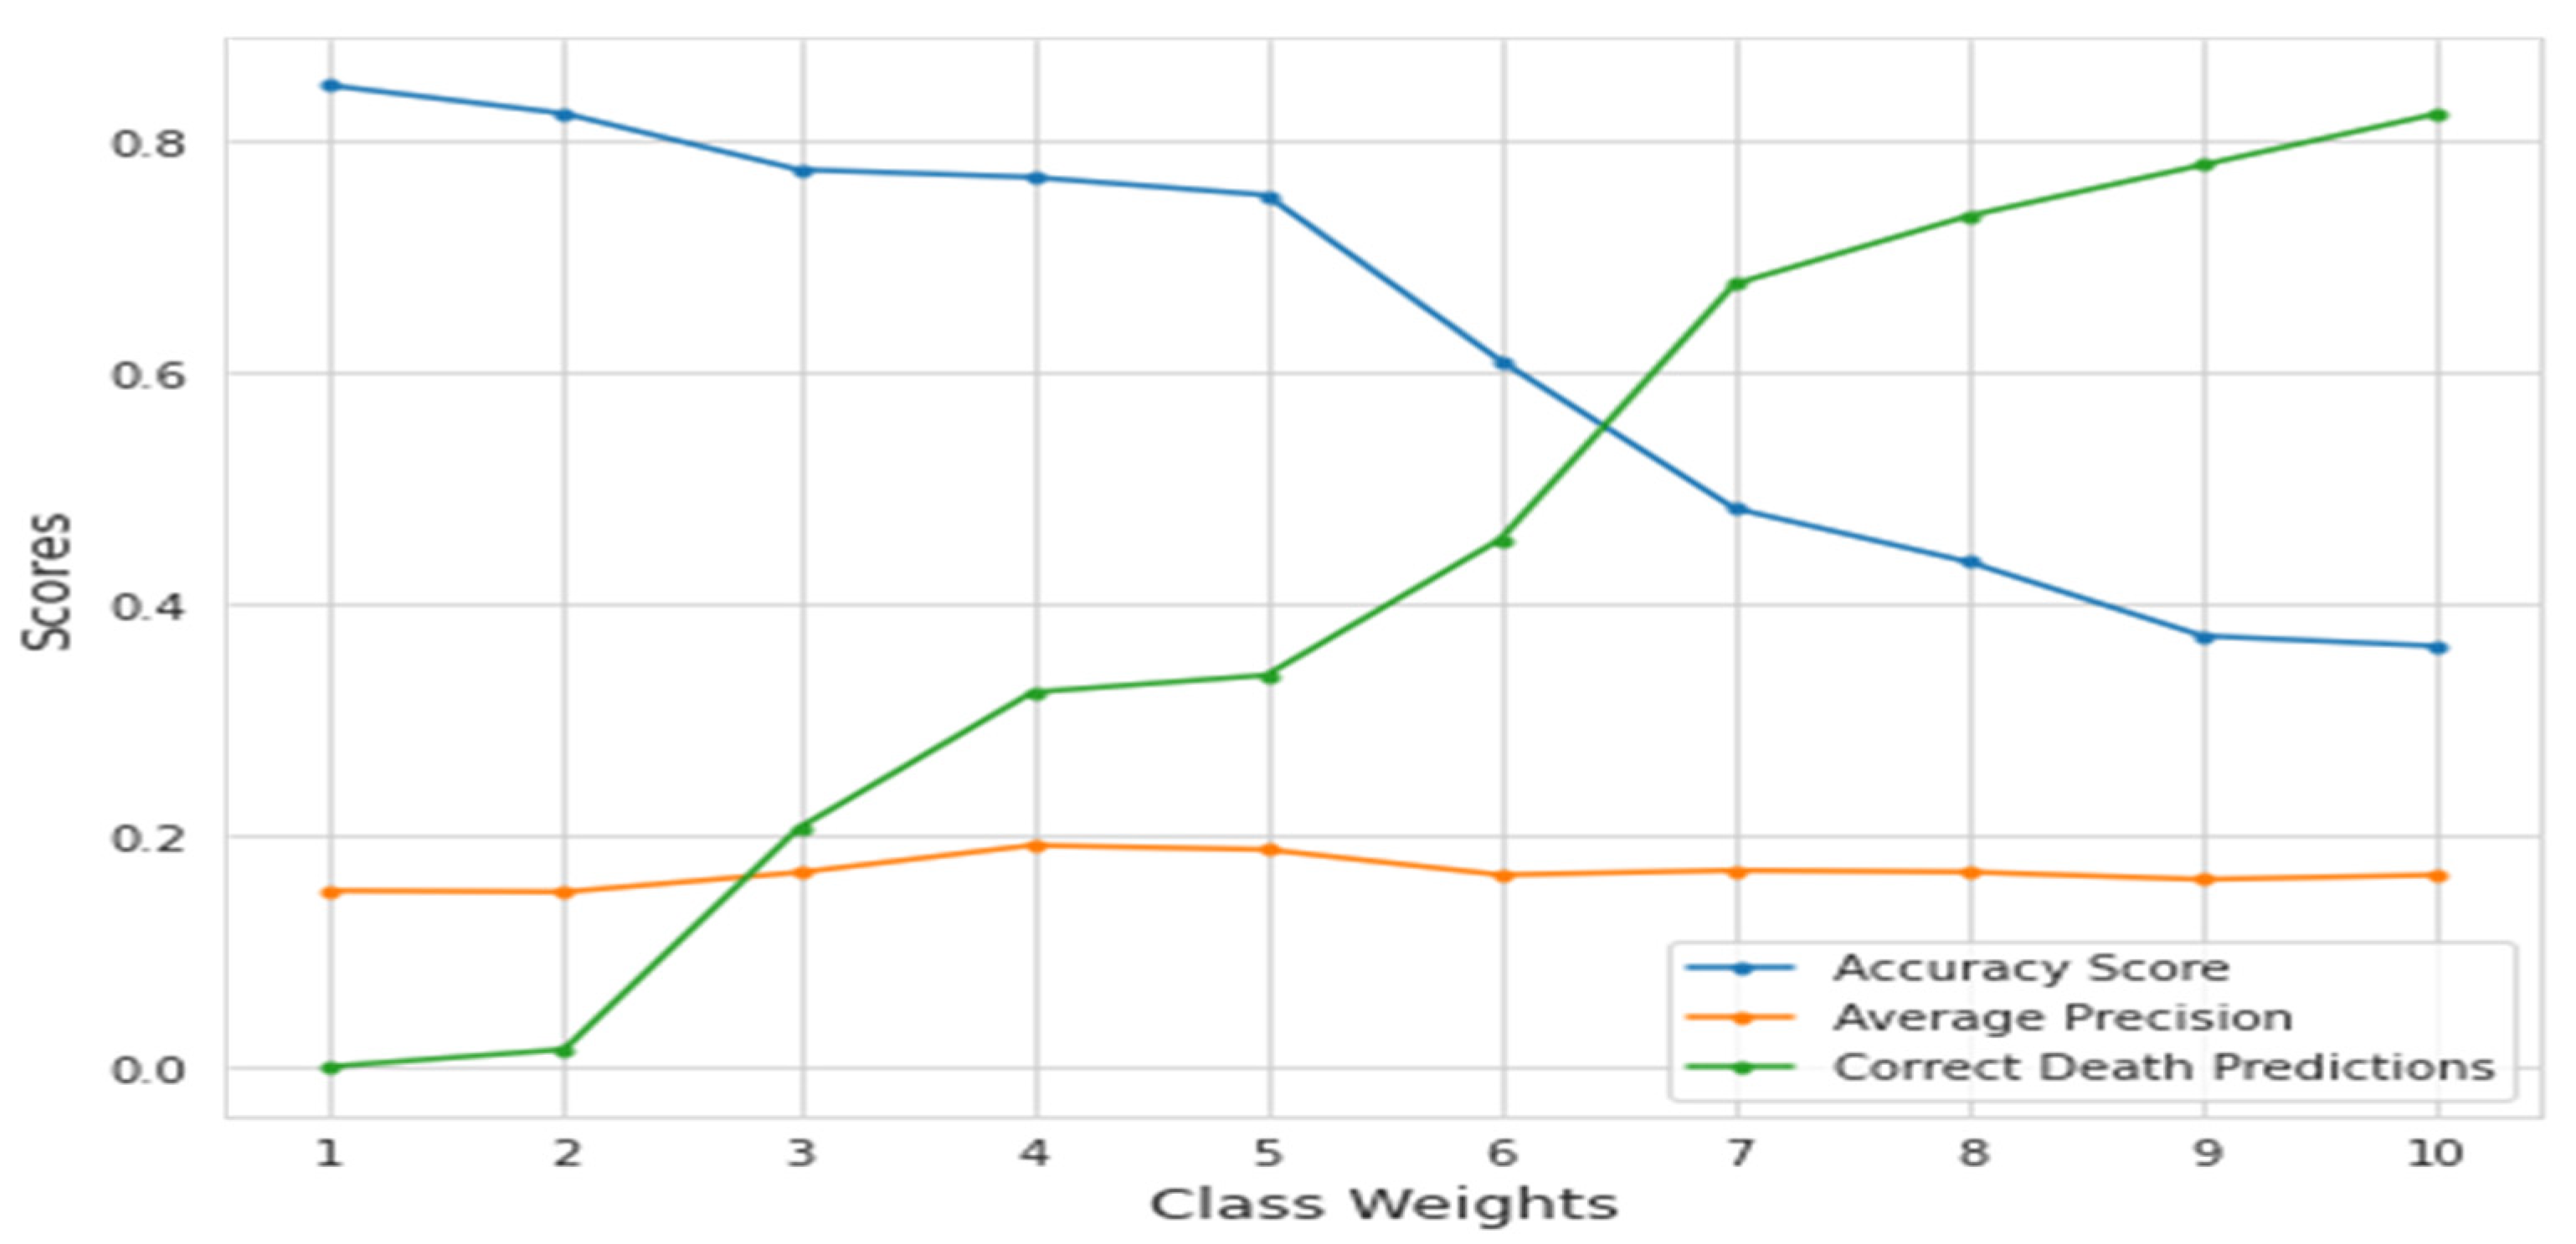
Although higher class weights on deaths enhanced correct death forecasts, false death predictions increased with the drop in incorrect live predictions. In
Figure 4, the impact of class weights can be seen. It is worth noting that the score dropped considerably at the 5.67 value, which is the equalizing point of the ratio of 15 to 85.
As shown in
Table 2, Random Forest performed relatively better than FPSO-SVM + SMOTE, PSO-SVM +SMOTE, SVM + SMOTE, and KNN + SMOTE. It achieved 0.83 accuracy, which was better than all of the other classifiers.
As shown in
Table 3, FPSO-SVM + SMOTE performed relatively better than PSO-SVM + SMOTE, SVM + SMOTE, and KNN + SMOTE. It achieved 0.6942 and 0.6813 for the G-mean and AUC, respectively, which were better results than those of all of the other classifiers. The proposed method method has been performed better as compared to FPSO-SVM + SMOTE and the other state-of-the-art algorithms.
In
Table 4, the proposed method GA-SVM + SMOTE outperformed PSO + SMOTE, SVM + SMOTE, and KNN + SMOTE. Its Accuracy and AUC results, which were 0.85 and 0.69, were better than those of the other classifiers.
Table 5 shows that the proposed method performed better than PSO + SMOTE, SVM + SMOTE, and KNN + SMOTE.
6. Conclusions
In this research, a GA-SVM hybrid model for the thoracic surgery dataset has been proposed, including automated feature synthesis with GA and output prediction with the SVM. To achieve optimal results, the model combines the advantages of GA and SVM classifiers. GA and SVM classifiers were ensemble in the proposed system to provide the best of both techniques. The Support Vector Machine (SVM) seeks to represent multi-dimensional datasets in a space divided by a hyper-plane that separates data components belonging to distinct classes. The model also favors the usage of automatically generated features. For the thoracic surgery dataset, the experimental results indicated that our proposed technique has a classification accuracy of 85%. The hybrid GA-SVM model is still in its early stages of development and can be further explored to make it computationally feasible.
Author Contributions
Conceptualization, M.M.A. and I.M.; methodology, M.M.A.; software, M.M.A.; validation, A.A.N., K.M., M.M.A. and I.M.; formal analysis, A.A.N.; investigation, A.A.N.; resources, M.M.A.; data curation, M.M.A.; writing—original draft preparation, M.M.A.; writing—review and editing, K.M.; visualization, M.M.A.; supervision, A.A.N.; project administration, A.A.N.; funding acquisition, M.A.A.G. and S.H.A. All authors have read and agreed to the published version of the manuscript.
Funding
This research work is supported by Data and Artificial Intelligence Scientific Chair at Umm Al-Qura University, Makkah City, Saudi Arabia.
Institutional Review Board Statement
Not applicable.
Informed Consent Statement
Not applicable.
Data Availability Statement
Not applicable.
Conflicts of Interest
The authors declare no conflict of interest.
References
- World Health Organization. Cancer Fact Sheet. Available online: https://www.who.int/news-room/fact-sheets/detail/cancer (accessed on 27 February 2019).
- American Cancer Society. Non-Small Cell Lung Cancer. Available online: https://www.cancer.org/cancer/non-small-cell-lung-cancer/about/what-is-non-small-cell-lung-cancer.html (accessed on 27 February 2019).
- Siegel, R.L.; Miller, K.D.; Jemal, A. Cancer statistics, 2018. CA A Cancer J. Clin. 2018, 68, 7–30. [Google Scholar] [CrossRef] [PubMed]
- Woodard, G.A.; Jones, K.D.; Jablons, D.M. Lung Cancer Staging and Prognosis; Springer International Publishing: Cham, Switzerland, 2016; pp. 47–75. [Google Scholar]
- Paesmans, M.; Berghmans, T.; Dusart, M.; Garcia, C.; Hossein-Foucher, C.; Lafitte, J.-J.; Mascaux, C.; Meert, A.-P.; Roelandts, M.; Scherpereel, A.; et al. Primary tumor standardized uptake value measured on fluorodeoxyglucose positron emission tomography is of prognostic value for survival in non-small cell lung cancer: Update of a systematic review and meta- analysis by the European Lung Cancer Working Party for the International Association for the Study of Lung Cancer Staging Project. J. Thorac. Oncol. 2010, 5, 612–619. [Google Scholar] [CrossRef] [PubMed]
- Berman, J.J. Confidentiality issues for medical data miners. Artif. Intell. Med. 2002, 26, 25–36. [Google Scholar] [CrossRef]
- Danjuma, K.J. Performance Evaluation of Machine Learning Algorithms in Post-Operative Life Expectancy in the Lung Cancer Patients; Department of Computer Science, ModibboAdama University of Technology: Yola, Adamawa State, Nigeria, 2015. [Google Scholar]
- Baitharu, T.R.; Pani, S. KA comparative study of data mining classification techniques using lung cancer data. Int. J. Comput. Trends Technol. 2015, 22, 91–95. [Google Scholar] [CrossRef]
- Kaur, M.; Mittal, R. Survey of Intelligent Methods for Brain Tumor Detection. IJCSI Int. J. Comput. Sci. Issues 2014, 11, 108. [Google Scholar]
- Osuoha, C.A.; Callahan, K.E.; Ponce, C.; Pinheiro, S. Disparities in lung cancer survival and receipt of surgical treatment. Lung Cancer 2018, 122, 54–59. [Google Scholar] [CrossRef] [PubMed]
- Mangat, V.; Vig, R. Novel associative classifier based on dynamic adaptive PSO: Application to determining candidates for thoracic surgery. Expert Syst. Appl. 2014, 41, 8234–8244. [Google Scholar] [CrossRef]
- Iraji, M.S. Prediction of postoperative survival expectancy in thoracic lung cancer surgery with soft computing. J. Appl. Biomed. 2017, 15, 151–159. [Google Scholar] [CrossRef]
- Zięba, M.; Tomczak, J.M.; Lubicz, M.; Świątek, J. Boosted SVM for extracting rules from imbalanced data in application to prediction of the post-operative life expectancy in the lung cancer patients. Appl. Soft Comput. 2014, 14, 99–108. [Google Scholar] [CrossRef]
- Haixiang, G.; Yijing, L.; Shang, J.; Mingyun, G.; Yuanyue, H.; Bing, G. Learning from class-imbalanced data: Review of methods and applications. Expert Syst. Appl. 2017, 73, 220–239. [Google Scholar] [CrossRef]
- Tsai, C.-F.; Lin, W.-C.; Hu, Y.-H.; Yao, G.-T. Under-sampling class imbalanced datasets by combining clustering analysis and instance selection. Inf. Sci. 2019, 477, 47–54. [Google Scholar] [CrossRef]
- Chawla, N.V.; Bowyer, K.W.; Hall, L.O.; Kegelmeyer, W. SMOTE: Synthetic minority over-sampling technique. J. Artif. Intell. Res. 2002, 16, 321–357. [Google Scholar] [CrossRef]
- Sáez, J.A.; Luengo, J.; Stefanowski, J.; Herrera, F. SMOTE-IPF: Addressing the noisy and borderline examples problem in imbalanced classification by a re-sampling method with filtering. Inf. Sci. 2015, 291, 184–203. [Google Scholar] [CrossRef]
- Douzas, G.; Bacao, F.; Last, F. Improving imbalanced learning through a heuristic oversampling method based on k-means and SMOTE. Inf. Sci. 2018, 465, 1–20. [Google Scholar] [CrossRef]
- Anbarasi, M.; Anupriya, E.; Iyengar NC, S.N. Enhanced prediction of heart disease with feature subset selection using genetic algorithm. Int. J. Eng. Sci. Technol. 2010, 2, 5370–5376. [Google Scholar]
- UCI Dataset. (March 2017). Thoracic Surgery Data Set. [Online]. Available online: https://archive.ics.uci.edu/ml/datasets/Thoracic+Surgery+Data (accessed on 6 March 2022).
- Veganzones, D.; Severin, E. An investigation of bankruptcy prediction in imbalanced datasets. Decis. Support Syst. 2018, 112, 111–124. [Google Scholar] [CrossRef]
- Shen, J.; Wu, J.; Xu, M.; Gan, D.; An, B.; Liu, F. Research Article A Hybrid Method to Predict Postoperative Survival of Lung Cancer Using Improved SMOTE and Adaptive SVM. Comput. Math. Methods Med. 2021, 2021, 2213194. [Google Scholar] [CrossRef] [PubMed]
- Tao, Z.; Huiling, L.; Wenwen, W.; Xia, Y. GA-SVM based feature selection and parameter optimization in hospitalization expense modeling. Appl. Soft Comput. 2018, 75, 323–332. [Google Scholar] [CrossRef]
- Altman, N.S. An introduction to kernel and nearest-neighbor nonparametric regression. Am. Stat. 1992, 46, 175–185. [Google Scholar]
| Publisher’s Note: MDPI stays neutral with regard to jurisdictional claims in published maps and institutional affiliations. |
© 2022 by the authors. Licensee MDPI, Basel, Switzerland. This article is an open access article distributed under the terms and conditions of the Creative Commons Attribution (CC BY) license (https://creativecommons.org/licenses/by/4.0/).


 ,
, 


