Featured Application
Machine Learning-based diagnostic tool to predict SARS-CoV-2 positivity and the need of hospitalized patients for oxygen therapy when managing constrained resources in emergency departments in contingency periods.
Abstract
The COVID-19 pandemic highlighted an urgent need for reliable diagnostic tools to minimize viral spreading. It is mandatory to avoid cross-contamination between patients and detect COVID-19 positive individuals to cluster people by prognosis and manage the emergency department’s resources. Fondazione IRCCS Policlinico San Matteo Hospital’s Emergency Department (ED) of Pavia let us evaluate the exploitation of machine learning algorithms on a clinical dataset gathered from laboratory-confirmed rRT-PCR test patients, collected from 1 March to 30 June 2020. Physicians examined routine blood tests, clinical history, symptoms, arterial blood gas (ABG) analysis, and lung ultrasound quantitative examination. We developed two diagnostic tools for COVID-19 detection and oxygen therapy prediction, namely, the need for ventilation support due to lung involvement. We obtained promising classification results with F1 score levels meeting 92%, and we also engineered a user-friendly interface for healthcare providers during daily screening operations. This research proved machine learning models as a potential screening methodology during contingency times.
1. Introduction
On 11 March 2020, the World Health Organization (WHO) declared the SARS-CoV-2 (i.e., COVID-19) pandemic [1]. The virus causes bilateral multi-focal interstitial pneumonia, which can quickly evolve into acute respiratory distress syndrome (ARDS). Infected subjects present a heterogeneous and changing clinical picture, ranging from asymptomatic cases to either focal or multi-focal lung patterns, commonly referred to as the white lung pattern [2]. Symptoms include fever, dry cough, fatigue, and shortness of breath [3]. Epidemiological data report droplets spread with face-to-face exposure as the most probable cause of virus transmission. It is mandatory to live upon social distancing rules, rapidly identify and isolate infected subjects, and track the most recently infected people to prevent the virus from scattering [4]. Therefore, it is fundamental to promptly diagnose SARS-CoV-2 infection to appropriately treat the patients according to the highest healthcare standards and quickly operate contact tracing. The gold standards to diagnose the SARS-CoV-2 condition are the amplification of viral RNA by real-time reverse transcription-polymerase chain reaction (rRT-PCR), IgM–IgG coupled immunoglobulin and rapid antigenic analyses. However, all suffer from several drawbacks, thus having the need for expensive equipment, trained personnel, long processing times, and both preanalytical and analytical vulnerabilities, namely poor sensitivity and overall detection accuracy [5,6].
The need for quick and reliable tools to diagnose and stratify patients’ prognoses to optimize resource allocation is of the utmost importance. Splitting the emergency department (ED) into clean and dirty areas during a pandemic is fundamental to preventing patient-to-patient spreading.
During the last decade, the number of research articles on artificial intelligence (AI) as a resource for all kinds of medical specialties highly increased, proving machine learning (ML) algorithms to be successful [7]. Notably, several studies report medical instruments supported by AI concerning applications ranging from stroke management to cancer detection [8,9,10,11,12,13]. AI is reshaping how biomarkers and biosignals are defined and managed [8,9]. AI-enabled support systems might aid clinicians in decision making, especially during ED triage. Indeed, most studies aim to develop models to schedule patients according to their triage acuity level, assessing the severity of their conditions and deciding upon hospital admission [14]. SARS-CoV-2 studies comprise algorithms exploiting computed tomography (CT), lung ultrasound (LUS), and X-ray imaging techniques to diagnose and examine COVID-19 evolving patterns [2,15,16,17,18]. On the other hand, researchers exploited ML- and AI-based techniques to tackle contact tracing, the prediction and forecasting of epidemiological measurements, and SARS-CoV-2 drug development [19,20,21].
During the first heavy pandemic waves, several governments limited swab testing due to the unfeasible number of them to be carried out. Therefore, from that period onward, research has focused on machine learning algorithms to quickly assess patients for COVID-19 positivity and mortality [20,21,22,23,24,25]. The studies confirmed the feasibility of the statistical learning-based approach. Nonetheless, only 8% of the studies observed by literature reviews focused on blood test analyses [21]. Researchers produced statistical models having different goals ranging from COVID-19 to mortality prediction, with classification results having sensitivity levels of approximately 80–89% [21,26].
Fondazione IRCCS Policlinico San Matteo Hospital’s Emergency Department (ED) of Pavia let us evaluate the exploitation of machine learning algorithms on a clinical dataset gathered from laboratory-confirmed rRT-PCR test patients, collected from 1 March to 30 June 2020. The main goal was to quickly stratify patients and employ cross-contamination procedures, avoiding extensive swab testing and leveraging physicians’ workload. We gathered patients’ data based on two primary principles. First, we engaged features readily available in every ED triage, such as anamnesis, symptoms, and vital signs. Moreover, we collected data concerning patients’ respiratory failures, routine blood tests, arterial blood gas (ABG) analysis, and lung ultrasound quantitative evaluations [2,27]. We adopted support vector machine (SVMs) and random forest (RF) [28] algorithms to assess patients’ COVID-19 positivity. Furthermore, we predicted whether a patient would need oxygen therapy, such as continuous positive airway pressure (CPAP) or invasive ventilation. Indeed, we must organize and wisely engage limited resources during contingency times. The diagnostic tools allowed to meet promising results with F1 score levels at 92% and sensitivity—i.e., recall—ones at 96%.
We believe the novelty of our designed methodology, summarized in Figure 1, stands in the following lines:
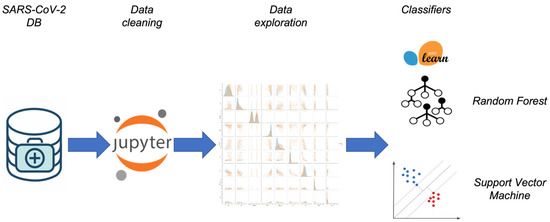
Figure 1.
Summary of the machine learning approach: the data analysis workflow.
- A careful clinical features collection: we based our classifiers on the features that physicians employed during triaging and daily clinical operations;
- Extensive and robust data analysis before ML clustering;
- Exploitation blood tests to assess patients, rather than imaging data;
- Assessment of patients’ need for oxygen therapy to carefully engage limited resources in contingency scenarios [21];
- A quantitative lung involvement examination to produce robust results: studies report lung ultrasound examination as a fast, cheap, and agile tool to assess patients’ lung involvement [2].
2. Materials and Methods
This section provides a detailed description of the data collection, cleaning processes and exploration. Furthermore, we describe the selection and the design of the machine learning methodologies to diagnose SARS-CoV-2 and predict the need for assisted ventilation.
2.1. Data Collection
Fondazione IRCCS Policlinico San Matteo’s Emergency Department of Pavia established a strict protocol during triage operations to diagnose patients who might have potentially been infected by SARS-CoV-2. The procedure was mandatory to stratify patients and avoid cross-contamination during hospital operations. To apply ML methodologies and aid physicians during the pandemic, we mainly looked at clinical characteristics available in any ED triage, such as history taking, symptoms, and vital signs. Furthermore, we gathered information that is not only associated with patients’ respiratory malfunctions, but also satisfies the constraint of being promptly available and cheap, such as routine blood tests, arterial blood gas examination (ABG), and lung ultrasound quantitative evaluation [2,27,29]. We collected data from patients complaining about potential SARS-CoV-2 symptoms, whom the physicians swabbed to diagnose the disease. The collection process lasted from March 1 to 30 June 2020. In the end, we acquired the list of features shown in Figure 2 for 1355 patients, where we report the correlation coefficient between each feature and the outcome to be predicted, namely both COVID-19 positivity assessment and oxygen therapy potential need.
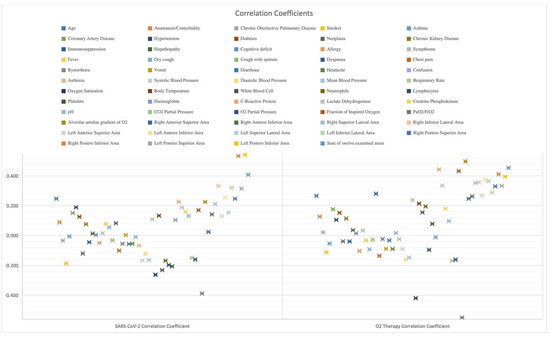
Figure 2.
Examined features and their correlation with targets.
Several studies reported the presence of typical SARS-CoV-2 pneumonia patterns during LUS examination. We collected quantitative information regarding lung injuries due to their usefulness in the diagnosis and the prognosis of patients affected by COVID-19 [2,27,29,30,31,32,33]. LUS presents advantages compared to other tools: a fast, non-ionizing, radiation-free, cheap, and bedside technique. Not only can we perform an ultrasound for unstable patients, but also it is easily repeatable. Therefore, we extensively exploited a strict acquisition protocol [34] and assigned a standardized LUS Score to get a quantitative analysis of patients’ lung health conditions. Hence, we studied each lung in six different areas with a high-frequency linear probe (5 MHz) and scored each of the lung portions [34]. Furthermore, we defined the modified LUS score as the sum of the scores assigned to each lung’s region, thus ranging from 0, namely when the lung is well aerated, to 36, describing a lung in which all the regions present a tissue-like consolidated pattern. Hence, as reported in Figure 2, we included the 12 scores associated with each lung’s region, ranging from 0 to 3, and the overall modified LUS score. Figure 2 reports that quantitative lung evaluation positively correlates with the estimation targets.
We performed data cleaning and pre-processing operations, comprising categorical features transformation into dummy variables, namely the conversion of textual features into discrete and numerical values and the handling of missing values. Values could have been missing due to a variety of reasons. The first reason is machinery malfunctioning: the device performing the test needed might not have written certain information well. Secondly, the physicians’ workload and pace. If a subject was visibly affected by SARS-CoV-2, and there was not enough time to assist other patients according to the highest healthcare standards and complete the data acquisition protocol, the personnel interrupted the process to respect the hard time constraints demanded by the pandemic. Unfortunately, there is no quick way to fix missing values.
Hence, we adjusted the dataset to 443 patients by excluding all the patients whose values were missing.
In conclusion, we split 90% of the data into the training set and the remaining 10% into the test set. Experts usually suggest these percentages to be 70% and 30% [35]. However, because our dataset size was insufficient to keep relevant information in the training set at the end of the data-cleaning process, we decided to opt for this kind of subdivision. Moreover, to meet reliable results free from overfitting problems, we performed a 10-fold cross validation. At each learning step, we randomly split the training set into 10 subsets such that the 10th one was used to validate our data, whilst the remaining four optimized the models’ weights. K-fold cross validation is a common practice used by data scientists facing dataset size problems [35].
2.2. Data Exploration
We conducted the study in the ED outline. It is usually highly recommended to exhibit the patients’ statistical characteristics of the dataset to explain what features a study stands upon and to compare the dataset to others [24,25]. Not only did we consider in Table 1 the median value of the features in Figure 2, but we also divided the statistics for the people who resulted as either positive or negative from the RT-PCR swab. Furthermore, we also dealt with dyspneic patients. Namely, we predicted if the considered subjects would need aided ventilation, either with CPAP or something more invasive. However, since the dyspnoea we look at comes from SARS-CoV-2, there is no need to stratify the displayed statistics further. In Table 1, we reported some statistical characteristics of one of the datasets used by our colleagues to highlight the similarities, except for the percentage of positive patients, 61.2% in our case vs. 48.4% in that of Cabitza et al. [36]. Concerning oxygen therapy, only 20.8% of subjects needed CPAP or invasive ventilation, whereas 79.2% of patients required either an oxygen mask, nasal cannula, or no oxygen therapy. We evaluated the correlation coefficients between each input feature and either target to examine the elements and the machine learning models. The data exploration procedure, reported in Figure 3, helped us to extract the clinical picture of people affected by COVID-19. Indeed, we can cluster SARS-CoV-2 positive subjects by age and comorbidities, particularly hypertension, diabetes mellitus and cardiovascular diseases. They clinically present themselves with fever, dry cough, and dyspnea, along with an increase in respiratory rate and a reduction in hemoglobin and oxygen saturation. Concerning the blood analyses, we report COVID-19 positivity related to lymphopenias, an increase in white blood cells, neutrophils, lactate dehydrogenase, cardiac troponin, and C-reactive protein. Furthermore, ABG test results present alterations, such as an elevated oxygen alveolar–arterial gradient (A-a) and reduced pO2, pCO2 and P/F ratio [27].

Table 1.
Dataset statistics. Bp stands for blood pressure, pp means partial pressure, and A-a-g is the arterial–alveolar gradient.
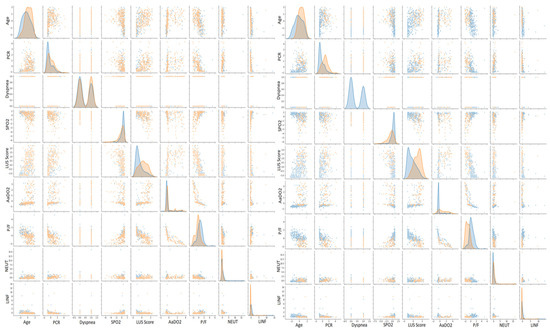
Figure 3.
Scatter plot matrices for COVID-19 and oxygen therapy prediction. On the left, orange points indicate positive patients, whereas blue points indicate negative ones. On the right, orange points indicate patients who needed CPAP or invasive ventilation, whereas blue points indicate patients who needed either an oxygen mask, nasal cannula, or no oxygen therapy.
We further validated such clustering by examining the scatter plot matrix of the features, studied both by coronavirus positivity and patients who needed aiding ventilation. For simplicity, we only expose the selected patterns in Figure 3. Overall, we can see that none of the scatter plots show a clear separation between patients affected by COVID-19 and those with other diseases, but only a smooth transition. Nonetheless, there are some recognizable patterns. COVID-19 patients with severe conditions are older than the ones presenting healthier patterns, have higher LUS scores and have lower P/F ratios. We observed the same but a more pronounced pattern comparing patients who needed CPAP or invasive ventilation with those who did not. To decide whether we should consider all the features to cluster the patients for both classification scenarios, we performed principal component analysis (PCA) [37]. We computed the number of input values needed to maintain the 95% statistical variance in our dataset. We report that to keep 95% of information while reducing the number of input features, we should keep 48 principal components instead of 58 (Figure 4). The reduction was not significant enough to justify a further level of complexity. Therefore, the models described in the next section do not perform any feature selection process prior to prediction. Additionally, physicians asked for a fast answer. Hence, we kept all the input features without a further pre-processing step beside the classical ones, which comprise feature rescaling and cleaning.
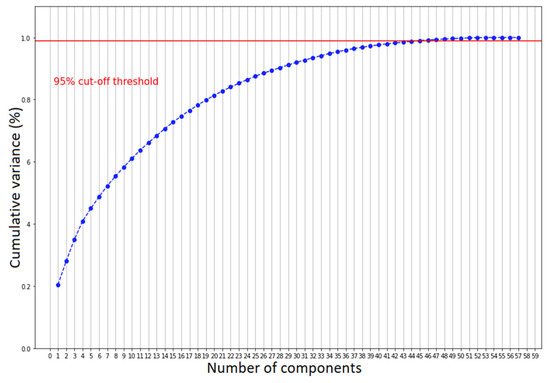
Figure 4.
The number of components needed to explain 95% of statistical variance.
2.3. Machine Learning Models
We chose random forest (RF) and support vector machines (SVMs) [38] to advance the state-of-the-art results [23,24,25]. The exploration process we reported in the previous sections encouraged this choice.
Random forest is an ensemble learning methodology to classify by designing a cluster of decision trees throughout the training. The hyperparameters describing an RF algorithm are the number of estimators composing the forest, the tree’s maximum depth, the highest number of levels we let each tree reach, and the estimator’s minimum number of data points placed in a node before splitting it. Moreover, we usually tune the maximum number of features to be considered for splitting a node and the minimum number of data points allowed in a leaf. Finally, we also choose whether to bootstrap our data; namely, we can choose to either resample data points or not. Data scientists usually recommend exploiting bootstrap when the dataset size is small. In Table 2, we present such parameters as we find them in the Python Scikit-Learn library [39], respectively: n_estimators, max-depth, min_samples_split, max_features, min_samples_leaf and bootstrap.
Table 2.
RF and SVM hyperparameters for each classification task.
SVM is also a supervised learning methodology, representing one of the most robust prediction algorithms. An SVM acts by representing the data points in a p-dimensional feature space and dividing them such that there exists a hyperplane clustering the points. The gap between the hyperplane and the data points belonging to each class must be the widest. There are fewer hyperparameters compared to the RF algorithm. First, we need to determine the kernel function, the nonlinear function enabling us to fit the maximum-margin hyperplane, mapping the data points in the p-dimensional space. Data points cannot be linearly separable. Therefore, we transform them through a kernel function acting as a degree of closeness measure, mapping the data into another feature space. One of the most used functions is the radial basis function (RBF), featuring the hyperparameter γ. The hyperparameter γ controls the distance of influence of each training point. The lower its value, the higher the similarity radius, resulting in more points grouped. Similarly, it exists also for other kernels. Moreover, we choose the C hyperparameter, a penalty we assign for each misclassified data point. The smaller C is, the lower the error penalty. Typically, we look for γ ⊂ [1 × 10⁻⁴, 10] and for C ⊂ [1 × 10⁻¹, 100].
Both models exploit hyperparameters to classify the data—Table 2. We adopt hyperparameter tuning procedures to boost our classification performance, evaluated in terms of ROC-AUC, accuracy, precision, recall and F1-score. The first one is called grid search cross validation. We list the values of the hyperparameters which we would like to test our models with, and we evaluate every combination. At the end of the process, we choose the values attaining the best classification performance on the K-fold cross-validation. The second one is called random search cross-validation. The process is like grid search. However, we choose the hyperparameters utilizing a heuristic search over random values. We present the best-identified hyperparameters chosen after either of these methodologies in Table 2. The hyperparameter tuning processes rely upon pseudo-random number generation, such as selecting the data points belonging to the training and test sets or the K-fold cross validation. We set the random seed on 19 for all the experiments to make the experiments reproducible and to look at the improvements derived from tuning the hyperparameters. The test systems used to conduct our experiments, both for the training phase and the hyperparameters tuning, are equipped with an Intel-i9-9900X CPU, working at 3.5 GHz, 128 GB of RAM and two 2944-cores NVIDIA RTX 2080 GPU. We wrote the code to attain our classification goals using Python and the latest version of the Scikit-Learn library.
3. Results and Discussion
Several studies and reviews highlighted the importance and the role of AI-based medical instruments to aid physicians and engage limited resources [12,21,22]. Researchers are producing novel methodologies to define biomarkers and process signals, reshaping how we address clinical tools [9,10,20,21,22]. Here, we propose two diagnostic tools for COVID-19 detection and oxygen therapy prediction, namely, the need for ventilation support due to lung involvement. The models chosen for the two classification tasks steadily seized convergence throughout optimization concerning the hyperparameters displayed in Table 2. We assessed the gathered results by evaluating accuracy, precision, sensitivity—i.e., recall—and the F1-score [28]. The first metric informs the reader about how good we are at diagnosing the absence of SARS-CoV-2, whilst the latter is the degree of accuracy we have over an unbalanced dataset, measured employing precision and recall. Indeed, the consequences of incorrectly diagnosing a patient as healthy are the inappropriate lack of treatments and cross-contamination among subjects presenting other pathologies.
Considering both clustering scenarios, we found area under the curve levels (Figure 5 and Figure 6) exceeding 93%. At the same time, we measured 96% recall when considering COVID-19 detection. We found an overall F1-score of 92% for the first task and 83% for the second one, and we also measured precision continuously above 80% (Table 3). These results are particularly worthy of notice when compared to the rRT-PCR test. Indeed, the nasopharyngeal swab attains 73.3% sensitivity (95% CI 68.1–78.0%).
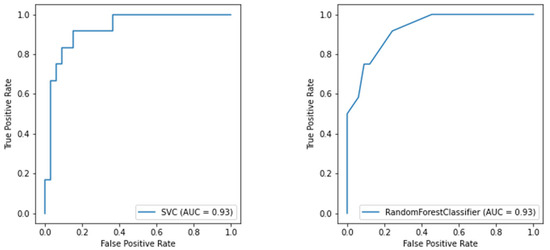
Figure 5.
ROC curve of the SVM model for oxygen therapy classification (on the left) and the ROC curve of the RF model for oxygen therapy classification (on the right).
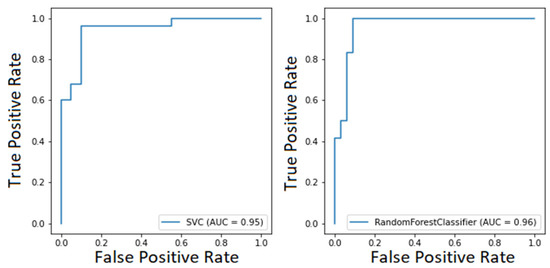
Figure 6.
ROC curve of the SVM model for COVID-19 classification (on the left) and ROC curve of the RF model for COVID-19 classification (on the right).
Table 3.
Test set classification results.
Furthermore, currently, no metric exists to determine if the ED will need other resources [40]. Therefore, we provided a valuable tool to wisely manage the hospital’s limited resources by predicting whether the considered patient will need CPAP or invasive ventilation. Physicians usually make decisions by looking at the patients’ continuous vital signs, whilst we predict future needs concerning a particular time, namely when the patient arrives at the ED. This process implies that the clinical picture we consider could change abruptly at any moment. Nonetheless, we measured an 83% F1-score and ROC-AUC values above 90%, reported in Figure 5.
Comparing our classification performance with our colleagues, which is reported in Table 4 [23,24,26,41], we not only managed to improve their results while considering a more significant number of features, but also handled a smaller and particularly unbalanced dataset. Indeed, concerning COVID-19 detection, we reached 96% of recall, whilst others could exceed 90% only using a three-way model [36]. Namely, a model abstains from prediction when the confidence score is below 75%. Other researchers reached 95.9% sensitivity with 41.7% specificity [41]. Their model represents a valuable screening tool to rule out COVID-19 infection. However, such a low specificity can be dangerous in facing an infectious disease. Indeed, it is more important to identify positive patients and isolate them than to rule out negative ones.
Table 4.
State-of-the-art classification results from [23,26,36,41].
On the one hand, we collected a dataset whose features represent the daily clinical scenario that the physicians are given. Namely, we inserted the quantitative LUS examination together with blood and ABG tests. We believe that this process allowed the robust classification performance obtained. On the other hand, our dataset is smaller than that of our colleagues [23,26,36,41], although we managed to handle both its size and class imbalances, and the LUS examination requires trained personnel to be performed.
Finally, we also designed a graphical user interface (GUI) shown in Figure 7, targeting assistance to the medical personnel during contingency times at the emergency department. The GUI presents five sections for each data group: anamnesis, vital signs, blood gas analyses (BGA), blood tests and LUS score. Completing them with patient’s data, we obtain the probability of being a COVID-19-positive patient according to our classification model.
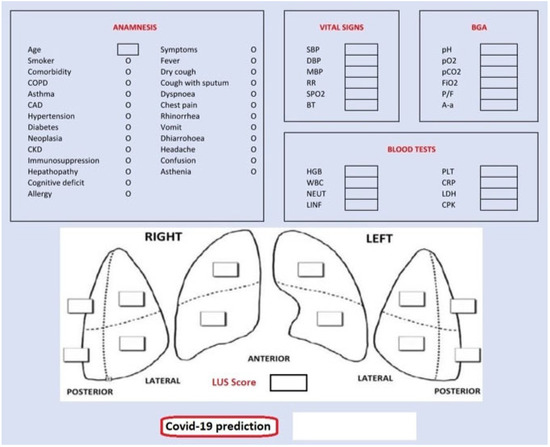
Figure 7.
Graphical user interface (GUI).
4. Conclusions
Concerning the data collected from the routine hospital operations between 1 March and 30 June 2020, our research proved the feasibility of developing reliable algorithms to diagnose SARS-CoV-2 with high classification performance. Furthermore, in addition to what our colleagues had already studied, we demonstrated how to estimate dangerous dyspneic scenarios. Namely, whether the patients need CPAP or invasive aided ventilation, this prediction is noteworthy to manage resources in contingency times. On the grounds of a close and stable collaboration with IRCCS Policlinico San Matteo’s Emergency Department of Pavia, we based the study on highly reliable clinical data to develop two artificially intelligent systems, one of which is equipped with a GUI and was tested by the medical personnel as a supporting decision-making device in a real-world clinical scenario.
Author Contributions
Conceptualization, M.L.S. and E.T.; methodology, M.L.S. and E.T.; software, M.L.S. and E.T.; validation, G.S., C.B., F.S., P.L. and S.P.; investigation, G.S. and S.P.; data curation, C.B.; writing—original draft preparation, M.L.S. and E.T.; writing—review and editing, M.L.S., E.T., F.L. and G.D.; supervision, P.L., S.P., G.D. and F.L. All authors have read and agreed to the published version of the manuscript.
Funding
This research received no external funding.
Institutional Review Board Statement
The study was conducted in accordance with the Declaration of Helsinki, and approved by the Institutional Review Board of Fondazione IRCCS Policlinico San Matteo of Pavia (protocol code 20200040747, 29/97/2020).
Informed Consent Statement
Informed consent was obtained from all subjects involved in the study.
Data Availability Statement
Not applicable.
Acknowledgments
The authors extend their gratitude to GERICO (Gruppo Esteso Ricerca Coronarovirus) Lung US Pavia Study Group: Ilaria Martino, Barbarah Guglielmana, Ilaria Zunino, Federica Quaglia, Pietro Pettenazza, Serena Pioli di Marco, Anna Giulia Falchi, Claudia Alfano, Elisa Mossolani, Lorenzo Demitry, Massimiliano Sciarrini, Caterina Zattera, Igor Maisak, Michele Tassi, Stefano Galati, Capozza, Ilaria Melara, Benedetta Chiodi, Damiano Vignaroli, Lorenzo Scattaglia, Giulia Bissichini and Marco Bazzini.
Conflicts of Interest
The authors declare no conflict of interest.
Abbreviations
| Acronym | Description |
| A-a-g/A-a | Arterial–Alveolar Gradient |
| ABG | Arterial Blood Gas |
| AI | Artificial Intelligence |
| ARDS | Acute Respiratory Distress Syndrome |
| AUC | Area Under the Curve |
| BGA | Blood Gas Analyses |
| Bp | Blood Pressure |
| CPAP | Continuous Positive Airway Pressure |
| CT | Computed Tomography |
| ED | Emergency Department |
| GUI | Graphical User Interface |
| LUS | Lung Ultrasound |
| PCA | Principal Component Analysis |
| Pp | Partial Pressure |
| RBF | Radial Basis Function |
| RF | Random Forest |
| ROC | Receiver Operating Characteristic |
| rRT-PCR | (real-time) Reverse Transcription-Polymerase Chain Reaction (rRT-PCR) |
| SVM | Support Vector Machine |
References
- Livingston, E.; Bucher, K.; Rekito, A. Coronavirus Disease 2019 and Influenza 2019–2020. JAMA 2020, 323, 1122. [Google Scholar] [CrossRef] [PubMed]
- La Salvia, M.; Secco, G.; Torti, E.; Florimbi, G.; Guido, L.; Lago, P.; Salinaro, F.; Perlini, S.; Leporati, F. Deep learning and lung ultrasound for COVID-19 pneumonia detection and severity classification. Comput. Biol. Med. 2021, 136, 104742. [Google Scholar] [CrossRef] [PubMed]
- Mohanty, S.K.; Satapathy, A.; Naidu, M.M.; Mukhopadhyay, S.; Sharma, S.; Barton, L.M.; Stroberg, E.; Duval, E.J.; Pradhan, D.; Tzankov, A.; et al. Severe Acute Respiratory Syndrome Disease 19 (COVID-19)—Anatomic Pathology Perspective on Current Knowledge. Diagn. Pathol. 2020, 15, 103. [Google Scholar] [CrossRef] [PubMed]
- Wiersinga, W.J.; Rhodes, A.; Cheng, A.C.; Peacock, S.J.; Prescott, H.C. Pathophysiology, Transmission, Diagnosis, and Treatment of Coronavirus Disease 2019 (COVID-19): A Review. JAMA 2020, 324, 782–793. [Google Scholar] [CrossRef] [PubMed]
- Lai, C.K.C.; Lam, W. Laboratory testing for the diagnosis of COVID-19. Biochem. Biophys. Res. Commun. 2020, 538, 226–230. [Google Scholar] [CrossRef] [PubMed]
- Lippi, G.; Simundic, A.-M.; Plebani, M. Potential preanalytical and analytical vulnerabilities in the laboratory diagnosis of coronavirus disease 2019 (COVID-19). Clin. Chem. Lab. Med. (CCLM) 2020, 58, 1070–1076. [Google Scholar] [CrossRef]
- Ben-Israel, D.; Jacobs, W.B.; Casha, S.; Lang, S.; Ryu, W.H.A.; de Lotbiniere-Bassett, M.; Cadotte, D.W. The impact of machine learning on patient care: A systematic review. Artif. Intell. Med. 2019, 103, 101785. [Google Scholar] [CrossRef]
- Hussain, I.; Park, S.-J. Quantitative Evaluation of Task-Induced Neurological Outcome after Stroke. Brain Sci. 2021, 11, 900. [Google Scholar] [CrossRef]
- Hussain, I.; Park, S.-J. Prediction of Myoelectric Biomarkers in Post-Stroke Gait. Sensors 2021, 21, 5334. [Google Scholar] [CrossRef]
- Hussain, I.; Park, S.J. HealthSOS: Real-Time Health Monitoring System for Stroke Prognostics. IEEE Access 2020, 8, 213574–213586. [Google Scholar] [CrossRef]
- Hussain, I.; Park, S.J. Big-ECG: Cardiographic Predictive Cyber-Physical System for Stroke Management. IEEE Access 2021, 9, 123146–123164. [Google Scholar] [CrossRef]
- Yu, K.H.; Beam, A.L.; Kohane, I.S. Artificial intelligence in healthcare. Nat. Biomed. Eng. 2018, 2, 719–731. [Google Scholar] [CrossRef] [PubMed]
- Greenspan, H.; Estépar, R.S.J.; Niessen, W.J.; Siegel, E.; Nielsen, M. Position paper on COVID-19 imaging and AI: From the clinical needs and technological challenges to initial AI solutions at the lab and national level towards a new era for AI in healthcare. Med. Image Anal. 2020, 66, 101800. [Google Scholar] [CrossRef] [PubMed]
- Fernandes, M.; Vieira, S.M.; Leite, F.; Palos, C.; Finkelstein, S.; Sousa, J.M. Clinical Decision Support Systems for Triage in the Emergency Department using Intelligent Systems: A Review. Artif. Intell. Med. 2020, 102, 101762. [Google Scholar] [CrossRef]
- Ke, Y.-Y.; Peng, T.-T.; Yeh, T.-K.; Huang, W.-Z.; Chang, S.-E.; Wu, S.-H.; Hung, H.-C.; Hsu, T.-A.; Lee, S.-J.; Song, J.-S.; et al. Artificial intelligence approach fighting COVID-19 with repurposing drugs. Biomed. J. 2020, 43, 355–362. [Google Scholar] [CrossRef]
- Oh, Y.; Park, S.; Ye, J.C. Deep Learning COVID-19 Features on CXR Using Limited Training Data Sets. IEEE Trans. Med. Imaging 2020, 39, 2688–2700. [Google Scholar] [CrossRef]
- Monshi, M.M.A.; Poon, J.; Chung, V.; Monshi, F.M. CovidXrayNet: Optimizing data augmentation and CNN hyperparameters for improved COVID-19 detection from CXR. Comput. Biol. Med. 2021, 133, 104375. [Google Scholar] [CrossRef]
- Harmon, S.A.; Sanford, T.H.; Xu, S.; Turkbey, E.B.; Roth, H.; Xu, Z.; Yang, D.; Myronenko, A.; Anderson, V.; Amalou, A.; et al. Artificial intelligence for the detection of COVID-19 pneumonia on chest CT using multinational datasets. Nat. Commun. 2020, 11, 4080. [Google Scholar] [CrossRef]
- Beck, B.R.; Shin, B.; Choi, Y.; Park, S.; Kang, K. Predicting Commercially Available Antiviral Drugs That May Act on the Novel Coronavirus (SARS-CoV-2) through a Drug-Target Interaction Deep Learning Model. Comput. Struct. Biotechnol. J. 2020, 18, 784–790. [Google Scholar] [CrossRef]
- Musulin, J.; Šegota, S.B.; Štifanić, D.; Lorencin, I.; Anđelić, N.; Šušteršič, T.; Blagojević, A.; Filipović, N.; Ćabov, T.; Markova-Car, E. Application of Artificial Intelligence-Based Regression Methods in the Problem of COVID-19 Spread Prediction: A Systematic Review. Int. J. Environ. Res. Public Health 2021, 18, 4287. [Google Scholar] [CrossRef]
- Rehman, A.; Iqbal, M.; Xing, H.; Ahmed, I. COVID-19 Detection Empowered with Machine Learning and Deep Learning Techniques: A Systematic Review. Appl. Sci. 2021, 11, 3414. [Google Scholar] [CrossRef]
- Alballa, N.; Al-Turaiki, I. Machine learning approaches in COVID-19 diagnosis, mortality, and severity risk prediction: A review. Inform. Med. Unlocked 2021, 24, 100564. [Google Scholar] [CrossRef] [PubMed]
- Brinati, D.; Campagner, A.; Ferrari, D.; Locatelli, M.; Banfi, G.; Cabitza, F. Detection of COVID-19 Infection from Routine Blood Exams with Machine Learning: A Feasibility Study. J. Med. Syst. 2020, 44, 135. [Google Scholar] [CrossRef] [PubMed]
- Alves, M.A.; Castro, G.Z.; Oliveira, B.A.S.; Ferreira, L.A.; Ramírez, J.A.; Silva, R.; Guimarães, F.G. Explaining machine learning based diagnosis of COVID-19 from routine blood tests with decision trees and criteria graphs. Comput. Biol. Med. 2021, 132, 104335. [Google Scholar] [CrossRef] [PubMed]
- Kukar, M.; Gunčar, G.; Vovko, T.; Podnar, S.; Černelč, P.; Brvar, M.; Zalaznik, M.; Notar, M.; Moškon, S.; Notar, M. COVID-19 diagnosis by routine blood tests using machine learning. Sci. Rep. 2021, 11, 3630. [Google Scholar] [CrossRef]
- Goodman-Meza, D.; Rudas, A.; Chiang, J.N.; Adamson, P.C.; Ebinger, J.; Sun, N.; Botting, P.; Fulcher, J.A.; Saab, F.G.; Brook, R.; et al. A machine learning algorithm to increase COVID-19 inpatient diagnostic capacity. PLoS ONE 2020, 15, e0239474. [Google Scholar] [CrossRef]
- Secco, G.; Salinaro, F.; Bellazzi, C.; La Salvia, M.; Delorenzo, M.; Zattera, C.; Barcella, B.; Resta, F.; Vezzoni, G.; Bonzano, M.; et al. Can Alveolar-Arterial Difference and Lung Ultrasound Help the Clinical Decision Making in Patients with COVID-19? Diagnostics 2021, 11, 761. [Google Scholar] [CrossRef]
- Hastie, T.; Tibshirani, R.; Friedman, J. The Elements of Statistical Learning: Data Mining, Inference, and Prediction; Springer Science & Business Media: New York, NY, USA, 2009. [Google Scholar]
- Secco, G.; DeLorenzo, M.; Zattera, C.; Moore, B.G.; Demitry, L.; Vezzoni, G.; Resta, F.; Barcella, B.; Cappa, G.; Perrone, T.; et al. Lung ultrasound in COVID-19: A useful diagnostic tool. Emerg. Care J. 2020, 16, 35–38. [Google Scholar] [CrossRef]
- Horry, M.J.; Chakraborty, S.; Paul, M.; Ulhaq, A.; Pradhan, B.; Saha, M.; Shukla, N. COVID-19 Detection Through Transfer Learning Using Multimodal Imaging Data. IEEE Access 2020, 8, 149808–149824. [Google Scholar] [CrossRef]
- Peng, Q.Y.; Wang, X.T.; Zhang, L.N. Findings of lung ultrasonography of novel corona virus pneumonia during the 2019–2020 epidemic. Intensiv. Care Med. 2020, 46, 849–850. [Google Scholar] [CrossRef]
- Volpicelli, G.; Gargani, L. Sonographic signs and patterns of COVID-19 pneumonia. Ultrasound J. 2020, 12, 22. [Google Scholar] [CrossRef] [PubMed]
- Soldati, G.; Smargiassi, A.; Inchingolo, R.; Buonsenso, D.; Perrone, T.; Briganti, D.F.; Perlini, S.; Torri, E.; Mariani, A.; Mossolani, E.E.; et al. Is There a Role for Lung Ultrasound During the COVID-19 Pandemic? J. Ultrasound Med. 2020, 39, 1459–1462. [Google Scholar] [CrossRef] [PubMed]
- Mongodi, S.; Bouhemad, B.; Orlando, A.; Stella, A.; Tavazzi, G.; Via, G.; Iotti, G.A.; Braschi, A.; Mojoli, F. Modified Lung Ultrasound Score for Assessing and Monitoring Pulmonary Aeration. Ultraschall Med. Eur. J. Ultrasound 2017, 38, 530–537. [Google Scholar] [CrossRef] [PubMed]
- James, G.; Witten, D.; Hastie, T.; Tibshirani, R. Cross validation. In An Introduction to Statistical Learning; Springer: New York, NY, USA, 2013; pp. 176–186. [Google Scholar]
- Cabitza, F.; Campagner, A.; Ferrari, D.; Di Resta, C.; Ceriotti, D.; Sabetta, E.; Colombini, A.; De Vecchi, E.; Banfi, G.; Locatelli, M.; et al. Development, evaluation, and validation of machine learning models for COVID-19 detection based on routine blood tests. Clin. Chem. Lab. Med. (CCLM) 2020, 59, 421–431. [Google Scholar] [CrossRef] [PubMed]
- James, G.; Witten, D.; Hastie, T.; Tibshirani, R. Principal components analysis. In An Introduction to Statistical Learning; Springer: New York, NY, USA, 2013; pp. 374–385. [Google Scholar]
- James, G.; Witten, D.; Hastie, T.; Tibshirani, R. An Introduction to Statistical Learning; Springer: New York, NY, USA, 2013; ISBN 9781461471370. [Google Scholar]
- Pedregosa, F.; Varoquaux, G.; Gramfort, A.; Michel, V.; Thirion, B.; Grisel, O.; Blondel, M.; Prettenhofer, P.; Weiss, R.; Dubourg, V.; et al. Scikit-learn: Machine learning in Python. J. Mach. Learn. Res. 2011, 12, 2825–2830. [Google Scholar] [CrossRef]
- Böger, B.; Fachi, M.M.; Vilhena, R.O.; Cobre, A.F.; Tonin, F.S.; Pontarolo, R. Systematic review with meta-analysis of the accuracy of diagnostic tests for COVID-19. Am. J. Infect. Control 2020, 49, 21–29. [Google Scholar] [CrossRef]
- Plante, T.B.; Blau, A.M.; Berg, A.N.; Weinberg, A.S.; Jun, I.C.; Tapson, V.F.; Kanigan, T.S.; Adib, A.B. Development and External Validation of a Machine Learning Tool to Rule Out COVID-19 among Adults in the Emergency Department Using Routine Blood Tests: A Large, Multicenter, Real-World Study. J. Med. Internet Res. 2020, 22, e24048. [Google Scholar] [CrossRef]


Publisher’s Note: MDPI stays neutral with regard to jurisdictional claims in published maps and institutional affiliations. |
© 2022 by the authors. Licensee MDPI, Basel, Switzerland. This article is an open access article distributed under the terms and conditions of the Creative Commons Attribution (CC BY) license (https://creativecommons.org/licenses/by/4.0/).