
Imputation Methods for scRNA Sequencing Data

 ,
,
Abstract
1. Introduction
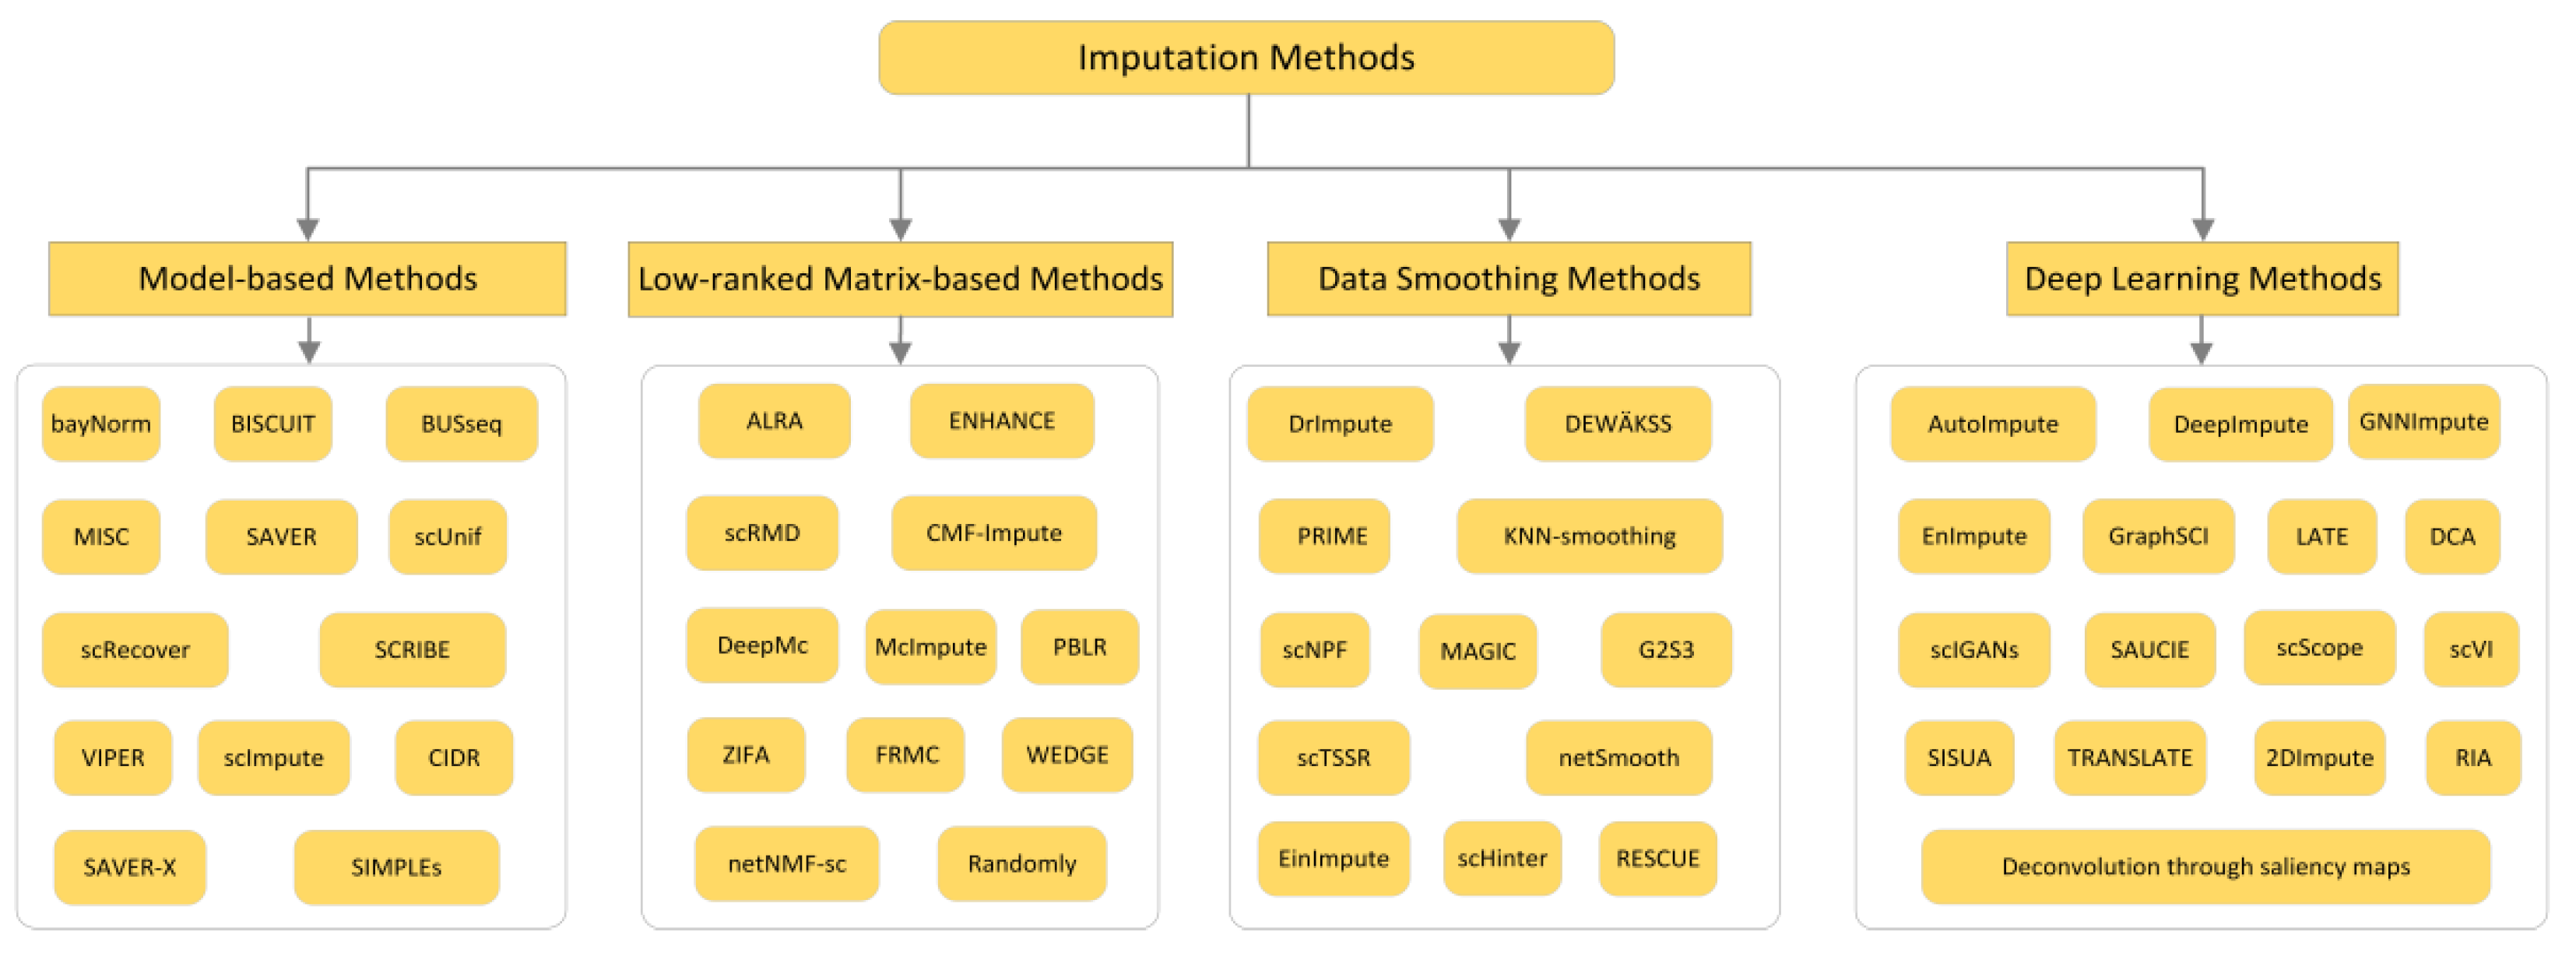
2. Imputation Methods
2.1. Model-Based Methods
- (1)
- scImpute reduces the dimension of gene expression matrix by principal component analysis (PCA) and uses spectral clustering. The hierarchical model of Gamma distribution and Normal distribution is established for the gene expression in each cell subpopulation, the Gamma distribution can explain “dropout” and the Normal distribution represents the real gene expression level. Then, the Gamma-Normal mixed model is used to estimate which values are affected by dropout, then the dropout values are subsequently imputed by non-negative least square (NNLS) regression using the most similar cells in its neighbors, as shown in Figure 5. The specific workflow is as follows [4]:
- (a)
- The count matrix is normalized according to the library size of each sample (cell), and the logarithmic transformation is performed to prevent the effect of outliers.
- (b)
- Cell sub-population and outliers are detected using spectral clustering.
- (c)
- Dropout values were identified using a Gamma-Normal mixed model.
- (d)
- Information from the same genes is borrowed from similar cells to impute in the dropout values.
- (2)
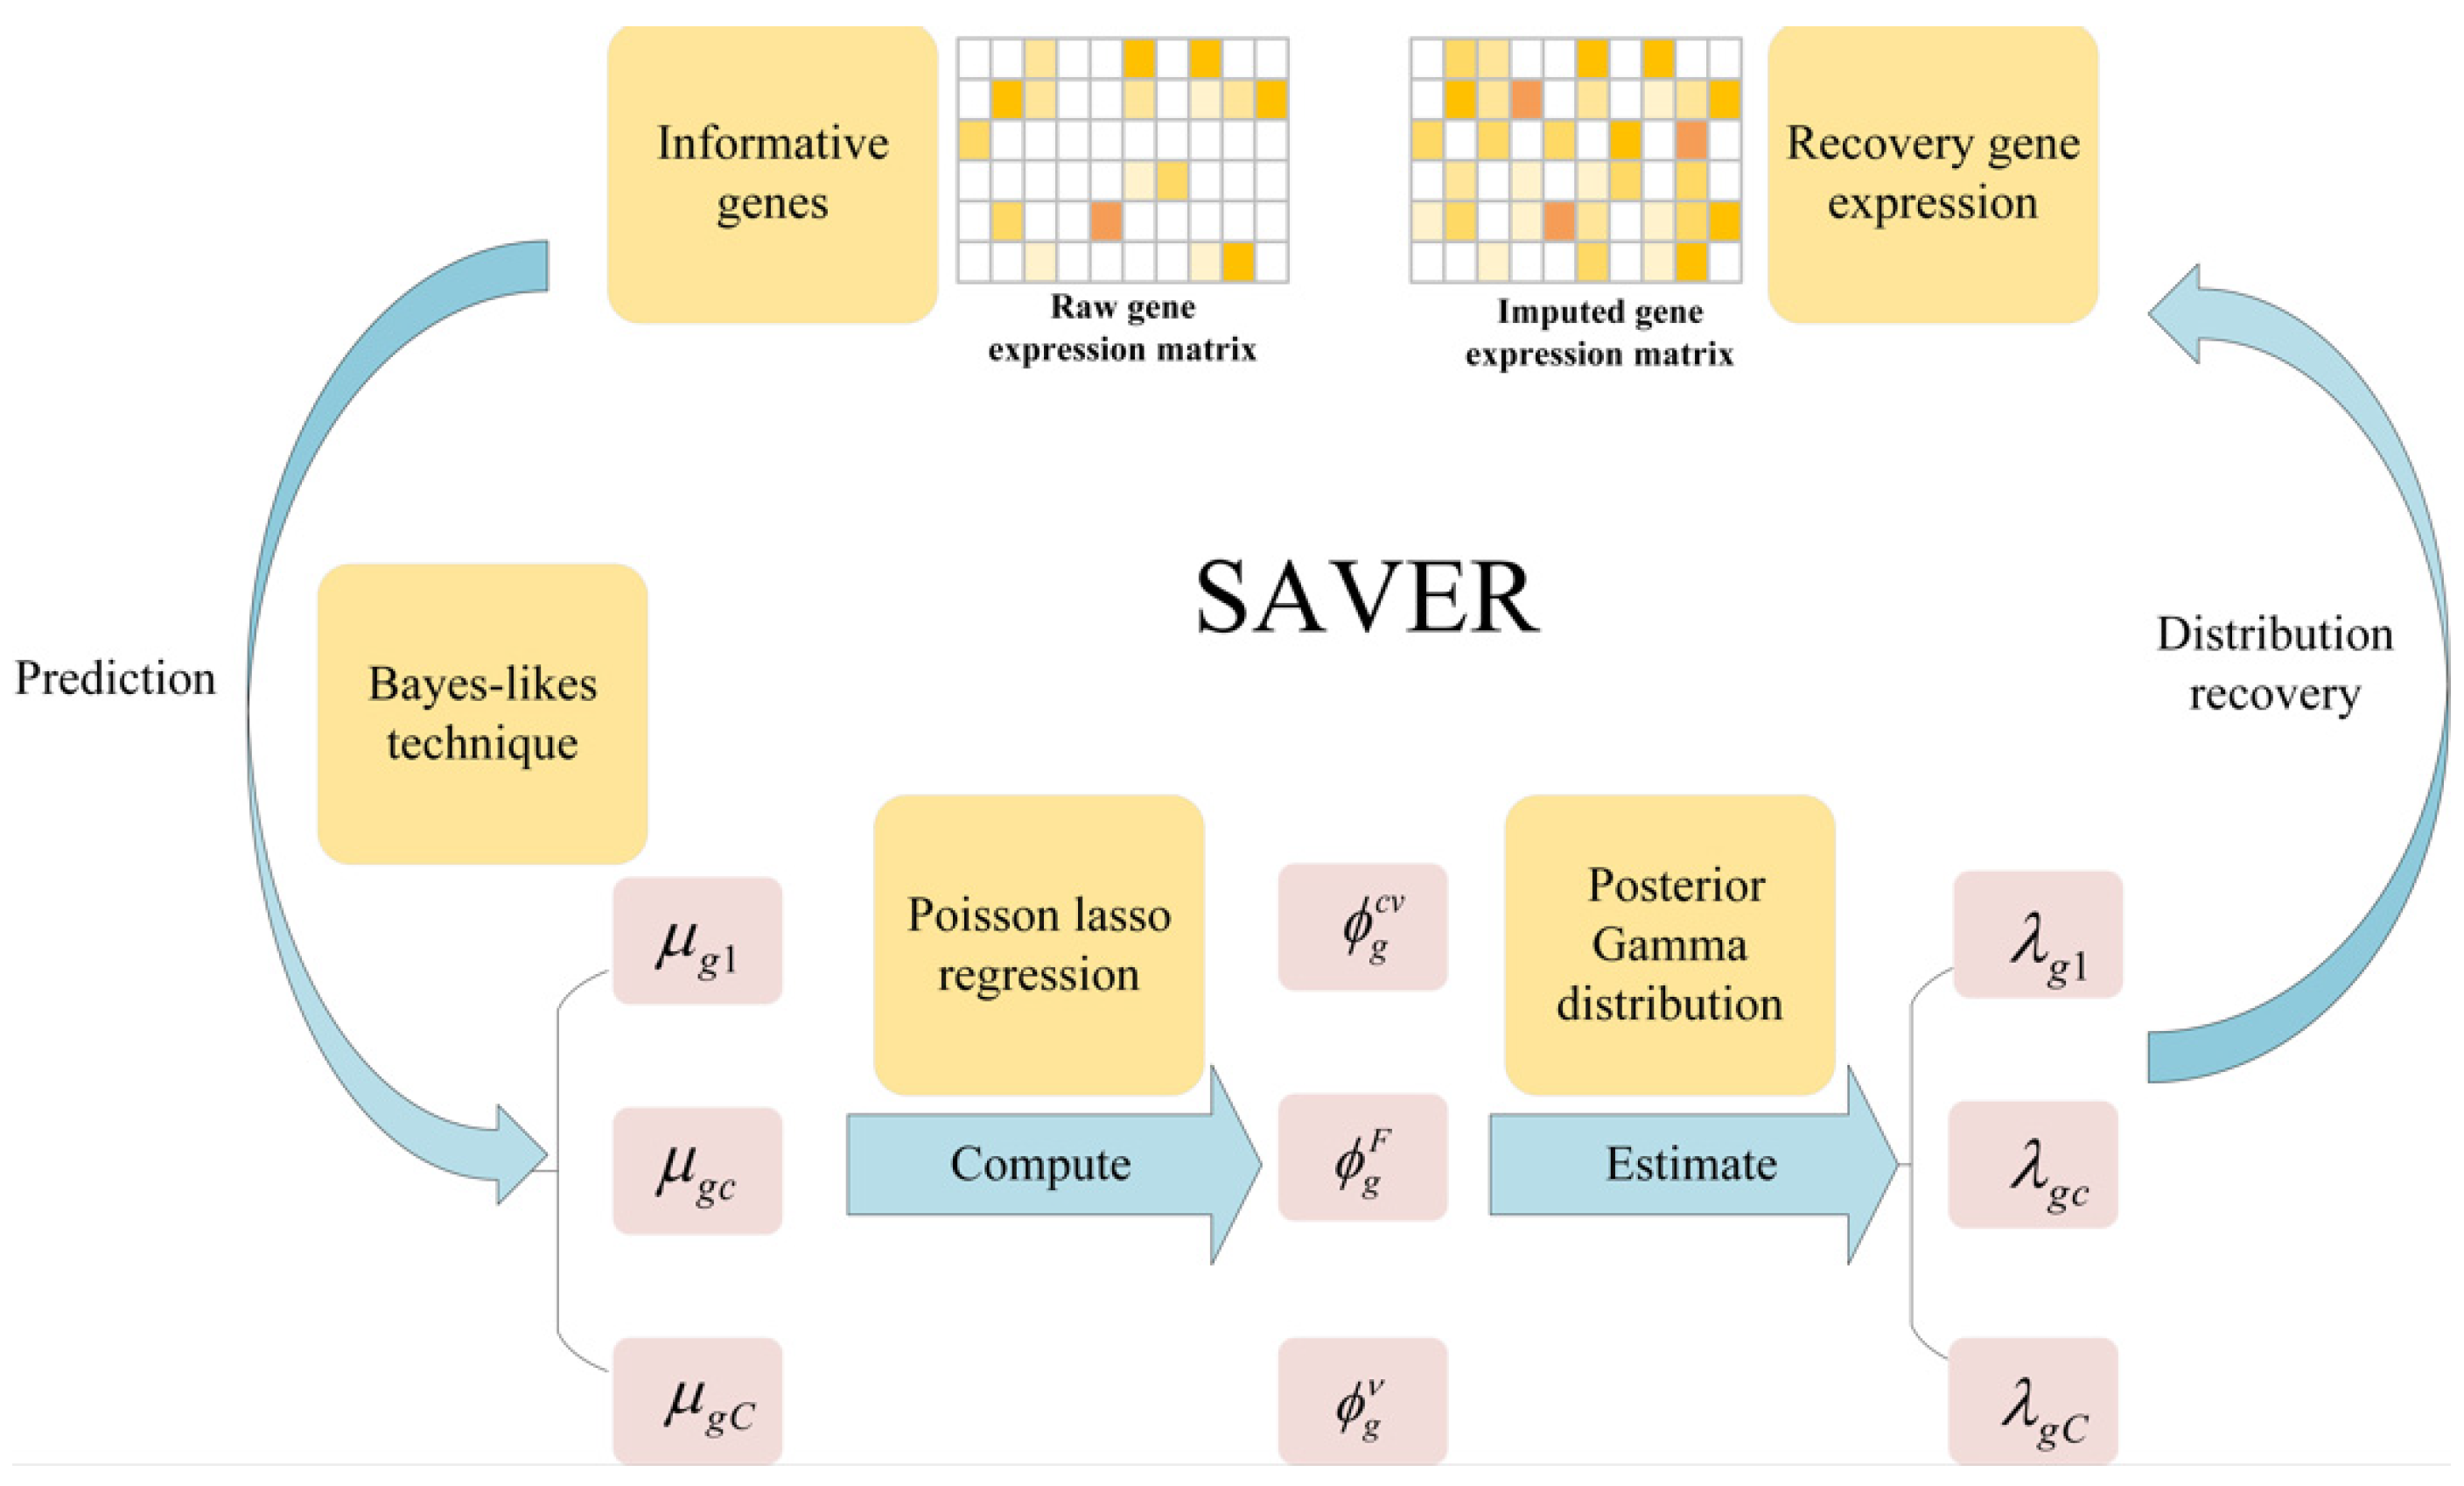
- SAVER assumes that the count of each gene in each cell follows the Possion-Gamma mixed distribution. Specifically, the technical noise in the gene expression signal is approximated by the Possion distribution, while the Gamma distribution explains the uncertainty in the real expression. The method does not specify a gamma prior, but instead uses the expression of other genes as the predictors, by using a Poisson Lasso regression to estimate a few prior parameters in the empirical Bayes-like approach. Once the prior parameters are estimated, the SAVER outputs the posterior distribution of the true expression that quantifies the estimated uncertainty, and the posterior mean is used as the expression value for the SAVER recovery, for more detail, please refer to Ref. [26]. We give a simple framework as shown in Figure 6.
- (3)
- SAVER-X combines a Bayesian hierarchical model with a pre-trained depth autoencoder by recovering the expression of external data for single cell analysis. The pre-training of automatic encoder in SAVER-X includes the sharing network between humans and mice. Specifically, for the target data with UMI counting matrix, SAVER-X trains the target data using an autoencoder without selecting a pre-training model, then uses cross validation to filter unpredictable genes, and uses empirical Bayesian shrinkage to estimate the final denoising value [27].
- (4)
- BISCUIT is a hierarchical Bayesian mixture model with a specific cell scaling, which is realized by incorporating the parameters representing technical variation into the hierarchical Dirichlet process hybrid model, and infers cell clusters according to similar gene expression and determines the technical variation of each cell. In addition, the model can impute dropout values based on cells with similar co-expression patterns [35].
- (5)
- VIPER borrows information from cells with similar expression patterns to impute the expression measurements of interested cells. However, unlike other methods, it does not perform cell clustering before imputation, and it uses a sparse non-generative regression model to actively select a sparse set of local neighborhood cells, the selection of these cells estimates their associated imputation weights in the final estimation step [48].
- (6)
- bayNorm is a Bayesian method for recovering the true counts of scRNA-seq. The likelihood function for the mRNA capture of the proposed method follows a Binomial model, and uses an empirical Bayesian method to estimate its prior from expression values across cells. In order to simulate biological variability, bayNorm makes a priori analysis of the potential real gene expression level by modeling them as a variable following NB distribution. The parameters can then be estimated locally or globally, depending on one’s interest in magnifying or not magnifying the differences between cell groups [38].
2.2. Low-Ranked Matrix-Based Methods
- (1)
- scRMD imputes the gene expression value by robust matrix decomposition (RMD). It reasonably decomposes the observed gene expression matrix into three contents: potential gene expression matrix, dropouts, and noise, and transforms the dropout value imputation problem into an optimization problem. The optimal gene expression value affected by dropout events is estimated by the alternating direction multiplier method, for more detail, please refer to Ref. [6]. We give a simple framework as shown in Figure 7.
- (2)
- McImpute models the gene expression matrix as a low-rank matrix, takes the preprocessed gene expression matrix as the input of the Nuclear-norm minimization algorithm, and recovers the gene expression value of the complete matrix by solving non-convex optimization problems. A remarkable feature of McImpute is that it does not assume that gene expression follows a certain distribution, for more detail, please refer to Ref. [3]. We give a simple framework as shown in Figure 8.
- (3)
- PBLR is a bounded low-rank method based on cell subsets, it not only considers the information of cell heterogeneity and gene expression, but also uses the change of gene expression to impute dropouts. The PBLR first extracts the data for the selected high-variable genes, and calculates the three affinity matrices based on the Pearson, Spearman, and Cosine metrics, respectively. PBLR then learns the consensus matrix by performing SymNMF (symmetric non-negative matrix factorization) on the three affinity matrices INMF (incomplete NMF) of the sub-matrix of the selected genes. PBLR further infers cell sub-populations by performing a hierarchical clustering of the consensus matrix. Finally, PBLR estimates the expression upper bound for the ‘dropout’ values and recovers the zero gene expression by performing a bounded low-rank recovery model for each sub-matrix determined by each cell sub-population [72].
- (4)
- ENHANCE utilizes PCA and KNN to reduce the noise for the gene expression values. The method consists of two main steps. The first aggregates the expression values to reduce the bias against highly expressed genes. In the second stage, the aggregation matrix is projected onto the first k principal component, where k only represents the real biological difference. Finally, the selected components can obtain the final denoising matrix [69].
2.3. Data Smoothing Methods
- (1)
- MAGIC is a method for explicit and genome-wide inference of single-cell gene expression profiles. This method is based on the concept of thermal diffusion and calculates the dropout gene expression values by sharing information among similar cells. MAGIC constructs the Markov transition matrix by normalizing the similarity matrix of a single cell, and then carries out ‘soft’ clustering to replace the original expression of genes with their weighted average expression in clustering, thus realizing dropout value imputation, for more detail, please refer to Ref. [36]. We give a simple framework as shown in Figure 9.
- (2)
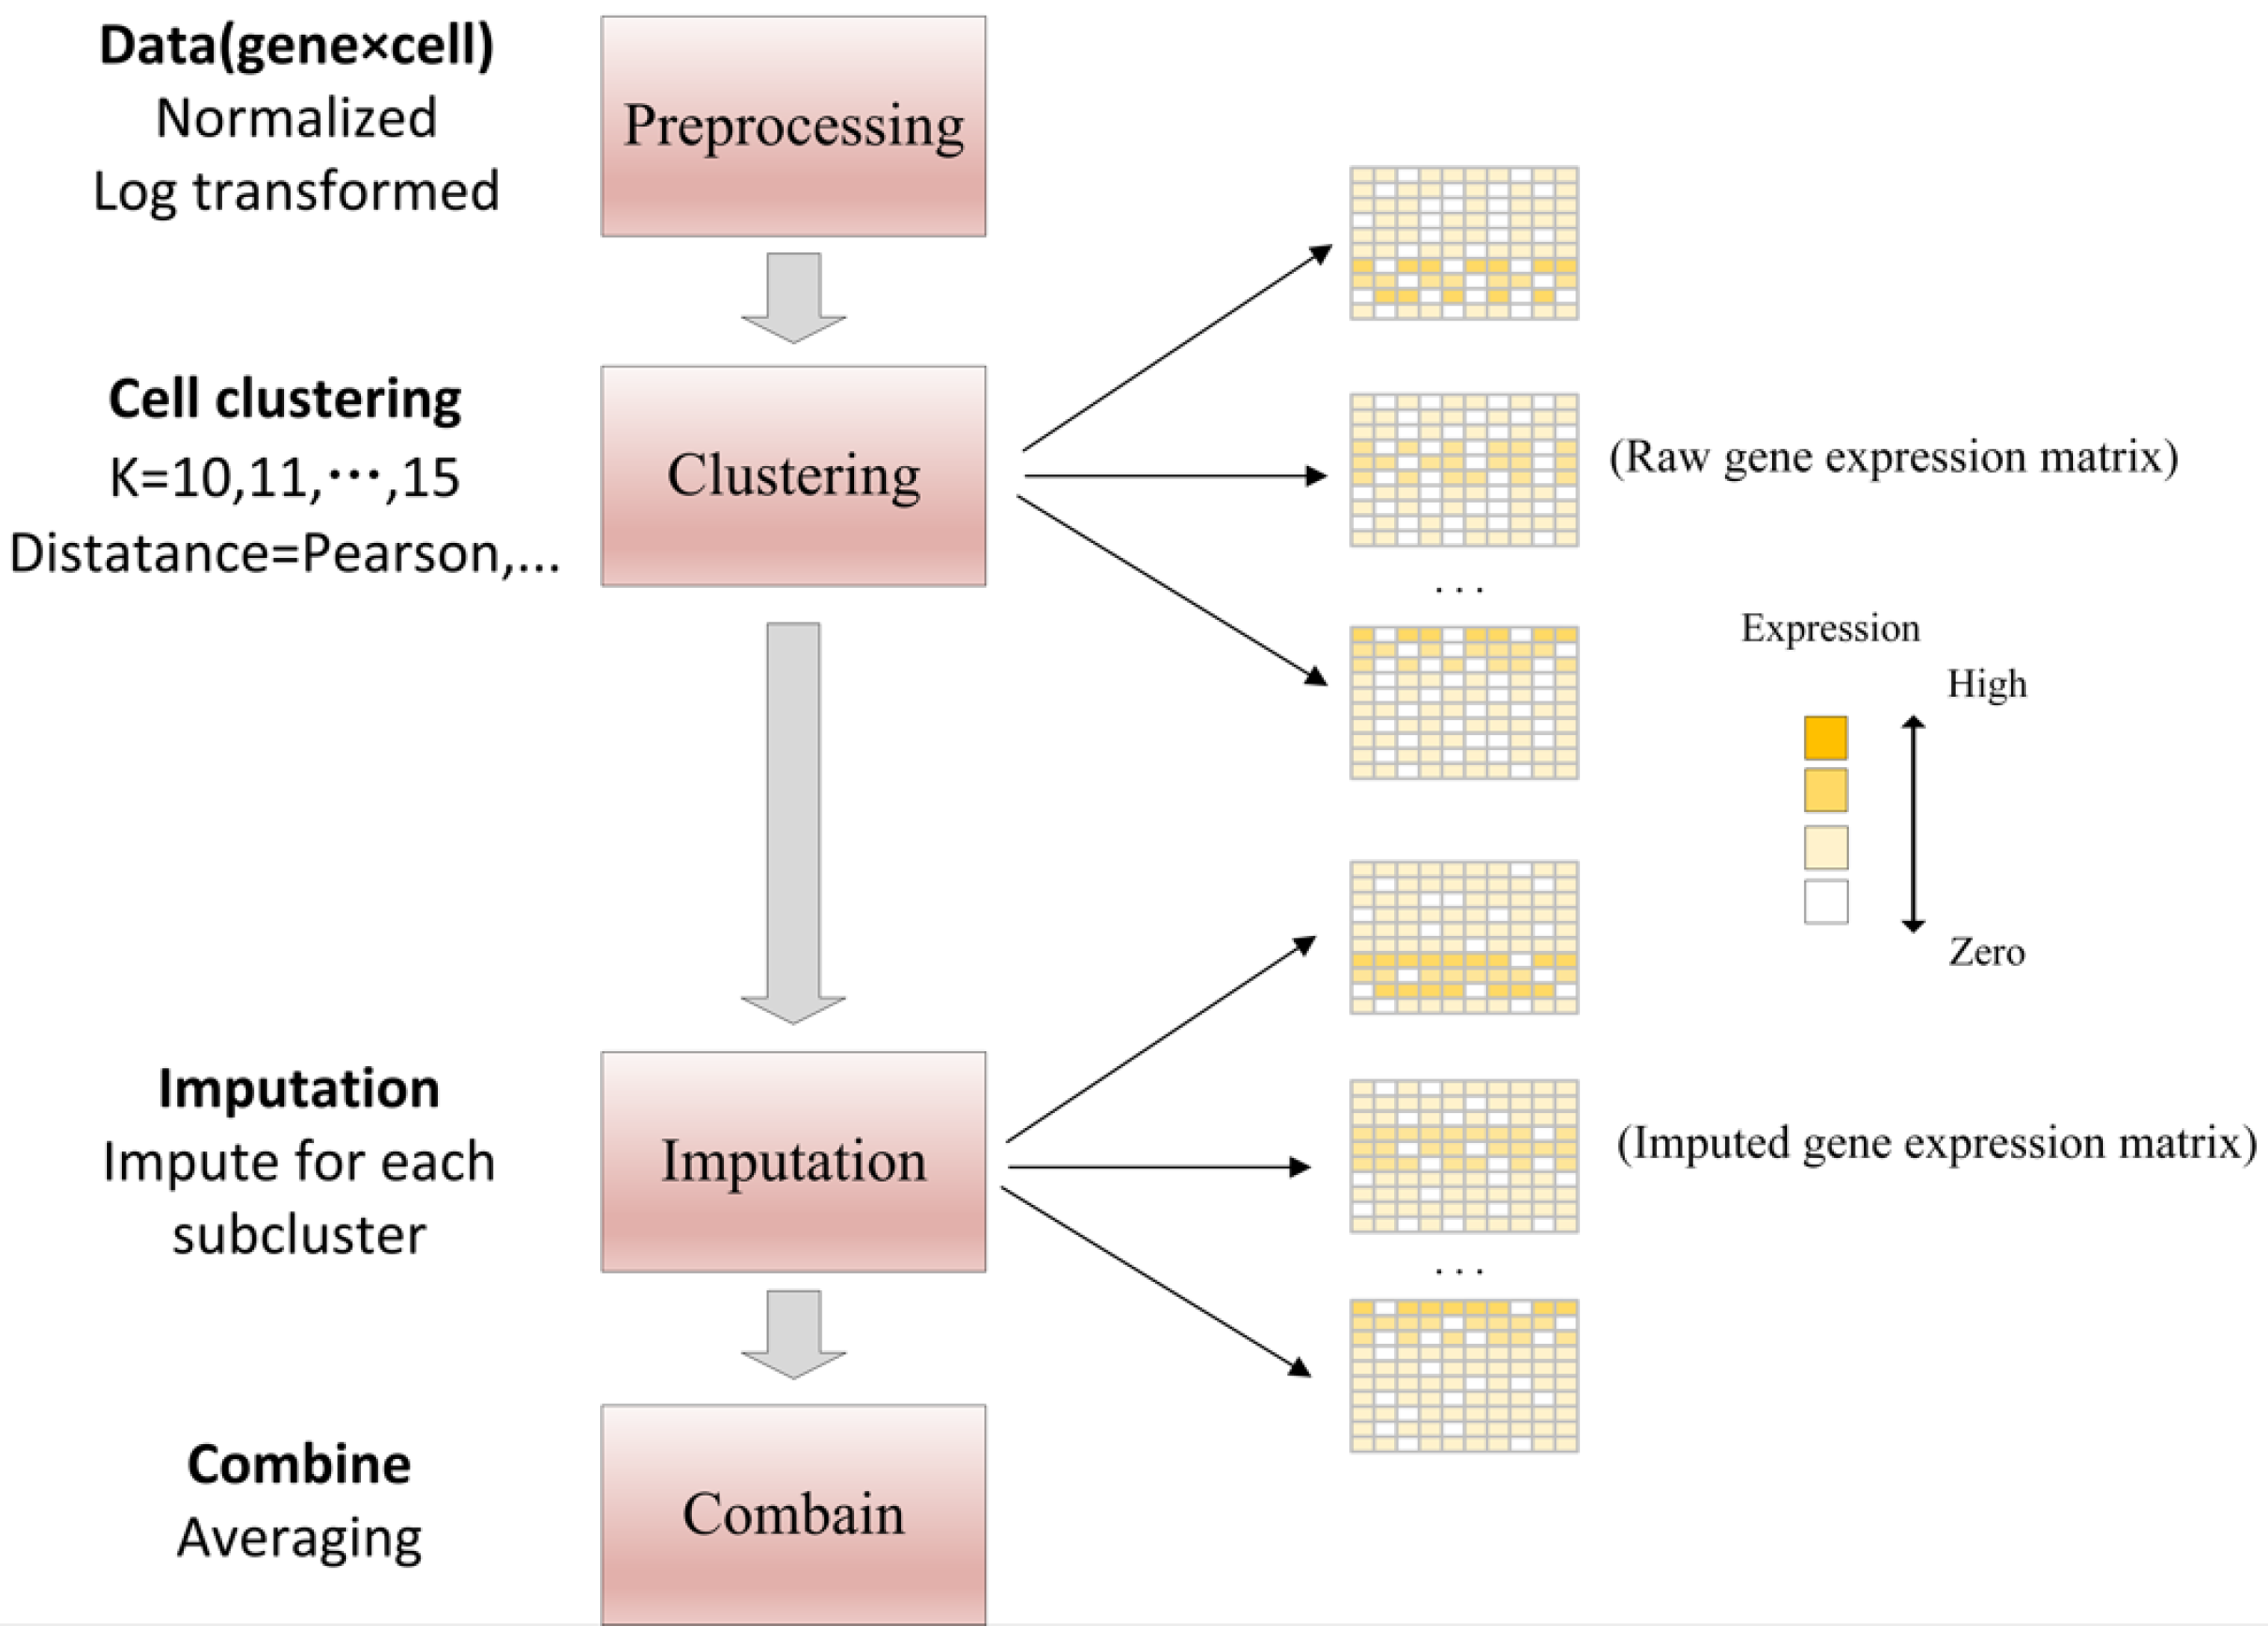
- DrImpute first identifies similar cells based on clustering, and then recovers single cell data by averaging expression values from similar cells. In order to achieve robust estimation, it uses different cell clustering to perform multiple imputing “dropout”, then averaging multiple estimation results of the final imputation, as shown in Figure 10. The specific workflow is as follows [49]:
- (a)
- Raw read counts are normalized by size factor and then log-transformed on the data.
- (b)
- The first 5% principal components of the similarity matrix are clustered with the k-means using the Pearson and Spearman correlations.
- (c)
- Borrowing average expression values from similar cells to recover single-cell gene expression data.
- (3)
- kNN-smoothing models technical variance using a Poisson distribution and imputation is conducted via discreet smoothing or variance-stabilization of the expression profiles. kNN-smoothing 2 is a major improvement over the original algorithm, and performs much better whenever the data contain cell populations with very similar expression profiles. kNN-smoothing 2 completely replaces the original version. It takes two parameters (k and d). k is the number of neighbors to use for smoothing (same as in the original version), and d is the number of principal components used for determining the nearest neighbors in each smoothing step [29]. MAGIC, DrImpute, and kNN-smoothing are three classical data smoothing methods.
2.4. Deep Learning Methods
- (1)
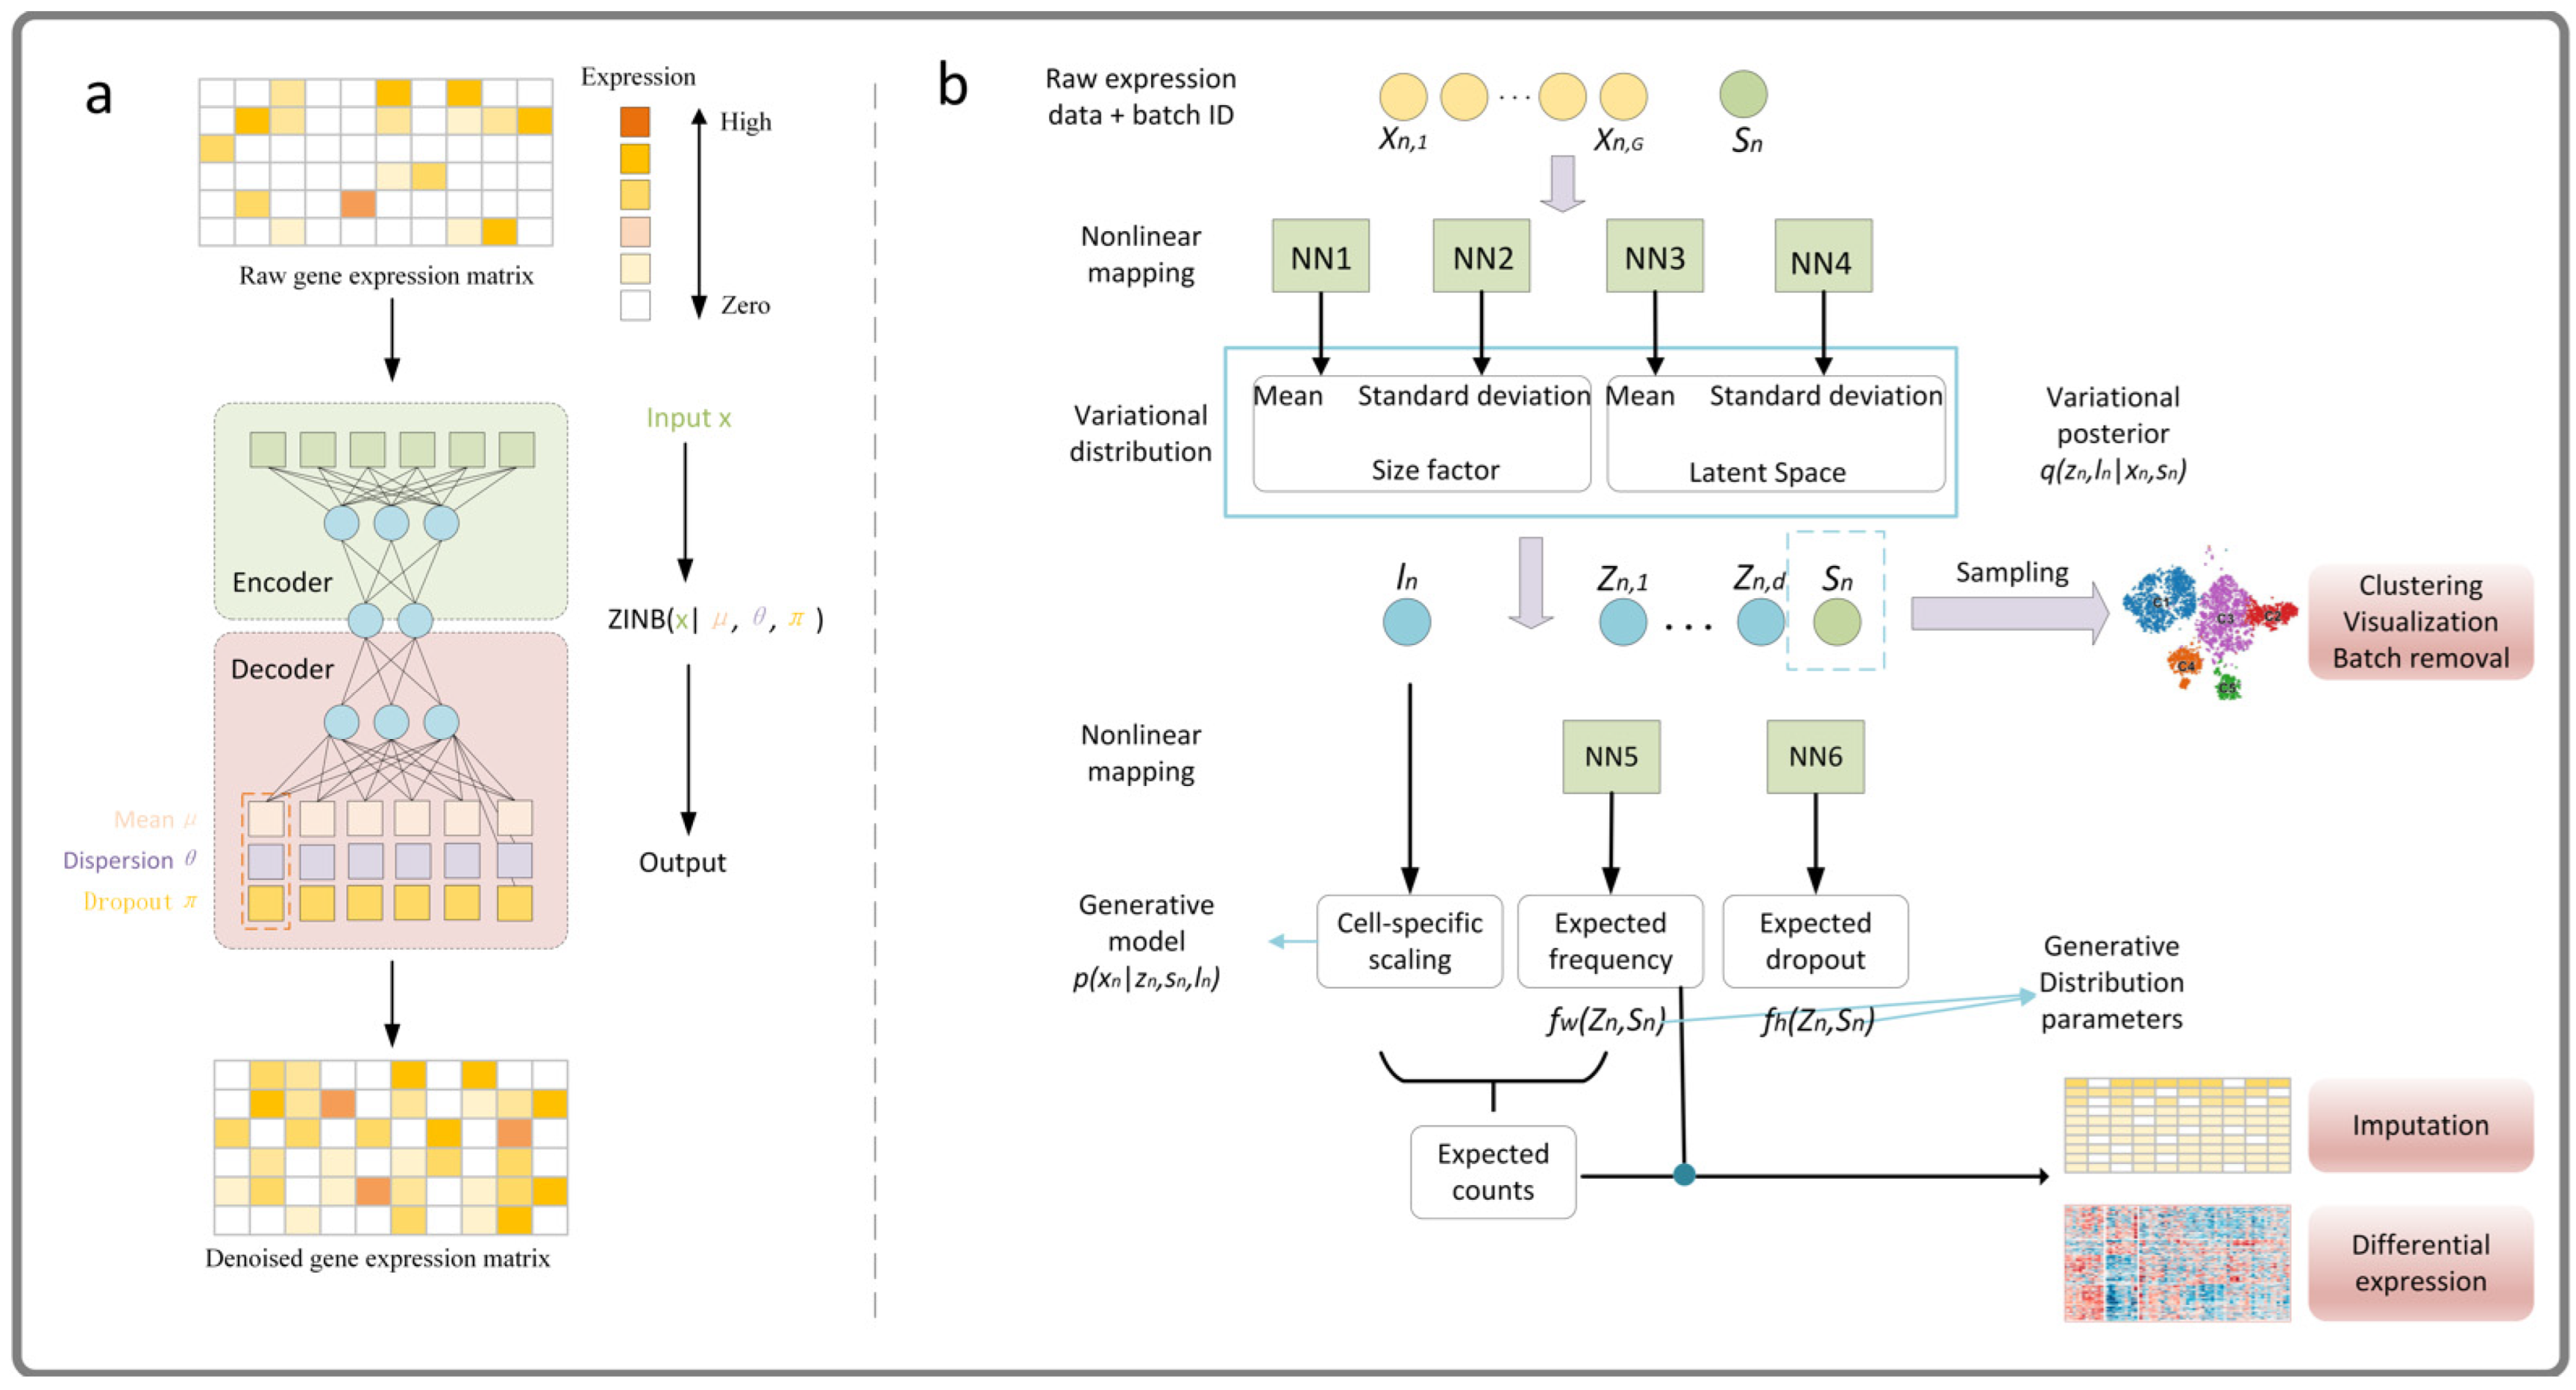
- DCA is an imputation method based on automatic encoder, it uses a negative binomial noise model with or without zero expansion. By considering the count distribution, super-dispersion, and sparsity of data, it can capture nonlinear gene–gene dependence. DCA learns gene-specific distribution parameters by minimizing the reconstruction error in an unsupervised manner, rather than reconstructing the input data itself, for more detail, please refer to Ref. [32]. We give a simple framework as shown in Figure 11a.
- (2)
- LATE uses the initial values of a randomly generated parameter to train an autoencoder on highly sparse scRNA-seq data, and the TRANSLATE method builds on LATE, further using the reference gene expression data set to provide LATE with an initial set of parameter estimates. Hence, the user can train the autoencoder on a reference gene expression dataset and then use the weights and biases as initial values for imputing the dataset of interest. These algorithms are highly scalable in graphics processing units and can handle more than 1 million cells in a few hours [60].
- (3)
- scVI is a fully probabilistic method for the standardization and analysis of scRNA-seq data. The method is based on a hierarchical Bayesian model with conditional distribution specified by a deep neural network. The transcriptome of each cell is encoded into low-dimensional potential vectors of normal random variables by nonlinear transformation. This potential representation is decoded by another nonlinear transformation to generate an a posteriori estimate of the distributional parameters of each gene in each cell, for more detail, please refer to Ref. [84]. We give a simple framework as shown in Figure 11b. Both the deep learning method and the low-rank matrix representation method use the idea of data reconstruction.
3. Conclusions and Discussion
Author Contributions
Funding
Institutional Review Board Statement
Informed Consent Statement
Data Availability Statement
Conflicts of Interest
References
- Wang, Z.; Gerstein, M.; Snyder, M. RNA-Seq: A revolutionary tool for transcriptomics. Nat. Rev. Genet. 2009, 10, 57–63. [Google Scholar] [CrossRef] [PubMed]
- Prabhakaran, S.; Azizi, E.; Carr, A.; Pe’er, D. Dirichlet Process Mixture Model for Correcting Technical Variation in Single-Cell Gene Expression Data. JMLR Workshop Conf. Proc. 2016, 48, 1070–1079. [Google Scholar]
- Mongia, A.; Sengupta, D.; Majumdar, A. McImpute: Matrix Completion Based Imputation for Single Cell RNA-seq Data. Front. Genet. 2019, 10, 9. [Google Scholar] [CrossRef]
- Li, W.V.; Li, J.J. An accurate and robust imputation method scImpute for single-cell RNA-seq data. Nat. Commun. 2018, 9, 997. [Google Scholar] [CrossRef] [PubMed]
- Qi, J.; Zhou, Y.; Zhao, Z.; Jin, S. SDImpute: A statistical block imputation method based on cell-level and gene-level information for dropouts in single-cell RNA-seq data. PLoS Comput. Biol. 2021, 17, e1009118. [Google Scholar] [CrossRef]
- Chen, C.; Wu, C.; Wu, L.; Wang, X.; Deng, M.; Xi, R. scRMD: Imputation for single cell RNA-seq data via robust matrix decomposition. Bioinformatics 2020, 36, 3156–3161. [Google Scholar] [CrossRef]
- Vallejos, C.A.; Marioni, J.C.; Richardson, S. BASiCS: Bayesian Analysis of Single-Cell Sequencing Data. PLoS Comput. Biol. 2015, 11, e1004333. [Google Scholar] [CrossRef]
- Kolodziejczyk, A.A.; Kim, J.K.; Svensson, V.; Marioni, J.C.; Teichmann, S.A. The technology and biology of single-cell RNA sequencing. Mol. Cell 2015, 58, 610–620. [Google Scholar] [CrossRef]
- Kalisky, T.; Blainey, P.; Quake, S.R. Genomic analysis at the single-cell level. Annu. Rev. Genet. 2011, 45, 431–445. [Google Scholar] [CrossRef]
- Ting, D.T.; Wittner, B.S.; Ligorio, M.; Vincent Jordan, N.; Shah, A.M.; Miyamoto, D.T.; Aceto, N.; Bersani, F.; Brannigan, B.W.; Xega, K.; et al. Single-cell RNA sequencing identifies extracellular matrix gene expression by pancreatic circulating tumor cells. Cell Rep. 2014, 8, 1905–1918. [Google Scholar] [CrossRef]
- Hwang, B.; Lee, J.H.; Bang, D. Single-cell RNA sequencing technologies and bioinformatics pipelines. Exp. Mol. Med. 2018, 50, 1–14. [Google Scholar] [CrossRef] [PubMed]
- Kim, K.-T.; Lee, H.W.; Lee, H.-O.; Kim, S.C.; Seo, Y.J.; Chung, W.; Eum, H.H.; Nam, D.-H.; Kim, J.; Joo, K.M.; et al. Single-cell mRNA sequencing identifies subclonal heterogeneity in anti-cancer drug responses of lung adenocarcinoma cells. Genome Biol. 2015, 16, 127. [Google Scholar] [CrossRef] [PubMed]
- Lawson, D.A.; Kessenbrock, K.; Davis, R.T.; Pervolarakis, N.; Werb, Z. Tumour heterogeneity and metastasis at single-cell resolution. Nat. Cell Biol. 2018, 20, 1349–1360. [Google Scholar] [CrossRef]
- Puram, S.V.; Tirosh, I.; Parikh, A.S.; Patel, A.P.; Yizhak, K.; Gillespie, S.; Rodman, C.; Luo, C.L.; Mroz, E.A.; Emerick, K.S.; et al. Single-Cell Transcriptomic Analysis of Primary and Metastatic Tumor Ecosystems in Head and Neck Cancer. Cell 2017, 171, 1611–1624.e24. [Google Scholar] [CrossRef]
- Li, L.; Xiong, F.; Wang, Y.; Zhang, S.; Gong, Z.; Li, X.; He, Y.; Shi, L.; Wang, F.; Liao, Q.; et al. What are the applications of single-cell RNA sequencing in cancer research: A systematic review. J. Exp. Clin. Cancer Res. 2021, 40, 163. [Google Scholar] [CrossRef]
- Andrews, T.S.; Hemberg, M. M3Drop: Dropout-based feature selection for scRNASeq. Bioinformatics 2019, 35, 2865–2867. [Google Scholar] [CrossRef]
- Kiselev, V.Y.; Andrews, T.S.; Hemberg, M. Challenges in unsupervised clustering of single-cell RNA-seq data. Nat. Rev. Genet. 2019, 20, 273–282. [Google Scholar] [CrossRef]
- Kharchenko, P.V.; Silberstein, L.; Scadden, D.T. Bayesian approach to single-cell differential expression analysis. Nat. Methods 2014, 11, 740–742. [Google Scholar] [CrossRef]
- Stegle, O.; Teichmann, S.A.; Marioni, J.C. Computational and analytical challenges in single-cell transcriptomics. Nat. Rev. Genet. 2015, 16, 133–145. [Google Scholar] [CrossRef]
- Chen, G.; Ning, B.; Shi, T. Single-Cell RNA-Seq Technologies and Related Computational Data Analysis. Front. Genet. 2019, 10, 317. [Google Scholar] [CrossRef]
- Zhang, L.; Zhang, S. Comparison of Computational Methods for Imputing Single-Cell RNA-Sequencing Data. IEEE/ACM Trans. Comput. Biol. Bioinform. 2020, 17, 376–389. [Google Scholar] [CrossRef] [PubMed]
- Patruno, L.; Maspero, D.; Craighero, F.; Angaroni, F.; Antoniotti, M.; Graudenzi, A. A review of computational strategies for denoising and imputation of single-cell transcriptomic data. Brief. Bioinform. 2021, 22, bbaa222. [Google Scholar] [CrossRef] [PubMed]
- Hou, W.; Ji, Z.; Ji, H.; Hicks, S.C. A systematic evaluation of single-cell RNA-sequencing imputation methods. Genome Biol. 2020, 21, 218. [Google Scholar] [CrossRef]
- Basharat, Z.; Majeed, S.; Saleem, H.; Khan, I.A.; Yasmin, A. An Overview of Algorithms and Associated Applications for Single Cell RNA-Seq Data Imputation. Curr. Genom. 2021, 22, 319–327. [Google Scholar] [CrossRef] [PubMed]
- Lähnemann, D.; Köster, J.; Szczurek, E.; McCarthy, D.J.; Hicks, S.C.; Robinson, M.D.; Vallejos, C.A.; Campbell, K.R.; Beerenwinkel, N.; Mahfouz, A.; et al. Eleven grand challenges in single-cell data science. Genome Biol. 2020, 21, 31. [Google Scholar] [CrossRef] [PubMed]
- Huang, M.; Wang, J.; Torre, E.; Dueck, H.; Shaffer, S.; Bonasio, R.; Murray, J.I.; Raj, A.; Li, M.; Zhang, N.R. SAVER: Gene expression recovery for single-cell RNA sequencing. Nat. Methods 2018, 15, 539–542. [Google Scholar] [CrossRef]
- Wang, J.; Agarwal, D.; Huang, M.; Hu, G.; Zhou, Z.; Ye, C.; Zhang, N.R. Data denoising with transfer learning in single-cell transcriptomics. Nat. Methods 2019, 16, 875–878. [Google Scholar] [CrossRef]
- Lin, P.; Troup, M.; Ho, J.W.K. CIDR: Ultrafast and accurate clustering through imputation for single-cell RNA-seq data. Genome Biol. 2017, 18, 59. [Google Scholar] [CrossRef]
- Wagner, F.; Yan, Y.; Yanai, I. K-nearest neighbor smoothing for high-throughput single-cell RNA-Seq data. BioRxiv 2018, 217737. [Google Scholar] [CrossRef]
- Tjärnberg, A.; Mahmood, O.; Jackson, C.A.; Saldi, G.-A.; Cho, K.; Christiaen, L.A.; Bonneau, R.A. Optimal tuning of weighted kNN- and diffusion-based methods for denoising single cell genomics data. PLoS Comput. Biol. 2021, 17, e1008569. [Google Scholar] [CrossRef]
- Jin, K.; Ou-Yang, L.; Zhao, X.-M.; Yan, H.; Zhang, X.-F. scTSSR: Gene expression recovery for single-cell RNA sequencing using two-side sparse self-representation. Bioinformatics 2020, 36, 3131–3138. [Google Scholar] [CrossRef] [PubMed]
- Eraslan, G.; Simon, L.M.; Mircea, M.; Mueller, N.S.; Theis, F.J. Single-cell RNA-seq denoising using a deep count autoencoder. Nat. Commun. 2019, 10, 390. [Google Scholar] [CrossRef] [PubMed]
- Arisdakessian, C.; Poirion, O.; Yunits, B.; Zhu, X.; Garmire, L.X. DeepImpute: An accurate, fast, and scalable deep neural network method to impute single-cell RNA-seq data. Genome Biol. 2019, 20, 211. [Google Scholar] [CrossRef] [PubMed]
- Jin, K.; Li, B.; Yan, H.; Zhang, X.-F. Imputing dropouts for single-cell RNA sequencing based on multi-objective optimization. Bioinformatics 2022, btac300. [Google Scholar] [CrossRef] [PubMed]
- Azizi, E.; Prabhakaran, S.; Carr, A.; Pe’er, D. Bayesian inference for single-cell clustering and imputing. Genom. Comput. Biol. 2017, 3, 46. [Google Scholar] [CrossRef]
- Van Dijk, D.; Sharma, R.; Nainys, J.; Yim, K.; Kathail, P.; Carr, A.J.; Burdziak, C.; Moon, K.R.; Chaffer, C.L.; Pattabiraman, D.; et al. Recovering Gene Interactions from Single-Cell Data Using Data Diffusion. Cell 2018, 174, 716–729.e27. [Google Scholar] [CrossRef] [PubMed]
- Ronen, J.; Akalin, A. netSmooth: Network-smoothing based imputation for single cell RNA-seq. F1000Res 2018, 7, 8. [Google Scholar] [CrossRef]
- Tang, W.; Bertaux, F.; Thomas, P.; Stefanelli, C.; Saint, M.; Marguerat, S.; Shahrezaei, V. bayNorm: Bayesian gene expression recovery, imputation and normalization for single-cell RNA-sequencing data. Bioinformatics 2020, 36, 1174–1181. [Google Scholar] [CrossRef]
- Lu, F.; Lin, Y.; Yuan, C.; Zhang, X.-F.; Ou-Yang, L. EnTSSR: A Weighted Ensemble Learning Method to Impute Single-Cell RNA Sequencing Data. IEEE/ACM Trans. Comput. Biol. Bioinform. 2021, 18, 2781–2787. [Google Scholar] [CrossRef]
- Malec, M.; Kurban, H.; Dalkilic, M. ccImpute: An accurate and scalable consensus clustering based algorithm to impute dropout events in the single-cell RNA-seq data. BMC Bioinform. 2022, 23, 291. [Google Scholar] [CrossRef]
- Song, F.; Chan, G.M.A.; Wei, Y. Flexible experimental designs for valid single-cell RNA-sequencing experiments allowing batch effects correction. Nat. Commun. 2020, 11, 3274. [Google Scholar] [CrossRef] [PubMed]
- Yang, M.Q.; Weissman, S.M.; Yang, W.; Zhang, J.; Canaann, A.; Guan, R. MISC: Missing imputation for single-cell RNA sequencing data. BMC Syst. Biol. 2018, 12, 114. [Google Scholar] [CrossRef] [PubMed]
- Miao, Z.; Li, J.; Zhang, X. scRecover: Discriminating true and false zeros in single-cell RNA-seq data for imputation. bioRxiv 2019, 665323. [Google Scholar] [CrossRef]
- Zhang, Y.; Liang, K.; Liu, M.; Li, Y.; Ge, H.; Zhao, H. SCRIBE: A new approach to dropout imputation and batch effects correction for single-cell RNA-seq data. bioRxiv 2019, 793463. [Google Scholar] [CrossRef]
- Zhu, L.; Lei, J.; Devlin, B.; Roeder, K. A Unified Statistical Framework for Single Cell and Bulk RNA Sequencing Data. Ann. Appl. Stat. 2018, 12, 609–632. [Google Scholar] [CrossRef] [PubMed]
- Hu, Z.; Zu, S.; Liu, J.S. SIMPLEs: A single-cell RNA sequencing imputation strategy preserving gene modules and cell clusters variation. NAR Genom. Bioinform. 2020, 2, lqaa077. [Google Scholar] [CrossRef] [PubMed]
- Van den Berge, K.; Perraudeau, F.; Soneson, C.; Love, M.I.; Risso, D.; Vert, J.-P.; Robinson, M.D.; Dudoit, S.; Clement, L. Observation weights unlock bulk RNA-seq tools for zero inflation and single-cell applications. Genome Biol. 2018, 19, 1–17. [Google Scholar] [CrossRef] [PubMed]
- Chen, M.; Zhou, X. VIPER: Variability-preserving imputation for accurate gene expression recovery in single-cell RNA sequencing studies. Genome Biol. 2018, 19, 196. [Google Scholar] [CrossRef]
- Gong, W.; Kwak, I.-Y.; Pota, P.; Koyano-Nakagawa, N.; Garry, D.J. DrImpute: Imputing dropout events in single cell RNA sequencing data. BMC Bioinform. 2018, 19, 220. [Google Scholar] [CrossRef]
- Ye, P.; Ye, W.; Ye, C.; Li, S.; Ye, L.; Ji, G.; Wu, X. scHinter: Imputing dropout events for single-cell RNA-seq data with limited sample size. Bioinformatics 2020, 36, 789–797. [Google Scholar] [CrossRef]
- Moussa, M.; Măndoiu, I.I. Locality Sensitive Imputation for Single Cell RNA-Seq Data. J. Comput. Biol. 2019, 26, 822–835. [Google Scholar] [CrossRef]
- Jeong, H.; Liu, Z. PRIME: A probabilistic imputation method to reduce dropout effects in single-cell RNA sequencing. Bioinformatics 2020, 36, 4021–4029. [Google Scholar] [CrossRef]
- Tracy, S.; Yuan, G.-C.; Dries, R. RESCUE: Imputing dropout events in single-cell RNA-sequencing data. BMC Bioinform. 2019, 20, 388. [Google Scholar] [CrossRef]
- Ye, W.; Ji, G.; Ye, P.; Long, Y.; Xiao, X.; Li, S.; Su, Y.; Wu, X. scNPF: An integrative framework assisted by network propagation and network fusion for preprocessing of single-cell RNA-seq data. BMC Genom. 2019, 20, 347. [Google Scholar] [CrossRef]
- Wu, W.; Liu, Y.; Dai, Q.; Yan, X.; Wang, Z. G2S3: A gene graph-based imputation method for single-cell RNA sequencing data. PLoS Comput. Biol. 2021, 17, e1009029. [Google Scholar] [CrossRef]
- Einipour, A.; Mosleh, M.; Ansari-Asl, K. EinImpute: A local and gene-based approach to imputation of dropout events in ScRNA-seq data. J. Ambient Intell. Hum. Comput. 2021. [Google Scholar] [CrossRef]
- Talwar, D.; Mongia, A.; Sengupta, D.; Majumdar, A. AutoImpute: Autoencoder based imputation of single-cell RNA-seq data. Sci. Rep. 2018, 8, 16329. [Google Scholar] [CrossRef]
- Zhang, X.-F.; Ou-Yang, L.; Yang, S.; Zhao, X.-M.; Hu, X.; Yan, H. EnImpute: Imputing dropout events in single-cell RNA-sequencing data via ensemble learning. Bioinformatics 2019, 35, 4827–4829. [Google Scholar] [CrossRef]
- Rao, J.; Zhou, X.; Lu, Y.; Zhao, H.; Yang, Y. Imputing single-cell RNA-seq data by combining graph convolution and autoencoder neural networks. iScience 2021, 24, 102393. [Google Scholar] [CrossRef] [PubMed]
- Badsha, M.B.; Li, R.; Liu, B.; Li, Y.I.; Xian, M.; Banovich, N.E.; Fu, A.Q. Imputation of single-cell gene expression with an autoencoder neural network. Quant. Biol. 2020, 8, 78–94. [Google Scholar] [CrossRef]
- Xu, Y.; Zhang, Z.; You, L.; Liu, J.; Fan, Z.; Zhou, X. scIGANs: Single-cell RNA-seq imputation using generative adversarial networks. Nucleic Acids Res. 2020, 48, e85. [Google Scholar] [CrossRef]
- Amodio, M.; van Dijk, D.; Srinivasan, K.; Chen, W.S.; Mohsen, H.; Moon, K.R.; Campbell, A.; Zhao, Y.; Wang, X.; Venkataswamy, M.; et al. Exploring single-cell data with deep multitasking neural networks. Nat. Methods 2019, 16, 1139–1145. [Google Scholar] [CrossRef] [PubMed]
- Deng, Y.; Bao, F.; Dai, Q.; Wu, L.F.; Altschuler, S.J. Scalable analysis of cell-type composition from single-cell transcriptomics using deep recurrent learning. Nat. Methods 2019, 16, 311–314. [Google Scholar] [CrossRef] [PubMed]
- Trong, T.N.; Mehtonen, J.; González, G.; Kramer, R.; Hautamäki, V.; Heinäniemi, M. Semisupervised Generative Autoencoder for Single-Cell Data. J. Comput. Biol. 2020, 27, 1190–1203. [Google Scholar] [CrossRef]
- Zhu, K.; Anastassiou, D. 2DImpute: Imputation in single-cell RNA-seq data from correlations in two dimensions. Bioinformatics 2020, 36, 3588–3589. [Google Scholar] [CrossRef]
- Tran, B.; Tran, D.; Nguyen, H.; Vo, N.S.; Nguyen, T. RIA: A novel Regression-based Imputation Approach for single-cell RNA sequencing. In Proceedings of the 2019 11th International Conference on Knowledge and Systems Engineering (KSE), Da Nang, Vietnam, 24–26 October 2019; pp. 1–9. [Google Scholar]
- Xu, C.; Cai, L.; Gao, J. An efficient scRNA-seq dropout imputation method using graph attention network. BMC Bioinform. 2021, 22, 582. [Google Scholar] [CrossRef]
- Linderman, G.C.; Zhao, J.; Roulis, M.; Bielecki, P.; Flavell, R.A.; Nadler, B.; Kluger, Y. Zero-preserving imputation of single-cell RNA-seq data. Nat. Commun. 2022, 13, 192. [Google Scholar] [CrossRef]
- Wagner, F.; Barkley, D.; Yanai, I. Accurate denoising of single-cell RNA-Seq data using unbiased principal component analysis. BioRxiv 2019, 655365. [Google Scholar] [CrossRef]
- Xu, J.; Cai, L.; Liao, B.; Zhu, W.; Yang, J. CMF-Impute: An accurate imputation tool for single-cell RNA-seq data. Bioinformatics 2020, 36, 3139–3147. [Google Scholar] [CrossRef]
- Mongia, A.; Sengupta, D.; Majumdar, A. deepMc: Deep Matrix Completion for Imputation of Single-Cell RNA-seq Data. J. Comput. Biol. 2020, 27, 1011–1019. [Google Scholar] [CrossRef]
- Zhang, L.; Zhang, S. Imputing single-cell RNA-seq data by considering cell heterogeneity and prior expression of dropouts. J. Mol. Cell Biol. 2021, 13, 29–40. [Google Scholar] [CrossRef] [PubMed]
- Wu, H.; Wang, X.; Chu, M.; Xiang, R.; Zhou, K. FRMC: A fast and robust method for the imputation of scRNA-seq data. RNA Biol. 2021, 18, 172–181. [Google Scholar] [CrossRef] [PubMed]
- Hu, Y.; Li, B.; Zhang, W.; Liu, N.; Cai, P.; Chen, F.; Qu, K. WEDGE: Imputation of gene expression values from single-cell RNA-seq datasets using biased matrix decomposition. Brief. Bioinform. 2021, 22, bbab085. [Google Scholar] [CrossRef]
- Elyanow, R.; Dumitrascu, B.; Engelhardt, B.E.; Raphael, B.J. netNMF-sc: Leveraging gene-gene interactions for imputation and dimensionality reduction in single-cell expression analysis. Genome Res. 2020, 30, 195–204. [Google Scholar] [CrossRef]
- Aparicio, L.; Bordyuh, M.; Blumberg, A.J.; Rabadan, R. A Random Matrix Theory Approach to Denoise Single-Cell Data. Patterns 2020, 1, 100035. [Google Scholar] [CrossRef]
- Pierson, E.; Yau, C. ZIFA: Dimensionality reduction for zero-inflated single-cell gene expression analysis. Genome Biol. 2015, 16, 241. [Google Scholar] [CrossRef]
- Zheng, Y.; Zhong, Y.; Hu, J.; Shang, X. SCC: An accurate imputation method for scRNA-seq dropouts based on a mixture model. BMC Bioinform. 2021, 22, 5. [Google Scholar] [CrossRef]
- Cui, T.; Wang, T. JOINT for large-scale single-cell RNA-sequencing analysis via soft-clustering and parallel computing. BMC Genom. 2021, 22, 47. [Google Scholar] [CrossRef]
- Xu, L.; Xu, Y.; Xue, T.; Zhang, X.; Li, J. AdImpute: An Imputation Method for Single-Cell RNA-Seq Data Based on Semi-Supervised Autoencoders. Front. Genet. 2021, 12, 739677. [Google Scholar] [CrossRef]
- Feng, X.; Chen, L.; Wang, Z.; Li, S.C. I-Impute: A self-consistent method to impute single cell RNA sequencing data. BMC Genom. 2020, 21, 618. [Google Scholar] [CrossRef]
- Tian, T.; Min, M.R.; Wei, Z. Model-based autoencoders for imputing discrete single-cell RNA-seq data. Methods 2021, 192, 112–119. [Google Scholar] [CrossRef] [PubMed]
- Vizueta, J.; Escuer, P.; Sánchez-Gracia, A.; Rozas, J. Genome mining and sequence analysis of chemosensory soluble proteins in arthropods. Methods Enzymol. 2020, 642, 1–20. [Google Scholar] [CrossRef] [PubMed]
- Lopez, R.; Regier, J.; Cole, M.B.; Jordan, M.I.; Yosef, N. Deep generative modeling for single-cell transcriptomics. Nat. Methods 2018, 15, 1053–1058. [Google Scholar] [CrossRef] [PubMed]
- Gan, Y.; Li, N.; Zou, G.; Xin, Y.; Guan, J. Identification of cancer subtypes from single-cell RNA-seq data using a consensus clustering method. BMC Med. Genom. 2018, 11, 117. [Google Scholar] [CrossRef] [PubMed]
- Wang, G.; Qiu, M.; Xing, X.; Zhou, J.; Yao, H.; Li, M.; Yin, R.; Hou, Y.; Li, Y.; Pan, S.; et al. Lung cancer scRNA-seq and lipidomics reveal aberrant lipid metabolism for early-stage diagnosis. Sci. Transl. Med. 2022, 14, eabk2756. [Google Scholar] [CrossRef]


| Method Type | Dropout Type | Advantage | Disadvantage | Scope of Application |
|---|---|---|---|---|
| Mean Completer | Complete random deletion | The operation process is simple | Only the observed information is used, which is subjective, unstable and error | The data scale is small, the missing proportion is small, and the distribution is concentrated |
| Expectation Maximization Imputation | Complete random deletion or random deletion | Good stability and small error | It is not suitable for high-dimensional data | It is applicable to data sets with Normal distribution or approximate Normal distribution |
| Hot Deck Imputation | Random deletion | It has a better effect on maintaining the empirical distribution of variables | The mean square error formula is not clear, and the filling value is easily affected by auxiliary variables | Between data sets collected in the same batch |
| Cold Deck Imputation | Random deletion | The operation process is simple | The filling effect depends on the quality of previous data, and there is estimation deviation | Between data sets collected in different batches |
| Regression Imputation | Random deletion | The operation process is simple and makes full use of the relationship between variables | Without considering the uncertainty of data, it is not suitable for high-dimensional data | It is applicable to data sets with Normal distribution or approximate Normal distribution and multiple auxiliary variables |
| Clustering Imputation | Random deletion | Low variable type requirements, good fitting effect, high stability and small error, suitable for high-dimensional data | The operation process is complex and the time cost is high | It is suitable for any missing pattern and various distribution types of data sets |
| Method | Availability | Code | Pkg | Operative System and Distribution Compatibility | Year | Ref |
|---|---|---|---|---|---|---|
| bayNorm | https://bioconductor.org/packages/release/bioc/html/bayNorm.html (accessed on 1 October 2022) | R | R | Linux, Mac and Windows | 2020 | [38] |
| BISCUIT | NA | NA | NA | NA | 2016 | [35] |
| BUSseq | https://github.com/songfd2018/BUSseq-Rpackage (accessed on 1 October 2022) | C++ | R | Ubuntu 18.04, Mac OX X 10.04 Mojave and Windows 10 Enterprise | 2020 | [41] |
| CIDR | https://github.com/VCCRI/CIDR (accessed on 1 October 2022) | C++/R | R | Linux, Mac and Windows | 2017 | [28] |
| SAVER | https://github.com/mohuangx/SAVER (accessed on 1 October 2022) | R | R | Windows 10 and Ubuntu 20.04 LTS | 2018 | [26] |
| SAVER-X | https://github.com/jingshuw/SAVERX (accessed on 1 October 2022) | R | R | NA | 2019 | [27] |
| scImpute | https://github.com/Vivianstats/scImpute (accessed on 1 October 2022) | R/HTML/Jupyter Notebook | R | NA | 2018 | [4] |
| scRecover | https://github.com/XuegongLab/scRecover (accessed on 1 October 2022) | R | R | Unix, Mac and windows | 2019 | [43] |
| SCRIBE | NA | NA | NA | NA | 2019 | [44] |
| URSM | NA | NA | NA | NA | 2018 | [45] |
| VIPER | https://github.com/ChenMengjie/VIPER (accessed on 1 October 2022) | C++/R | R | NA | 2018 | [48] |
| SCC | https://github.com/nwpuzhengyan/SCC (accessed on 1 October 2022) | R | NULL | NA | 2021 | [78] |
| JOINT | https://github.com/wanglab-georgetown/JOINT (accessed on 1 October 2022) | Python | NULL | NA | 2021 | [79] |
| SIMPLEs | https://github.com/JunLiuLab/SIMPLEs (accessed on 1 October 2022) | R | NULL | NA | 2020 | [46] |
| MISC | NA | NA | NA | NA | 2018 | [42] |
| Method | Availability | Code | Pkg | Operative System and Distribution Compatibility | Year | Ref |
|---|---|---|---|---|---|---|
| CMF-Impute | http://bioconductor.org/packages/release/bioc/html/SC3.html (accessed on 1 October 2022) | R | R | Linux, Mac and Windows | 2020 | [70] |
| deepMc | https://github.com/hemberg-lab/scRNA.seq.course (accessed on 1 October 2022) | TeX/Perl/Dockerfile/R/CSS/Python/Other | NULL | Windows and Unix | 2018 | [71] |
| netNMF-sc | https://github.com/raphael-group/netNMF-sc (accessed on 1 October 2022) | Jupyter Notebook/Python | NULL | NA | 2020 | [75] |
| PBLR | https://github.com/amsszlh/PBLR (accessed on 1 October 2022) | MATLAB/R/Fortran/C | NULL | NA | 2021 | [72] |
| Randomly | https://github.com/RabadanLab/randomly (accessed on 1 October 2022) | Jupyter Notebook/Other | Python | NA | 2020 | [76] |
| WEDGE | https://github.com/QuKunLab/WEDGE (accessed on 1 October 2022) | C++/Fortran/CMake/C/Cuda/Python/Other | NULL | Ubuntu 20.04 and Windows 10, vs2017 and Mac | 2020 | [74] |
| I-Impute | https://github.com/xikanfeng2/I-Impute (accessed on 1 October 2022) | Python/R | R | NA | 2020 | [81] |
| FRMC | https://github.com/HUST-DataMan/FRMC (accessed on 1 October 2022) | Python/Jupyter Notebook | NULL | NA | 2021 | [73] |
| McImpute | https://github.com/aanchalMongia/McImpute_scRNAseq (accessed on 1 October 2022) | MATLAB | NULL | NA | 2019 | [3] |
| scRMD | https://github.com/XiDsLab/scRMD (accessed on 1 October 2022) | R | R | NA | 2020 | [6] |
| ZIFA | https://github.com/epierson9/ZIFA (accessed on 1 October 2022) | Python | NULL | Mac | 2015 | [77] |
| ALRA | https://github.com/KlugerLab/ALRA (accessed on 1 October 2022) | R | R | OS X, Linux, and Windows | 2018 | [68] |
| ENHANCE | Python: https://github.com/yanailab/enhance (accessed on 1 October 2022) R: https://github.com/yanailab/enhance-R (accessed on 1 October 2022) | Python/R | NULL | Linux and Mac | 2019 | [69] |
| Method | Availability | Code | Pkg | Operative System and Distribution Compatibility | Year | Ref |
|---|---|---|---|---|---|---|
| DEWÄKSS | https://gitlab.com/Xparx/dewakss/-/tree/Tjarnberg2020branch (accessed on 1 October 2022) | Python | Python | NA | 2021 | [30] |
| G2S3 | https://github.com/zwang-lab/g2s3 (accessed on 1 October 2022) | MATLA/R | NULL | NA | 2021 | [55] |
| kNN-smoothing | https://github.com/yanailab/knn-smoothing (accessed on 1 October 2022) | Python/R/MATLAB | NULL | NA | 2018 | [29] |
| netSmooth | https://github.com/BIMSBbioinfo/netSmooth (accessed on 1 October 2022) | R | R | Linux, Mac and Windows | 2021 | [37] |
| PRIME | https://github.com/hyundoo/PRIME (accessed on 1 October 2022) | R/C++ | R | NA | 2020 | [52] |
| RESCUE | https://github.com/seasamgo/rescue (accessed on 1 October 2022) | R/Python | R | NA | 2019 | [53] |
| scHinter | https://github.com/BMILAB/scHinter (accessed on 1 October 2022) | MATLAB | NULL | NA | 2019 | [50] |
| scNPF | https://github.com/BMILAB/scNPF (accessed on 1 October 2022) | R | R | NA | 2019 | [54] |
| MAGIC | https://github.com/DpeerLab/magic (accessed on 1 October 2022) | Jupyter Notebook/Python/MATLAB | Python|R | NA | 2018 | [36] |
| scTSSR | https://github.com/Zhangxf-ccnu/scTSSR (accessed on 1 October 2022) | R | R | NA | 2020 | [31] |
| DrImpute | https://github.com/gongx030/DrImpute (accessed on 1 October 2022) | R/C++ | R | Linux | 2018 | [49] |
| Method | Availability | Code | Pkg | Operative System and Distribution Compatibility | Year | Ref |
|---|---|---|---|---|---|---|
| 2DImpute | https://github.com/zky0708/2DImpute (accessed on 1 October 2022) | R | R | NA | 2020 | [65] |
| AutoImpute | https://github.com/divyanshu-talwar/AutoImpute (accessed on 1 October 2022) | Python/R | NULL | NA | 2018 | [57] |
| GraphSCI | https://github.com/biomed-AI/GraphSCI (accessed on 1 October 2022) | Jupyter Notebook/Python | NULL | NA | 2021 | [59] |
| RIA | NA | NA | NA | NA | 2019 | [66] |
| SAUCIE | https://github.com/KrishnaswamyLab/SAUCIE/ (accessed on 1 October 2022) | Python | NULL | NA | 2019 | [62] |
| SISUA | https://github.com/trungnt13/sisua (accessed on 1 October 2022) | Jupyter Notebook/Python/HTML | Python | NA | 2020 | [64] |
| TRANSLATE | https://github.com/audreyqyfu/LATE (accessed on 1 October 2022) | Python/Jupyter Notebook/Shell/R | Python | NA | 2020 | [60] |
| ZINBAE | https://github.com/ttgump/ZINBAE (accessed on 1 October 2022) | Python | NULL | NA | 2021 | [82] |
| DCA | https://github.com/theislab/dca (accessed on 1 October 2022) | Python | Python | NA | 2019 | [32] |
| scVI | https://github.com/YosefLab/scVI (accessed on 1 October 2022) | Python | Python | NA | 2018 | [84] |
| scIGANs | https://github.com/xuyungang/scIGANs (accessed on 1 October 2022) | Python/shell/R | NULL | Linux/Unix-based systems | 2020 | [61] |
| DeepImpute | https://github.com/lanagarmire/DeepImpute (accessed on 1 October 2022) | Python/Makefile/Dockerfile | Python | NA | 2019 | [33] |
| scScope | https://github.com/AltschulerWu-Lab/scScope (accessed on 1 October 2022) | Python | Python | Ubuntu 14.4 | 2019 | [63] |
| EnImpute | https://github.com/Zhangxf-ccnu/EnImpute (accessed on 1 October 2022) | R | R | NA | 2019 | [58] |
Publisher’s Note: MDPI stays neutral with regard to jurisdictional claims in published maps and institutional affiliations. |
© 2022 by the authors. Licensee MDPI, Basel, Switzerland. This article is an open access article distributed under the terms and conditions of the Creative Commons Attribution (CC BY) license (https://creativecommons.org/licenses/by/4.0/).
Share and Cite
Wang, M.; Gan, J.; Han, C.; Guo, Y.; Chen, K.; Shi, Y.-z.; Zhang, B.-g. Imputation Methods for scRNA Sequencing Data. Appl. Sci. 2022, 12, 10684. https://doi.org/10.3390/app122010684
Wang M, Gan J, Han C, Guo Y, Chen K, Shi Y-z, Zhang B-g. Imputation Methods for scRNA Sequencing Data. Applied Sciences. 2022; 12(20):10684. https://doi.org/10.3390/app122010684
Chicago/Turabian StyleWang, Mengyuan, Jiatao Gan, Changfeng Han, Yanbing Guo, Kaihao Chen, Ya-zhou Shi, and Ben-gong Zhang. 2022. "Imputation Methods for scRNA Sequencing Data" Applied Sciences 12, no. 20: 10684. https://doi.org/10.3390/app122010684
APA StyleWang, M., Gan, J., Han, C., Guo, Y., Chen, K., Shi, Y.-z., & Zhang, B.-g. (2022). Imputation Methods for scRNA Sequencing Data. Applied Sciences, 12(20), 10684. https://doi.org/10.3390/app122010684