Abstract
This study aimed to investigate the effects of turmeric rhizome at 1% and 3% on quality features, oxidative stability, and the microbiological safety of pork meatloaf. Vacuum-packed meatloaves were stored at 4 °C and sampled on days 0, 7, 14, and 21. The turmeric rhizome at both addition levels slowed the oxidative changes during storage. However, the most favorable inhibitory effect was demonstrated for meatloaf with 1% turmeric. Adding turmeric rhizome increased the color saturation (C*) and the hue angle (h°), shifting h° from orange towards yellow. In the sensory evaluation, the meatloaf with 1% turmeric was rated the highest for the most superior distinguishing features, including overall quality. Microbiological analysis showed that the heat treatment was effective, and that adding turmeric rhizome might have increased the product’s safety. It is believed that turmeric rhizome at 1% could be the additive that best enhances the quality of pork meatloaf.
1. Introduction
Pork meatloaf is an attractive alternative to the commonly consumed cold meats of the same meat type. Meatloaf is formed mechanically or manually from minced meat, molded into the shape of a loaf, and subjected to heat treatment before consumption [1]. Due to the mechanical grinding, emulsification, restructuring, and heating involved in meat processing, phospholipids in meat are exposed to atmospheric oxygen, enzymes, heme dyes, and metal ions, leading to accelerated lipid oxidation [2]. Pork contains a high content of unsaturated fatty acids likely to oxidize and degrade quickly [3]. It can result in the loss of a desirable odor, flavor, and color, as well as a reduced product shelf-life caused by the secondary toxic compounds [4].
The addition of antioxidants can effectively reduce the processes of oxidative rancidity in meat and meat products. These compounds may be utilized individually or as diverse mixtures comprising many additives, including synthetic phenolic antioxidants or natural plant-derived antioxidant ingredients [5,6,7]. Due to the restrictions on synthetic antioxidants in food, the meat industry has been searching for natural alternatives acceptable to consumers [8], especially in today’s modern world, in which consumers have become more demanding. They want to purchase products with a high meat content, which they associate with high product quality. Their purchase decision is influenced by the fact that no synthetic additives are included in the product ingredients list. With rising concerns about synthetic antioxidants linked to their toxicological effects, consumers and manufacturers are thus increasingly interested in spices with biological activity [9,10,11,12].
Turmeric rhizome (turmeric) is primarily obtained from Curcuma longa L., of the ginger family Zingiberaceae. The raw material contains about 2% curcuminoids, including curcumin (diferuloylmethane), bisdemethoxycurcumin, and demethoxycurcumin. Yet, curcumin is turmeric’s vital fraction responsible for all its biological activities [13,14,15,16]. It is used as a food coloring, but most interest in it is linked with its antioxidant properties in, for instance, meats [7,17,18,19,20,21,22,23,24]. However, this property can be lost owing to heat processing up to 54%, while maximum loss happens from pressure cooking [25]. In addition, the aqueous extracts of fresh rhizomes exhibit greater antioxidant potential than dry rhizomes. There was a considerable loss of the antioxidant potential of turmeric when it was added as a dry powder, according to Jayaprakasha et al. [26]. Nevertheless, turmeric may provide a compelling alternative to synthetic antioxidants in meat products.
The current study aimed to investigate the effect of adding turmeric at two concentrations on the physical and sensory characteristics, oxidative stability, and safety of pork meatloaf during storage. The product recipe was developed based on the selection of meat and additive levels, heat treatment parameters, and sensory evaluation by a trained evaluation panel. Higher concentrations of turmeric were not accepted in preliminary studies; hence we evaluated 1% and 3% turmeric-added meatloaves.
Cold meats are accessible to consumers who can select from various deli meat products matched to their taste regarding nutritional value, organoleptic properties, and originality. Pork is consumed worldwide, so we have chosen it to design a new meat product. Moreover, most meat products contain synthetic antioxidants to extend product shelf-life. To replace it, we have used plant material with natural antioxidant properties. Given that pork meat products are susceptible to oxidation, pork meatloaf with natural antioxidants from turmeric could be effective against lipid oxidation and positively impact quality properties and storage characteristics. However, an appropriate turmeric addition level in meatloaves must be established.
2. Materials and Methods
2.1. Material
The material was pork shoulder from Polish Landrace and Polish Large White pig breeds sourced at the Kąsak (Olsztyn, Poland) slaughterhouse. The meat was derived from six-month-old pigs weighing 115–120 kg. The turmeric (Curcuma longa) rhizome was purchased at the local market in Olsztyn.
2.2. Sample Preparation
The meat was cleaned, washed, cut into pieces, and minced in a meat grinder (Stalgast, Radom, Poland) using a 5 mm hole plate. Then, it was mixed in an SP-100 A-B mixer (Mankiewicz, Radzionków, Poland) for 10 min at speed level 2. The mince was divided into three equal parts for preparing control (C), 1% (T1), and 3% (T3) turmeric meatloaves. The control meatloaf involved whole egg pulp, water, salt, and the portion of the mince itself (with no turmeric added). Before adding turmeric, the rhizome was washed, peeled, and homogenized for 2 min at 700 g (HO 4A, Bühler, GmbH, Hechingen, Germany). It was then added along with other additives (water, whole egg pulp, salt) and thoroughly mixed in the mixer (Mankiewicz) for 15 min. Aluminum foil baking trays were filled with the mixtures so that each tray contained the same amount: 300 g. The meatloaves were baked in a convection-steam oven (SCC WE 101, RATIONAL, Landsberg am Lech, Germany) at 180 °C until 72 °C was reached inside the meatloaf. Baked meatloaves were left in the oven with the door open for 30 min and then cooled in a blast chiller to a temperature of 4 °C. The meatloaves were vacuum-packed in bags (200 × 300 mm, 100 pcs; Hendi, Romania) using a vacuum-packaging machine (EDESA VAC–20 DT, Barcelona, Spain), stored at 4 °C, and sampled on days 0, 7, 14, and 21. The experiment was conducted twice, and analyses were performed on replicates.
2.3. Extract Preparation for Phenolic Content
Ten grams of turmeric were homogenized (Bühler) with 50 mL of 80% methanol (Chempur, Piekary Śląskie, Poland), then centrifuged at 700 g per 10 min (MPV-360 centrifuge, Mechanika Precyzyjna, Warsaw, Poland). The supernatant was collected, and the solid residue was combined with 80% methanol and centrifuged again. Both extracts were combined and filtered using the Whatman filter paper grade 1. The filtrate was used for the total phenolic compounds evaluation.
2.4. Total Phenolic Content
An extract (0.2 mL) was combined with 6 mL of distilled water and 0.5 mL of Folin-Ciocalteau reagent (Aktyn, Suchy Las, Poland), followed by 1.5 mL of 20% sodium carbonate (Poch, Gliwice, Poland) and 1.8 mL of distilled water. The solution was kept in the dark for 120 min. The controls contained all reagents except the extract. Absorbance was recorded at 765 nm with the Optizen Pop UV/VIS spectrophotometer (Daejeon, Korea). The total phenolic content was expressed in mg of gallic acid equivalent (mg GAE) per 100 g of raw material (rm), i.e., turmeric rhizome [27]. The total phenolic content of turmeric was determined at 542.6 mg GAE 100 g −1 rm.
2.5. Meatloaf Preparation for Analysis
The samples were ground twice using a 3 mm mesh in a grinder (ZMM1089I; Zelmer, Rzeszów, Poland). The ground bulk was thoroughly mixed, and samples were pulled to determine moisture, protein, fat, thiobarbituric acid reactive substances (TBARS) contents, pH, and water activity.
2.6. Proximate Composition Analysis
Proximate moisture, protein, and fat composition were carried out according to PN-ISO 1442, AOAC 2006a, and AOAC 2006b [28,29,30].
2.7. Lipid Oxidation
Lipid oxidation was investigated using 2-thiobarbituric acid, according to Salih et al. [31]. Ten grams of meatloaf was homogenized with 34.25 mL of cold (4 °C) 4% perchloric acid and 0.75 mL of an alcohol solution (0.01%) of BHT at 1300 g for 2 min (Bühler). The sample was filtered directly through Whatman 1 filter paper and diluted with 4% perchloric acid to 50 mL. Subsequently, 5 mL of the filtrate was added to 5 mL of 0.02 M TBA. Then, it was heated in a water bath for 60 min at 100 ± 2 °C and cooled for 10 min with cold tap water. Absorbance was measured at 532 nm (Optizen POP UV/VIS spectrophotometer, Metasys Co., Ltd., Daejeon, Korea) and compared against the control sample containing 5 mL of 4% perchloric acid and 5 mL of the TBA reagent. Results expressed as 2-thiobarbituric reactive substances (TBARS) in mg malondialdehyde (MDA)/kg were calculated [32] according to the formula:
where: A = absorbance of the sample, K = conversion factor of 5.5.
TBARS = A * K (mg MDA/kg)
2.8. pH Determination
The pH values of the meatloaves were measured using the Hanna Instruments 210 pH meter (Woonsocket, RI, USA). Samples were prepared by mixing 10 g of meat with 50 mL distilled water using the HO 4 A homogenizer (Bühler) for 2 min at 2000× g. The pH electrode was calibrated using pH 7 and pH 4 buffer solutions at room temperature.
2.9. Water Activity
Water activity was established on meat samples placed in the analyzer chamber (AWC-200, Novasina, Pfäffikon, Switzerland) calibrated with a set of Novasina humidity solutions. The measurements were performed at 20 °C.
2.10. Color Parameters
Parameters L* (lightness/darkness), a* (redness/greenness), and b* (yellowness/blueness) of the CIE L*a*b* color space were determined using a CR-400 Chroma meter Konica Minolta (Osaka, Japan) with a port (Ø 8 mm) and the D65 illuminant, and standard observer 2°. The device was calibrated with a standard white ceramic tile. The measurements were performed on the surface of slices of 10 mm. Altogether, eight measurements were taken. To better highlight differences in color, the indexes of color saturation (parameter C* Equation (2)) and the hue (h°—hue angle Equation (3)) were calculated according to the formula [33]:
2.11. Texture Profile Analysis
Texture profile analysis (TPA) was performed using a TA.XT Plus Texture Analyser (Stable Micro Systems, Surrey, UK) equipped with a P/100 compression platen and an HDP/90 heavy-duty platform. Two-cycle 50% compression with a 50 kg load cell was used. Samples were cut into cubes (10 × 10 × 10 mm), and tests were conducted on ten cubes at 20 ± 2 °C, as described by Draszanowska et al. [6]. The parameters measured were hardness and chewiness.
2.12. Sensory Evaluation
Sensory evaluation was performed in individual booths in the sensory analysis laboratory of the Department of Human Nutrition, the Faculty of Food Science, UWM in Olsztyn. Nine trained panelists evaluated the samples with confirmed sensory sensitivity [34] and experience with meat products. Two sessions explained to the panelists the samples used in the experiment. The samples were sliced into 10 cm thick slices and served at room temperature. Each panelist received all treatments randomly on white plates coded with three-digit numbers. The panelists were provided with water and bread to clean the palate between samples. A scale of 1 to 10 was used. Sensory attributes were assessed as follows: intensity of meat aroma (1–undetectable, 10–very intense), aroma desirability (1–undesirable, 10–highly desirable), the intensity of turmeric aroma (1–undetectable, 10–very intense), juiciness (1–dry, 10–very juicy), softness (1–hard, 10–very soft), the intensity of meat flavor (1–undetectable, 10–very intense), flavor desirability (1–undesirable, 10–highly desirable), the intensity of turmeric flavor (1–undetectable, 10–very intense) and overall quality (1–poor, 10–very high).
2.13. Microbiological Analysis
Ten grams of meat with 90 mL of Ringer’s solution were first homogenized, then serial decimal dilutions were made. The analysis employed the aerobic mesophilic bacteria counts [35], the anaerobic sulfite-reducing bacteria counts [36], and coliforms [37] and Staphylococcus aureus [38] on meatloaves from the last day of refrigerated storage.
2.14. Statistical Analysis
A two-way analysis of variance (ANOVA) was performed using the Statistica ver. 13.1 (StatSoft Inc., Tulsa, OK, USA). Tukey’s HSD test was used to determine statistical significance at p < 0.05.
3. Results and Discussion
3.1. Proximate Composition Analysis
Composition analysis performed on freshly baked meatloaves has shown a significantly lower water content in T3 (65.20%) as compared to the control and T1 (66.90% and 66.32%, respectively) (p < 0.05) (data not shown). The higher addition level of plant material could have contributed to greater evaporation during heat treatment and, thus, the lower water content in T3. At the same time, adding turmeric resulted in lower protein contents in T1 and T3. The protein content in the control (24.38%) differed significantly from the meatloaves with turmeric (T1-24.12%; T3−23.48%) (p < 0.05). A similar relationship was found by Draszanowska et al. [6], where ginger rhizome was added at 1.5% to meat. Simultaneously, T3 contained 9.91% fat, whereas T1 9.54%. A slightly lower fat content was noted in the control (8.63%) (p < 0.05).
3.2. Lipid Oxidation
Lipid oxidation triggers oxidative stress and causes rancidity, undesirable taste, odor, discoloration, and a decrease in nutritional value. These changes contribute to a reduction in the consumer acceptability of food [39,40]. Peroxides, products of polyunsaturated fatty acid oxidation, are unstable and undergo further transformations. Malondialdehyde (MDA) is one of the major end-products of lipid oxidation, the content of which can be determined using the TBARS test [41,42]. TBARS is widely used for measuring antioxidant capacity based on the MDA content in meat samples [43]. While MDA is not the only product of lipid oxidation able to react with TBA, the meat industry generally recognizes the use of the TBARS assay [44].
Table 1 shows the effect of turmeric addition on the MDA content in pork meatloaves over 21 days under refrigeration. A significant impact of turmeric was found, with 1% turmeric added exhibiting the lowest content of the MDA compound (p < 0.05). An increase in MDA content was observed on day seven, although nonsignificant, and remained the lowest throughout storage. A significant increase in the MDA on day seven was noted in 3% turmeric-added meatloaf, which remained at a similar level until the last day (p < 0.05). This rise in TBARS can be explained by increased lipid oxidation and the formation of volatile metabolites when oxygen is present [45]. Still, the 3% turmeric-added meatloaf had a significantly lower MDA content than the control meatloaf until day 7 (p < 0.05), which continued to be lower, although insignificantly, as the MDA in the control meatloaf decreased over time. The significant reduction in the MDA content may be because this compound reacts readily with the components found in meat [46]. Therefore, the MDA content and other reactive carbonyl compounds that react with TBA may decrease [47]. Certainly, aldehydes are capable of reacting with other unstable compounds produced during the Maillard and Strecker reactions, reducing MDA content [48].

Table 1.
The effect of different concentrations of turmeric and storage time on the lipid oxidation (TBARS), pH, hardness, and chewiness of hermetically packed pork meatloaf.
The inhibitory effect of oxidation of the turmeric powder addition in meat products was demonstrated by Mancini et al. [49], Milon et al. [20], Bae et al. [21], Kilic et al. [50], and Augustyńska-Prejsnar et al. [7]. It may be due to its ability to trap oxygen-free radicals and act as an antioxidant, primarily owing to its high curcumin content [51]. The results show that fresh rhizomes were highly effective against lipid oxidation in pork meatloaves during refrigeration storage, and the proportion of turmeric had a significant impact. Of note, meatloaves without turmeric tend to reach TBARS levels up to 0.97 mg/kg meat. Fernández et al. [52] claimed that a TBARS level of ≥1 mg/kg meat is the limit at which consumers recognize off-flavors and off-odors in the meat. Others claim the TBARS threshold value may be 2 mg MDA/kg [53]. Although it is difficult to specify the average level of lipid oxidation beyond which meat is unacceptable to the consumer, the inclusion of turmeric helping to delay lipid oxidation in meats such as pork meatloaf has proved valuable.
3.3. pH Determination
Food quality is determined by acidity, and its changes can provide information on adverse processes occurring in a product, e.g., due to improper storage or freshness [2]. The pH values ranged from 6.08–6.14, 6.08–6.16, and 6.05–6.11 in control, T1, and T3, respectively (Table 1). T3 shows lower pH values on days 0, 7, and 14. However, only on day seven, it was significantly lower (p < 0.05). Turmeric contains ascorbic acid and may alter the acidity of food products [7]. This explains the lower pH of T3, although the values might have been higher than anticipated, especially because we did not observe a drop in pH in T1. Milon et al. [20] suggest that pH decreases with increased turmeric addition. They observed this trend at lower addition levels; however, a turmeric powder was used. Maurya et al. [54] reported that turmeric in the carabeef could cause a pH decrease in the heat-treated product. Febrianta et al. [24] observed that the increased turmeric extract levels lower the poultry meat product’s pH. On day 7, the control and T1 meatloaf showed some level of alkalinization, most likely due to the breakdown of proteins and amino acids by bacteria, with the formation of ammonia, amines, and other essential substances [18].
3.4. Water Activity
Water activity (aw) measures how much water is available for microorganisms to grow, influencing food products’ quality and shelf life [55]. Thus, meat products with water activity above 0.95 need refrigerated storage at 5 °C [56]. No significant effect of turmeric on the aw in the meatloaves was noted. However, a significant reduction in the aw occurred in the control and T1 after seven days (from 0.981 to 0.978 and 0.976, respectively) (p < 0.05), but then remained stable onwards. Similarly to other authors [6,57], the storage time did not affect the aw in T3. Their values ranged from 0.975 to 0.978 (p > 0.05) (data not shown). According to Płachta et al. [58], the pH values of meat products range from 0.990 to 0.918, and pork meatloaf usually scores at about 0.973, which is in line with our results.
3.5. Color Parameters
The color of meats is an important physical parameter that affects consumer choice. It depends on several factors, such as meat composition, nonmeat ingredients, and additives. In particular, the interaction between myoglobin and intrinsic and extrinsic factors regulates the color of ready-to-eat meats [59].
Statistical analysis of the color parameters of pork meatloaves showed a significant effect of the additive on color parameters L* and a* (p < 0.05). At the same time, the storage time had no significant impact. Turmeric addition contributed to the lower color lightness (L*), and T3 was statistically different from the control (p < 0.05) (Figure 1a). T1 and T3 meatloaves differed significantly in a* parameter and were characterized by considerably lower a* as compared to the control (p < 0.05) (Figure 1b). These findings agree with other authors’ reports on meat products formulated with turmeric [21,23,60]. Those authors noted that adding turmeric (powder, extract) decreased both L* and a* compared to controls.
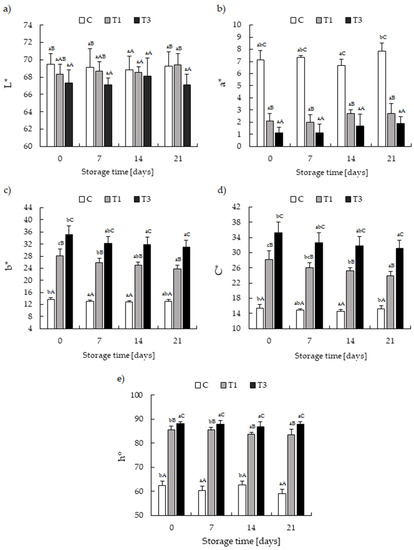
Figure 1.
The effect of different concentrations of turmeric and storage time on the color parameters of hermetically packed pork meatloaf: (a) L* values; (b) a* values; (c) b* values; (d) C* (saturation); (e) h° (hue angle). Samples: C–control; T1–with 1% turmeric rhizome; T3–with 3% turmeric rhizome. Different A,B,C letters indicate a significant difference on subsequent assessment days at p < 0.05. Different a,b,c letters indicate significant differences during storage at p < 0.05.
The addition of turmeric rhizome at 1% and 3% had a significant effect on an increase in the yellow color intensity (b*) and an increase in the color saturation C* (p < 0.05) (Figure 1c,d). The yellowness (b*) progressively increased as increased the turmeric content, and these values were significantly higher than those observed in control samples. Similarly, a progressive and significant increase of b* was found by Yun et al. [61], Mancini et al. [18], Bae et al. [21], de Carvalho et al. [23], Domínguez et al. [60], and Kilic et al. [50]. This result is expected, since turmeric has an intense yellow color. Turmeric’s yellow color compounds are three curcuminoids: curcumin (diferuloylmethane), bisdemethoxycurcumin, and demethoxycurcumin [12]; curcumin, the critical coloring agent in turmeric, is extractable and valuable as a natural food colorant [17]. During cold storage of the T1 and T3 meatloaves, a gradual decrease in the b* parameter value and the color saturation (C*) was noted, most likely due to changes in turmeric’s natural pigments associated with enzymatic oxidation of phenolic compounds [18,62].
The use of h° is suggested for monitoring the discoloration of meat [63] since potential consumers can better understand color (hue) and lightness (L*) [64]. In the current study, adding turmeric rhizome in T1 and T3 contributed to a shift of the hue angle from orange to yellow, resulting in a significant increase in the h° parameter (Figure 1e). Only in T1 does the h° decrease over time.
3.6. Texture Profile Analysis
Texture profile analysis (TPA) comprising hardness and chewiness is used to determine the texture of foods by imitating repeated biting or chewing. Hardness is the force necessary to squeeze a substance between molar teeth or between tongue and palate; chewiness is the time required to grind the sample by applying steady pressure to reduce it to a texture appropriate for swallowing [65,66].
The data on the meatloaf hardness and chewiness are provided in Table 1. The turmeric addition initially contributed to greater hardness (p < 0.05). However, from day 14 onwards, no significant (p > 0.05) difference was found. The hardness of the control changed over time. Until day seven, it remained lower, while later on, this parameter increased significantly (p < 0.05). The hardness of T1 also varied, but not significantly (p > 0.05). A similar hardness level was noted for the T3, except on the last day, when it increased significantly (p < 0.05). In comparison, Yun et al. [61] showed that hardness increased significantly after five days for chicken sausage prepared with turmeric powder. Yoon et al. [67] showed that hardness and chewiness increased with growing powder concentration (2%, 3%, and 4%).
Initially, the turmeric impacted the chewiness of meatloaf, being higher than the control’s (p < 0.05). After seven days, although higher, an insignificant difference was found (p > 0.05). No significant changes were demonstrated for T1 chewiness during storage (p > 0.05). Up to day 14, the T3 chewiness was at a similar level. However, a significant increase was noted on the last day (p < 0.05). Karpińska-Tymoszczyk et al. [57] observed a similar increasing tendency of hardness and chewiness when chia seeds were added to pork.
3.7. Sensory Evaluation
Meat products containing additives must preserve appropriate sensory attributes to ensure consumer acceptance. The results of the sensory evaluation are presented in Table 2. The three meatloaves scored considerably higher than the minimum acceptability score, i.e., 5.0. However, the greater the turmeric addition, the lower the meat flavor intensity. In contrast to T1, T3 differed significantly from the control (p < 0.05). Overall, the flavor intensity was the highest on day 0 and then decreased significantly in T3 (p < 0.05). Initially, the control demonstrated significantly greater aroma desirability than the T3. However, no significant effect of the storage on the aroma desirability was found (p > 0.05). Higher turmeric addition was more noticeable to the panelists. The T3 differed significantly from the T1 regarding the turmeric aroma intensity (p < 0.05). Moreover, the T3 showed lower juiciness and softness. The juiciness parameter was considerably lower than that of the control, but the T1 scored similarly to the C.
Table 2.
The effect of different concentrations of turmeric and storage time on the sensory quality of hermetically packed pork meatloaf.
We observed that the higher the turmeric addition, the less noticeable the meat flavor, with the T3 differing significantly from C throughout the storage (p < 0.05). However, the meat flavor intensity for three meatloaves did not change significantly over time (p > 0.05). The T3 was characterized by significantly lower flavor desirability, and T1 scored similarly to C. We did not see any effect of the storage time on this parameter. In contrast, a significant impact of the turmeric addition on flavor intensity was noted (p < 0.05). Significant differences between meatloaves regarding the overall quality were only found initially; the T3 was rated significantly lower as compared to the control (p < 0.05). Although not significant, T1 scored the highest in overall quality over time.
Bae et al. [21] showed that boiled beef pyeonyuk with turmeric powder exhibited less juiciness. According to Milon et al. [20], among five beef meatball variants (T1-control, T2-0.1% BHA, T3-0.1%, T4-0.2%, and T5-0.3%), a preferable flavor, tenderness, and juiciness were observed from 0.3% turmeric powder. However, 0.2% turmeric was more acceptable in sensory evaluation, color, and overall acceptability. A study by Tangkham [68] provides valuable insights into the consumer acceptance of adding turmeric powder (1%; 2%) to beef sticks. Participants rated 1% turmeric as the best in color, flavor, and overall liking.
3.8. Evaluation of Product Safety
Heat treatment is intended to eliminate harmful microbes in food and allows the safe preservation of meat products. Vacuum packaging of meat also provides several benefits; as it removes oxygen from the meat, the growth of aerobic microorganisms that cause spoilage odors and flavors is reduced [69]. However, when improperly handled, these products undergo microbial spoilage and could cause food-borne illness [70]. The microbiological analysis determined low contamination levels regarding aerobic mesophilic bacteria (Table 3). The count of sulfite-reducing Clostridium spp. was below 1 log CFU/g, and coliforms and Staphylococcus aureus were not found. Furthermore, the ingredients used as an additive in the turmeric might have increased the product’s safety, since the total cell count was lower in T1 and T3, reaching below 1 log CFU/g in meats with 3% turmeric.
Table 3.
Microbiological analysis of meatloaf with turmeric addition on the 21st day of refrigerated storage.
4. Conclusions
Growing consumer demand for all-natural products, referred to as clean labels, poses new challenges to the food industry, including the dosing of natural ingredients. Regarding deli meats, there is particular interest in adding natural antioxidants, a valuable strategy to stabilize healthy meat products. Turmeric stands out as a promising natural option among the alternatives to replace synthesis antioxidants. The present study investigated the effects of turmeric rhizome at 1% and 3% on the quality of pork meatloaf. Adding turmeric rhizome to meatloaf lowered the product’s oxidation rate, which influenced the overall quality of meatloaf and guaranteed its safety. As for the addition level, there were several reasons for choosing the 1% turmeric as superior: (a) T1 showed the lowest content of the MDA compound, which was also more stable over time; (b) regarding color parameters, T1 scored between the control and T3, suggesting it to be more suitable to an average consumer; (c) hardness and chewiness scored higher in T1 than in T3 after all; and (d) T3 scored the lowest in meat flavor and desirability, whereas T1 scored higher in those categories, impacting its better overall quality. Thus, it is believed that adding 1% turmeric to pork meatloaf seems most advantageous in improving product quality and meeting consumer preferences.
Author Contributions
Conceptualization, A.D., M.K.-T. and M.A.O.; methodology, A.D. and M.K.-T.; formal analysis, A.D. and M.K.-T.; investigation, A.D. and M.A.O.; resources, M.K.-T., M.A.O. and M.S.; data curation, A.D. and M.K.-T.; writing—original draft preparation, A.D. and M.K.-T.; writing—review & editing, M.A.O. and M.S.; visualization, A.D.; supervision, M.K-T., M.A.O. and M.S.; funding acquisition, A.D. and M.S. All authors have read and agreed to the published version of the manuscript.
Funding
Project financially supported by the Minister of Education and Science under the program entitled “Regional Initiative of Excellence” for the years 2019–2023, Project No. 010/RID/2018/19, amount of funding 12.000.000 PLN. The publication was written as a result of the authors’ internship at the University of Porto, co-financed by the European Union under the European Social Fund (Operational Program Knowledge Education Development), carried out in the project Development Program at the University of Warmia and Mazury in Olsztyn (POWR.03.05.00-00-Z310/17). This work was also supported by Base Funding [LA/P/0045/2020 (ALiCE), UIDB/00511/2020, and UIDP/00511/2020 (LEPABE)], funded by national funds through [FCT/MCTES (PIDDAC)].
Institutional Review Board Statement
Not applicable.
Informed Consent Statement
Not applicable.
Data Availability Statement
The data presented in this study are available in the article.
Acknowledgments
Graphical abstract created with BioRender.com.
Conflicts of Interest
The authors declare no conflict of interest.
References
- Nurgazezova, A.; Nurymkhan, G.; Kassymov, S.; Issaeva, K.; Kazhybayeva, G.; Kulushtayeva, B.; Okuskhanova, E.; Igenbayev, A. Meat loaf processing technology. Res. J. Pharm. Biol. Chem. Sci. 2016, 7, 984–988. [Google Scholar]
- Amaral, A.B.; da Silva, M.V.; Lannes, S.C.d.S. Lipid oxidation in meat: Mechanisms and protective factors—A review. Food Sci. Technol. 2018, 38, 1–15. [Google Scholar] [CrossRef]
- Domínguez, R.; Pateiro, M.; Gagaoua, M.; Barba, F.J.; Zhang, W.; Lorenzo, J.M. A comprehensive review on lipid oxidation in meat and meat products. Antioxidants 2019, 8, 429. [Google Scholar] [CrossRef] [PubMed]
- Falowo, A.B.; Fayemi, P.O.; Muchenje, V. Natural antioxidants against lipid–protein oxidative deterioration in meat and meat products: A review. Food Res. Int. 2014, 64, 171–181. [Google Scholar] [CrossRef]
- Hęś, M.; Dziedzic, K.; Górecka, D.; Jędrusek-Golińska, A.; Gujska, E. Aloe vera (L.) webb.: Natural sources of antioxidants—A review. Plant Foods Hum. Nutr. 2019, 74, 255–265. [Google Scholar] [CrossRef]
- Draszanowska, A.; Karpińska-Tymoszczyk, M.; Olszewska, M.A. The effect of ginger rhizome and refrigerated storage time on the quality of pasteurized canned meat. Food Sci. Technol. Int. 2020, 26, 300–310. [Google Scholar] [CrossRef]
- Augustyńska-Prejsnar, A.; Topczewska, J.; Ormian, M.; Saletnik, A.; Sokołowicz, Z.; Lechowska, J. The effect of the addition turmeric on selected quality characteristics of duck burgers stored under refrigeration. Appl. Sci. 2022, 12, 805. [Google Scholar] [CrossRef]
- Lishianawati, T.U.; Yusiati, L.M.; Jamhari. Antioxidant effects of black garlic powder on spent duck meat nugget quality during storage. Food Sci. Technol. 2022, 42, e62220. [Google Scholar] [CrossRef]
- Kalaikannan, A.; Elango, A.; Santhi, D. Chicken meat patties with turmeric oleoresin as natural preservative. J. Environ. Bio-Sci. 2015, 29, 117–120. [Google Scholar]
- Mousa, R.M.A.; Al-Khateeb, L.A. Influence of binary and ternary mixtures of spices on the inhibition of lipid oxidation and carcinogenic heterocyclic amines in fried hamburger patties. J. Food Process. Preserv. 2017, 41, e12976. [Google Scholar] [CrossRef]
- Nikmaram, N.; Budaraju, S.; Barba, F.J.; Lorenzo, J.M.; Cox, R.B.; Mallikarjunan, K.; Roohinejad, S. Application of plant extracts to improve the shelf-life, nutritional and health-related properties of ready-to-eat meat products. Meat Sci. 2018, 145, 245–255. [Google Scholar] [CrossRef] [PubMed]
- Delgado-Pando, G.; Ekonomou, S.I.; Stratakos, A.C.; Pintado, T. Clean label alternatives in meat products. Foods 2021, 10, 1615. [Google Scholar] [CrossRef]
- Hewlings, S.; Kalman, D. Curcumin: A review of its effects on human health. Foods 2017, 6, 92. [Google Scholar] [CrossRef] [PubMed]
- Yadav, R.P.; Tarun, G. Versatility of turmeric: A review the golden spice of life. J. Pharmacogn. Phytochem. 2017, 6, 41–46. [Google Scholar]
- Giordano, A.; Tommonaro, G. Curcumin and cancer. Nutrients 2019, 11, 2376. [Google Scholar] [CrossRef]
- Pimentel, S.P.; Casati, M.Z.; Ribeiro, F.V.; Corrêa, M.G.; Franck, F.C.; Benatti, B.B.; Cirano, F.R. Impact of natural curcumin on the progression of experimental periodontitis in diabetic rats. J. Periodontal Res. 2020, 55, 41–50. [Google Scholar] [CrossRef]
- Abdeldaiem, M.H. Use of yellow pigment extracted from turmeric (Curcuma longa) rhizomes powder as natural food preservative. Am. J. Food Sci. Technol. 2014, 2, 36–47. [Google Scholar]
- Mancini, S.; Preziuso, G.; Dal Bosco, A.; Roscini, V.; Szendro, Z.; Fratini, F.; Paci, G. Effect of turmeric powder (Curcuma longa L.) and ascorbic acid on physical characteristics and oxidative status of fresh and stored rabbit burgers. Meat Sci. 2015, 110, 93–100. [Google Scholar] [CrossRef]
- Zhang, Y.; Henning, S.M.; Lee, R.-P.; Huang, J.; Zerlin, A.; Li, Z.; Heber, D. Turmeric and black pepper spices decrease lipid peroxidation in meat patties during cooking. Int. J. Food Sci. Nutr. 2015, 66, 260–265. [Google Scholar] [CrossRef]
- Milon, M.; Kabir, M.H.; Hossain, M.A.; Rahman, M.; Azad, M.A.K.; Hashem, M.A. Value added beef meatballs using turmeric (Curcuma longa) powder as a source of natural antioxidant. Int. J. Nat. Soc. Sci. 2016, 3, 52–61. [Google Scholar]
- Bae, I.-K.; Kim, K.-J.; Choi, J.-S.; Choi, Y.-I.; Ha, J.-H. Quality properties and storage characteristics of pyeonyuk with different additional levels of turmeric powder. Food Sci. Anim. Resour. 2019, 39, 35–44. [Google Scholar] [CrossRef] [PubMed]
- Júnior, M.M.; de Oliveira, T.P.; Gonçalves, O.H.; Leimann, F.V.; Medeiros Marques, L.L.; Fuchs, R.H.B.; Cardoso, F.A.R.; Droval, A.A. Substitution of synthetic antioxidant by curcumin microcrystals in mortadella formulations. Food Chem. 2019, 300, 125231. [Google Scholar] [CrossRef] [PubMed]
- De Carvalho, F.A.L.; Munekata, P.E.S.; de Oliveira, A.L.; Pateiro, M.; Domínguez, R.; Trindade, M.A.; Lorenzo, J.M. Turmeric (Curcuma longa L.) extract on oxidative stability, physicochemical and sensory properties of fresh lamb sausage with fat replacement by tiger nut (Cyperus esculentus L.) oil. Food Res. Int. 2020, 136, 109487. [Google Scholar] [CrossRef] [PubMed]
- Febrianta, H.; Yunianto, V.D.; Nurwantoro, N.; Bintoro, V.P. Quality evaluation of chicken breast marinated with encapsulation of turmeric extract. Food Res. 2021, 5, 366–373. [Google Scholar] [CrossRef]
- Payton, F.; Sandusky, P.; Alworth, W.L. NMR Study of the Solution Structure of Curcumin. J. Nat. Prod. 2007, 70, 143–146. [Google Scholar] [CrossRef]
- Jayaprakasha, G.K.; Negi, P.S.; Anandharamakrishnan, C.; Sakariah, K.K. Chemical composition of turmeric oil—A byproduct from turmeric oleoresin industry and its inhibitory activity against different fungi. Z. Nat. C 2001, 56, 40–44. [Google Scholar] [CrossRef]
- Singleton, V.L.; Rossi, J.A. Colorimetry of total phenolics with phosphomolybdic-phosphotungstic acid reagents. Am. J. Enol. Vitic. 1965, 16, 144–158. [Google Scholar]
- PN-ISO 1442 PN-ISO 1442; Meat and Meat Products. Determination of Water Content (Reference Method). Polish Committee for Standardization: Warsaw, Poland, 2000.
- Association of Analytical Communities. AOAC Official Methods of Analysis 992.15. (2006a). Proximate Analysis and Calculations Crude Protein Meat and Meat Products Including Pet Foods, 17th ed.; Association of Analytical Communities: Gaithersburg, MD, USA, 2006. [Google Scholar]
- Association of Analytical Communities. AOAC Official Methods of Analysis 991.36. (2006b). Fat (Crude) in Meat and Meat Products, 18th ed.; Association of Analytical Communities: Gaithersburg, MD, USA, 2006. [Google Scholar]
- Salih, A.M.; Smith, D.M.; Price, J.F.; Dawson, L.E. Modified extraction 2-thiobarbituric acid method for measuring lipid oxidation in poultry. Poult. Sci. 1987, 66, 1483–1488. [Google Scholar] [CrossRef]
- Pikul, J. Chemical Evaluation of Poultry Meat Lipids Quality. In Technological Evaluation of Raw Material and Products of Poultry Industry; Pikul, J., Ed.; Wydawnictwo Akademii Rolniczej w Poznaniu: Poznań, Poland, 1993. [Google Scholar]
- Kasım, M.U.; Kasım, R. Yellowing of fresh-cut spinach (Spinacia oleracea L.) leaves delayed by uv-b applications. Inf. Process. Agric. 2017, 4, 214–219. [Google Scholar]
- PN-EN ISO 8586:2014-03; Sensory Analysis. General Guidance for Selection, Training and Monitoring of Selected Assessors and Experts. Polish Committee for Standardization: Warsaw, Poland, 2014.
- PN-EN ISO 4833-1:2013-12; Mikrobiologia Łańcucha Żywnościowego. Horyzontalna Metoda Oznaczania Liczby Drobnoustrojów. Część 1: Oznaczanie Liczby Metodą Posiewu Zalewowego w Temperaturze 30 °C (in Polish). Polish Committee for Standardization: Warsaw, Poland, 2013.
- PN-ISO 15213:2005; Mikrobiologia Żywności i Pasz. Horyzontalna Metoda Oznaczania Liczby Bakterii Redukujących Siarczany (IV) Rosnących w Warunkach Beztlenowych. Polish Committee for Standardization: Warsaw, Poland, 2013. (In Polish)
- PN-ISO 4831:2007; Mikrobiologia Żywności i Pasz. Horyzontalna Metoda Wykrywania i Oznaczania Liczby Bakterii z Grupy coli. Metoda Najbardziej Prawdopodobnej Liczby. Polish Committee for Standardization: Warsaw, Poland, 2013. (In Polish)
- PN-EN ISO 6888–3:2004/AC:2005; Mikrobiologia Żywności i Pasz. Horyzontalna Metoda Oznaczania Liczby Gronkowców Koagulazo-Dodatnich (Staphylococcus aureus i Innych Gatunków). Część 3: Wykrywanie Obecności i Oznaczanie Małych Liczb Metodą NPL. Temperatura INKUBACJI 37 °C. Polish Committee for Standardization: Warsaw, Poland, 2013. (In Polish)
- Embuscado, M.E. Spices and herbs: Natural sources of antioxidants—A mini review. J. Funct. Foods 2015, 18, 811–819. [Google Scholar] [CrossRef]
- Rashid, F.; Dhanapal, K.; Sravani, K.; Saba, K. Potato and ginger peels: A potential new source of natural antioxidants. MOJ Food Process. Technol. 2017, 4, 129–132. [Google Scholar]
- Boligon, A.A.; Machado, M.M.; Athayde, M.L. Technical evaluation of antioxidant activity. Med. Chem. 2014, 4, 517–522. [Google Scholar] [CrossRef]
- De Florio Almeida, J.; dos Reis, A.S.; Heldt, L.F.S.; Pereira, D.; Bianchin, M.; de Moura, C.; Plata-Oviedo, M.V.; Haminiuk, C.W.I.; Ribeiro, I.S.; da Luz, C.F.P.; et al. Lyophilized bee pollen extract: A natural antioxidant source to prevent lipid oxidation in refrigerated sausages. LWT-Food Sci. Technol. 2017, 76, 299–305. [Google Scholar] [CrossRef]
- Ghani, M.A.; Barril, C.; Bedgood, D.R.; Prenzler, P.D. Measurement of antioxidant activity with the thiobarbituric acid reactive substances assay. Food Chem. 2017, 230, 195–207. [Google Scholar] [CrossRef] [PubMed]
- Jung, S.; Nam, K.C.; Jo, C. Detection of malondialdehyde in processed meat products without interference from the ingredients. Food Chem. 2016, 209, 90–94. [Google Scholar] [CrossRef]
- Sharma, J.; Ponnusamy Pazhaniandi, P.; Tanwar, V.K.; Das, S.K.; Goswami, M. Antioxidant effect of turmeric powder, nitrite and ascorbic acid on stored chicken mince. Int. J. Food Sci. Technol. 2012, 47, 61–66. [Google Scholar] [CrossRef]
- Ulu, H. Evaluation of three 2-thiobarbituric acid methods for the measurement of lipid oxidation in various meats and meat products. Meat Sci. 2004, 67, 683–687. [Google Scholar] [CrossRef] [PubMed]
- Sánchez del Pulgar, J.; Gázquez, A.; Ruiz-Carrascal, J. Physico-chemical, textural and structural characteristics of sous-vide cooked pork cheeks as affected by vacuum, cooking temperature, and cooking time. Meat Sci. 2012, 90, 828–835. [Google Scholar] [CrossRef]
- Silva, F.A.P.; Ferreira, V.C.S.; Madruga, M.S.; Estévez, M. Aroma profile and consumer liking of salted and dried chicken meat: Effects of desalting and cooking methods. Int. J. Food Prop. 2017, 20, 2954–2965. [Google Scholar] [CrossRef]
- Mancini, S.; Preziuso, G.; Paci, G. Effect of turmeric powder (Curcuma longa L.) and ascorbic acid on antioxidant capacity and oxidative status in rabbit burgers after cooking. World Rabbit. Sci. 2016, 24, 121–127. [Google Scholar] [CrossRef]
- Kilic, S.; Oz, E.; Oz, F. Effect of turmeric on the reduction of heterocyclic aromatic amines and quality of chicken meatballs. Food Control 2021, 128, 108189. [Google Scholar] [CrossRef]
- Chattopadhyay, I.; Biswas, K.; Bandyopadhyay, U.; Banerjee, R.K. Turmeric and curcumin: Biological actions and medicinal applications. Curr. Sci. 2004, 87, 44–53. [Google Scholar]
- Fernández, J.; Pérez-Álvarez, J.A.; Fernández-López, J.A. Thiobarbituric acid test for monitoring lipid oxidation in meat. Food Chem. 1997, 59, 345–353. [Google Scholar] [CrossRef]
- Zhang, Y.; Holman, B.W.B.; Ponnampalam, E.N.; Kerr, M.G.; Bailes, K.L.; Kilgannon, A.K.; Collins, D.; Hopkins, D.L. Understanding beef flavour and overall liking traits using two different methods for determination of thiobarbituric acid reactive substance (TBARS). Meat Sci. 2019, 149, 114–119. [Google Scholar] [CrossRef]
- Maurya, P.; Borpuzari, R.N.; Nath, D.R.; Nath, N.C. Effect of starter culture and turmeric on physicochemical quality of carabeef pastirma. J. Food Sci. Technol. 2010, 47, 89–93. [Google Scholar] [CrossRef][Green Version]
- Fontana, A.J. Understanding the importance of water activity in food. Cereal Foods World 2000, 45, 7–10. [Google Scholar]
- Gajewska-Szczerbal, H.; Danyluk, B.; Sakowicz, M. Dynamics of water activity changes in portioned meat products packed in multilayer foils. Acta Agrophysica 2004, 4, 313–324. [Google Scholar]
- Karpińska-Tymoszczyk, M.; Danowska-Oziewicz, M.; Draszanowska, A. Effect of the addition of chia seed gel as egg replacer and storage time on the quality of pork patties. Foods 2021, 10, 1744. [Google Scholar] [CrossRef]
- Pałacha, Z.; Makarewicz, M. Water activity of choosen food-stuff groups. Postępy Tech. Przetwórstwa Spożywczego 2011, 2, 24–29. [Google Scholar]
- Suman, S.P.; Joseph, P. Myoglobin chemistry and meat color. Annu. Rev. Food Sci. Technol. 2013, 4, 79–99. [Google Scholar] [CrossRef]
- Domínguez, R.; Pateiro, M.; Echegaray, N.; Bermúdez, R.; Vargas-Ramella, M.; Munekata, P.E.S.; Lorenzo, J.M. Influence of the addition of turmeric on the color and texture parameters of healthy Beef Pâté. In Proceedings of the 67th International Congress of Meat Science and Technology (ICoMST), Cracow, Poland, 23–27 August 2021; p. 65. [Google Scholar]
- Yun, E.-A.; Jung, E.; Joo, N. Quality characteristics of chicken sausage prepared with turmeric (Curcuma longa L.) during cold storage. J. Korean Diet. Assoc. 2013, 19, 195–208. [Google Scholar] [CrossRef]
- Doğan, S.; Ayyildiz, Y.; Doğan, M.; Alan, Ü.; Diken, M.E. Characterisation of polyphenol oxidase from Melissa officinalis L. subsp. officinalis (lemon balm). Czech J. Food Sci. 2013, 31, 156–165. [Google Scholar] [CrossRef]
- Ortuño, J.; Serrano, R.; Jordán, M.J.; Bañón, S. Shelf life of meat from lambs given essential oil-free rosemary extract containing carnosic acid plus carnosol at 200 or 400mg kg−1. Meat Sci. 2014, 96, 1452–1459. [Google Scholar] [CrossRef] [PubMed]
- Ripoll, G.; Joy, M.; Muñoz, F. Use of dietary vitamin E and selenium (Se) to increase the shelf life of modified atmosphere packaged light lamb meat. Meat Sci. 2011, 87, 88–93. [Google Scholar] [CrossRef] [PubMed]
- Szczesniak-Surmacka, A. Texture is a sensory property. Food Qual. Prefer. 2002, 13, 215–225. [Google Scholar] [CrossRef]
- Ansari, S.; Maftoon-Azad, N.; Farahnaky, A.; Hosseini, E.; Badii, F. Effect of moisture content on textural attributes of dried figs. Int. Agrophysics 2014, 28, 403–412. [Google Scholar] [CrossRef]
- Yoon, S.-J.; Choi, E.-H. Quality characteristics of wheat flour dasik by the addition of turmeric powder. Korean J. Culin. Res. 2011, 17, 132–140. [Google Scholar]
- Tangkham, W. Sensory characteristics of three different levels of turmeric powder on beef stick product. Acta Sci. Nutr. Health 2020, 4, 14–18. [Google Scholar] [CrossRef]
- Lawrence, T.; Kropf, D. Vacuum Packaging of Meat, Reference Module in Food Science; Elsevier: Amsterdam, The Netherlands, 2018; ISBN 9780081005965. [Google Scholar]
- Oranusi, U.S.; Braide, W.; Osigwe, G.A. Investigation on the microbial profile of canned foods. J. Biol. Food Sci. Res. 2012, 1, 15–18. [Google Scholar]
Publisher’s Note: MDPI stays neutral with regard to jurisdictional claims in published maps and institutional affiliations. |
© 2022 by the authors. Licensee MDPI, Basel, Switzerland. This article is an open access article distributed under the terms and conditions of the Creative Commons Attribution (CC BY) license (https://creativecommons.org/licenses/by/4.0/).