Article

On a Framework for Federated Cluster Analysis

Department of Advanced Computing Sciences, Faculty of Science and Engineering, Maastricht University, 6229 EN Maastricht, The Netherlands
*
Authors to whom correspondence should be addressed.
These authors contributed equally to this work.
Appl. Sci. 2022, 12(20), 10455; https://doi.org/10.3390/app122010455
Submission received: 18 September 2022 / Revised: 28 September 2022 / Accepted: 8 October 2022 / Published: 17 October 2022
(This article belongs to the Special Issue Federated and Transfer Learning Applications)

Abstract

:
Federated learning is becoming increasingly popular to enable automated learning in distributed networks of autonomous partners without sharing raw data. Many works focus on supervised learning, while the area of federated unsupervised learning, similar to federated clustering, is still less explored. In this paper, we introduce a federated clustering framework that solves three challenges: determine the number of global clusters in a federated dataset, obtain a partition of the data via a federated fuzzy c-means algorithm, and validate the clustering through a federated fuzzy Davies–Bouldin index. The complete framework is evaluated through numerical experiments on artificial and real-world datasets. The observed results are promising, as in most cases the federated clustering framework’s results are consistent with its nonfederated equivalent. Moreover, we embed an alternative federated fuzzy c-means formulation into our framework and observe that our formulation is more reliable in case the data are noni.i.d., while the performance is on par in the i.i.d. case.

1. Introduction

The success of machine learning (ML) can partly be attributed to the availability of good and sufficiently sized training datasets. Often, the data are stored on a central server, where ML models are trained. However, the data might initially be distributed among many clients (e.g., smartphones, companies, etc.). There are situations where gathering the data on a central server is not feasible, e.g., due to privacy regulations (such as GDPR) [1]), the amount of data, or other reasons. Federated learning (FL) is an approach that allows clients to jointly learn ML models while keeping all data local [2]. Authors describe the generic FL training process by five steps:
  • Client selection: Select clients participating in the training.
  • Broadcast: A central server initializes a global model and shares it with the clients.
  • Client computation: Each client updates the global model by applying a training protocol and shares the updates with the central server.
  • Aggregation: The central server applies an aggregation function to update the global model.
  • Model update: The updated global model is shared with the clients.
This protocol can be repeated multiple times until a convergence criterion is met. Training a model following such a process has been successfully applied to a variety of use cases, e.g., for next-word predictions on smartphones [3], vehicle image classification [4], data collaboration in the healthcare industry [5,6], on IoT data [7,8,9], and many more. For comprehensive surveys please refer to [2,10] or [11]. Many works focus on supervised learning while the area of federated unsupervised learning, similar to federated clustering, is less explored. Cluster analysis is widely applied across many different disciplines as diverse as medical research [12], social and behavioral sciences [13,14], strategic management [15], or marketing [16,17], just to name a few. In all of these areas of application, the data could be initially distributed and hard to centralize. Hence, they are all potential application areas for a federated cluster analysis framework. Ref. [18] described cluster analysis as seven steps that need to be performed in order to derive insights (Section 2.1). In federated clustering, only one step has been (explicitly) addressed, i.e., the clustering method [19,20,21,22]. Other important steps, such as cluster validation or determining the number of clusters, have no federated equivalent yet.
Federated clustering is an FL setting, where the goal is to group together (local) data points that are globally similar to each other. That is, data points are distributed among multiple clients and are clustered based on a global similarity measure, while all data remain local on client devices. Existing works largely focus on developing and applying a federated clustering method, i.e., partitioning the data given the number of (global) clusters K. While being an important step in the clustering framework, the lack of more comprehensive frameworks (for example, including determination of the number of clusters and cluster validation) might hinder application in practice.
We contribute to closing this gap by introducing a multistep federated (fuzzy) clustering analysis framework for the first time. In particular, we propose a federated version of the well-known (fuzzy) Davies–Bouldin index for cluster validation, show how to use it for the determination of the number of clusters, and apply a federated fuzzy c-means algorithm to solve the soft clustering problem. Even though independently developed, we note that our federated fuzzy c-means algorithm is closely related to other works in the area of federated clustering [19,20,21,22]. It combines local fuzzy c-means on the client side with k-means on the global server side. Each idea in itself is not new, but the combination is, and we observe that our formulation is more reliable than other federated fuzzy clustering methods in case the data are non-i.i.d. To the best of our knowledge, there exists no cluster validation index for federated cluster validation yet. Moreover, no work addressing the problem of determining the number of clusters in a federated setting is known to us.
In the remainder of this section, we demonstrate the need for a federated clustering framework. In subsequent sections, we review relevant works from nonfederated and federated cluster research in Section 2.1. In Section 2.2, we introduce the individual pieces of our framework before fitting them together. Section 3 contains an experimental evaluation on real-world and artificial data to demonstrate the framework’s effectiveness and uncover shortcomings. Finally, Section 4 concludes this work.

1.1. Motivational Example

Previous works in federated clustering mostly assume application scenarios to be given. However, it is not necessarily obvious that sophisticated federated cluster analysis algorithms are indeed required and, for example, exchanging locally optimal cluster analysis results is not sufficient. This motivational example is designed to close the gap. In the following example, locally optimal results obtained by nonfederated fuzzy c-means do not reveal the global cluster structure. We illustrate this example by outlining a potential practical application.
Imagine a multinational company with several local markets selling similar consumer goods in all markets. Each local market has data about their customers (e.g., age, place of residency, sold good, etc.) and applies (fuzzy) clustering algorithms to generate customer segments. The cluster analysis insights are utilized to steer marketing activities. The company wishes to derive global clusters to better understand their global customer base and identify unlocked potential in the local markets. Due to strict privacy regulations, the company is not allowed to gather all data in a central database (e.g., European customer data are not allowed to be transferred to most countries outside of Europe). The company could ask each local market to share their local cluster centers, but this approach disregards that clusters might only become apparent when the data are combined. Such a situation exists, as we will show. For the purpose of this example, we spare the details of the dataset creation, because a detailed explanation can be found in Section 3.2.1. It is enough to know that there are five global clusters in the dataset, because of how it was created. Four of the clusters have relatively high cardinality, and the fifth cluster has fewer points. We verify that the correct number of clusters is detected in the centralized dataset. To achieve this, the (nonfederated) fuzzy c-means algorithm (Section 2.1.2) is applied with multiple (potential) number of clusters K, and the result is evaluated with the fuzzy Davies–Bouldin index (Section 2.1.3). The best fuzzy Davies–Bouldin score is achieved with K = 5 , and we can conclude that the correct number of clusters can be found in the centralized case.
This example is designed to prove that global structure in federated data can hide behind locally optimal solutions. To create a federated setting, the data are distributed among three clients in a certain way: each client receives data from two of the four bigger clusters and a few points from the smaller cluster (see Figure 1 for a visualization). Next, we calculate the number of local clusters for all clients using the same method as before (nonfederated fuzzy c-means in combination with nonfederated Davies–Bouldin). For each client now, the best number of clusters is 2 (as it gives the best DB index score) and none identify the smaller cluster present in their data. That calls for a federated cluster analysis (federated clustering method and federated cluster validation metric) that is able to detect the global structure.
In the multinational company example, the smaller cluster could represent a group of customers that each local market falsely assigned to their bigger clusters. As a consequence, the company targets those customers with inappropriate marketing activities. Exploiting insights from the global cluster analysis could lead to new, more targeted marketing strategies and unlock (previously hidden) potential.
This work is concerned with introducing the federated fuzzy Davies–Bouldin (FedFuzzDB) index as a federated cluster validation metric. It can be leveraged to identify all five clusters in the data without the need for sharing the raw data, as we will see in Section 3.2.1. To the best of our knowledge, there exists no other federated cluster validation metric in the literature. Another, equally important, challenge is to correctly identify the global cluster structure given the number of clusters. Our framework applies a federated fuzzy c-means algorithm with k-means averaging (FedFCM, Section 2.2.3) to address this challenge. We will see that the combination of FedFuzzDB and FedFCM leads to promising results, but note that the framework could also be used with other clustering algorithms.

2. Materials and Methods

Our overall framework consists of federated versions of the fuzzy c-means with k-means averaging and a federated version of the (fuzzy) Davies–Bouldin index. Therefore, we revisit these well-known concepts in the next subsections (Section 2.1.1, Section 2.1.2 and Section 2.1.3). Moreover, we provide a brief overview of works about federated clustering (Section 2.1.4). Finally, we introduce our new framework in Section 2.2 and corresponding subsections.

2.1. Background: Related Work

2.1.1. Nonfederated k-Means Clustering

Let X be a given dataset. The objective of the k-means clustering is to find cluster centers c = ( c 1 , c 2 , , c K ) (and corresponding assignments) such that the following expression is minimized (see, e.g., [23]):
J ^ ( c ) = k = 1 K x X I ( x , k ) | | x c k | | 2 I ( x , k ) = 1 , x is assigned to cluster k , 0 , otherwise .
Each data point x is assigned to its closest cluster center, where closeness is defined by Euclidean distance. The assignment is given by function a : X × { c 1 , , c K } { 1 , , K } :
a ( x , { c k } k = 1 K ) : = arg min 1 k K | | c k x | | 2
A widely used iterative algorithm for finding such a clustering works is as follows [23]:
  • Initialize cluster centers c 1 , , c K .
  • Assign clusters for all x X according to a ( x , { c k } k = 1 K ) (Equation (2)).
  • Recalculate cluster centers c k by solving the following problem, i.e., calculating the mean of points assigned to the same cluster:
    c k = min m R d x X : a ( x ) = k | | x m | | 2 , k = 1 , , K .
  • Check if the convergence criterion is met, i.e., whether the assignment did not change (much) compared to the previous iteration. Let a i ( t 1 ) be the assignment vector of the previous iteration for data point x i X , i.e., the k-th entry is 1 if a ( x i , { c k } ) = k , and zero otherwise. Let a i ( t ) be the assignment of the current iteration. Further, let A ( t 1 ) and A ( t ) be the assignment matrices, where the i-th row equals a i ( t 1 ) and a i ( t ) , respectively. Then, the algorithm converges if the difference between the two assignment matrices is smaller than some predefined ϵ :
    | | A ( t 1 ) A ( t ) | | 2 < ϵ .
If the algorithm did not converge yet, move back to step 2. If it did converge, terminate. J ^ ( c ) is monotonously decreasing with each iteration, but it is known that the algorithm might become stuck in a local minimum. In fact, it does not offer any performance guarantee, and [24] argues that it often fails due to its sensitivity to the initialization method. In [24], the still-popular initialization method k-means++ is introduced. It subsequently chooses random cluster centers that are likely to be far from already chosen centers. In our experiments, we use the scikit-learn implementation that applies the k-means++ initialization method, too [25].

2.1.2. Nonfederated Fuzzy c-Means Clustering

Fuzzy c-means is a well-known soft clustering method that assigns a membership index u i j for clusters j = 1 , , K to data points x i X such that j K u i j = 1 i = 1 , , N . The term soft clustering refers to the fact that points are allowed to belong to more than one cluster. In contrast, a hard clustering method such as k-means assigns each point to exactly one cluster.
For given data X, the objective is to find cluster centers c j and membership matrix U = [ u i j ] such that the following expression is minimized [26]:
J m ( U , c ) = i = 1 N j = 1 K ( u i j ) m | | x i c j | | 2 ,
u i j : = 1 k = 1 K ( | | x i c j | | 2 | | x i c k | | 2 ) 2 m 1 ,
where | | y | | : = l = 1 n y l 2 . It is closely related to the k-means clustering, and the main difference lies in the assignment matrices A in k-means versus U in fuzzy c-means.
Parameter m > 1 controls how fuzzy the cluster assignments should be. The greater the m, the more fuzziness in the assignment, i.e., points are assigned to more clusters with smaller values. A common choice that we also employ in all of our experiments is m = 2 .
A widely used algorithm to find a solution to the optimization problem was introduced by [26] and follows four basic steps:
  • Initialize matrix U:= U 0 .
  • In iteration t, (re)calculate cluster centers c j according to:
    c j = i u i j m x i i u i j m
  • Update membership matrix U t + 1 according to Equation (5).
  • Check if the convergence criterion is met: | | U t + 1 U t | | ϵ for some predefined ϵ , i.e., did the memberships change by at most ϵ ? If it was not met, return to step 2 after setting U t = U t + 1 . Terminate if it was met.
The time-complexity of the algorithm is quadratic in the number of clusters K, and methods to reduce the complexity have been proposed [27]. Similar to k-means, other shortcomings of the algorithm are sensitivity to the cluster initialization and sensitivity to noise, as noted in [28]. Those challenges have been addressed by subsequent works, but each auxiliary method comes with its own shortcomings [28]. Clustering in high-dimensional spaces is another well-known challenge for clustering algorithms in general [29], and fuzzy c-means in particular [30], due to high sparsity in high-dimensional spaces. Authors of [30] show that fuzzy c-means centers are likely to converge to the center of mass of the whole dataset in high-dimensional spaces. It remains up to the practitioners to decide on a suitable method for their specific problems.
For the introduction of federated fuzzy c-means, we focus on the original formulation and extend it to the federated setting.

2.1.3. Davies–Bouldin Index

The Davies–Bouldin index was introduced in [31] as a method to measure cluster validity. One of its advantages is that it only requires distances between a “vector characteristic of a cluster” (i.e., cluster center) and the vectors belonging to the cluster, as opposed to pairwise distances between all vectors in the dataset, as in other cluster validation methods. That makes it also particularly interesting for the federated clustering setting, where a pairwise distance matrix is hard to obtain, but distances to the cluster center can be calculated locally, shared, and averaged by the central server.
Informally speaking, the validation measures how well “cluster spread” is balanced against “dissimilarity between cluster centers”. A good clustering is achieved with low spread and high cluster center dissimilarity, but these goals are potentially conflicting. Formally, in [31], the nonfederated measure for a hard clustering is defined as:
R ¯ : = 1 K i = 1 K R i
R i : = max i j R i j
R i j : = S i + S j M i j
S i : = ( 1 T i j = 1 T i | | x j c i | | q ) 1 q cluster spread
M i j : = ( k = 1 D | c i [ k ] c j [ k ] | p ) 1 p center distances ,
where c i is the characteristic vector (read: center) of cluster i, and D is the dimension of the data. Note that R i j is big when two cluster centers are close to each other (small M i j ), or the “spread” of the clusters is big (big S i ) . Additionally, the cluster spread is usually smaller if we have many clusters. However, this often comes at the expense of closer centers. Roughly speaking, the index measures how well those two characteristics are balanced, and a smaller value indicates a better cluster result. In our experiments, we chose p = 2 and q = 1 for our computations.
A soft version of the Davies–Bouldin index for fuzzy clustering was introduced in [32]. In soft clustering, every point can belong to every cluster, but in Equation (10), only points belonging to the same cluster are considered. Hence, the “spread” of a cluster must be defined differently. Authors of [32] propose the following adaptation:
S i f : = U i ( 1 N j = 1 N | | x j c i | | q ) 1 q ,
U i : = 1 N j = 1 N u i j .
Each x X can belong to each cluster i. As a consequence, the spread of each cluster needs to be calculated by considering the whole dataset and is then multiplied by the average assignment for cluster i, i.e., U i . The calculation of the index R ¯ proceeds as outlined above, with S i f instead of S i .

2.1.4. Federated Clustering

Due to the similarity in terminology, we start by contrasting clustered federation with federated clustering. Clustered federation is concerned with identifying clusters of clients or model updates that are suitable to be grouped for a focused update of global supervised FL models. It has been proven to be effective when addressing issues caused by non-i.i.d. data among clients [33,34,35,36].
In contrast, federated clustering is concerned with identifying global clusters in distributed data without sharing the data and, to the best of our knowledge, has not been explored as much. In [19], the k-means algorithm was extended to the federated setting. Client devices execute the k-means algorithm and share cluster centers with the central server. Authors propose a global averaging function that calculates a weighted mean of local cluster centers in order to update global cluster centers. The weights are given by the number of local data points assigned to the clusters. Further, the federated fuzzy clustering equivalent of that approach was introduced in [20] and similarly in [21]. In this approach, the clients execute the fuzzy c-means algorithm and share the results. Then, the fuzzy assignment vectors are used as weights instead of number of data points given by the hard assignments. In their experimental sections, both works focus on scenarios where the data are uniformly distributed among the clients. Ref. [20] found that the federated clustering result was consistent with centralized clustering result, the algorithm converged quickly, and the clustering result was not impacted much by the number of clients participating. Additionally, Ref. [21] observed that even if clients became unavailable during the federation, the algorithm still found good results. However, these findings are limited to scenarios where the data are uniformly distributed among clients. Finally, we acknowledge that [20] also introduced a formulation for vertical FL, which is beyond the scope of this work.
A different approach on averaging the local cluster centers to obtain global cluster centers was taken in [22] in the context of one-shot learning. The clients performed k-means clustering. On the central server, the global cluster centers were computed by applying the k-means algorithm again to the shared local cluster centers. Besides numerical experiments, they also provided proof that the result was similar to an “oracle clustering” (e.g., clustering on the assumed centralixed dataset). The federated k-means algorithm by [19] appears to be the first work in the area of federated clustering. All other papers were published around the same time and appear to be independent of each other.
In [18], the cluster analysis framework is described in terms of seven steps: selecting training examples for the cluster analysis, selecting variables for the cluster analysis, preprocessing (e.g., standardizing) the data, selecting a (dis)similarity measure, selecting a clustering method, determining the number of clusters, and interpreting and validating the results. Note that the aforementioned works are mostly concerned with the clustering method and (implicitly) with the dissimilarity measure in a federated setting. With this work, we aim to also contribute to determining the number of clusters and cluster validation in a federated setting; however, similar to the other works, we assume the experimental datasets to be preprocessed and prepared for analysis.

2.2. The Federated Fuzzy Clustering Framework

In this section, we build upon the previous section and introduce the federated versions of the fuzzy c-means algorithm (Section 2.2.1) and fuzzy Davies–Bouldin index (Section 2.2.2). In Section 2.2.3 the pieces are assembled to form a cluster analysis framework performing three steps: determine the number of clusters K, derive a clustering for K, and validate the clustering through a federated cluster validation metric.

2.2.1. Federated Fuzzy c-Means with k-Means Averaging

Our proposed federated fuzzy c-means algorithm (FedFCM) is an extension of the iterative fuzzy c-means algorithm to the federated learning setting similar to [20,21], but with a different take on the global cluster center calculation. The global cluster calculation is similar to the one proposed in [22], where it is applied in the context of federated one-shot k-means. This idea was first mentioned and discussed in our preliminary work [37].
In the federated scenario, the data are not stored in a centralized database, but distributed among multiple clients. The goal is to learn a global clustering that is similar to the clustering of the centralized data while the data stay private. The general procedure is as follows: Each client runs a number of fuzzy c-means iterations locally, and sends the resulting cluster centers to a central server. The central server is responsible for calculating meaningful global clusters from the local learners’ results. After calculating the global centers, they are shared with the clients that use them to recalculate their local centers, which in turn are shared with the central server, and so forth. That procedure is repeated until the global centers remain stable.
The creation of a global model from clients’ local model updates was first introduced by [38] and is known as federated averaging (FedAvg). Our averaging method is a k-means averaging that was independently developed and applied in the context of federated one-shot clustering in [22].
Let data X be distributed among P parties (clients), i.e., X = l = 1 P X ( l ) . The protocol reads as follows:
  • The central server initializes K global cluster centers c 1 , , c K .
  • The central server shares c 1 , , c K with the clients.
  • Client l calculates membership matrix U l t + 1 according to Equation (5) and generates local cluster centers c 1 ( l ) , , c K ( l ) according to Equation (6) ( l = 1 , , P ) and repeats until local convergence.
  • Client l shares c 1 ( l ) , , c K ( l ) for j = 1 , , K and l = 1 , , P .
  • The central server updates c 1 , , c K by applying an averaging function a v g ( [ c 1 ( l ) , , c K ( l ) ] l = 1 P ) .
  • The central server checks a convergence criterion. If not converged, go back to step 2.
Since the central server has only access to the local cluster centers c k ( l ) , the previous convergence criterion can not be applied. As an alternative, we check whether the cluster centers changed by less than ϵ between two iterations. Let c k t be the global cluster center k after time step t. Then, the convergence criterion can be formulated as follows: k = 1 K | | c k t c k t + 1 | | ϵ . Note that this new criterion might lead to different cluster centers than in the previous formulation. It might let the centers move closer to the center of mass even though the assignments might have stabilized already.
In order to find meaningful global clusters, it is essential to find a good averaging function a v g ( · ) used in step 5 of the framework outlined above.
To address this challenge, we apply a k-means averaging function, similar to the one in [22]:
a v g : R P × d × K R d × K a v g ( [ c k ( l ) ] k , l ) : = k m e a n s ( [ c k ( l ) ] k , l ) , = [ c k ] k ,
where k m e a n s ( · ) denotes a function that applies the k-means clustering algorithm and outputs the k cluster centers it converged to. This averaging function applies the k-means algorithm to all reported local cluster centers to find new global cluster centers. It does introduce increased complexity compared to federated fuzzy c-means in [20,21], but we observed robust results in preliminary experiments [37]. At the same time, sharing only the local cluster centers (as opposed to local centers and assignment vectors such as in [19,20,21]) increases the privacy of the data.
We know that both the fuzzy c-means and k-means algorithm converge (even though possibly to local optima) when applied separately. Convergence means that the centers and assignment vectors are guaranteed to stabilize after finitely many iterations. Our federated algorithm converged if the global cluster centers stabilized. For that to happen, the local cluster centers must have stabilized. The local cluster center, in turn, stabilizes if the global centers do not change much between two iterations. We want to provide intuition on why we observe such a behavior in our experiments. Each clients starts with calculating local cluster centers in the first iteration and reports them back to the central server. The central server essentially groups together all centers that are close to each other, calculates the average of close centers, and reports those averages back to the clients as their new centers. Due to this averaging, it is likely that for any previous local center there is a new nearby global center (which is a function of that previous center). The client updates the global center with its local data. Since it is close to a previously reported center, the new local centers do not deviate much from the global center, and the update is small. If a new center has low cluster membership, the update is naturally small. With small updates, however, we know the k-means algorithm to converge. Usually, the updates can be quite big after the first global round, but are small thereafter, which is consistent with the behavior of k-means one-shot learning with k-means averaging [22]. Even though this is not a formal convergence proof, we hope to provide insights into how the algorithm is expected to behave.

2.2.2. Federated Fuzzy Davies–Bouldin Index

As described in the introduction (Section 1.1, Figure 1), there is a need for federated cluster validation metrics. It is not enough to calculate metrics such as the Davies–Bouldin index locally and draw conclusions from there. Therefore, we formulate a federated version of the index. In the federated setting, the global server does not have access to the clients’ data. That means that it cannot carry out the calculation of the soft Davies–Bouldin index R ¯ directly. Specifically, the central server can not directly calculate the cluster spread S i f (Equation (12)) that requires the calculation of distances between cluster centers c i and data points x j . Through a simple transformation we see that sharing the data points is not required:
S i f = U i ( 1 N j = 1 N | | x j c i | | q ) 1 q
= U i ( 1 l = 1 P N l l = 1 P j = 1 N l | | x j ( l ) c i | | q ) 1 q
U i = 1 l = 1 P N l l = 1 P j = 1 N l u i j ( l )
Hence, for the calculation of S i f , each client l needs to share its number of data points N l , its local local cluster spread j = 1 N l | | x j ( l ) c i | | q , and its local average assignment vectors j = 1 N l u i j ( l ) for i = 1 , , K . With that information, the global server can calculate S i f . Since the global server calculates (and knows) the cluster centers, it can also calculate M i j , i.e., the distances between centers c i and c j (Equation (11)), and, finally, R i j for all ( i , j ) , R i and the index R ¯ . Note that the federated and nonfederated versions of the Davies–Bouldin index produce the same result given X = l = 1 N X ( l ) , and the nonfederated and federated cluster centers are the same. Generally, the first assumption holds in our experiments while the second one is the subject of study and cannot be guaranteed. In fact, due to different convergence criteria in the nonfederated and federated fuzzy c-means algorithms, the centers are often different. Generally, however, we expect federated clustering and nonfederated algorithms to converge to similar centers.

2.2.3. The Complete Framework

Our proposed framework for federated clustering addresses three core challenges: Estimate the number of clusters in the federated dataset, obtain a cluster result (i.e., centers and a data partitioning) that is similar (or not worse) to the one on the same but centralized dataset, and assess the federated cluster result via a federated validation metric. Note that the challenges are closely related. In order to compare two clustering results (for example, with different numbers of clusters), there must be an evaluation metric. This evaluation metric is the FedFuzzDB index. To obtain the federated clustering result, a federated clustering method must be applied. In our case, this is FedFCM (and for comparison federated fuzzy c-means with federated averaging). The overall framework applies the following steps:
  • Decide on a range for number of clusters K to test: [ K m i n , K m a x ] .
  • For each K [ K m i n , K m a x ] :
    (a)
    Obtain a clustering with FedFCM as described in Section 2.2.1.
    (b)
    Calculate the FedFuzzDB index of that clustering as described in Section 2.2.2 and store the result.
  • Choose K [ K m i n , K m a x ] with the minimum FedFuzzDB index as the number of clusters or apply the elbow method (see, e.g., [39]).
The initial guess for [ K m i n , K m a x ] is not subject to a more principled study in this work, but we acknowledge that choosing a good range is crucial. It is known that the Davies–Bouldin index sometimes favors higher number of clusters [40]. Therefore, introducing a tight upper bound can be important. In a federated setting, this is even harder, as some clusters might not even be present in any client’s data, but only form when the data are combined (Section 1.1 and Section 3.2.1). As a rule of thumb, we note that the minimum number of global clusters is given by the minimum number any client could identify on its own (note that two local clusters might turn out to belong to the same cluster in the global dataset). The maximum is (roughly) given by l = 1 P K l + f o r m i n g o v e r l a p p i n g . K l is the number of clusters locally in client l, f o r m i n g is the number of clusters that only form when the data are combined, and o v e r l a p p i n g is the number of clusters that overlap. f o r m i n g and o v e r l a p p i n g are the hardest to estimate, even with knowledge from an initial local-only clustering. As a very rough rule of thumb, we apply K m a x min l K ( l ) + max l K ( l ) in our real-world experiment.
Before continuing with experiments, we note that there is a potential privacy risk and suggest a simple prevention mechanism. Let us summarize the local information that is required to be shared with the central server for the overall framework. For the execution of federated fuzzy c-means with k-means averaging, only the local cluster centers need to be shared, which is already a privacy improvement over some of the existing methods. For the calculation of the FedFuzzDB index, however, each client l needs to share more information: its number of total data points N l , the total spread j = 1 N l | | x j ( l ) c i | | q , and the local average assignment vectors j = 1 N l u i j ( l ) for all clusters i = 1 , , K . As noted in [21], this information can be used to formulate a system of nonlinear equations where data x i ( l ) are the only unknowns ( i = 1 , , N l , l = 1 , , P ). While not necessarily easy to solve, this imposes a privacy risk. In [21], the server does not know N l , which is an effective prevention, as they explain. Hence, if we hide N l from the central server, we prevent the privacy risk. Luckily, the calculation of the FedFuzzDB index only requires l = 1 P N l . If we outsource the calculation of l = 1 P N l to an intermediate server, we can circumvent the risk. Another option is to perform the clustering and the validation on different servers that cannot communicate with each other, as the system cannot be solved for X without the cluster center information, either. However, that would require that the distances between clusters i and j ( M i j ) need to submitted to the cluster validation server, e.g., by one of the clients. All of that might not be required if the central server can be completely trusted (for example, when local markets cooperate under the orchestration of the parent company). Usually, it is assumed that the central server only keeps updates for immediate aggregation. Hence, the cluster center information is supposed to be not available anymore when FedFuzzDB is calculated.

3. Results

Our framework is evaluated on three different groups of data. Firstly, we handcraft a non-i.i.d. clustering scenario and apply the complete clustering framework to it. The emphasis in this experiment is on demonstrating and motivating the use of the federated clustering framework to obtain a global cluster structure without sharing the raw data. Secondly, we create federated scenarios from 100 well-known cluster benchmark datasets from the literature [41] by uniformly distributing the data to clients. This set of experiments allows us to study how the framework performs with data of different dimensionality and different spread, and how it behaves with increasing number of clients, but fixed number of total data points. We will see that high sparsity is harmful and big cluster overlap is harmful in the federated and nonfederated setting. Thirdly, we apply the complete framework to more real-world-inspired data and demonstrate how to use it in practice. We will see that the federated and nonfederated results are mostly consistent, and the federated clustering is even slightly better in terms of FedFuzzDB.
Moreover, we compare our federated fuzzy c-means with k-means averaging to federated fuzzy c-means, as introduced in [20,21]. We note that scenarios where the data are nonuniformly distributed among clients are not investigated by these works. In fact, we observe that the method does not converge reliably in such scenarios (see Section 3.2.1 and our preliminary work [37]). Further, note that we do not compare the method to hard clustering methods such as [19] or [22], because we only introduced the fuzzy version of the federated Davies–Bouldin index.
Before describing each dataset in more detail and reporting the results, we introduce the evaluation methods for our experiments.

3.1. Evaluation Method

There are two main questions we want to answer with our evaluation.
  • How reliably can the framework detect the correct number of clusters in federated datasets?
  • How good is the federated clustering result, and how does it compare to an assumed central clustering result?
To answer the first question, we first need to define the “correct” number of clusters. In the first two sets of experiments (Section 3.2.1 and Section 3.2.2), we know the ground truth number of clusters, because the data are artificially created by sampling from Gaussian distributions. Given the ground truth number of clusters K t r u e and the detected number of clusters K d e t i in experiment i, we simply count how often the correct number of clusters was found and report the percentage of correct numbers:
p c o r r e c t = i = 1 N e x p 1 { K d e t i = K t r u e } N e x p ,
where N e x p is the total number of experiments. Moreover, we want to study how federated clustering compares to nonfederated clustering. Therefore, we report p c o r r e c t for the federated dataset and for the same centralized dataset.
The second challenge is to evaluate the clustering result itself. On the one hand, we use the (federated) Davies–Bouldin index introduced in this work. Moreover, we calculate a “knowledge gap” metric whenever ground truth cluster centers are known:
g a p : = k = 1 K i D ( c ˜ k [ i ] c k [ i ] ) 2 V a r ( x [ i ] ) ,
between two sets of cluster centers c ˜ = ( c ˜ 1 , , c ˜ K ) , and c = ( c 1 , , c K ) and V a r ( x [ i ] ) denotes the variance in the i-th dimension. This gives us a normalized measure of the distance between the cluster centers and another indication of whether the algorithm converged to a meaningful result.

3.2. Experiments

As our parameter setup, we chose ϵ = 0.001 in the centralized case, for local convergence, and for global convergence. As noted before, we chose m = 2 , p = 2 , and q = 1 for all experiments. Code to reproduce the results is available (https://github.com/stallmo/federated_clustering).

3.2.1. Framework Demonstration on Artificial Data

We revisit the motivational example from the introduction (Section 1.1). In this example, we start with a centrally created dataset by drawing from five Gaussian distributions: 500 examples each drawn from distributions centered at μ 1 = ( 0 , 0 ) , μ 3 = ( 1 , 1 ) , 1000 examples each drawn from distributions centered at μ 2 = ( 0 , 1 ) , μ 4 = ( 1 , 0 ) and standard deviation σ 1 = 0.2 , 120 examples drawn from a distribution centered at μ 5 = ( 0.5 , 0.5 ) and σ 2 = 0.01 (see also Figure 1). Hence, there are five ground truth centers. First, we verify that the five ground truth centers can indeed be found in a nonfederated scenario. We obtain clustering results for K = 2 , , 7 and calculate the (nonfederated) Davies–Bouldin index for each result. As expected, the index is smallest for K = 5 (Table 1). Second, the data are distributed to three clients such that all clients have data from three clusters in total: two of the four bigger clusters and a few points from the smaller cluster. In particular, each client receives 40 points from distribution ( μ 5 , σ 2 ) . Client 1 receives 500 points each from distributions ( μ 1 , σ 1 ) and ( μ 2 , σ 1 ) . Client 2 receives 500 points each from ( μ 2 , σ 1 ) and ( μ 4 , σ 1 ) . Client 3 receives 500 points each from ( μ 3 , σ 1 ) and ( μ 4 , σ 1 ) . Next, each client applies the (nonfederated) fuzzy c-means separately on their local data for K { 2 , 3 , 4 , 5 } and calculates the (nonfederated) fuzzy Davies–Bouldin index. In this experimental setup, all clients would conclude that they have only two clusters, as K = 2 results in the smallest Davies–Bouldin index (Table 1). The clients only detect the two bigger clusters in their data and disregard the smaller cluster. When applying the federated clustering framework outlined in Section 2.2, the correct number of clusters K = 5 is found. Please refer to Table 1 for an overview of the results. This experiment shows that the framework is capable of identifying global cluster structure even though it is hidden behind local optima without sharing the raw data. For comparison, we repeat the same experiment with the federated fuzzy c-means formulation that applies federated averaging, as introduced in [20,21] (see also Section 2.1). Note that the setting is non-i.i.d. in the sense that not all clients have data from the same clusters and that such a situation was not part of the analysis in [20,21]. For an overview of the results, please refer to Table 2. We observe that the federated averaging formulation struggles to identify the ground truth centers in this setting. The Davies–Bouldin index is generally higher with federated averaging than with k-means averaging. This indicates that the clustering can be considered less meaningful. The same is indicated by the higher ground truth gap, i.e., the ground truth centers could not be found. Consequently, this also leads to a wrong estimate for the number of global cluster centers. All in all, the results with federated averaging appear to be less reliable than k-means averaging on non-i.i.d. data. However, as we will see in the next section, the results on i.i.d. data are similar and, therefore, consistent with [20,21].
The drop in performance can be explained by the lack of a “grouping mechanism”. The grouping mechanism must identify a group of local centers that belong to the same global center and, hence, are used to update that global center. In the case that each client has data from the same clusters (thus, finds and reports similar centers locally), that matching is (implicitly) given. Since all clients have points from the same clusters, all local updates will move in the same direction and there is no ambiguity. With widely different data locally, the local updates will also be very different and there must be a mechanism to deal with the ambiguity, e.g., a grouping of local updates. Using k-means as averaging function directly provides such a mechanism and, as a consequence, produces more reliable results in non-i.i.d. settings.

3.2.2. Evaluation on Benchmark Data

We test our framework on cluster benchmark sets from an online repository (http://cs.uef.fi/sipu/datasets/, accessed on 17 March 2022) [41]. In particular, the G2 sets were introduced in [42] and each set was generated by drawing 2048 samples from two Gaussian distributions with different means, i.e., each set contains two ground truth centers. The Gaussians are centered at μ 1 = ( 500 , 500 , ) and μ 2 = ( 600 , 600 , ) with standard deviations σ { 10 , 20 , , 100 } and dimension D { 2 , 4 , 8 , , 1024 } . In total, there are 100 sets with varying dimension and standard deviation. In order to evaluate the federated clustering framework, we randomly (but uniformly) distribute the points among P { 2 , 5 , 10 } clients. Note that the number of samples is fixed to be 2048 such that with an increasing number of clients, each clients has fewer samples. Each experiment is repeated 20 times and the averages over the runs are reported.
The first step is to determine the correct number of clusters for each G2 set. We follow the procedure described in Section 2.2.3 for K [ 2 , , 6 ] and choose the minimum as the framework’s guess. An overview of the results can be found in Table 3 and Figure 2 and Figure 3 for the framework with k-means averaging. Moreover, the complete framework is evaluated with the federated averaging method for comparison. Results are summarized in Table 3 as well. For the calculation of the correct number of cluster guesses metric in Table 3, we only consider datasets with clustering results with a federated fuzzy Davies–Bouldin index below 1.3 . Through exploratory analysis we found that a higher Davies–Bouldin index often shows that the algorithm could not converge (which we also discuss later in this section). In such cases, the framework’s cluster number guess is meaningless, because the clustering itself is not meaningful. Note that the value of 1.3 coincides with the 75% quantile in all scenarios (central, k-means averaging, and federated averaging) such that the number of considered datasets is similar for all evaluations.
First, we observe that in the nonfederated, central clustering case, the correct number of clusters can be found in 92.2 % of all cases with an federated fuzzy DB index below 1.3 . This detection rate is slightly lower in the federated case. Generally, it decreases with an increasing number of clients (while keeping the number of data points fixed). This effect is independent of the clustering method. The effect can be explained by sparsity, as we discuss at the end of this section. High sparsity leads to decreased cluster algorithm performance and, as a consequence, to less meaningful number of cluster detection.
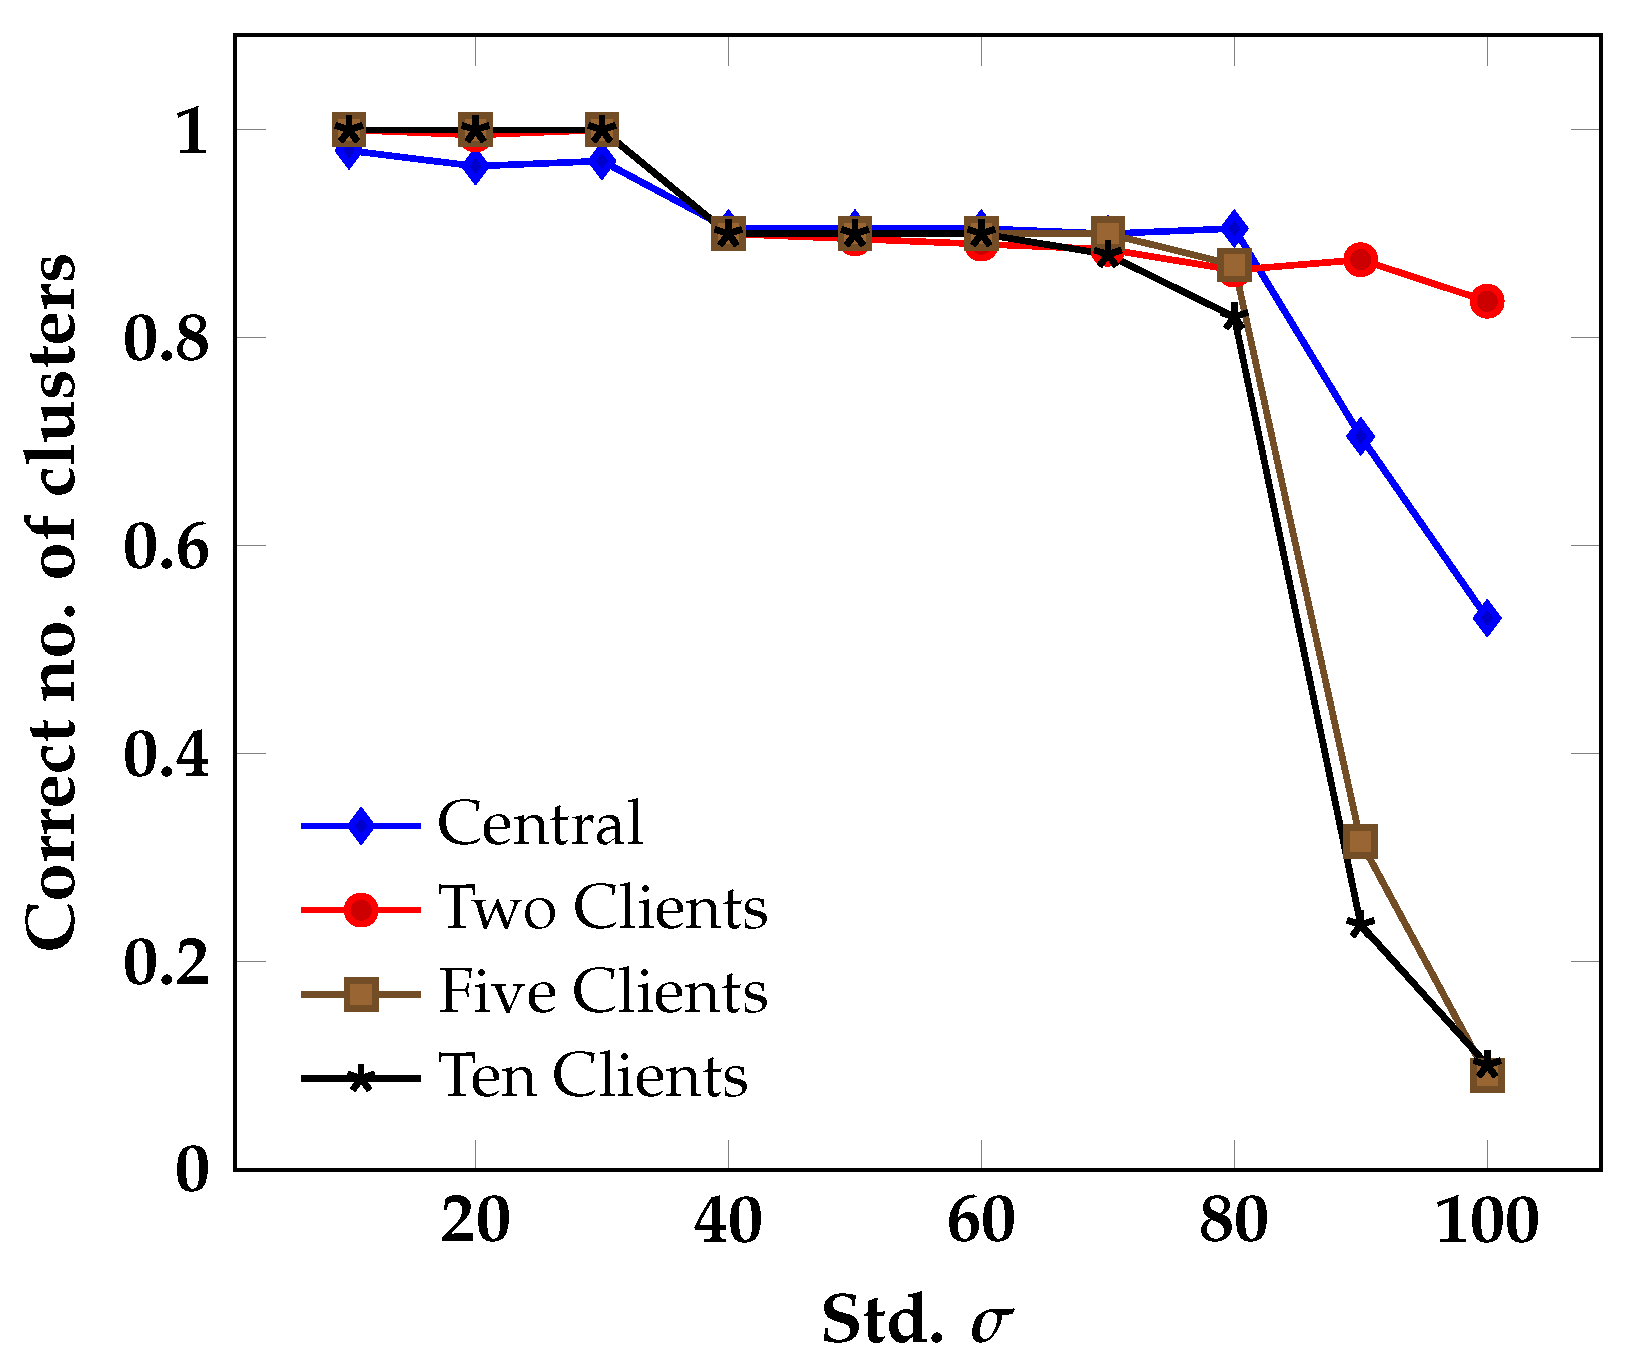
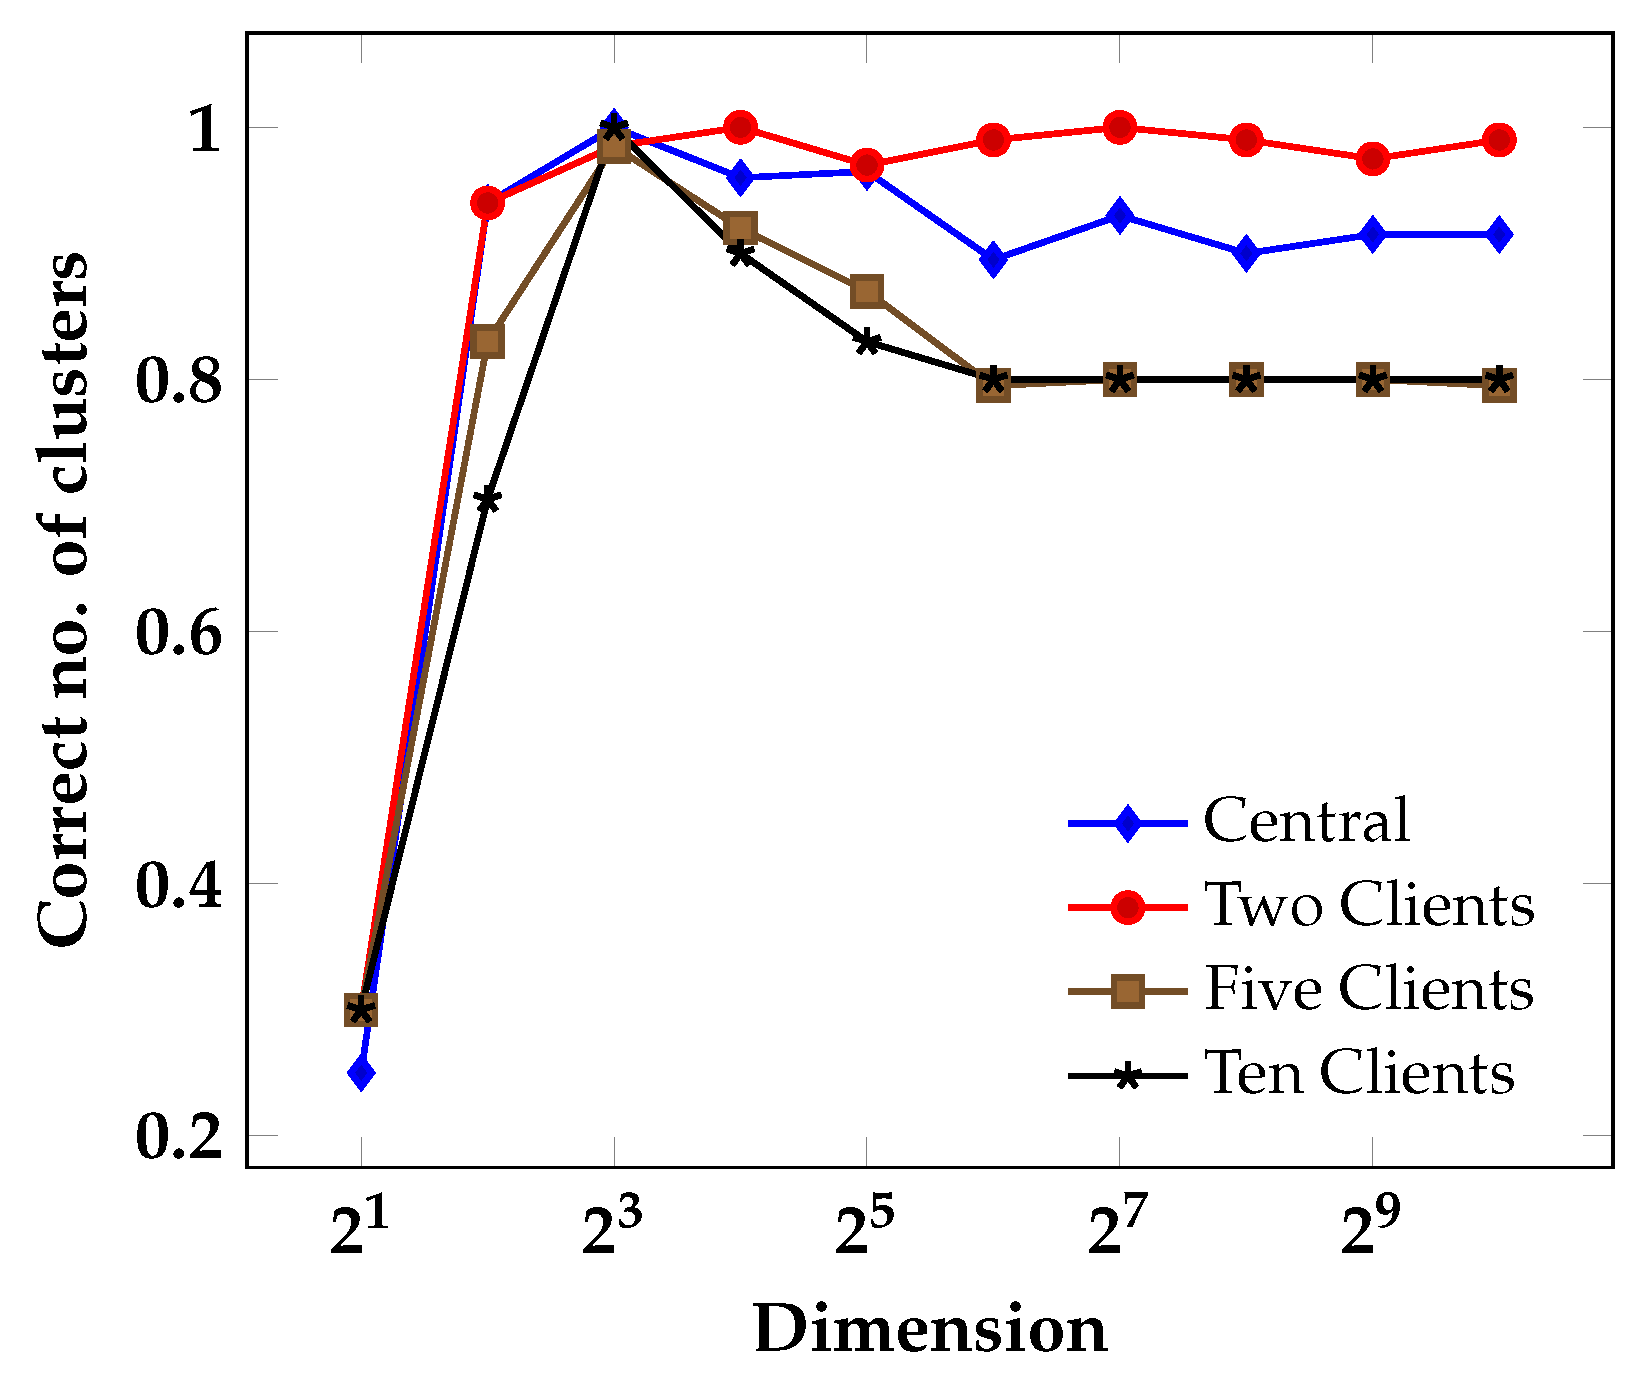
We want to demonstrate the effect of sparsity by taking a closer look at the full G2 set for the k-means averaging. The performance generally worsens with increasing σ (Figure 3; averaged over all D), independent of the number of clients. For σ { 10 , 20 , 30 } , the detection rate is close to one. For σ { 40 , 50 , 60 , 70 , 80 } , the detection rate is between 0.8 and 0.9 with lower numbers for higher number of clients. Finally, there is a noticeable performance drop when σ { 90 , 100 } with the steepest decline when P { 5 , 10 } , where in the majority of cases, the correct number of cases is not detected. Moreover, we also observe detection rates varying across dimensions (Figure 3; averaged over all σ ). For D = 2 , the correct number of clusters is only detected in 0.25 to 0.3 of all cases. Then, it peaks with a detection rate close to 1 for D = 8 before decreasing and stabilizing at D = 64 and being constant thereafter. The trend is similar for all P, with small exceptions for P = 2 . However, the level of detection rate is smallest for P { 5 , 10 } , with the exception of D = 2 , where it is even slightly higher than in the central case.
Second, we report the results of the clustering itself in terms of (federated) fuzzy Davies–Boulding index and knowledge gap. Overall, we see that the results are mostly similar in the central case and in the federated scenarios for P { 2 , 5 , 10 } for either clustering method: The 0.25 , 0.5 , and 0.75 quantiles and the minimum values for both metrics are similar. However, the maximum value for the federated fuzzy Davies–Bouldin index shows some variation (Table 4 and Table 5). Similarly, the knowledge gap statistics are consistent, but not the same (Table 6 and Table 7). Hence, in some cases, FedFCM converges to different centers. As we will explain, the differences mostly occur due to sparsity. It is important to note that those are the cases where FedFCM did not find a good clustering (high knowledge gap and high FedFuzzDB) in either the central case or in the federated settings. Overall, we conclude that the clustering results on i.i.d. data are similar in the central case and with both federated clustering methods.
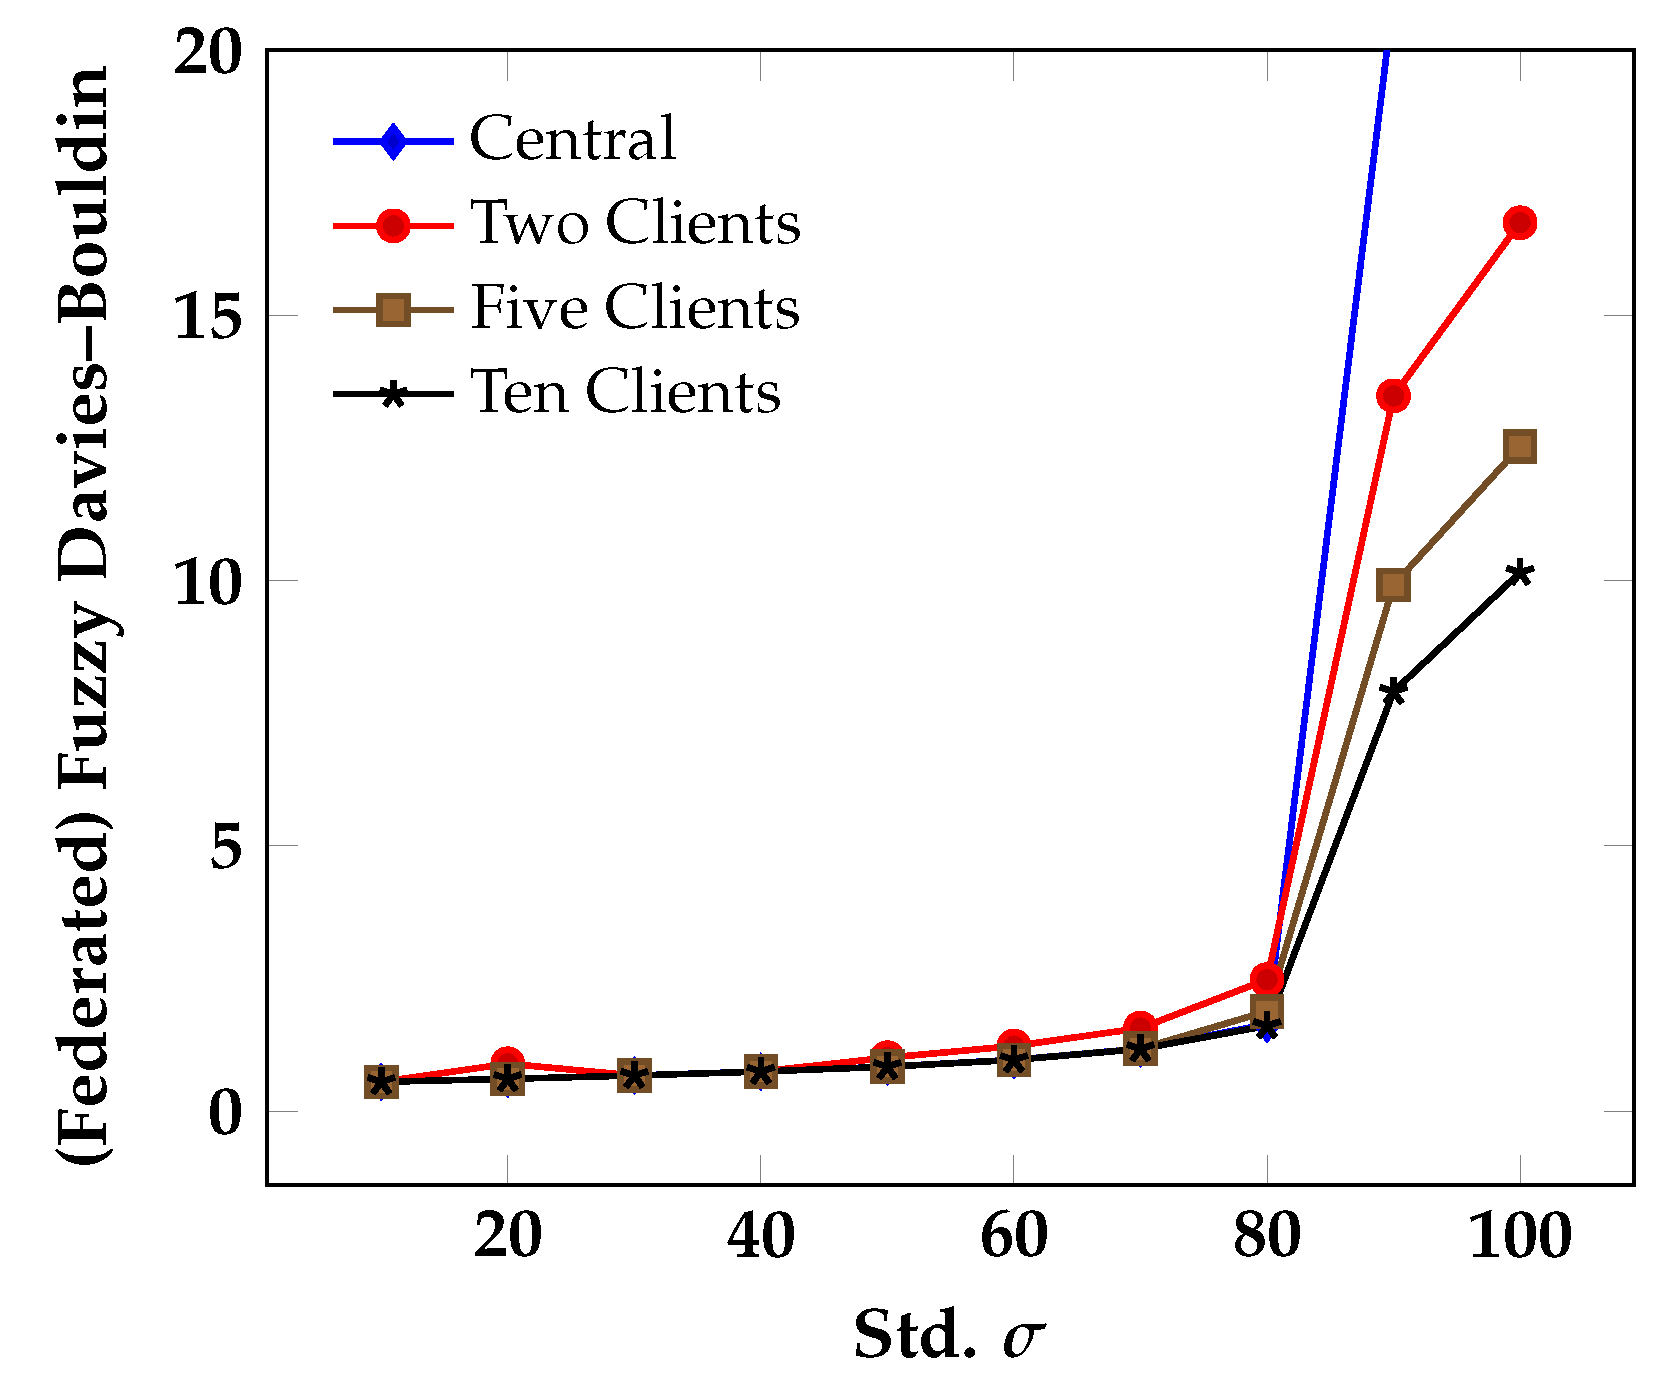
With this in mind, we enter the discussion of the results and offer an explanation for some of the observations. First, we want to understand why the cluster number detection rate is lower for higher values of σ . Recall that the Davies–Bouldin index is the ratio of “cluster spread” and “center closeness”. Hence, the index is high for clusters that naturally have a high spread, i.e., high σ as depicted in Figure 4 (while keeping the center distances fixed, as in our experiments). In such cases, the index could be reduced by introducing a new cluster, because the gain through the lower spread is relatively big. This behavior is intensified by the poor performance of fuzzy c-means on sparse data. In such cases, (local) fuzzy c-means centers (regardless of K) tend to converge to the center of mass of the whole dataset [30]. Hence, the global centers are also all close to the center of mass, and, thus, to each other. This leads to favoring a higher number of clusters. With fewer data points per client (i.e., more clients in our experiments), the data become even more sparse and the effect more severe. Overall, we attribute the lower detection rate to poor performance of FedFuzzDB and FedFCM in sparse spaces. Note that this is a shortcoming of the nonfederated equivalents as well. Second, we want to understand why the cluster number detection rate is so much lower in the two-dimensional case (Figure 3). As opposed to the high-dimensional case, in two dimensions, we are faced with a very dense space and a significant cluster overlap even for smaller values of σ . Through visual inspection, we found that in some cases it is even questionable whether there exist two clusters, because of the high overlap. Even though FedFCM identifies cluster centers correctly for K = 2 (small knowledge gap), the FedFuzzDB can be reduced by introducing more clusters because of the high spread, even for smaller values of σ . We attribute the low detection rate in the two-dimensional G2 sets to the FedFuzzDB index and its bias towards more clusters in data with high overlap. Again, the federated and nonfederated versions both suffer from this effect alike.
In summary, with our experiments, we show that the federated and nonfederated fuzzy Davies–Bouldin in interplay with the federated and nonfederated fuzzy c-means algorithms behave similarly in most tested situations. We tested the behavior on data with big cluster overlap (high value of σ in low-dimensional spaces) or sparsity. Sparsity was introduced through a big spread in high-dimensional spaces or an increased number of clients with a fixed dataset size. While generally reliable, the federated and nonfederated cluster algorithms struggle with extreme overlap or extreme sparsity. The federated and nonfederated indices favor a higher number of clusters in such situations. Overall, we see promising results and a good consistency between the federated and nonfederated settings.

3.2.3. Evaluation on Real-World Data

In the last two sections it was investigated how the framework behaves on artificial data with well-controlled properties. With this final experiment, we want to evaluate the framework on more real-world-inspired data and demonstrate how it could be used in practice. The data for this experiment were first introduced in [43] and can be accessed through the UCI machine learning repository (https://archive.ics.uci.edu/ml/datasets/Bank+Marketing, accessed on 27 March 2022) and are about customers of a bank. In particular, we are interested in the customers’ recorded job, age, balance, and education. Based on the job information, we split the data to create a federated setting. Each client has data of only one job group. For example, one client has all records of students, another has all data of retired persons and another has all records of managers, etc. In total, there are 11 job categories such that there are 11 clients in the federated setting. Based on the remaining columns (age, balance, education), we want to form groups of similar customers using (federated) fuzzy c-means following the framework introduced in Section 2.2.3: determine the number of global clusters, derive a soft partitioning of the data, and validate the clustering. For comparison, we also compute the partitioning on the full, but centralized, dataset as well as the local-only datasets. Before applying the framework, we preprocess the data: we translate education into numerical values (primary: 1, secondary: 2, tertiary: 3), roughly estimating the time spent in school/university, rows with unknown values are dropped, and each column is standardized to have zero mean and standard deviation of 1. In total, we are left with 43,193 rows in the dataset. Each client holds data of only one job group: job group “management” has 9216 examples, “technician” 7355, “entrepreneur” 1411, “retired” 2145, “admin” 5000, “services” 4004, “blue-collar” 9278, “self-employed” 1450, “unemployed” 1274, “housemaid” 1195, and “student” 775 examples.
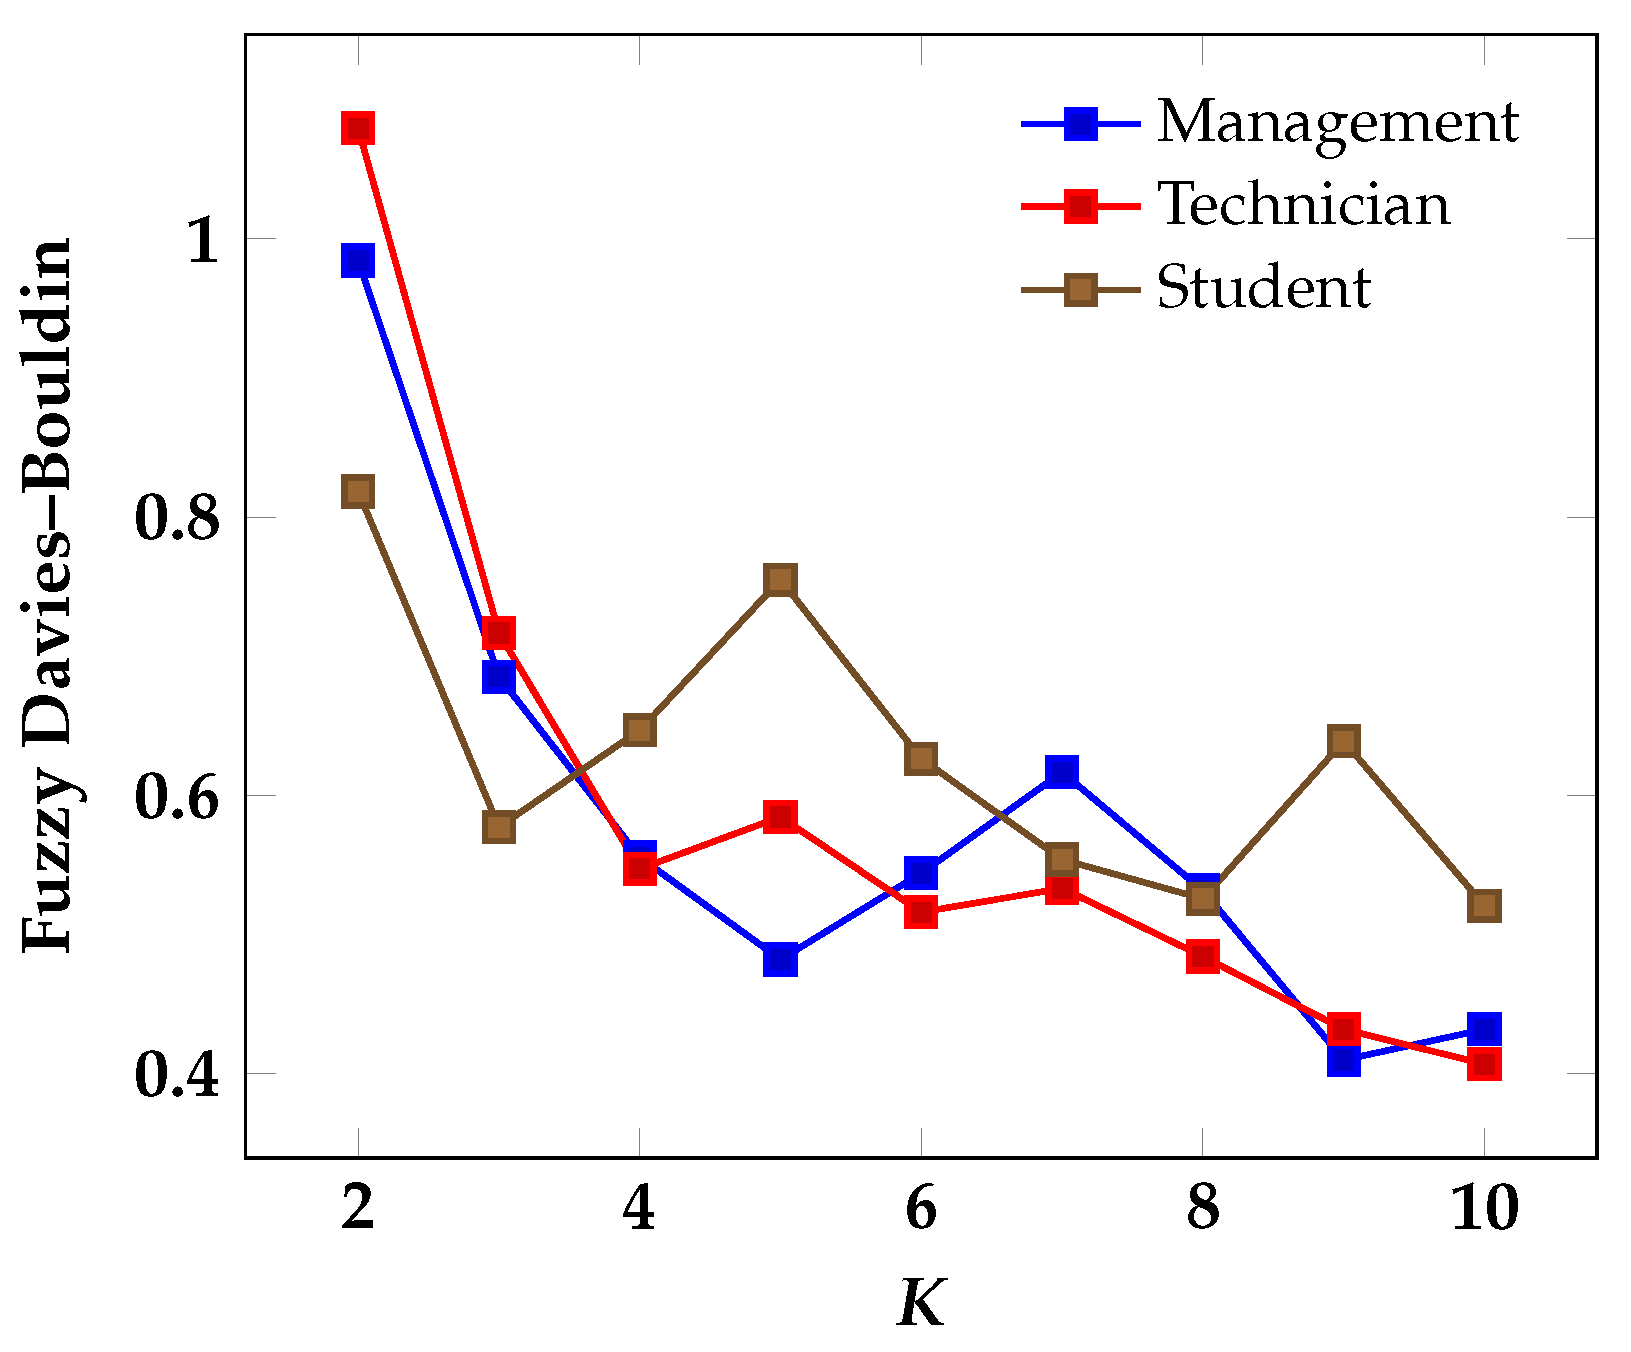
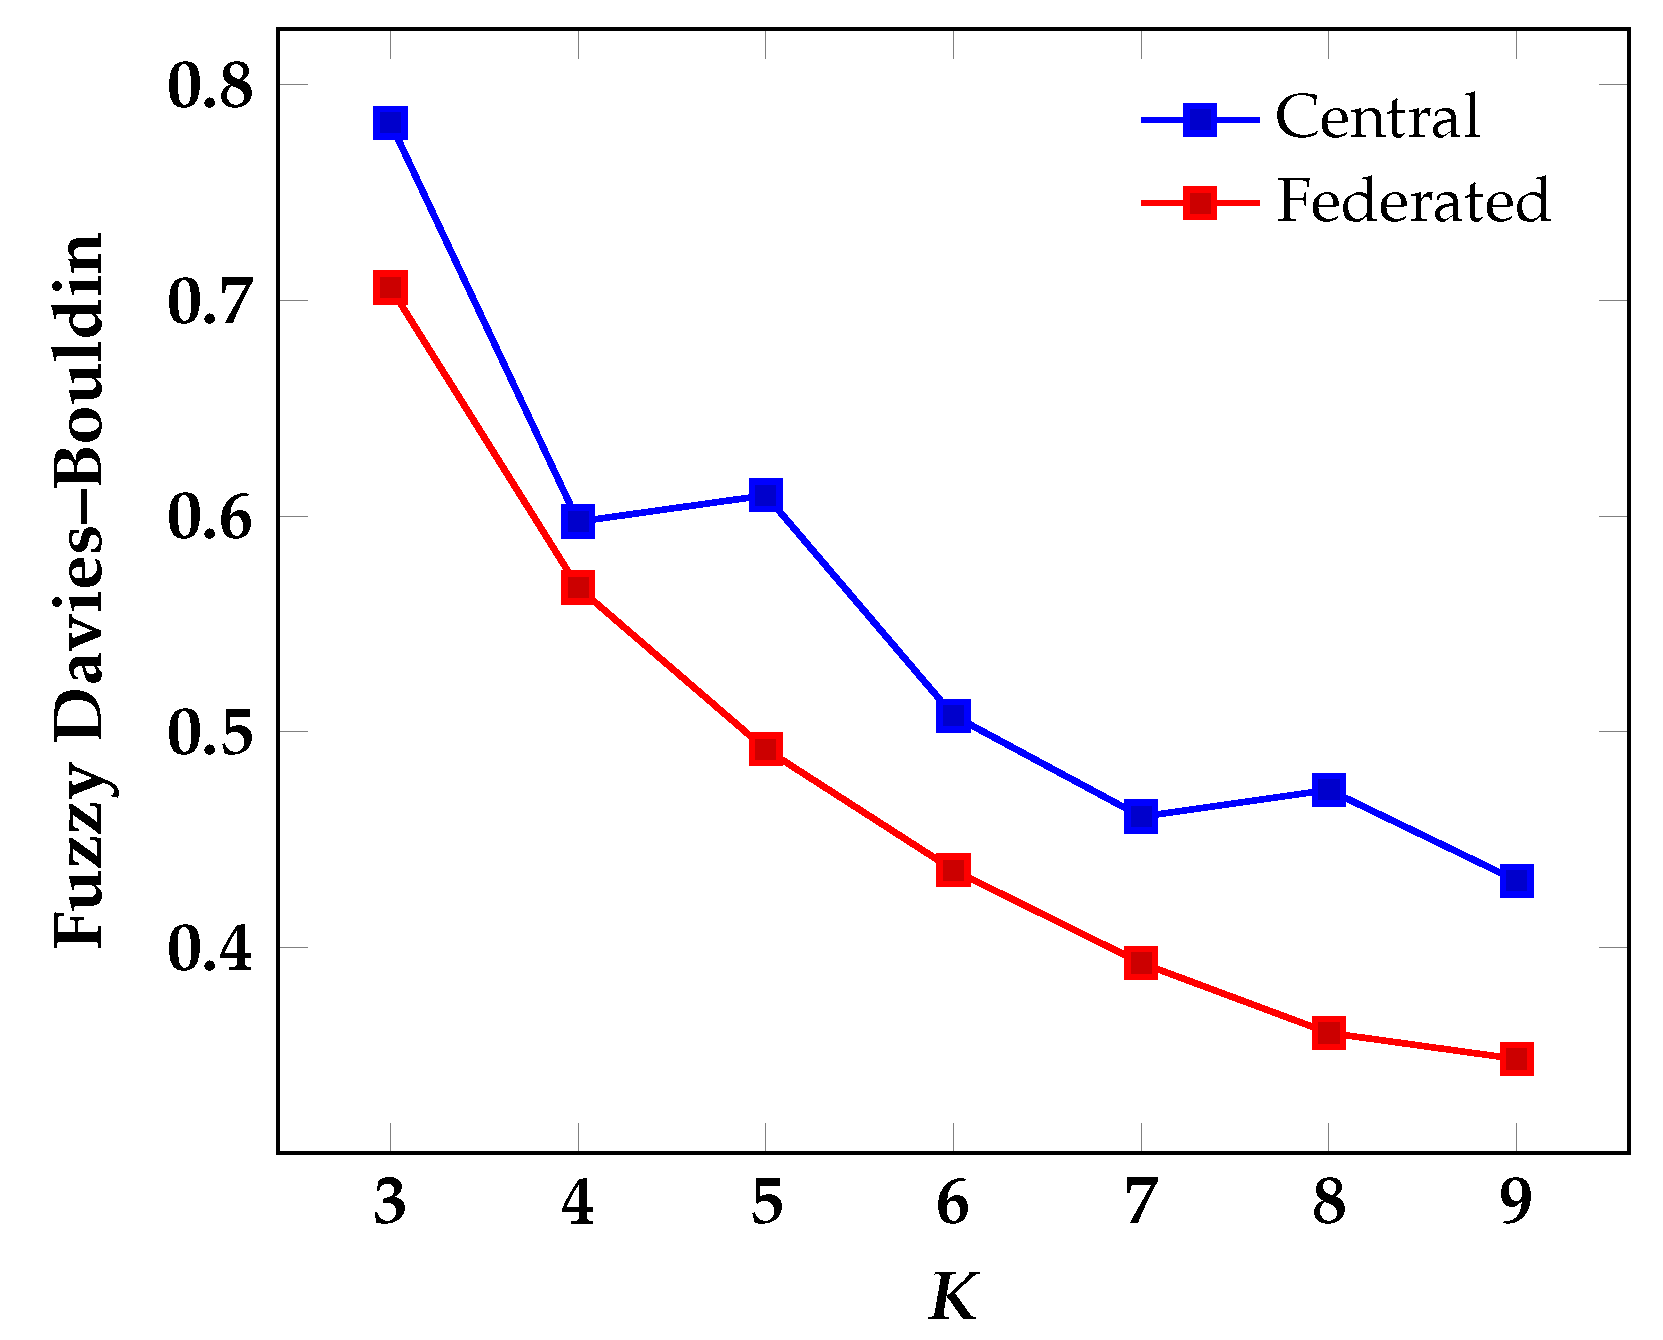
First, we need to determine the number of clusters by executing the first step of our framework. We set the minimum of clusters K m i n = 3 . Each client has at least 3 clusters in its local-only data. We draw that conclusion from calculating the (nonfederated) fuzzy Davies–Bouldin index and applying the elbow method (see Figure 5 for examples). The maximum number of clusters is set to K m a x = 9 , because it provides a buffer for the identification of forming clusters. One of the clients (entrepreneur) reports that it has six clusters and we choose K m a x = K m i n + max l K ( l ) = 9 according to our rule of thumb (Section 2.2.3). For each K [ K m i n , K m a x ] , the partitioning using the federated fuzzy c-means algorithm with k-means averaging and the FedFuzzDB index is calculated. The results can be found in Figure 6. The elbow method suggests the number of global clusters to be four, five, or six. Additionally, the figure contains the results of the same analysis in the nonfederated setting. Similarly, the method suggests that there are four or six in the centralized data, showing good consistency. As common in practice, the index only gives a good indication on the number of clusters and the practitioner is left to make the final call. Notably, the nonfederated and federated index values are not the same. Generally, the FedFuzzDB index is slightly lower than the nonfederated index. That implies that the federated method returns better centers (as measured by the Davies–Bouldin index) than its nonfederated counterpart.
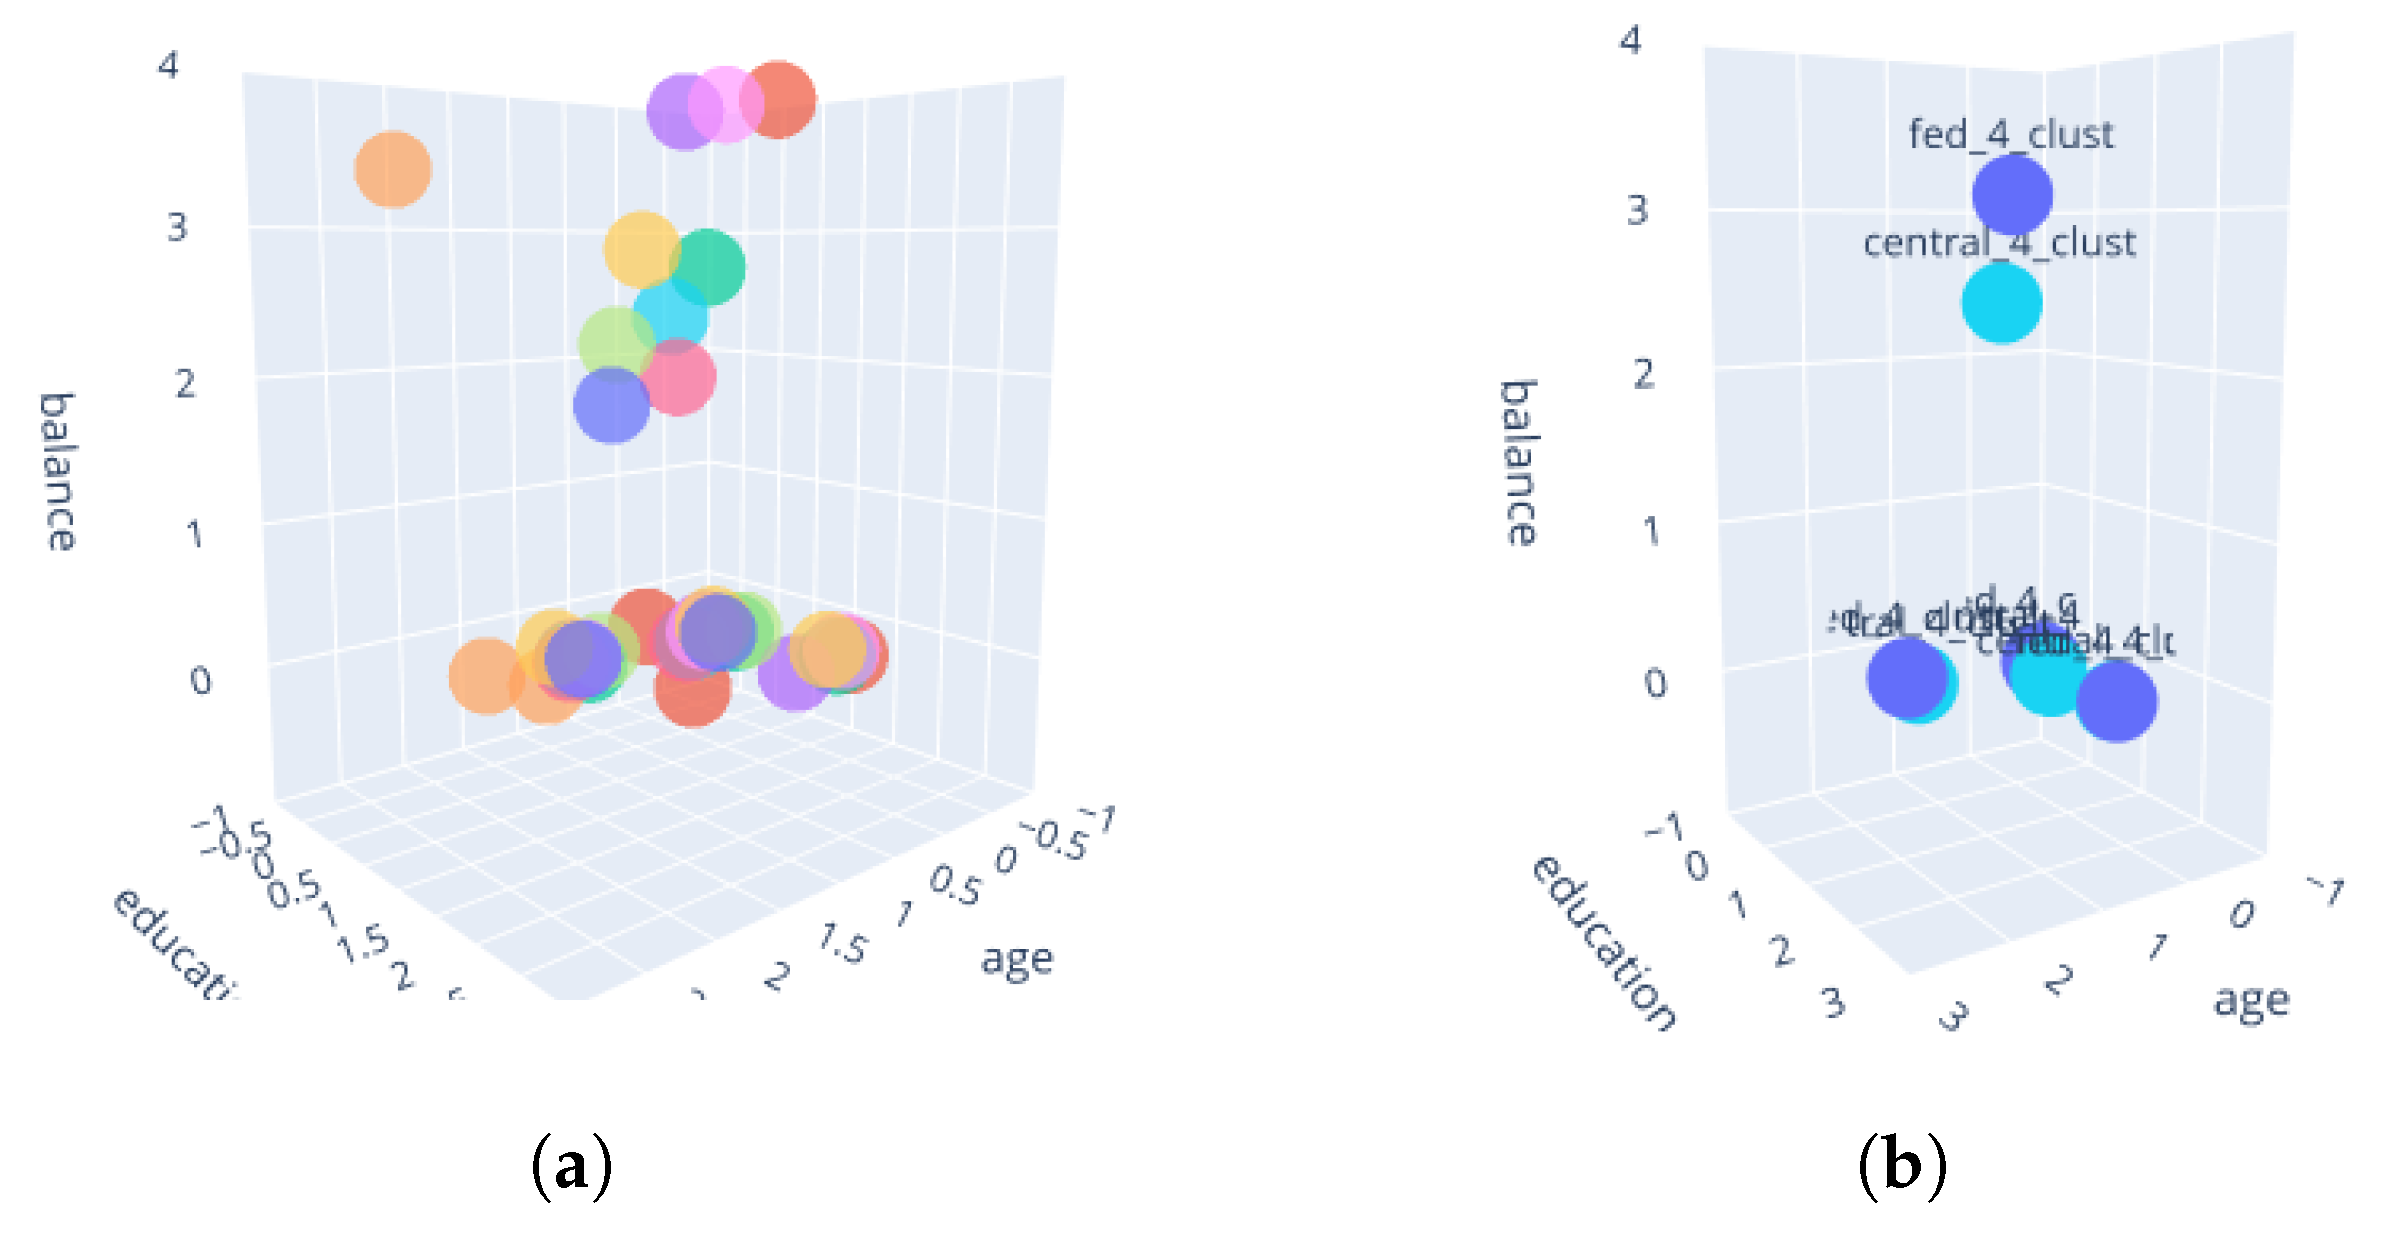
Second, we want to understand why the federated index is lower than the nonfederated index. Therefore, we compare the federated and nonfederated cluster centers for K = 4 . We note that three out of the four centers are almost identical. The three centers all have similar values in feature direction “balance” and are very different in the other dimensions “education” and “age”. Intuitively, this makes sense because the vast majority of data have relatively low balance, and the other dimensions are key discriminators. The fourth center is the center of wealthy customers (very high account balance) in the federated and the nonfederated settings. However, in the federated setting, the center has a higher value for “balance” ( 3.1 ) compared to the central clustering ( 2.4 ). For a visualization of the centers, please refer to Figure 7. Hence, the center is further from the other centers, which is is the reason for a lower FedFuzzDB index. In the central clustering case, the center does not move as far in the balance direction, because the mass of all points has a value close to zero. Recall that in fuzzy clustering all points are considered for the calculation of the center. Hence, many points (even though with low weight for further points) still have a noticeable effect. The key difference is that the federated clustering algorithm computes global centers based on the local cluster centers, which changes the relative importance in this case. To illustrate this, seven of 40 local-only cluster centers have a balance of >2.4, which is 15.9 % of all local-only cluster centers. In contrast, in the central dataset, only 3.9 % of all points have a balance of >2.4. This leads to higher cluster center dissimilarity M i j . The lower FedFuzzDB index lets us conclude that the effect on the spread (and, hence, the assignments u i j ) is small.
In summary, we demonstrate how our cluster analysis framework can be applied to gain insights from real-world datasets. We see that there is a good consistency between the federated and the nonfederated cluster results, and the federated algorithm produces even better results in terms of (federated) fuzzy Davies–Bouldin index.

4. Discussion

In this work, we introduce a federated clustering framework (Section 2.2) that solves three challenges: determine the number of global clusters in a federated dataset, obtain a global clustering via a federated fuzzy c-means algorithm (Section 2.2.1), and validate the clustering through a federated cluster validation metric (Section 2.2.2). To the best of our knowledge, there exists no other similar federated cluster analysis framework. Instead, previous works mostly focus on the clustering method itself. The lack does not stem from the lack of necessity, as we show with our motivational example (Section 1.1): There exist situations where global clusters remain hidden behind local clients’ optima.
The complete framework is evaluated through numerical experiments on different datasets (Section 3). We find that the framework identifies global cluster structures (correct number of clusters and data partitions) that are hidden in non-i.i.d. data (Section 3.2.1). We also find that the framework performs reliably if the data have certain properties, but fails if they do not (Section 3.2.2). In particular, it struggles with sparse data as well as with high cluster overlap. This is consistent with the equivalent nonfederated setting. In our last set of experiments, we outline how the framework can be applied in practice. It shows a good consistency with nonfederated clustering, and can even find better data partitions than in the centralized case (as measured by the Davies–Bouldin index).
Lastly, we see multiple interesting research directions for future works. One direction is to better understand the theoretical properties of the federated fuzzy c-means algorithm with k-means averaging. Moreover, the calculation of the federated fuzzy Davies–Bouldin index potentially creates a privacy risk. We suggest simple prevention mechanisms, but an in-depth analysis could lead to more sophisticated mechanisms. Furthermore, the cluster determination method still needs an initial range for the number of clusters, which can be hard to obtain. We provide a rule of thumb, but a better understanding of when and how federated clusters form could help to make this initial guess more accurate or even automate the choice. Moreover, FedFuzzDB can be extended to a federated crisp clustering or can be applied in combination with other clustering algorithms. Finally, the framework can be extended to include more steps in cluster analysis, such as federated preprocessing or feature selection.
Overall, we propose the first federated cluster validation metric, a new federated clustering approach based on existing works in the field, propose a comprehensive federated cluster analysis framework, and demonstrate how it can be applied. In comprehensive experiments, we observe promising results and identify shortcomings. Topics such as theoretical properties of the clustering algorithm and privacy evaluation of the framework have only been briefly discussed and can be addressed in more detail in future works.

Author Contributions

Conceptualization, methodology, validation, analysis: M.S. and A.W.; software: M.S.; writing—original draft preparation: M.S.; writing—review and editing: A.W.; visualization: M.S.; supervision: A.W. All authors have read and agreed to the published version of the manuscript.

Funding

This research received no external funding.

Institutional Review Board Statement

Not applicable.

Informed Consent Statement

Not applicable.

Data Availability Statement

The analyzed data can be retrieved from online repositories as referenced in the article. Online repositories are referenced in the paper.

Conflicts of Interest

The authors declare no conflict of interest.

References

  1. EU. Regulation (EU) 2016/679 of the European Parliament and of the Council of 27 April 2016 on the protection of natural persons with regard to the processing of personal data (...) (General Data Protection Regulation). Off. J. Eur. Union 2016, 119, 1–88. [Google Scholar]
  2. Kairouz, P.; McMahan, H.B. Advances and Open Problems in Federated Learning. Found. Trends® Mach. Learn. 2021, 14, 1–210. [Google Scholar] [CrossRef]
  3. Hard, A.; Rao, K.; Mathews, R.; Ramaswamy, S.; Beaufays, F.; Augenstein, S.; Eichner, H.; Kiddon, C.; Ramage, D. Federated learning for mobile keyboard prediction. arXiv 2018, arXiv:1811.03604. [Google Scholar]
  4. Ye, D.; Yu, R.; Pan, M.; Han, Z. Federated Learning in Vehicular Edge Computing: A Selective Model Aggregation Approach. IEEE Access 2020, 8, 23920–23935. [Google Scholar] [CrossRef]
  5. Deist, T.M.; Jochems, A.; van Soest, J.; Nalbantov, G.; Oberije, C.; Walsh, S.; Eble, M.; Bulens, P.; Coucke, P.; Dries, W.; et al. Infrastructure and distributed learning methodology for privacy-preserving multi-centric rapid learning health care: EuroCAT. Clin. Transl. Radiat. Oncol. 2017, 4, 24–31. [Google Scholar] [CrossRef] [Green Version]
  6. Brisimi, T.S.; Chen, R.; Mela, T.; Olshevsky, A.; Paschalidis, I.C.; Shi, W. Federated learning of predictive models from federated Electronic Health Records. Int. J. Med. Inform. 2018, 112, 59–67. [Google Scholar] [CrossRef]
  7. Grefen, P.; Ludwig, H.; Tata, S.; Dijkman, R.; Baracaldo, N.; Wilbik, A.; D’hondt, T. Complex collaborative physical process management: A position on the trinity of BPM, IoT and DA. In IFIP Advances in Information and Communication Technology, Proceedings of the Working Conference on Virtual Enterprises, Cardiff, UK, 17–19 September 2018; Springer: Cham, Switzerland, 2018; pp. 244–253. [Google Scholar]
  8. Duan, M.; Liu, D.; Chen, X.; Tan, Y.; Ren, J.; Qiao, L.; Liang, L. Astraea: Self-Balancing Federated Learning for Improving Classification Accuracy of Mobile Deep Learning Applications. In Proceedings of the 2019 IEEE 37th International Conference on Computer Design (ICCD), Abu Dhabi, United Arab Emirates, 17–20 November 2019; pp. 246–254. [Google Scholar] [CrossRef] [Green Version]
  9. Wang, X.; Han, Y.; Wang, C.; Zhao, Q.; Chen, X.; Chen, M. In-Edge AI: Intelligentizing Mobile Edge Computing, Caching and Communication by Federated Learning. IEEE Netw. 2019, 33, 156–165. [Google Scholar] [CrossRef] [Green Version]
  10. Yin, X.; Zhu, Y.; Hu, J. A Comprehensive Survey of Privacy-Preserving Federated Learning: A Taxonomy, Review, and Future Directions. ACM Comput. Surv. 2021, 54, 1–36. [Google Scholar] [CrossRef]
  11. Khan, L.U.; Saad, W.; Han, Z.; Hossain, E.; Hong, C.S. Federated Learning for Internet of Things: Recent Advances, Taxonomy, and Open Challenges. IEEE Commun. Surv. Tutor. 2021, 23, 1759–1799. [Google Scholar] [CrossRef]
  12. McLachlan, G. Cluster analysis and related techniques in medical research. Stat. Methods Med. Res. 1992, 1, 27–48. [Google Scholar] [CrossRef]
  13. Maione, C.; Nelson, D.R.; Barbosa, R.M. Research on social data by means of cluster analysis. Appl. Comput. Inform. 2019, 15, 153–162. [Google Scholar] [CrossRef]
  14. Bolin, J.H.; Edwards, J.M.; Finch, W.H.; Cassady, J.C. Applications of cluster analysis to the creation of perfectionism profiles: A comparison of two clustering approaches. Front. Psychol. 2014, 5, 343. [Google Scholar] [CrossRef] [PubMed] [Green Version]
  15. Ketchen, D.J.; Shook, C.L. The application of cluster analysis in strategic management research: An analysis and critique. Strateg. Manag. J. 1996, 17, 441–458. [Google Scholar] [CrossRef]
  16. Punj, G.; Stewart, D.W. Cluster analysis in marketing research: Review and suggestions for application. J. Mark. Res. 1983, 20, 134–148. [Google Scholar] [CrossRef]
  17. Hudson, S.; Ritchie, B. Understanding the domestic market using cluster analysis: A case study of the marketing efforts of Travel Alberta. J. Vacat. Mark. 2002, 8, 263–276. [Google Scholar] [CrossRef]
  18. Milligan, G.W.; Cooper, M.C. Methodology review: Clustering methods. Appl. Psychol. Meas. 1987, 11, 329–354. [Google Scholar] [CrossRef] [Green Version]
  19. Kumar, H.H.; Karthik, V.R.; Nair, M.K. Federated K-Means Clustering: A Novel Edge AI Based Approach for Privacy Preservation. In Proceedings of the 2020 IEEE International Conference on Cloud Computing in Emerging Markets (CCEM), Bengaluru, India, 6–7 November 2020; pp. 52–56. [Google Scholar] [CrossRef]
  20. Pedrycz, W. Federated FCM: Clustering Under Privacy Requirements. IEEE Trans. Fuzzy Syst. 2022, 30, 3384–3388. [Google Scholar] [CrossRef]
  21. Bárcena, J.L.C.; Marcelloni, F.; Renda, A.; Bechini, A.; Ducange, P. A Federated Fuzzy c-means Clustering Algorithm. In Proceedings of the International Workshop on Fuzzy Logic and Applications (WILF 2021), Vietri sul Mare, Italy, 20–22 December 2021. [Google Scholar]
  22. Dennis, D.K.; Li, T.; Smith, V. Heterogeneity for the Win: One-Shot Federated Clustering. In Proceedings of the 38th International Conference on Machine Learning, PMLR 2021, Virtual, 18–24 July 2021; Meila, M., Zhang, T., Eds.; 2021; Volume 139, pp. 2611–2620. [Google Scholar]
  23. Hastie, T.; Tibshirani, R.; Friedman, J. The Elements of Statistical Learning—Data Mining, Inference and Prediction; Springer: New York, NY, USA, 2017. [Google Scholar]
  24. Arthur, D.; Vassilvitskii, S. K-Means++: The Advantages of Careful Seeding. In Proceedings of the Eighteenth Annual ACM-SIAM Symposium on Discrete Algorithms; Society for Industrial and Applied Mathematics, SODA ’07, New Orleans, LA, USA, 7–9 January 2007; pp. 1027–1035. [Google Scholar]
  25. Pedregosa, F.; Varoquaux, G.; Gramfort, A.; Michel, V.; Thirion, B.; Grisel, O.; Blondel, M.; Prettenhofer, P.; Weiss, R.; Dubourg, V.; et al. Scikit-learn: Machine Learning in Python. J. Mach. Learn. Res. 2011, 12, 2825–2830. [Google Scholar]
  26. Bezdek, J.C.; Ehrlich, R.; Full, W. FCM: The fuzzy c-means clustering algorithm. Comput. Geosci. 1984, 10, 191–203. [Google Scholar] [CrossRef]
  27. Kolen, J.; Hutcheson, T. Reducing the time complexity of the fuzzy c-means algorithm. IEEE Trans. Fuzzy Syst. 2002, 10, 263–267. [Google Scholar] [CrossRef]
  28. Suganya, R.; Shanthi, R. Fuzzy C- Means Algorithm—A Review. Int. J. Sci. Res. Publ. 2012, 2, 1–3. [Google Scholar]
  29. Steinbach, M.; Ertöz, L.; Kumar, V. The challenges of clustering high dimensional data. In New Directions in Statistical Physics; Springer: Berlin/Heidelberg, Germany, 2004; pp. 273–309. [Google Scholar]
  30. Winkler, R.; Klawonn, F.; Kruse, R. Fuzzy C-Means in High Dimensional Spaces. Int. J. Fuzzy Syst. Appl. 2011, 1, 1–16. [Google Scholar] [CrossRef]
  31. Davies, D.; Bouldin, D. A Cluster Separation Measure. IEEE Trans. Pattern Anal. Mach. Intell. 1979, PAMI-1, 224–227. [Google Scholar] [CrossRef]
  32. Vergani, A.A.; Binaghi, E. A Soft Davies–Bouldin Separation Measure. In Proceedings of the 2018 IEEE International Conference on Fuzzy Systems (FUZZ-IEEE), Rio de Janeiro, Brazil, 8–13 July 2018; pp. 1–8. [Google Scholar] [CrossRef]
  33. Ghosh, A.; Chung, J.; Yin, D.; Ramchandran, K. An Efficient Framework for Clustered Federated Learning. In Advances in Neural Information Processing Systems; Larochelle, H., Ranzato, M., Hadsell, R., Balcan, M.F., Lin, H., Eds.; Curran Associates, Inc.: Red Hook, NY, USA, 2020; Volume 33, pp. 19586–19597. [Google Scholar]
  34. Sattler, F.; Muller, K.R.; Samek, W. Clustered Federated Learning: Model-Agnostic Distributed Multitask Optimization Under Privacy Constraints. IEEE Trans. Neural Netw. Learn. Syst. 2021, 32, 3710–3722. [Google Scholar] [CrossRef]
  35. Kim, Y.; Hakim, E.A.; Haraldson, J.; Eriksson, H.; da Silva, J.M.B.; Fischione, C. Dynamic Clustering in Federated Learning. In Proceedings of the ICC 2021—IEEE International Conference on Communications, Montreal, QC, Canada, 14–23 June 2021; pp. 1–6. [Google Scholar] [CrossRef]
  36. Xie, M.; Long, G.; Shen, T.; Zhou, T.; Wang, X.; Jiang, J.; Zhang, C. Multi-center federated learning. arXiv 2021, arXiv:2108.08647. [Google Scholar]
  37. Stallmann, M.; Wilbik, A. Towards Federated Clustering: A Federated Fuzzy c-Means Algorithm (FFCM). In Proceedings of the International Workshop on Trustable, Verifiable and Auditable Federated Learning in Conjunction with AAAI 2022 (FL-AAAI-22), Vancouver, BC, Canada, 1 March 2022. [Google Scholar]
  38. McMahan, B.; Moore, E.; Ramage, D.; Hampson, S.; y Arcas, B.A. Communication-efficient learning of deep networks from decentralized data. In Proceedings of the Artificial Intelligence and Statistics, PMLR, Fort Lauderdale, FL, USA, 20–22 April 2017; pp. 1273–1282. [Google Scholar]
  39. Bholowalia, P.; Kumar, A. EBK-means: A clustering technique based on elbow method and k-means in WSN. Int. J. Comput. Appl. 2014, 105, 17–24. [Google Scholar]
  40. Milligan, G.W.; Cooper, M.C. An examination of procedures for determining the number of clusters in a data set. Psychometrika 1985, 50, 159–179. [Google Scholar] [CrossRef]
  41. Fränti, P.; Sieranoja, S. Clustering Basic Benchmark. 2018. Available online: http://cs.uef.fi/sipu/datasets/ (accessed on 27 March 2022).
  42. Mariescu-Istodor, P.F.R.; Zhong, C. XNN graph. LNCS 2016, 10029, 207–217. [Google Scholar]
  43. Moro, S.; Cortez, P.; Rita, P. A data-driven approach to predict the success of bank telemarketing. Decis. Support Syst. 2014, 62, 22–31. [Google Scholar] [CrossRef]
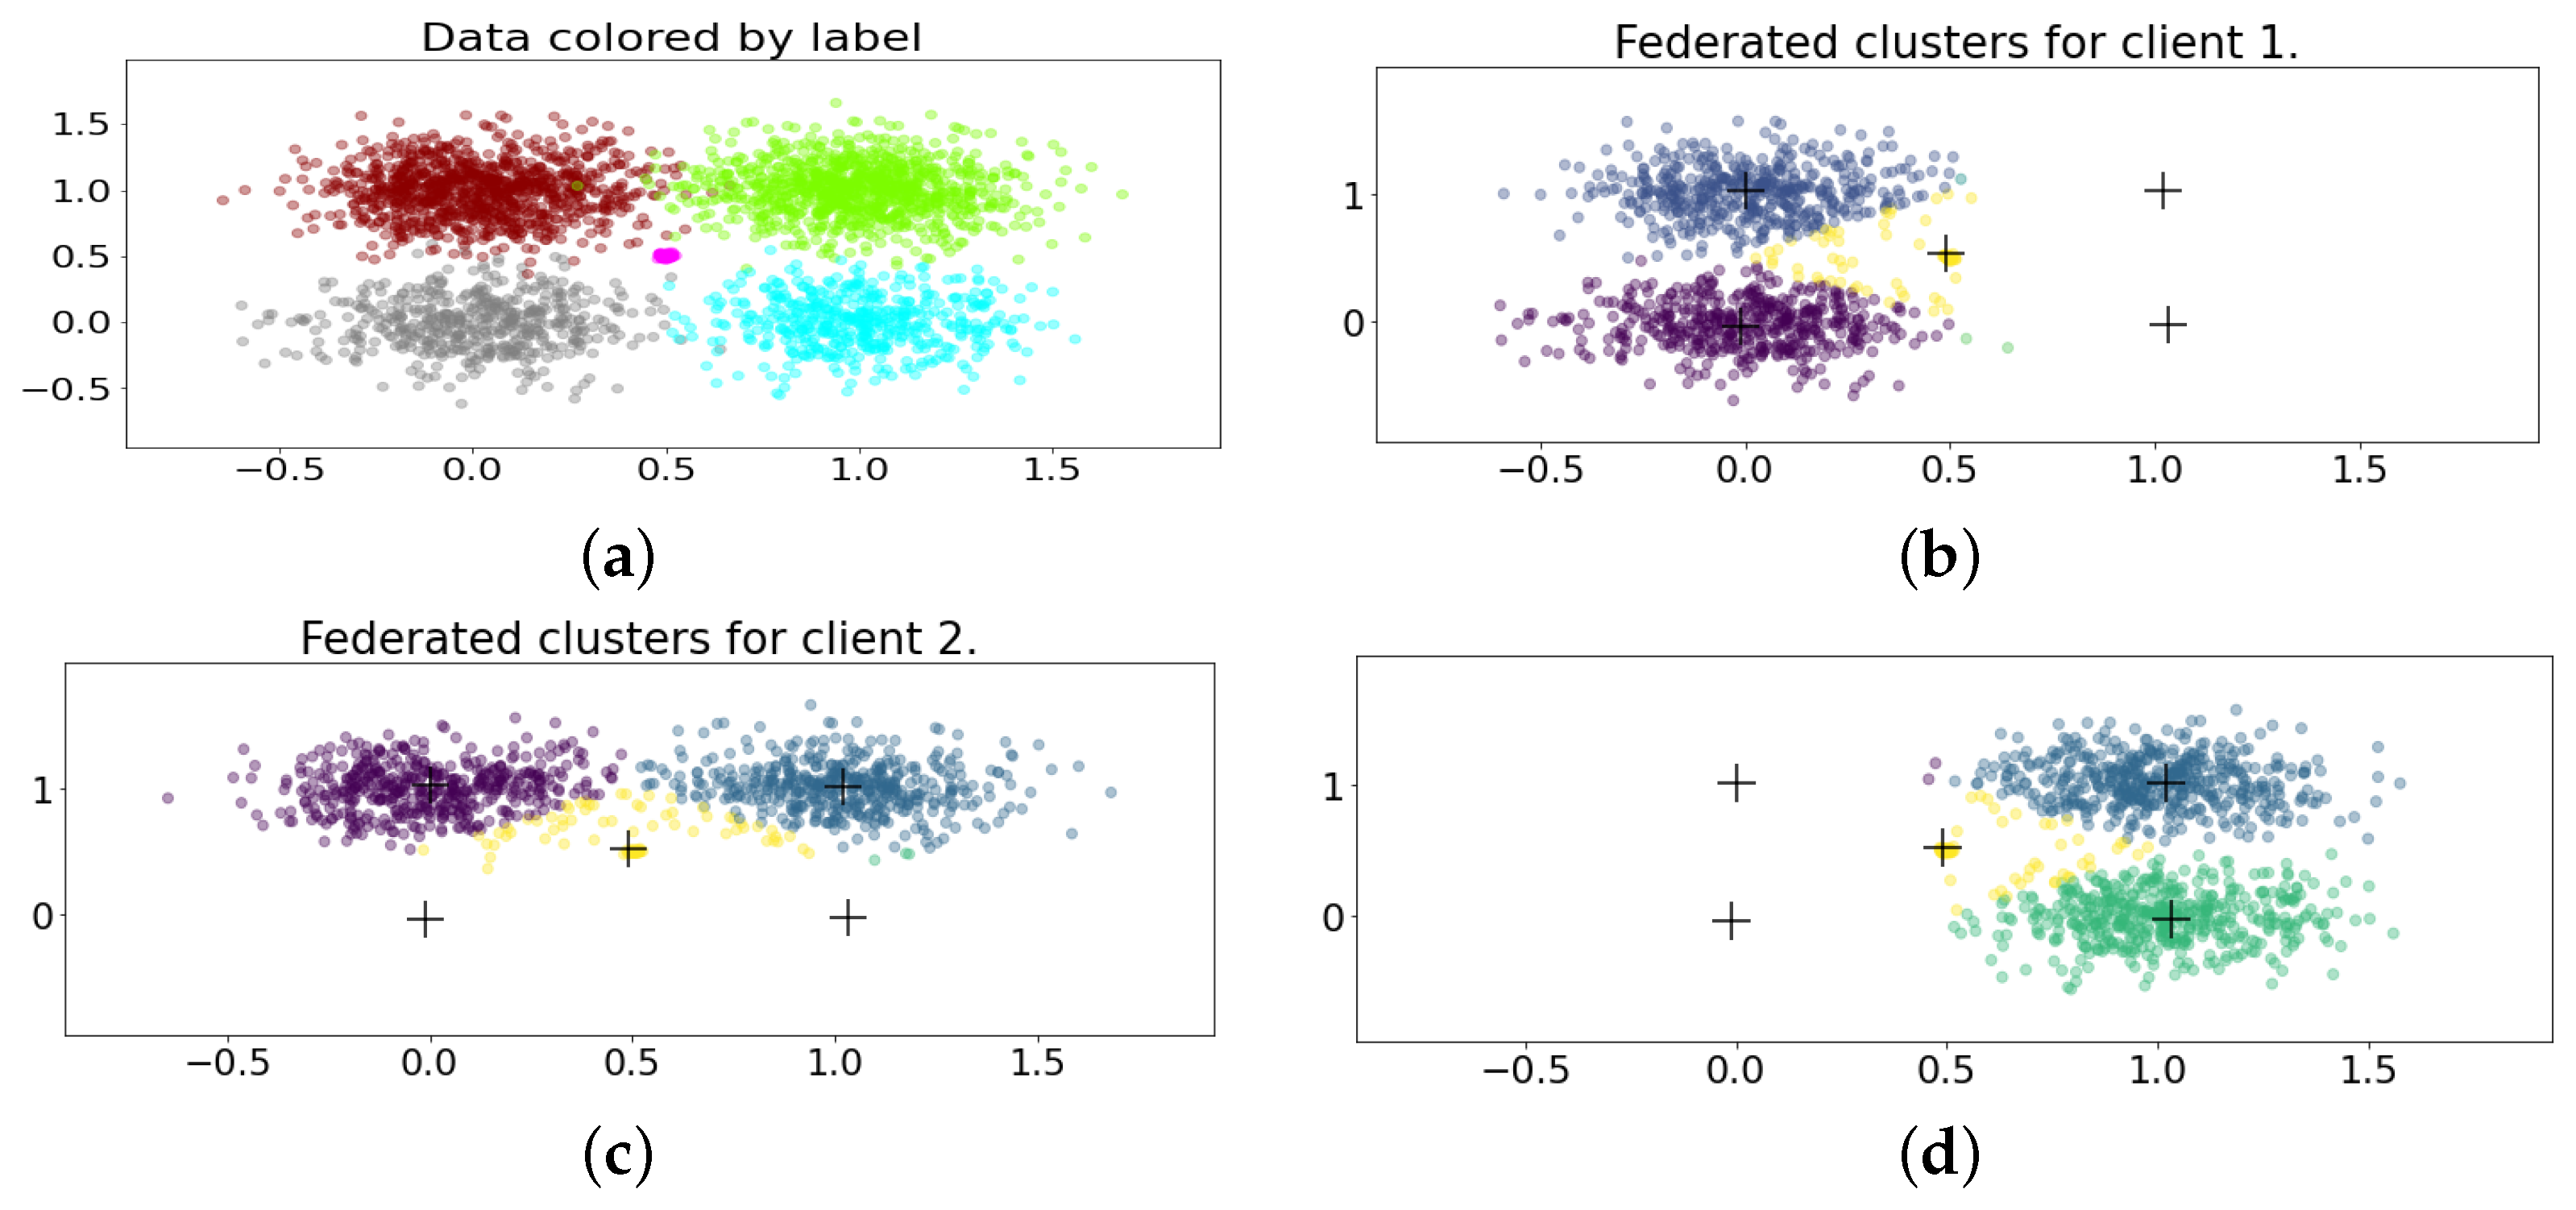
Figure 1. Motivational example. (a) The centralized dataset. Colors correspond to ground truth partitions. (bd) The distributed dataset. Crosses denote the clustering result of the federated clustering framework. Original cluster centers are recovered even though no client alone was able to do so.
Applsci 12 10455 g001
Figure 2. Correct number of cluster guesses on all 100 G2 sets per standard deviation σ . The values are averaged over all dimensions and runs. We observe a decline of correct number of cluster guesses with increasing σ . The figure shows results of the k-means averaging, but they are similar with federated averaging.
Applsci 12 10455 g002
Figure 3. Correct number of cluster guesses on all 100 G2 sets per dimension. The values are averaged over all values of σ and runs. We observe few correct guesses in the two dimensional case, a peak for D = 8 , then a decline that stabilizes after D = 64 . The overall trend is similar for all number of clients. The figure shows results of the k-means averaging, but they are similar with federated averaging.
Applsci 12 10455 g003
Figure 4. The federated Davies–Bouldin index on 100 G2 sets per standard deviation σ . The values are averaged over all values of D and runs. As expected, we see an increasing index with higher σ . However, the index suggests that it is hard to find good clusterings with FedFCM for σ 80 . The values outside this plot are 434.4732 and 2463.9748 (central).
Applsci 12 10455 g004
Figure 5. Local-only Davies–Bouldin index for different (but not all) clients. According to the index and the elbow method, each client has a different number clusters locally (management, K = 5 ; technician, K = 4 ; student, K = 3 ).
Applsci 12 10455 g005
Figure 6. Federated fuzzy Davies–Bouldin index for different number of clusters.
Applsci 12 10455 g006
Figure 7. (a) Local-only clustering results for K = 4 of the clients in one plot. Each color corresponds to one client. (b) Federated and centralized cluster centers for K = 4 . The darker points are the federated cluster centers and the brighter points are the central cluster centers.
Applsci 12 10455 g007
Table 1. Local and federated clustering results on the motivational dataset with k-means averaging. The best result per experiment (column) is bold.
Fuzzy
Davies–
Bouldin
Central
(Nonfederated)
FederatedLocal
Client 1
Local
Client 2
Local
Client 3
K = 2 0.87070.81790.64260.64370.6381
K = 3 0.56870.60550.72890.69910.7704
K = 4 0.48690.49511.06371.07061.1248
K = 5 0.43480.42890.92600.89270.9496
K = 6 0.54400.6202
K = 7 0.67070.5072
K = 8 0.56800.6221
Table 2. Local and federated clustering results on the motivational dataset with federated averaging. The best result per experiment (column) is bold.
Fuzzy
Davies–
Bouldin
Central
(Nonfederated)
FederatedLocal
Client 1
Local
Client 2
Local
Client 3
K = 2 0.87071.00471.03560.86200.9685
K = 3 0.56870.91430.88800.83700.8647
K = 4 0.48691.16831.19240.92211.1662
K = 5 0.43482.91582.88672.41322.9538
K = 6 0.54401.5063
K = 7 0.67070.9248
K = 8 0.56801.2115
Table 3. Correct cluster guesses with different numbers of clients (DB index below 1.3 ).
CorrectCentralTwo ClientsFive ClientsTen Clients
k-means avg.92.9%91.4%88.0%87.2%
Federated avg. 90.4%89.5%88.9%
Table 4. Statistics of the (federated) fuzzy Davies–Bouldin index on 100 G2 test sets with k-means averaging.
Fuzzy Davies–
Bouldin ( K = 2 )
CentralTwo
Clients
Five
Clients
Ten
Clients
25%
Quantile
0.67620.67710.67660.6766
50%
Quantile
0.86400.86380.86270.8627
75%
Quantile
1.30921.30731.29611.2944
Minimum0.54600.54590.54590.5458
Maximum56,784.551857.691023.698720.0192
Table 5. Statistics of the (federated) fuzzy Davies–Bouldin index on 100 G2 test sets with federated averaging.
Fuzzy Davies–
Bouldin ( K = 2 )
CentralTwo
Clients
Five
Clients
Ten
Clients
25%
Quantile
0.67620.67670.67660.6766
50%
Quantile
0.86400.86270.86230.8620
75%
Quantile
1.30921.29971.29901.2934
Minimum0.54600.54600.54590.5459
Maximum56,784.5531,307.7654,809.429021.3485
Table 6. Statistics of the knowledge gap on the 100 G2 test sets with k-means averaging.
Knowledge
Gap ( K = 2 )
CentralTwo
Clients
Five
Clients
Ten
Clients
25%
Quantile
0.28500.27240.27000.2587
50%
Quantile
0.89040.88970.89000.8898
75%
Quantile
5.95445.92725.83355.4764
Minimum0.02860.02780.02650.0253
Maximum77.647277.54077.709276.0134
Table 7. Statistics of the knowledge gap on the 100 G2 test sets with federated averaging.
Knowledge
Gap ( K = 2 )
CentralTwo
Clients
Five
Clients
Ten
Clients
25%
Quantile
0.28500.27290.26930.2679
50%
Quantile
0.89040.88880.89020.8899
75%
Quantile
5.95445.54365.48885.4320
Minimum0.02860.02850.02830.0281
Maximum77.647277.647277.647277.6472
Publisher’s Note: MDPI stays neutral with regard to jurisdictional claims in published maps and institutional affiliations.