1. Introduction
Several authors, e.g., [
1] have mentioned that advanced digital technology is already used in industry, however with Industry 4.0, it will transform production into smarter automation in various ways via the installation of smart robots, sensors, using of collaborative robots and applying production simulations, etc. Nowadays, new applications are constantly appearing in which so-called machine vision (MV) systems based on processing images captured via at least one camera have found strong usage [
2]. As a result, their application can reduce total costs and make it possible to solve tasks that would not be possible without the use of such cognitive sensors.
Modern advanced sensing systems based on “smart camera sensors” have been quickly spread into many fields of industry, such as general process control [
3], general object identification and recognition, reading texts and codes, face recognition [
4], robot control via gestures and general pose control of robots using visual servoing [
5,
6], visual navigation of single/multiple mobile robot/-s, collision detection and perception [
7] and many others. Smart sensors are key elements for visual inspection or visual navigation tasks that have previously been undertaken manually by human operators.
The inclusion of large datasets is often necessary by virtue of the nature of cognitive sensory systems. Proper simulation can be utilized with both real pictures as well as synthetic images to minimize any negative effects of processing such extensive datasets [
8]. Due to the nature of the processed data, such systems must be able to learn and “understand” the scene in the real world, so they are often closely related to different approaches of artificial intelligence, since they show better results for some specific tasks [
4]. In areas whereby in particular common approaches to data processing principles are reaching their limits and would not be possible to solve with the use of common approaches and methods of programming, such procedures are very successful.
Artificial intelligence finds its application in the areas of processing of various types of signals, large amounts of data and also in the processing and evaluation of image data. The reason for this is mainly the ability to react flexibly to changing conditions and thus, in a certain way, to approximate the human like decision-making ability. Within artificial intelligence, we distinguish a large number of algorithms and principles of operation of individual approaches, such as machine learning and its subgroups, e.g., deep learning. Their most striking advantages are especially visible in areas where a huge amount of data needs to be processed. This can be paradoxically considered as an advantage for such systems due to the need for a large amount of data in order to learn more accurately and the subsequent improvement of system decision-making capabilities [
9]. The use of deep learning is in areas such as automatic text translation and generation, colorization of black and white images, automatic driving tasks for various autonomous vehicle systems, online self-service solutions, classifying images of various types, robot control and so on.
Due to the aforementioned properties of deep learning, its use proves to be very suitable also in the field of visual inspection of products. Visual inspection is one of the basic and fastest methods of non-destructive quality evaluation of products and testing of materials, and due to its simplicity, it is usually performed as a first method for testing [
7,
10]. The basic type is direct visual inspection, where the surface is examined either with the naked eye only or with the help of a magnifying glass. Indirect visual inspection can be used for elements and places with complicated access if needed. In both basic ways, the person evaluates the image and then evaluates the result of the inspection using subjective opinion. Due to the disadvantages of such an inspection, which are monotony and the subjective evaluation of the results is an attempt to automate these processes [
11,
12]. In various fields, the common approaches to evaluating the acquired image is sufficient, e.g., comparing reference images with inspected ones [
13], searching for elements using the speeded-up robust features method, and many others. However, the aim of this research is to automate the areas of visual inspection, in which the searched elements occur randomly, and have different shape, dimensions, colour and location. In such cases, the use of artificial intelligence and, in particular, neural networks seems to be a promising solution as a replacement for human decision-making ability.
The deep learning method is widely used, mainly for analysing obtained 2D visual data [
14,
15], both X-ray and shearography. Both of these methods offer a means of obtaining data from surface or internal structures of inspected material. In the case of shearography, it is possible to find defects on the surface or bubbles below the surface [
16,
17]. Radiography is an appropriate method for detection defects inside the material different to rubber for instances metallic belts, bead wire etc. [
18,
19,
20,
21]. Every mentioned method has own advantages and disadvantages. Visual inspection based on cameras has advantages in simple using and low price requirements in comparative to radiography. The disadvantage lies in the impossibility to detect defects in the internal structure of a tire such as metallic belts.
This paper proposes an efficient defect detection method suitable for tire quality assurance, which takes advantage of the feature similarity of tire images to capture the anomalies. The condition of car tires appears to be one of the important factors determining the occurrence of accidents so the tire quality can be considered crucial for safety in transport systems. Therefore, several authors [
22,
23] are focusing on evaluation and testing of tires, their mechanical properties or pressure distribution in the tire-ground contact patch via the camera system. However, they do not focus on production inaccuracies, surface quality or other kinds of defect. Automatic defect detection is an important and challenging problem in industrial quality inspection. Therefore, we looked for studies focusing on inspection systems in different areas as well, e.g., [
14,
24,
25].
2. Materials and Methods
2.1. Inspected Object
The aim of the ongoing research at the Department of Automation and Production Systems is to find the optimal method for visual inspection of objects with a surface that is complicated to properly illuminate and then scan. One work from the department is described in [
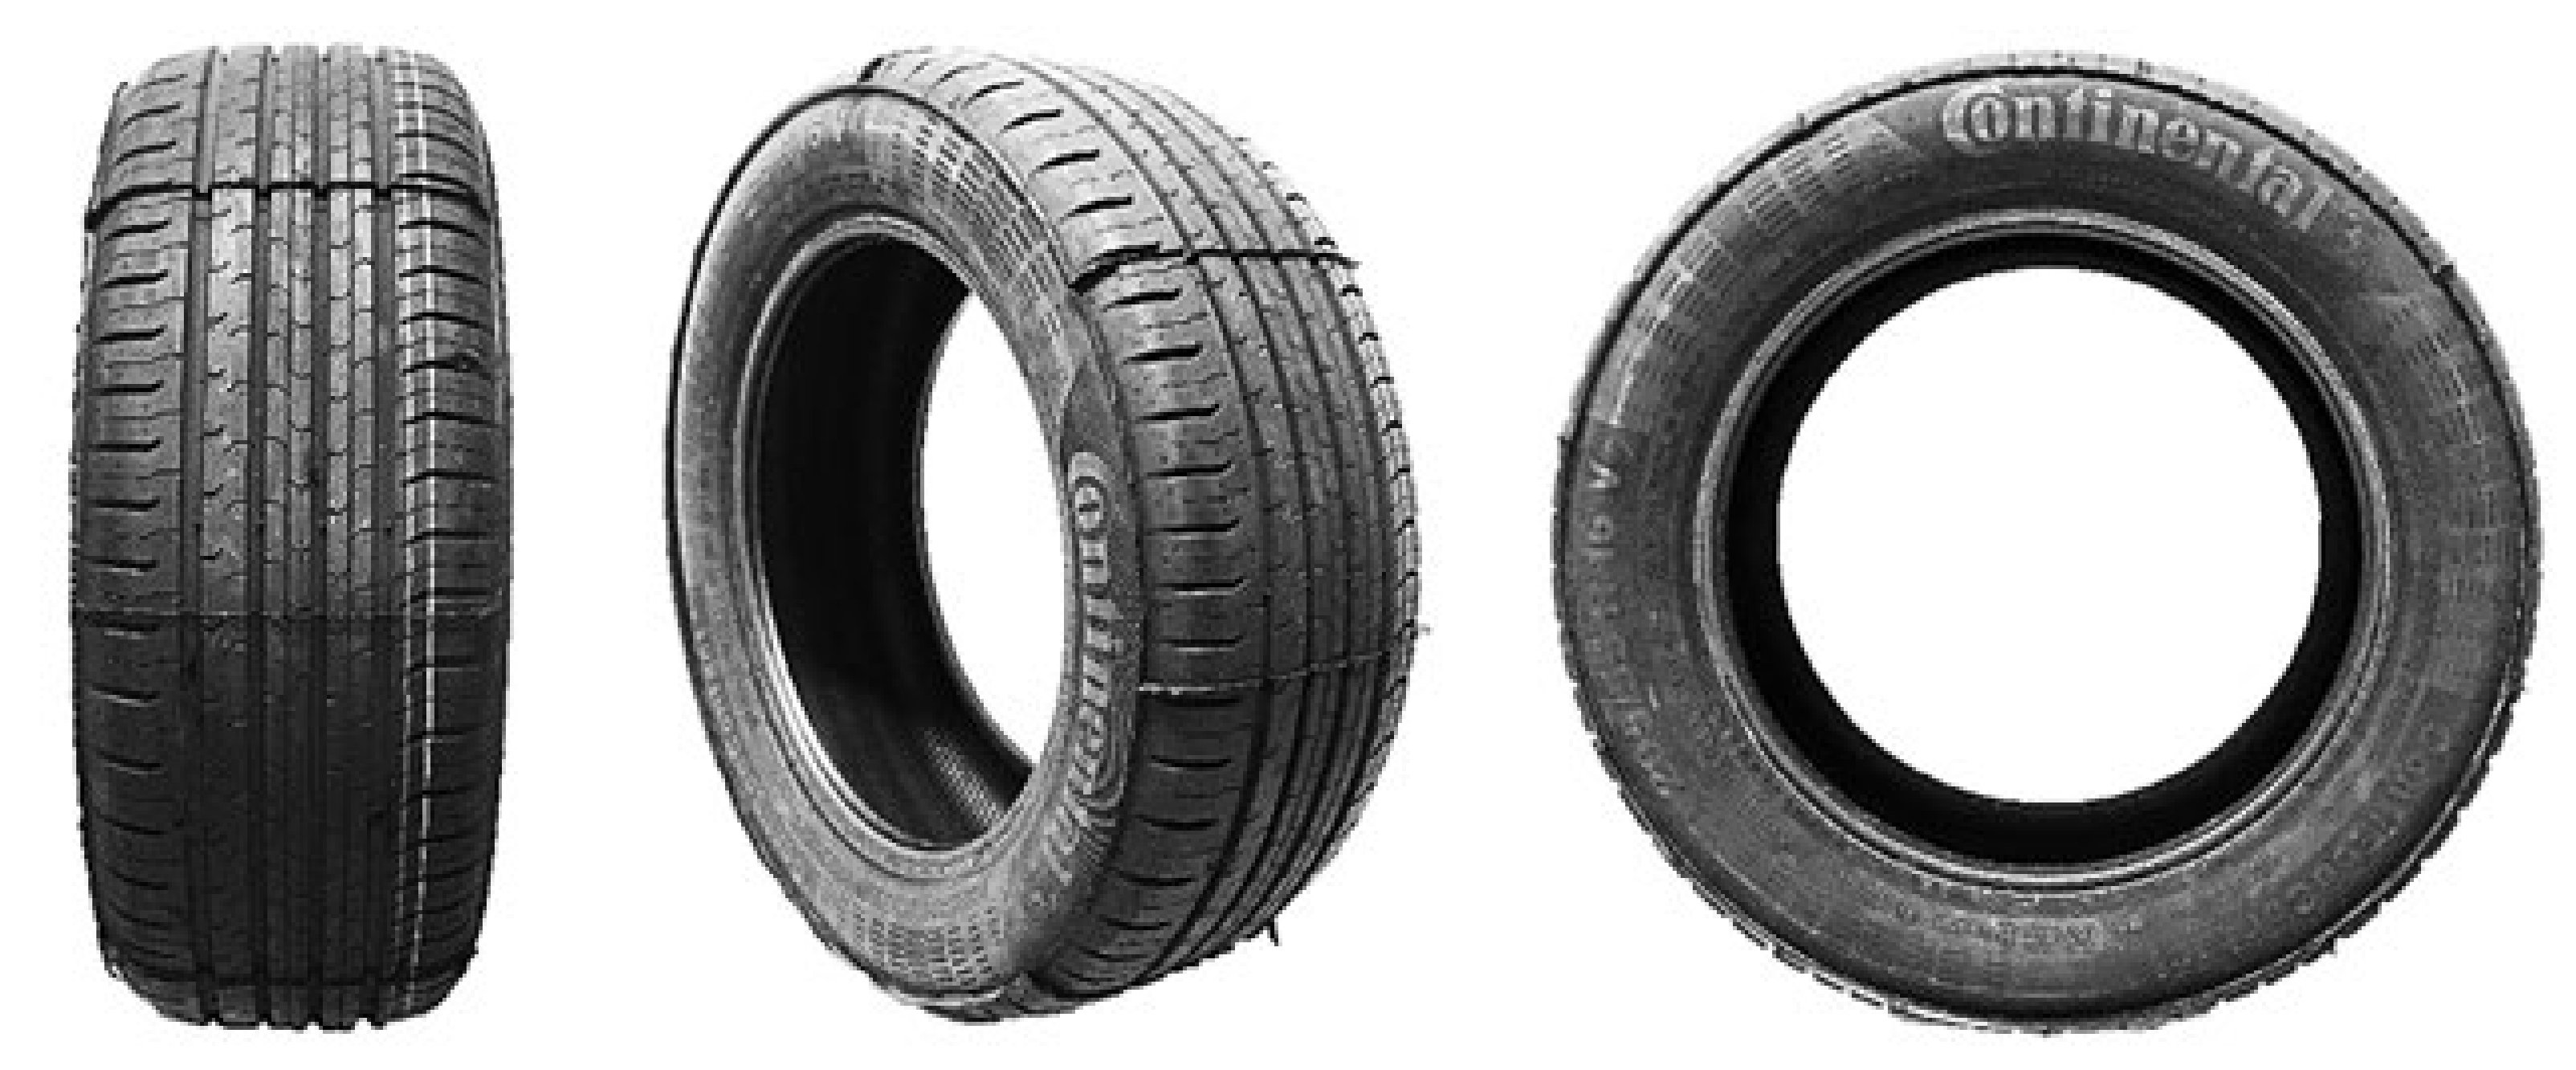
26]. In order to design a methodology for automated visual inspection of objects with specific properties, the selected test object was an automobile tire displayed in
Figure 1. The main reason was the demand from industry for solving the situation in real operation and the fact that the elements on dark and matte objects in practice prove to be very difficult to detect. Other reasons were the complexity of the object, the occurrence of texts of various fonts, special characters and repeating elements, which are prerequisites for successful verification of the hypothesis associated with the elaborated task.
Any car tire is generally manufactured out of a mixture of natural rubber (several types) with acids, artificial rubber made of polymers and additives. The tire undergoes a thermoforming process and subsequent vulcanization, in which the aforementioned additives determine the properties of the final product. The surface of the entire product is matte and black after production, which affects the difficulty of its lighting during the image acquisition in order to achieve optimal results.
The inspected object—a car tire—is composed of two basic parts (in terms of functionality and position in the tire body), the tread and the sidewall, and several additional parts. The tread is a key component of every tire in terms of functionality, as it is in contact with the road and, therefore, determines its main performance characteristics such as traction, rolling resistance, fuel consumption, external noise, etc. [
22]. The second important part is the sidewall, which is characterized by specific properties and a reference surface, i.e., an area where manufacturers place a description/basic identification parameters of a specific tire:
Other additional tire parts include the rim protector, bead wire, bead contour and filler, polyester casing, steel belts, cap ply and inner liner. Each part fulfills a specific function, has a specific shape and is made of specific material. From the point of view of quality evaluation and pattern of the surface, mainly the outer surfaces are interesting—tread (significant pattern defined by adhesion to the ground surface), sidewall (pattern defined by other driving characteristics, aesthetic design requirements and legislative requirements, e.g., tire data) and inner liner (determined by production technology and mechanical properties of the tire) or rim protector (surface smoothness due to tightness). All of these surfaces can be inspected; however, from the point of view of visual inspection, the sidewall and tread are the most important. Every difference in pattern on that surface can be highlighted and then the inspection system supposes defects with a high level of confidence [
23].
Inspections of sidewall defects on a tire is a perspective for evaluating the system, since specific and different patterns occur. Thus, a texture has to be classified as a correct pattern. Every defect could be appearing on a tire, requiring them to be found by the inspection system. Correct patterns relative to defects are possible to determine. This assumption is based on [
16,
17,
18] in which is it possible to find defects in colorized images with high variance of colours [
24,
25]. Inspection of defects on a tire, where the essential colour is black, which are displayed on captured images from a vision system like shades of grey, impose specific conditions. This characteristic requires a specific set up based on an appropriate lighting system. The main aim is to adapt the lighting system to highlight edges defined by texture in the form of describing the tire and uneven small parts of the area.
Inspection systems have to adapt to search of specific defects. In the case of production, it is necessary to define mainly types defects that possibly occur on final products [
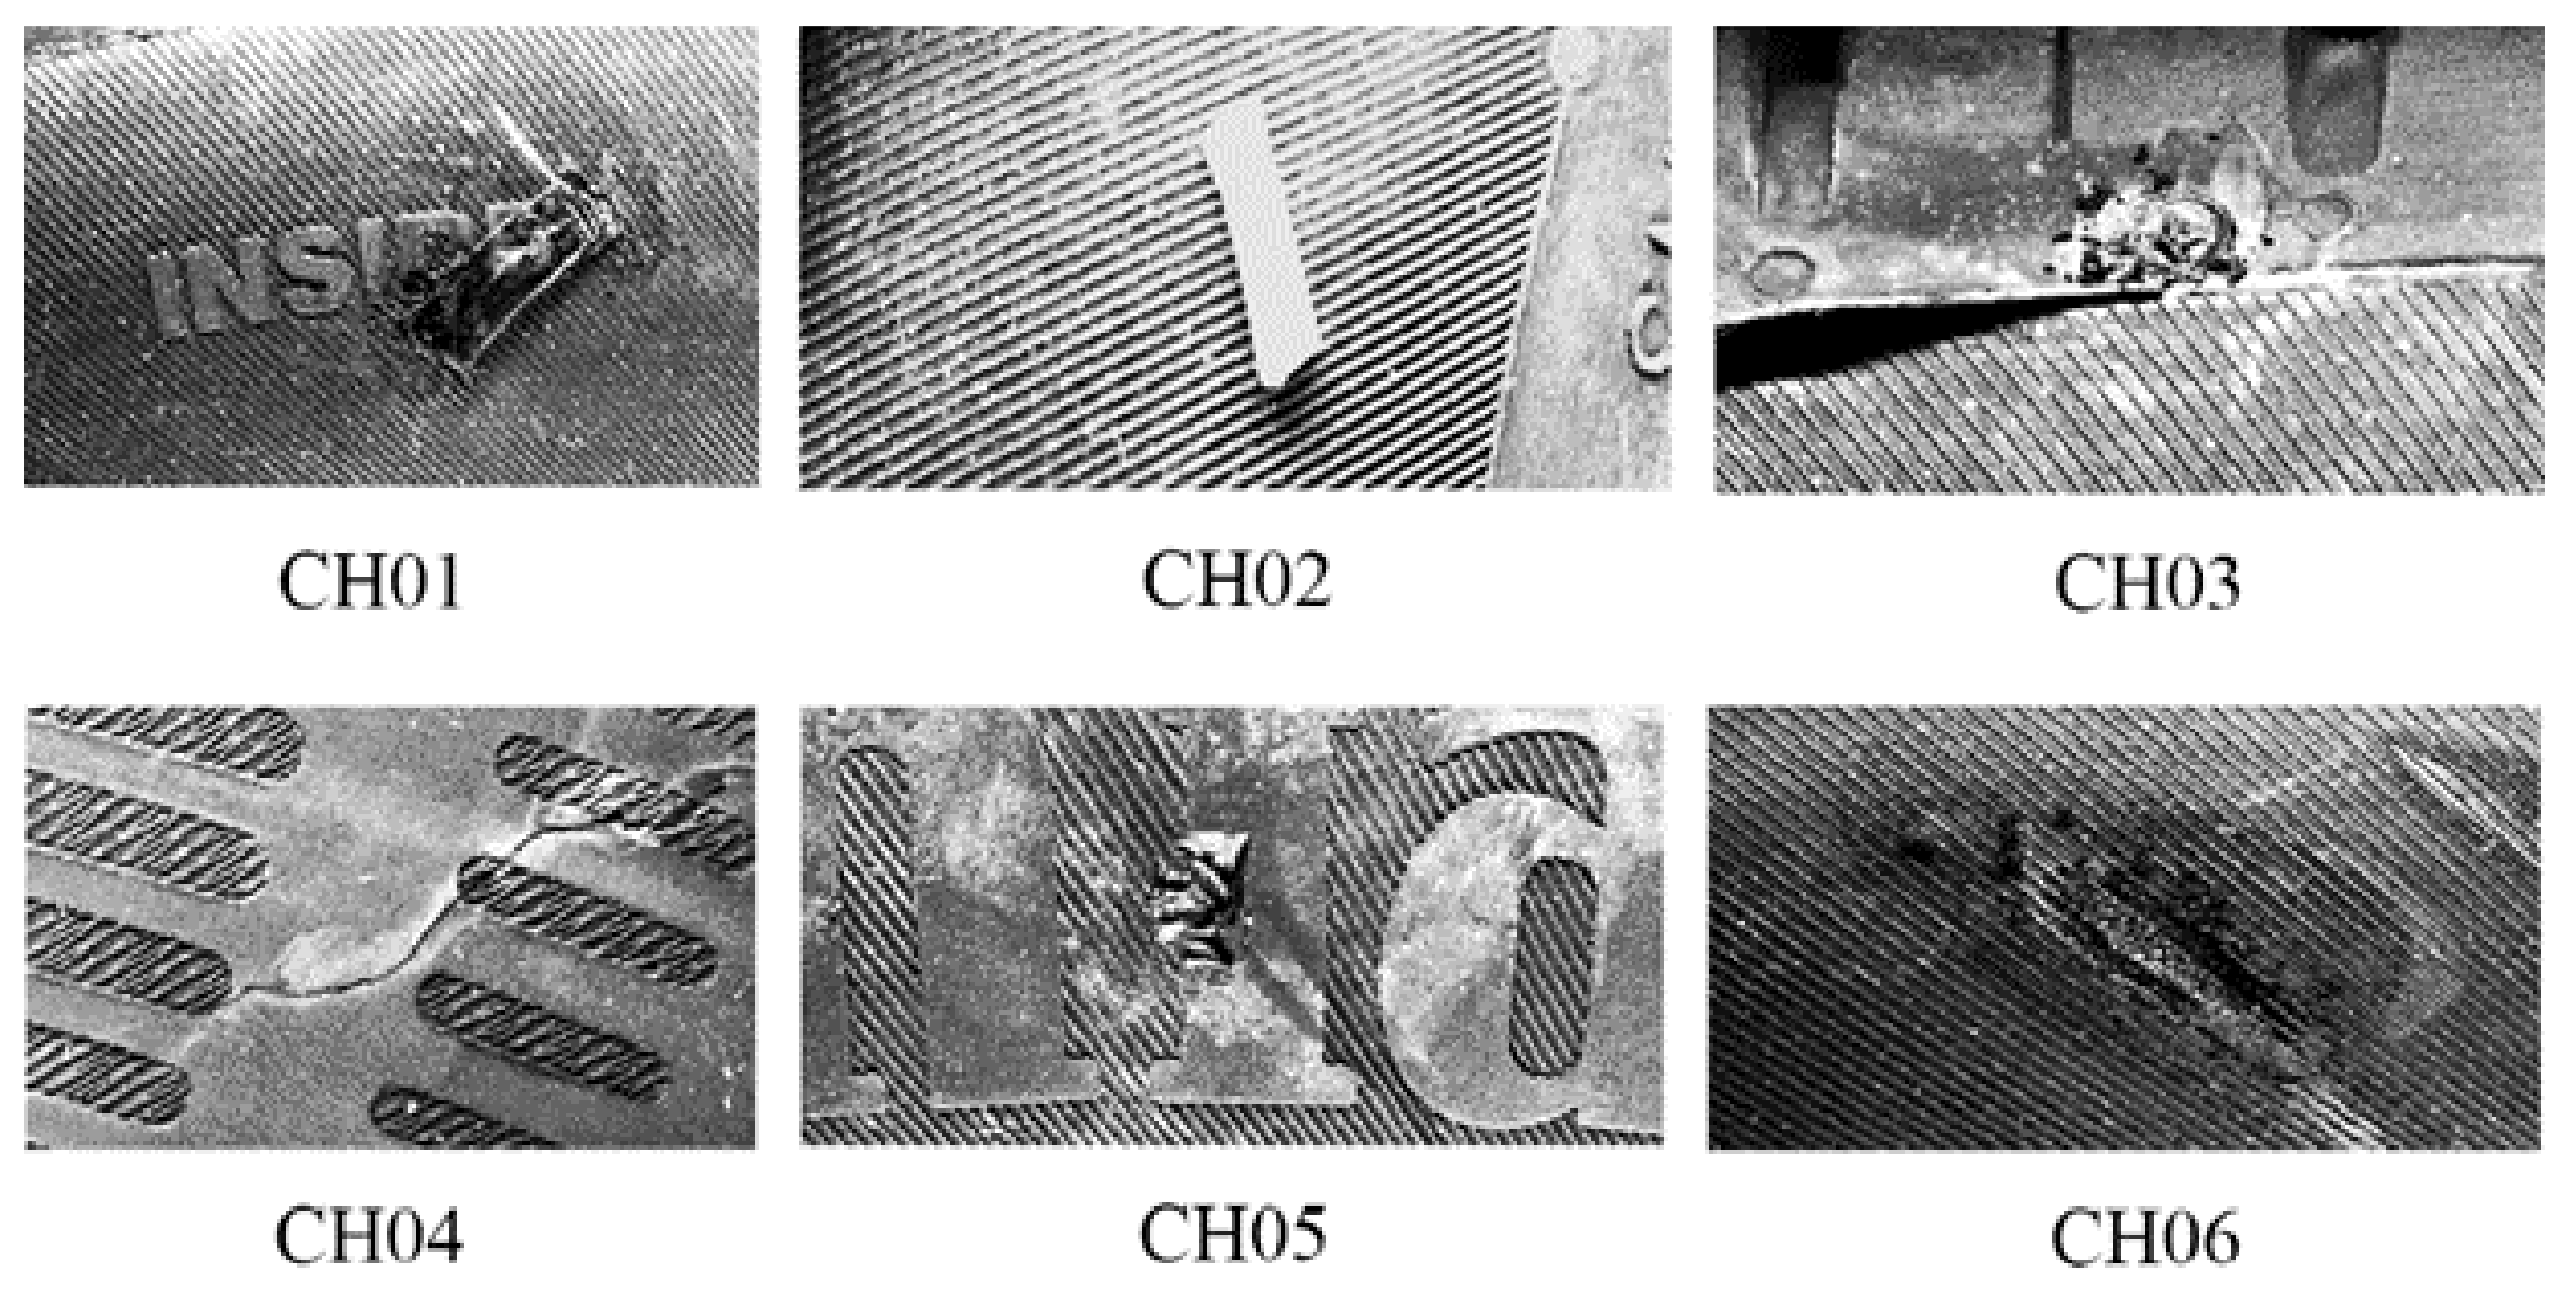
21]. In real conditions of production it is possible to capture defects, which are different in terms of position, shape, size. Other differences are based on excess materials, missing materials, cracks or otherwise damage the area. For inspection systems it is necessary to choose appropriate candidates of defects with representative types of defects mentioned above. Within the tests, specific types of elements were selected on the inspected object, which represent possible types of defects. Thus, these are required to be detected using the proposed methodology of automated visual inspection. These elements were chosen so that it was possible to test the suitability of the proposed methodology and also to cover as objectively as possible all the recorded types of production defects occurring on tires in a real operation. During the direct visual inspection carried out in factories, during the inspection of the final tire and both the sidewalls, six representative types of defect mainly occurring in production were chosen and these are displayed in
Figure 2:
- –
occurrence of impurities from the same material as the tire (CH01),
- –
occurrence of impurities from other materials (CH02),
- –
damage of the material by the action of temperature and pressure (CH03),
- –
crack/tear (CH04),
- –
mechanical integrity damage (CH05),
- –
material etching (CH06).
2.2. Image Acquisition Hardware
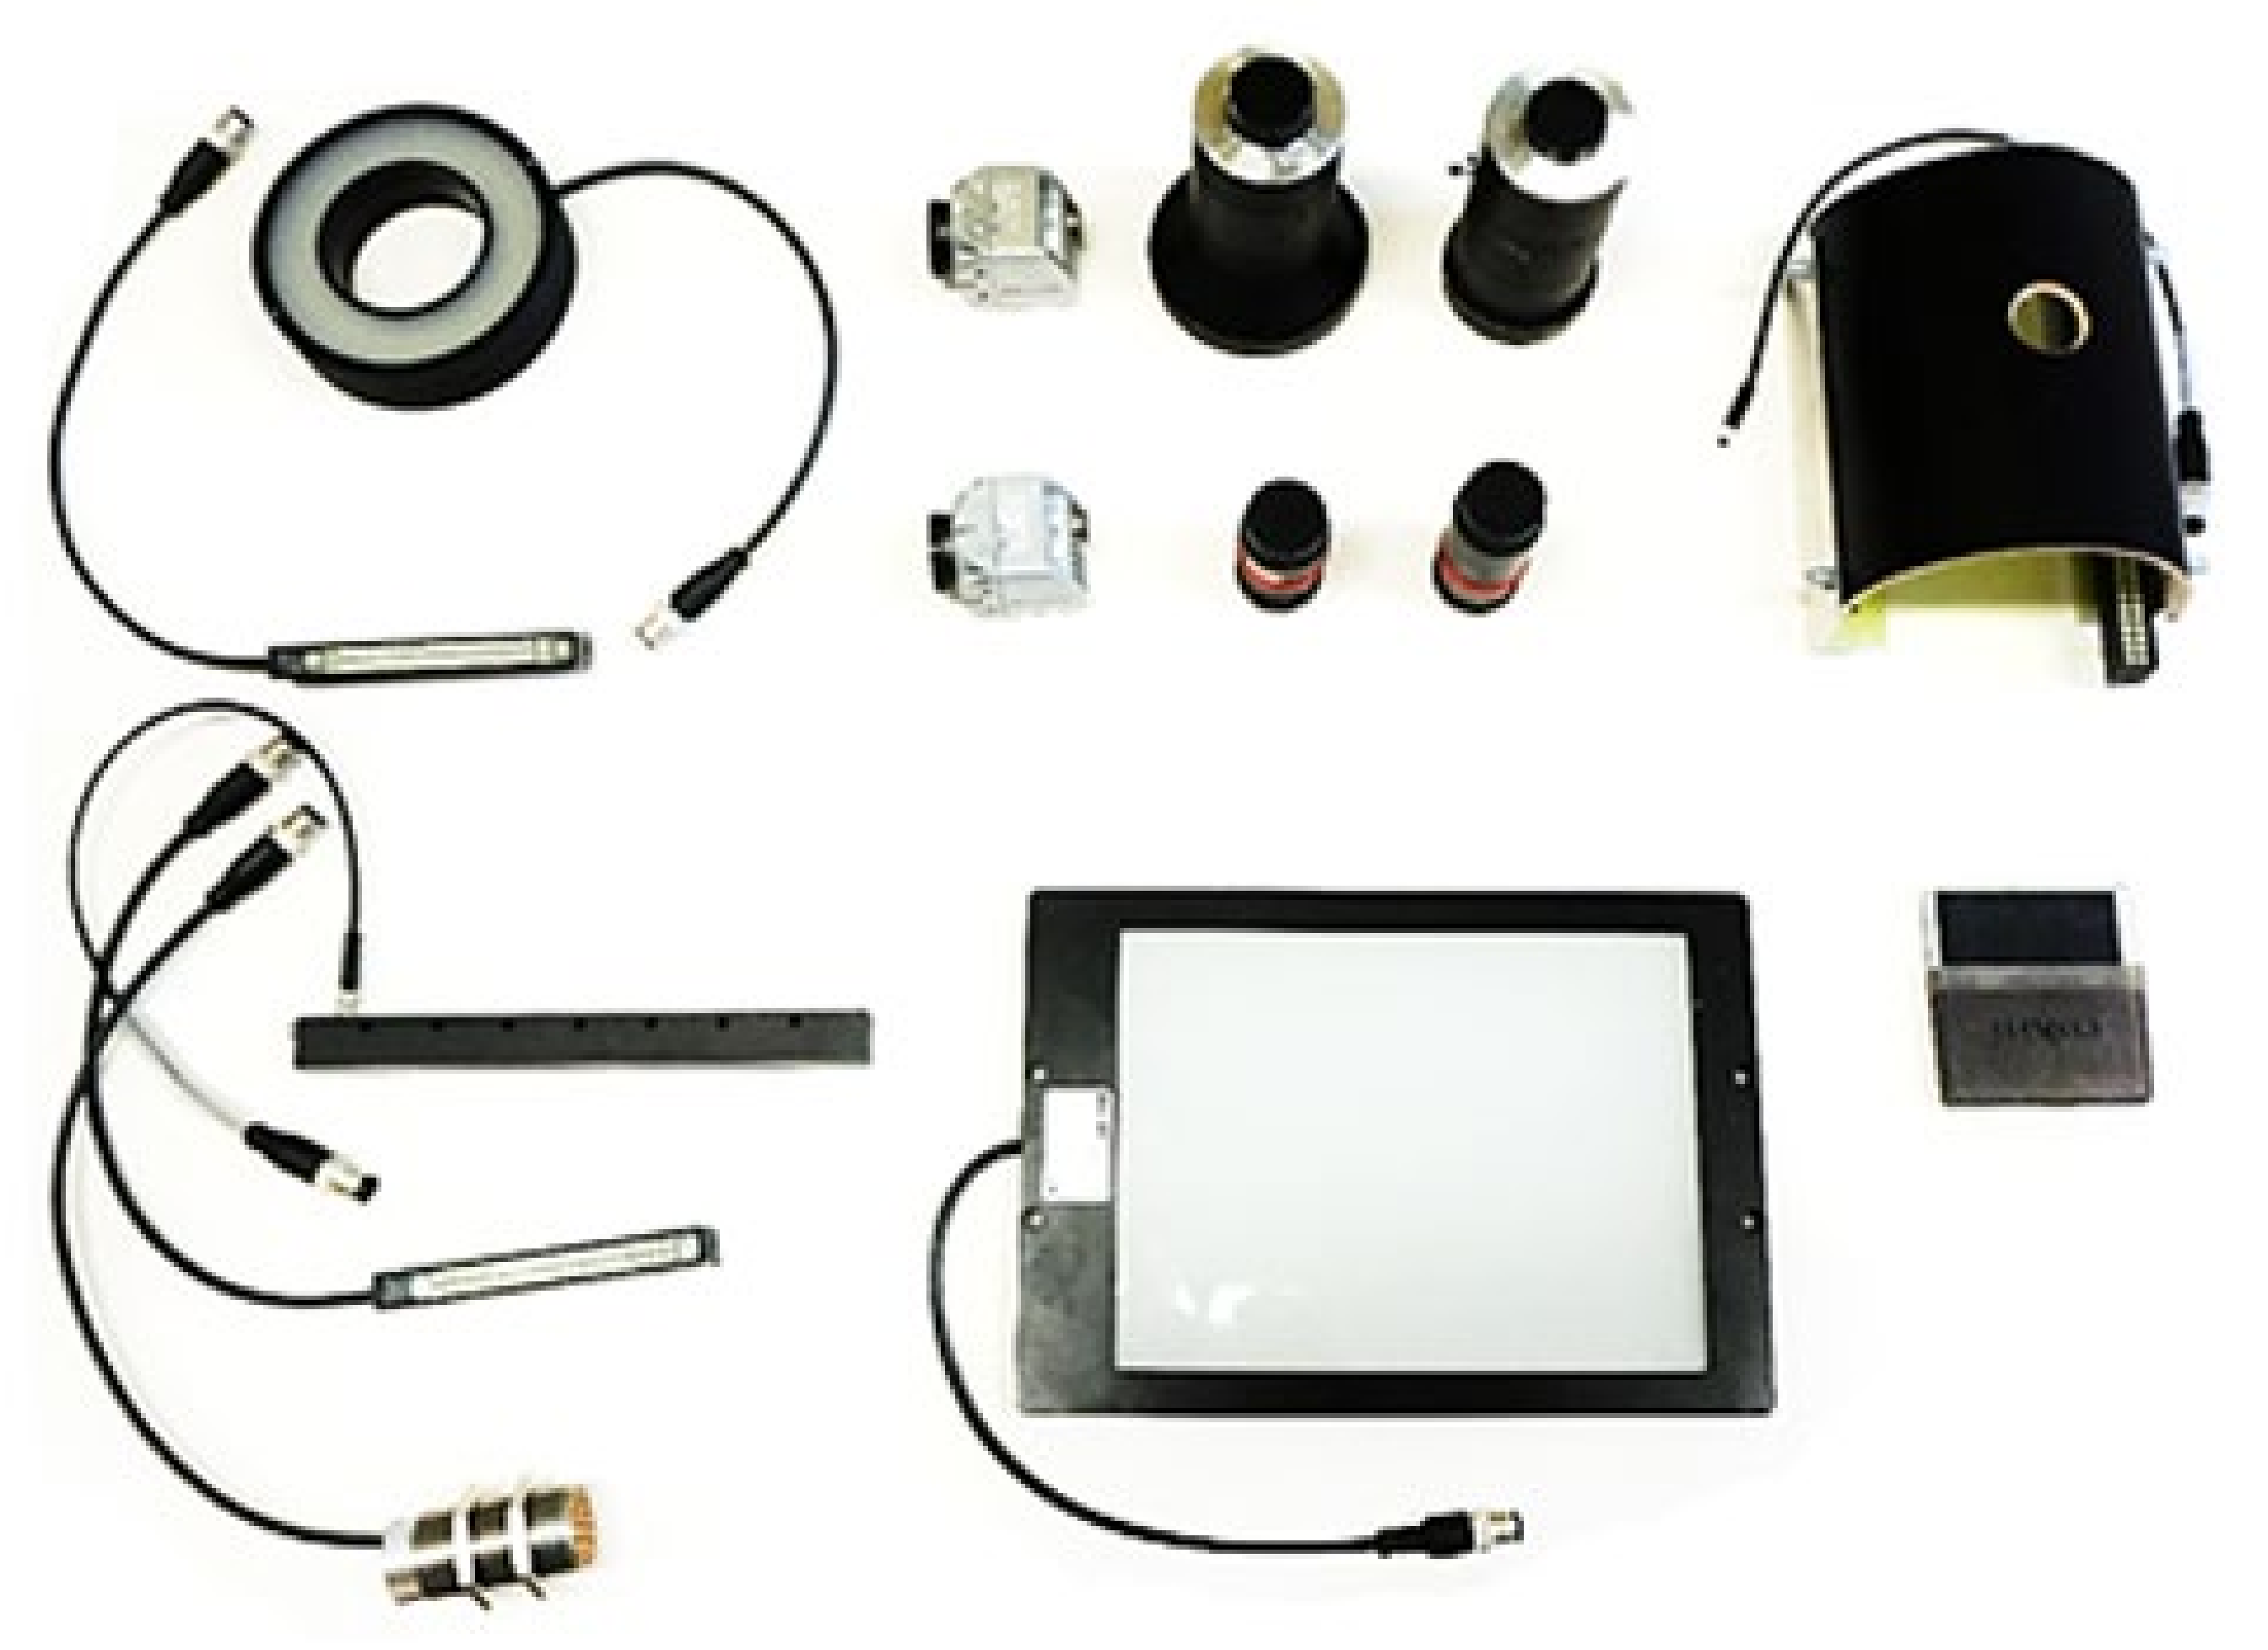
In order to test and select a suitable combination of camera, lens and lighting to solve the selected tasks, technical equipment from the company Balluff was used. Specifically, two cameras—one monochrome 12 Mpx and one colour (RGB—red, green and blue) 5 Mpx and their as associated lenses and lights of various types were selected. Due to the need to illuminate the scene as well as possible, line 100 mm and 200 mm red, white and infrared (IR) lights, circular 100 mm IR light, dome light, surface 200 mm × 150 mm lighting and spot light with a diameter of about 30 mm were tested. When scanning the entire surface of the tire at once, light tubes were used, but they are not primarily intended for the given use, therefore constant homogeneity and lighting intensity is not guaranteed when using them. The equipment used in the tests can be seen in
Figure 3.
As part of testing and capturing test images, a monochrome 12 Mpx industrial camera BVS CA-M4112Z00-35-000 from Balluff was used on the basis of preliminary analysis, the basic parameters and image. The selected camera was based on the analysis of the object and external conditions data acquisition supplemented by a Tamron BAM LS-VS-007-C1/1-5018-C lens. In contrast to the use of line scanners, it is necessary to ensure optimal lighting when using the camera in order to achieve the desired results, and so the industrial linear LED lights BAE LX-VS-LR200-S26 red were also used.
The chosen method of image data acquisition was the use of a monochrome area camera. The research used a sensor from Balluff, namely BVS CA-M4112Z00-35-000 in combination with a BAM lens LS-VS-007-C1/1-5018-C and two red line lights BAE LX-VS-LR200-S26.
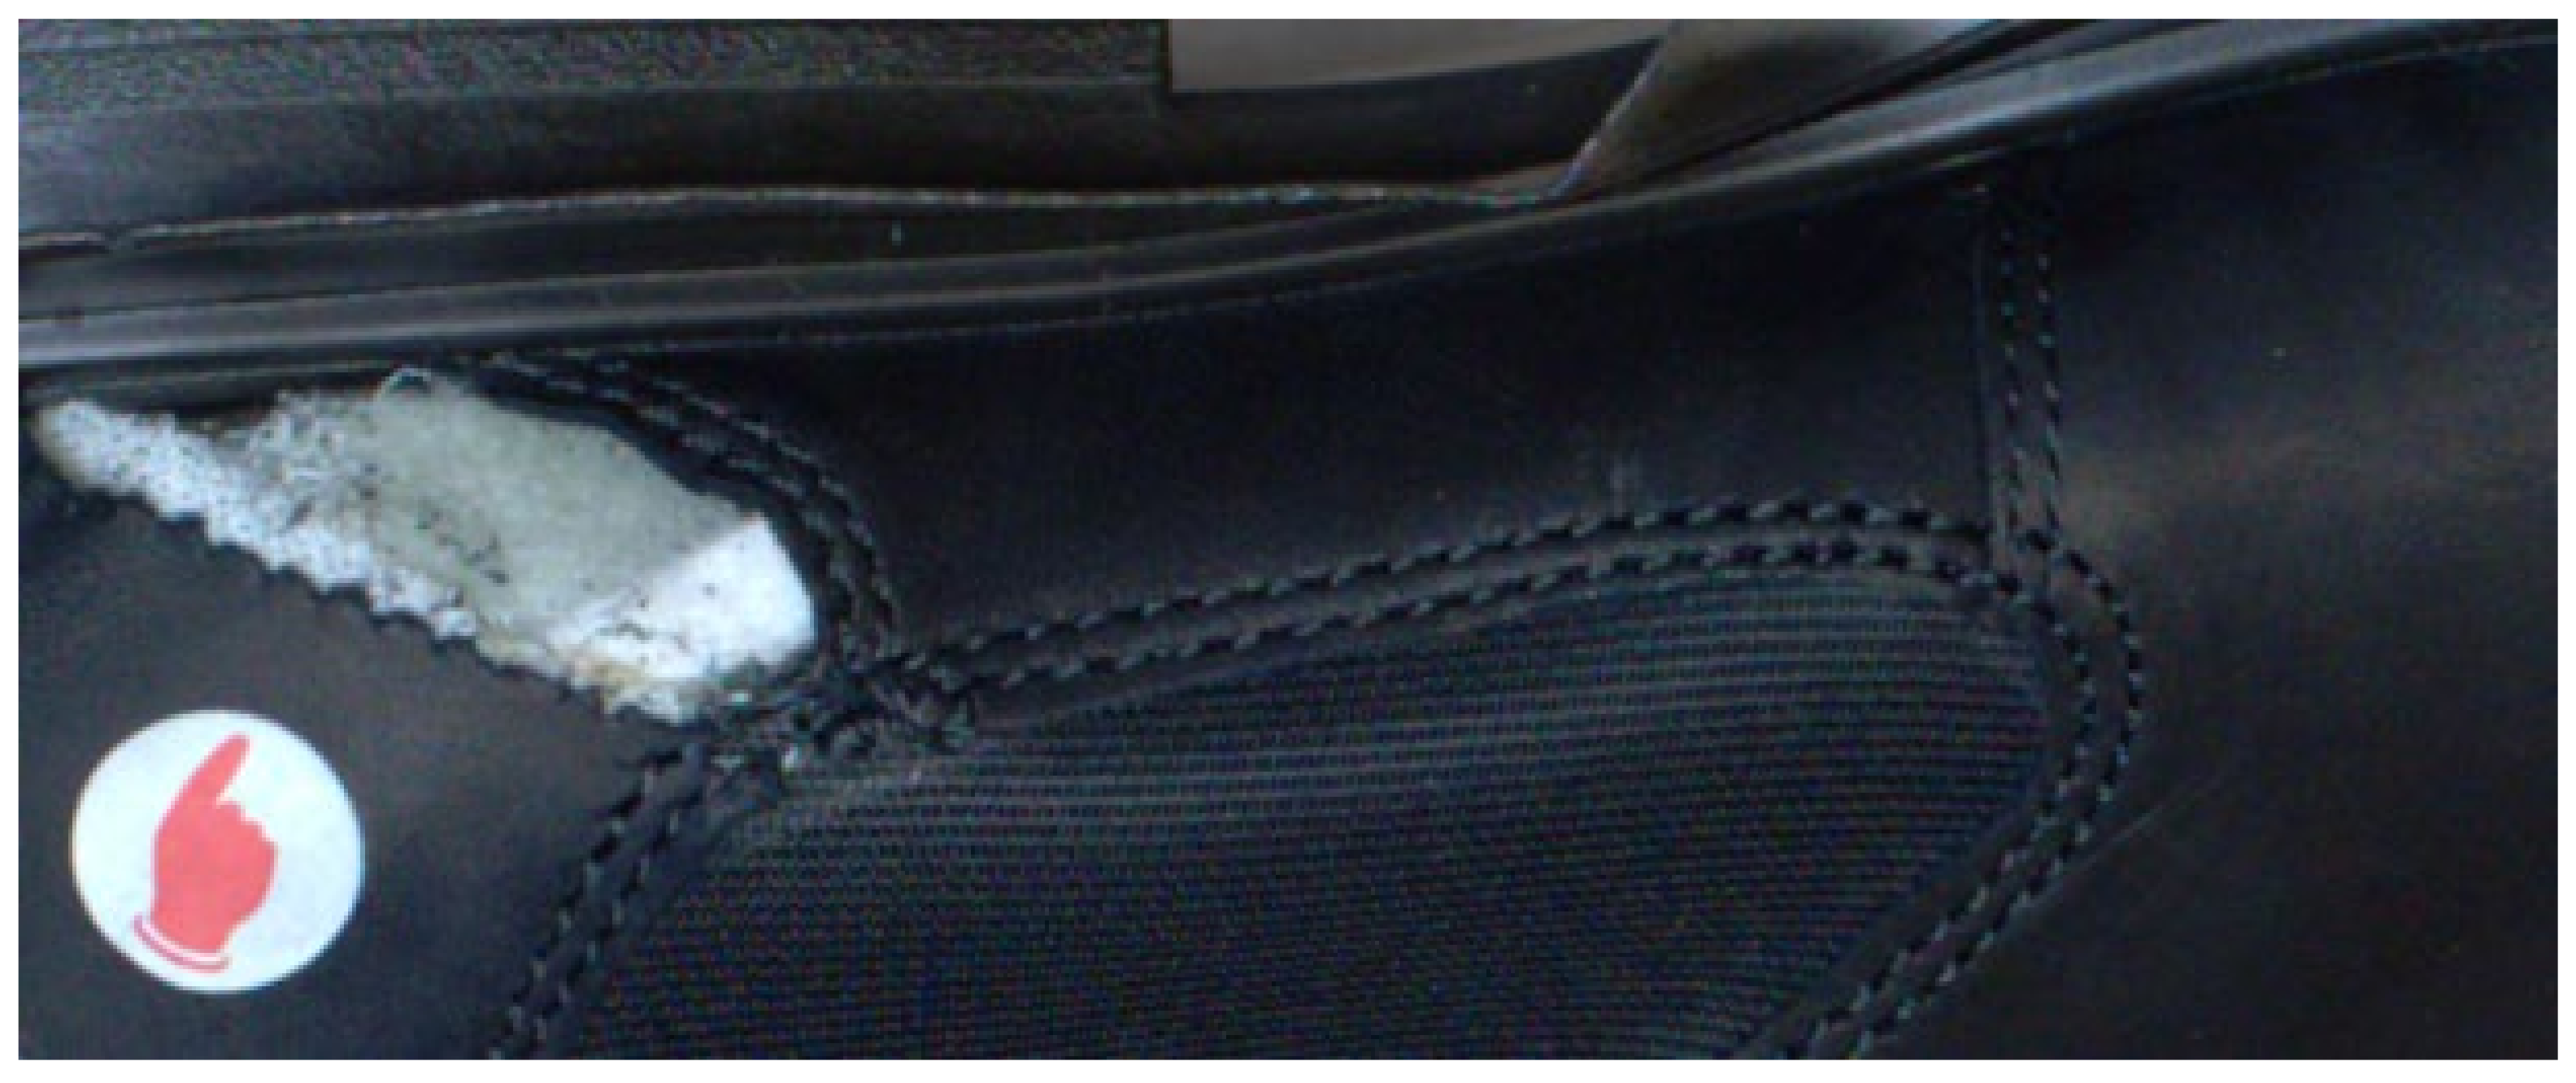
Choosing appropriate lighting was based on an analysis of possibilities and suitability in various conditions. Particular experiments were performed on an object (
Figure 4) which contained multiple surfaces differing in shape, colour and material compared to the tire. The aforementioned figure was captured by a 5 MP colour camera Balluff type BVS CA-C2464Z00-35-000. On this sample was tested IR, red lights for demonstrating impact-specific lighting to capture the image.
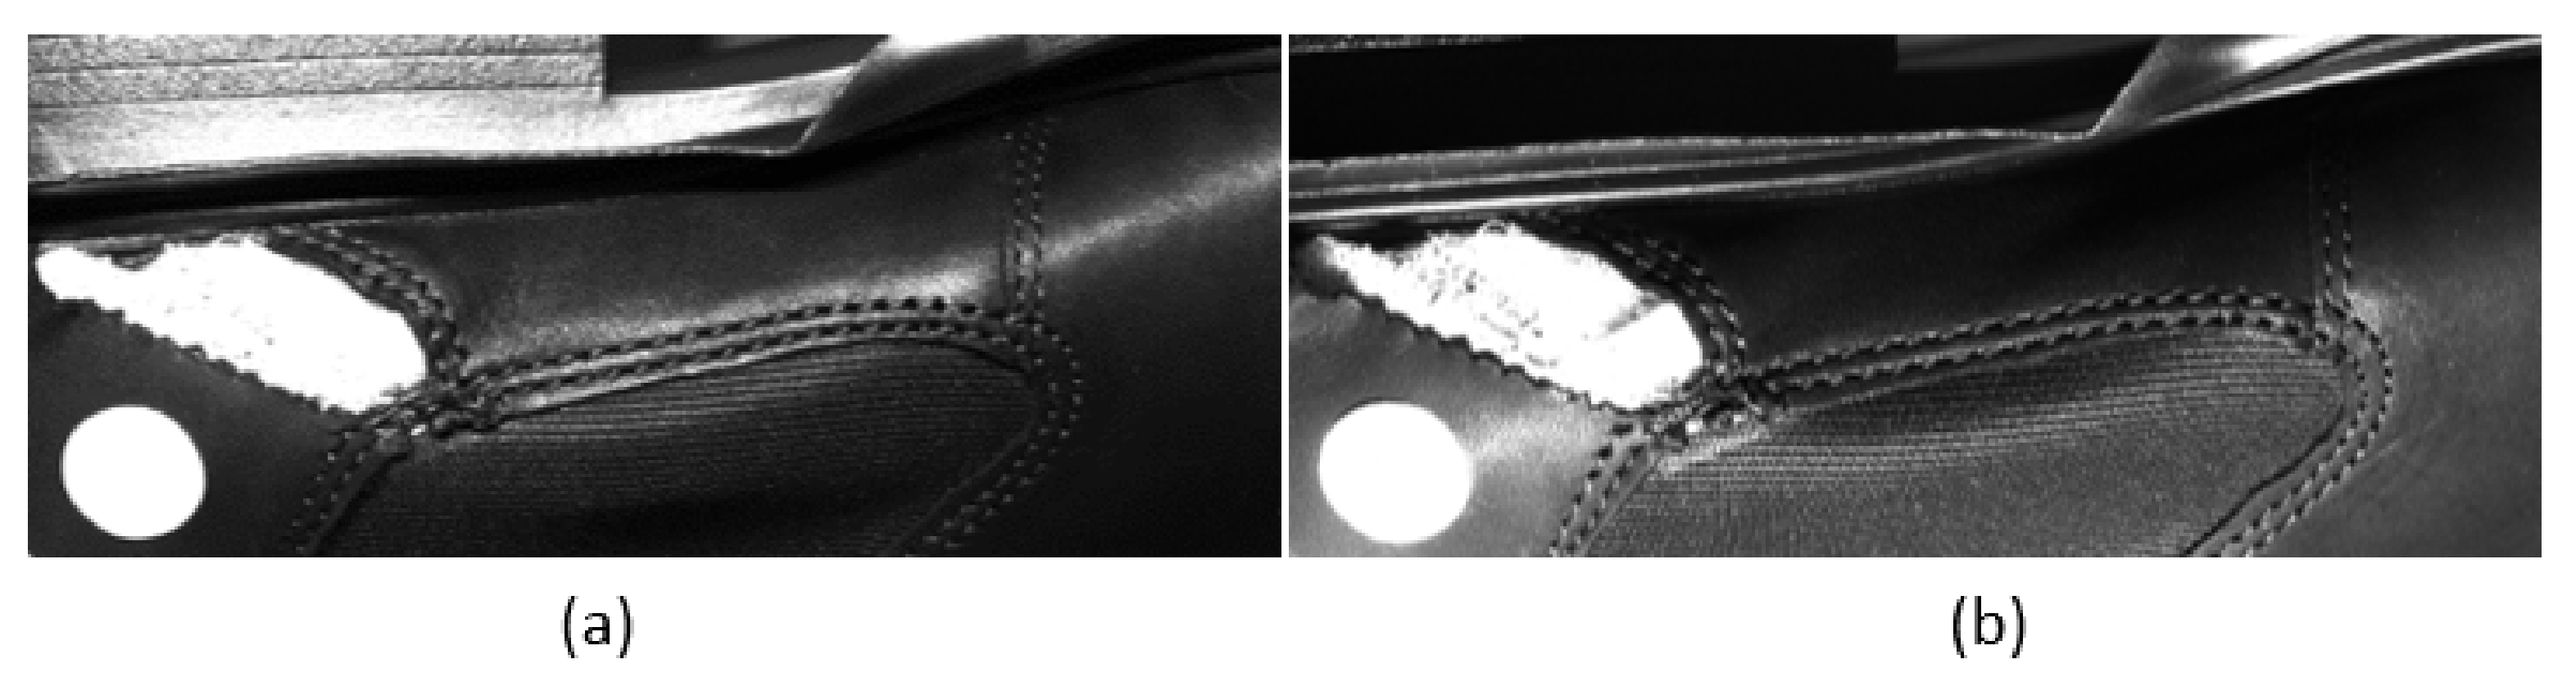
The first tests were performed with a 200 mm line red light, where the position was experimented with in order to improve the quality of the acquired image and highlight features. Based on this experiment, the impact of colour light to capture the image is clearly recognizable. A label with a red symbol and white background is displayed. The positions of lights markedly change the quality of the captured image.
Figure 5a illustrates light above the object, where illuminated top surfaces are significantly lighter in comparison with
Figure 5b, where light below the object illuminated lower surfaces. For further experiments adapted to a tire, it is expected that we will use a low angle position of lightning to the surface of the tire in order to capture the edges of the text and geometric abnormalities due to very small geometric differences occurring in the range of 0.5–3 mm.
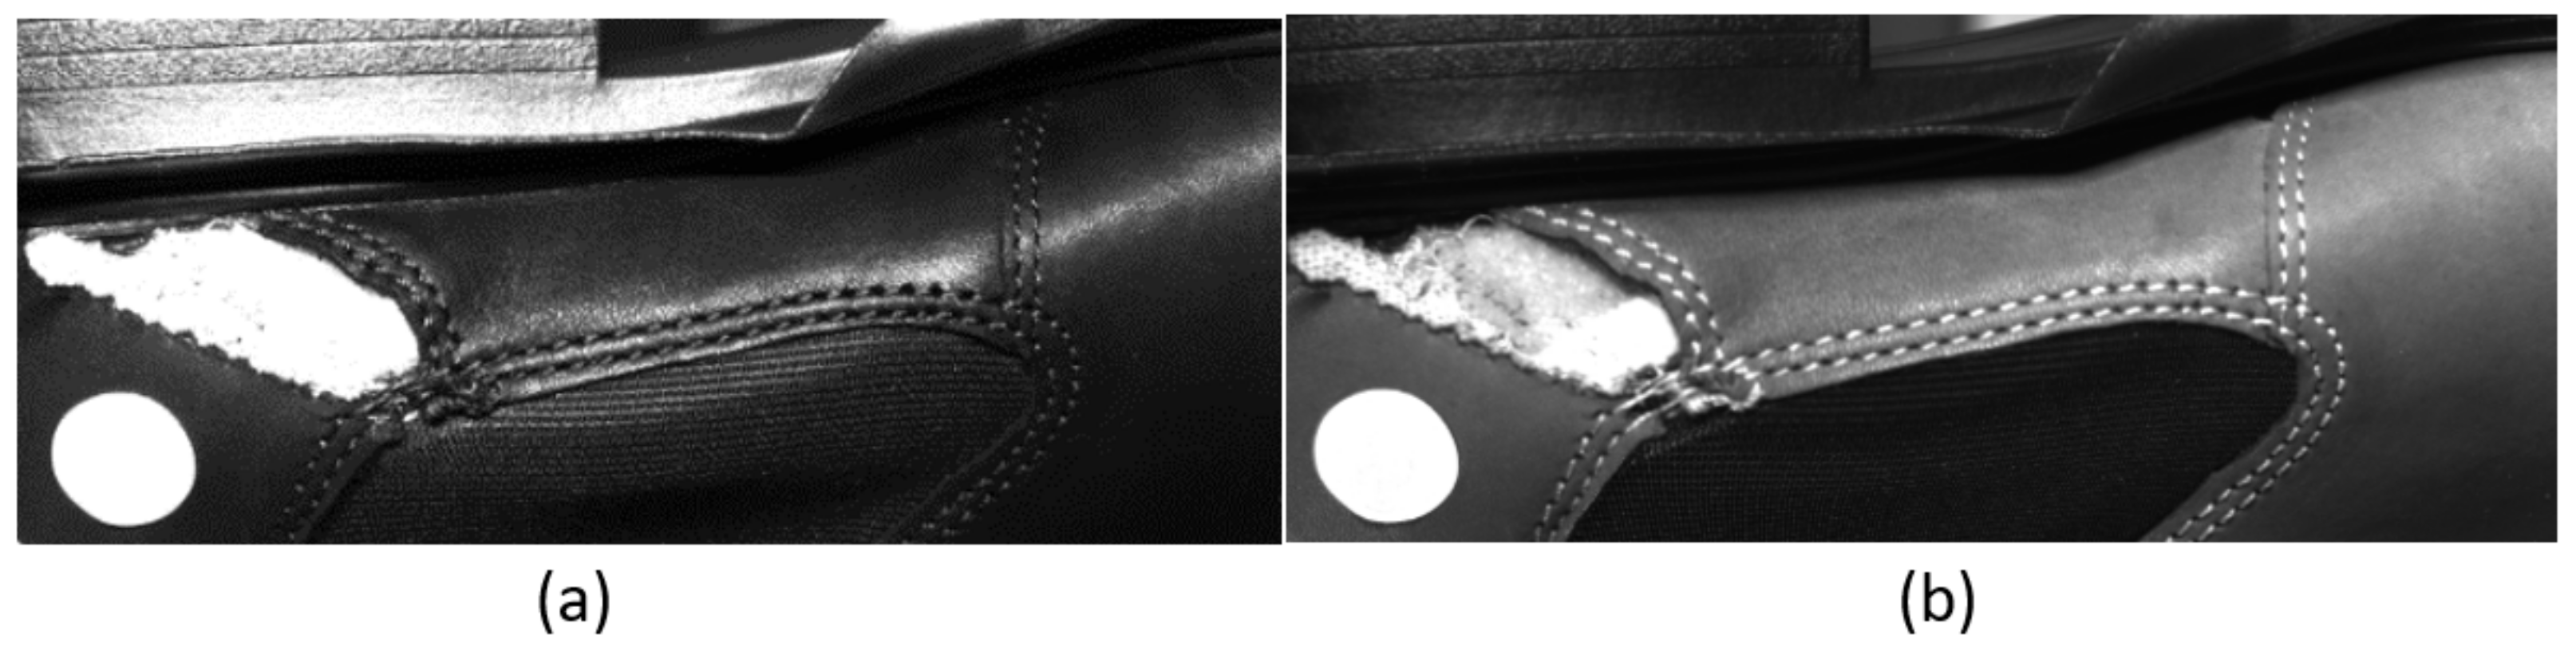
The impact of IR light is displayed in
Figure 6, where it is compared to 200 mm line red light with a similar position of the lights. Reproduction of experimental conditions as in the previous experiment is not possible due to circular design od IR light. Application of a circular IR light conditionally suppresses geometric edges and focuses on edges generated by different types of material. In
Figure 6b there are clear differences in imaging of materials compared to red light
Figure 6a. This property is suitable for highlighting abnormalities based on different materials from rubber occur on surface for instance bead wire, polyester casing, metallic belts etc. This is the main point of defect visibility in the data according to their material and light conditions.
The aforementioned camera system is in the final design stage supplemented by a line laser scanner. This device is able to scan the surface of an object and provide values of every point of profile in all three axes (x, y, z). subsequently it is possible to produce the compound shape of scanned object in 3D or in 2D. Usage of a laser scanner is necessary, when there is a requirement to detect elements which are mainly geometrical but are not visible by a camera system.
2.3. Lightning Set-Up
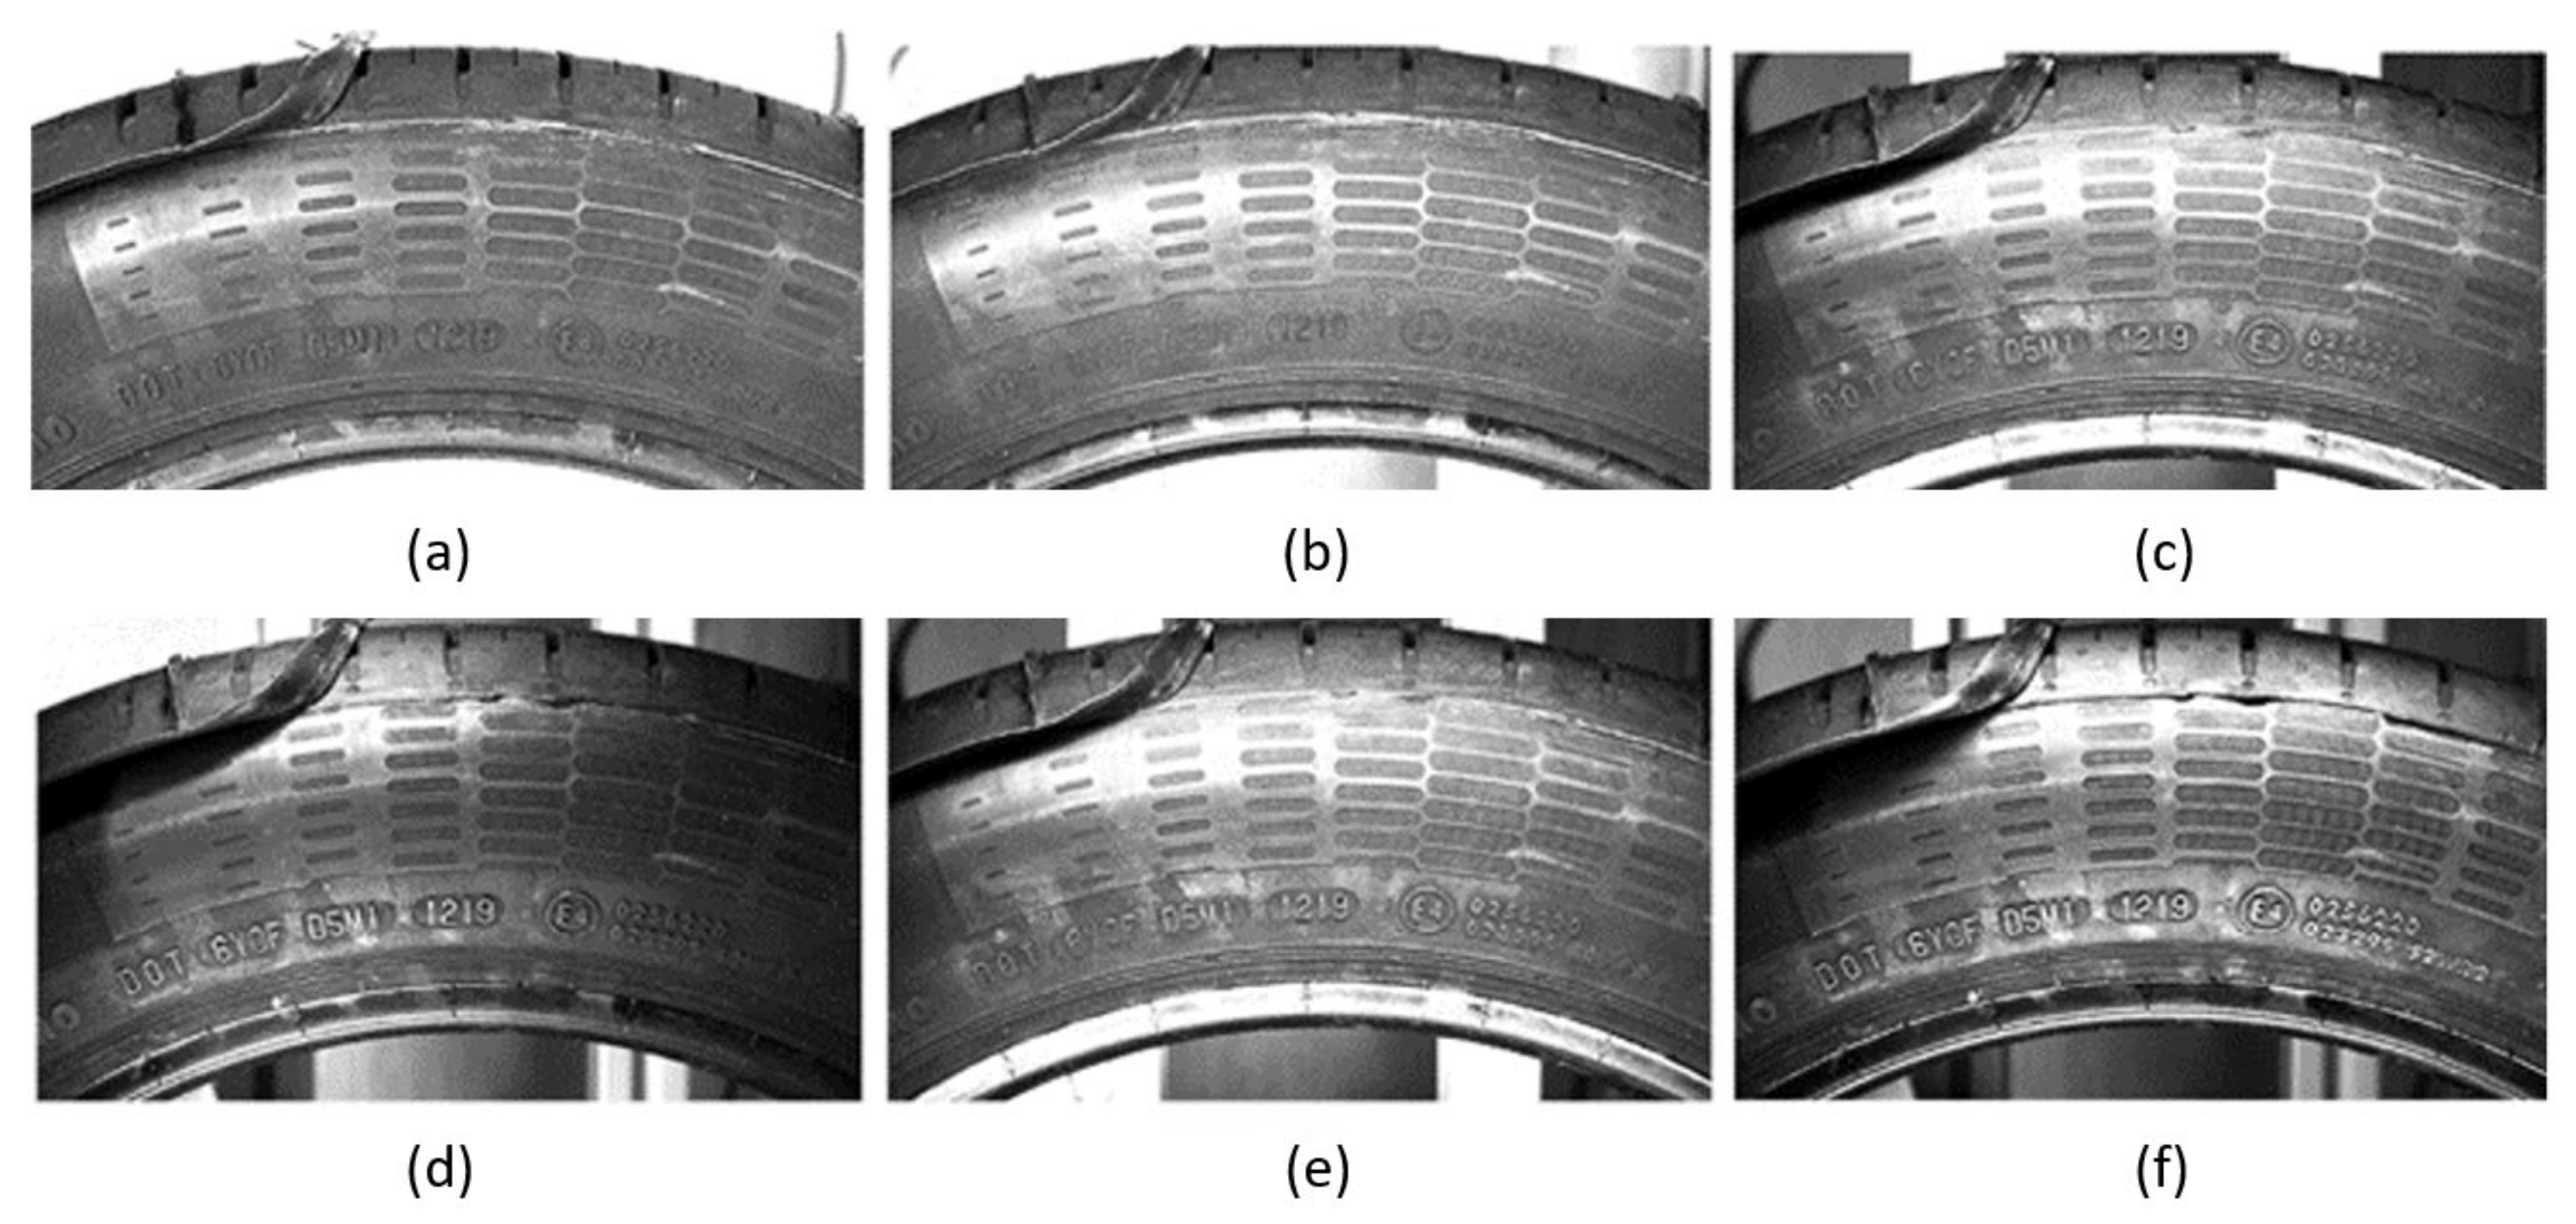
Due to the pre-performed analysis of the scanned object and the elements that needed to be highlighted with the right lighting selection, several possible light configurations were selected, and the results of these experiments can be seen in (
Figure 7). The elements on which the lighting methods have been tested reflect the text of the Tire Identification Code and the DOT marking. This text was selected due to the requirement to evaluate the quality of lighting used via OCR built in the Matlab function.
As it was previously certain that in the process of imaging the tire surface with an industrial camera it would be necessary to experiment with the lighting method, the test equipment was designed so that it was possible to easily change the configuration of the lighting used. During the experiment, several types of lights described in more detail in
Section 2.2 were available at the department, which were placed differently and their most suitable configuration was chosen. As this was a visual inspection of the surface of the object, which is matte and dark, it can be assumed that lighting with high intensity and a relatively large lighting area would be needed, as the examined area had dimensions of about 300 × 250 mm. The advantage of a particular object is paradoxically its shape. Since it is a rotating object, it was possible to take all the necessary images of the entire circumference from one position during the rotation of the tire on the designed rotating platform.
The first image
Figure 7a was taken without additional lighting, under normal lighting conditions in the laboratory. It is possible to see that the subject is captured with sufficient sharpness, but the required text is very difficult to recognize even with the naked eye. Such conditions are unsuitable for further processing by machine vision. The image
Figure 7b was taken with the addition of a circular light with a diameter of 100 mm situated at the level of the lens. With such a configuration, it can be seen that the text is suppressed even more than in the image captured without additional illumination and, therefore, such illumination is also not suitable. In the image
Figure 7c, two line lights with a length of 100 mm emitting white light of high intensity were used. These lights were placed at a distance from the tire and at an angle of 60° to the horizontal plane of the rotating platform. With this method of lighting, it is already possible to see an increase in the contrast between the text and the background.
Another lighting tested was the use of IR lights. In the specific case of the image in
Figure 7d, two linear IR lights with a length of 100 mm were used. In this image, the contrast between the desired text and its background, as well as between the other shape elements and the surface of the tire, can be seen very clearly. However, the problem with this method of illumination is that the lights had to be close to the illuminated area, and due to their length, the entire sensing area was unevenly illuminated. When taking the last two images in
Figure 7e,f two red line lights with a length of 200 mm were used. In the image in
Figure 7e, the lights were placed similarly to the white lights in
Figure 7c and also the resulting images were very similar. When taking the image in
Figure 7f, the lights were positioned relative to the image in
Figure 7e at an angle of 30° to the horizontal plane of the rotating platform and at a distance of 160 mm from the tire. The surface illuminated in this way and the images obtained from it subjectively appear to be suitable for further processing, and therefore in this method of lighting all other images of both sidewalls of the tire were taken in order to design a methodology for its visual inspection. It has been experimentally shown that the chosen illumination provides sufficient contrast for reliable detection of all types of examined defects.
2.4. Verification of the Equipment Suitability
The so-called tire identification number (TIN) was chosen in order to fulfill both goals of this part of the work. This code is a unique number that can be used to identify the type, dimensions, date of manufacture, manufacturer and other parameters of the selected tire. The recognized text is on the outside of the tire in its full state and on the inside mostly without the date of manufacture. The entire code represents a unique identifier for the model and dimensions of a particular sample. This text was chosen as an indicator of a satisfactory set up all components of designed camera system. After acquiring an image of it with different types of sensors, lenses and lightning configuration the best setup will be chosen for the application of visual control and defect detection of automobile tires. The quality of images will be tested with the OCR function in Matlab and followed with the pretrained R-CNN detector.
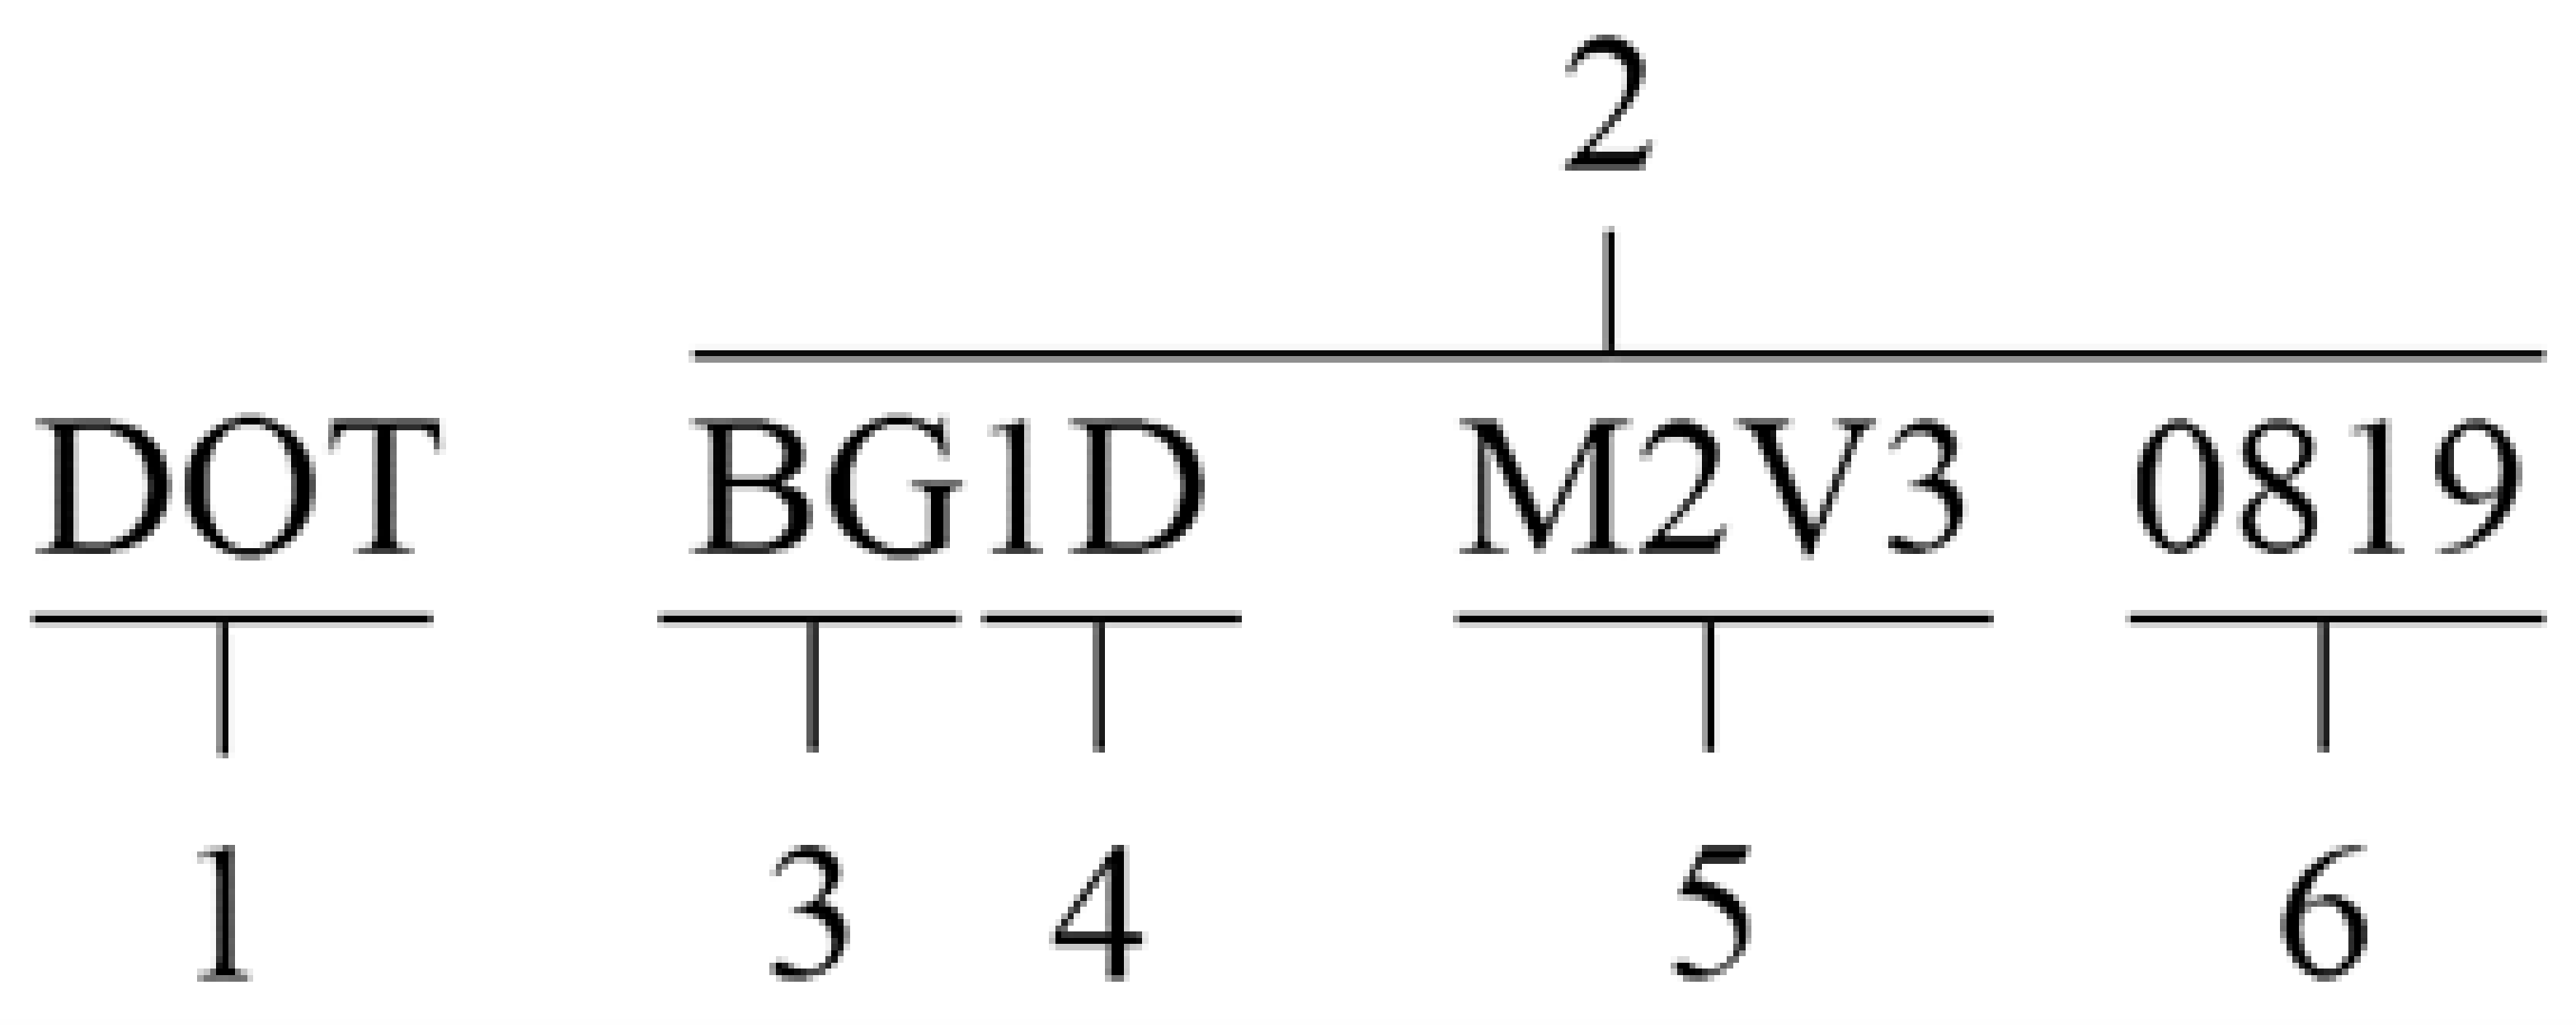
An illustration and description of the individual parts of such a code can be seen in
Figure 8. The TIN begins with the text “DOT” (1), which represent that this type of tire meets the safety standards of the Ministry of Transport [
27]. Part (2) of the marking is already the identification code itself, where part (3) describes the code of the manufacturer and production plant. Part (4) represents the dimensions of the tire. Part (5), which consists of a maximum of four characters, represents a space for the manufacturer to indicate a more detailed specification of the type or selected characteristics of the tire. The last four digits (6) indicate the week and year of manufacture of a particular piece.
After further tests on the text in English, it was found that the OCR function has a problem with some fonts, as well as with various reflections, double edges, etc. However, these elements occur often in the images of the examined object and their occurrence is present even after many attempts; it was not possible to suppress them using different configurations of lighting or other hardware. However, the images obtained in this way proved to be suitable for further use and network training for specific text font should solve all problems.
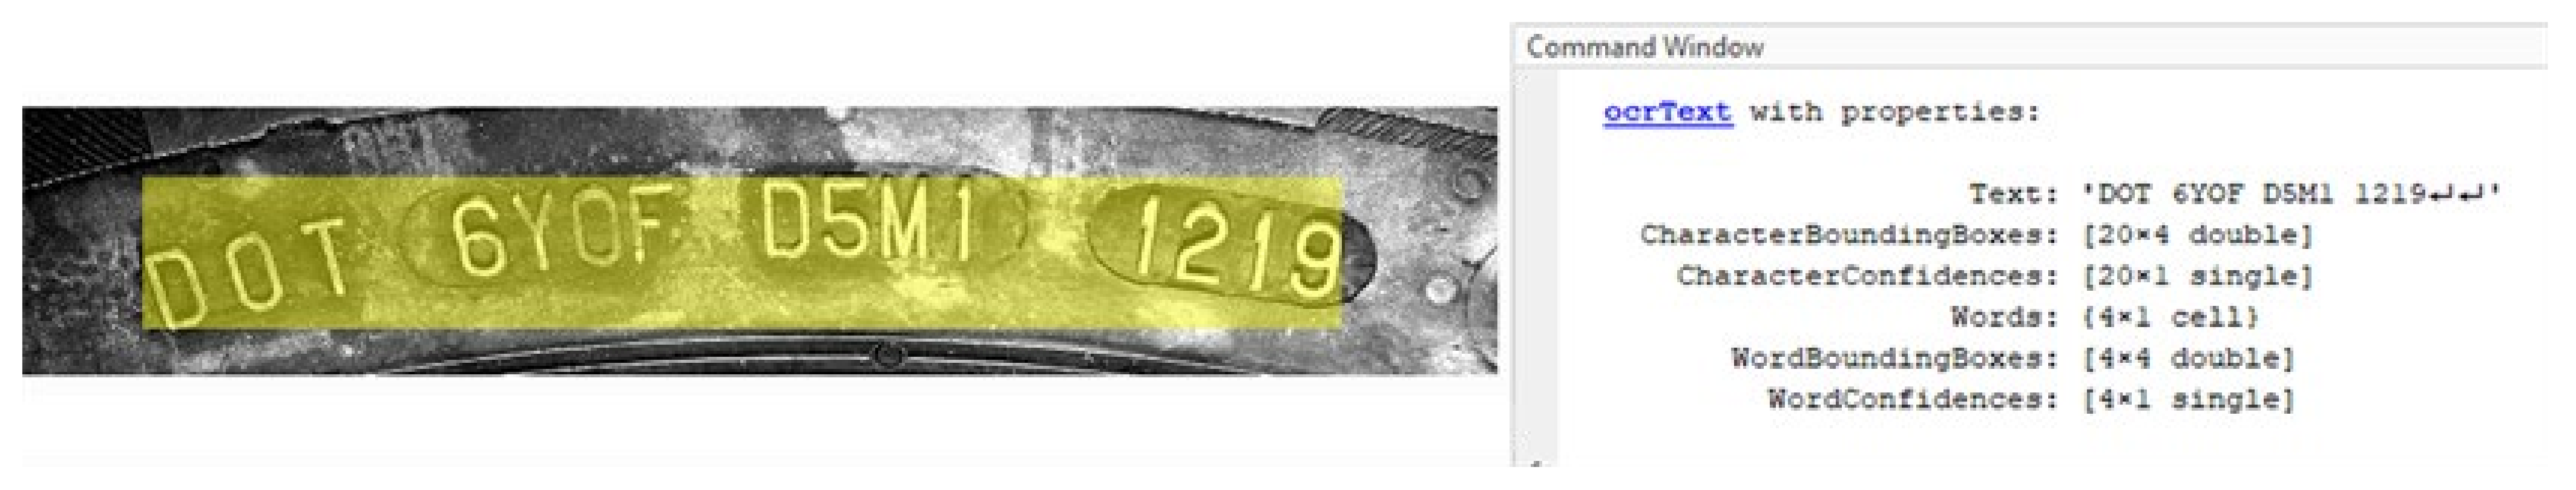
Figure 9 shows one of the results from the application of the OCR function on data from the camera system. The TIN code of the tire was red successfully almost every time after creating a special language for this font. In the case displayed in
Figure 9, OCR function assigned incorrectly only the part “6Y0F”, where instead of number “0” it identified this symbol as the letter “O”. However, this type of mistake when symbols are almost the same shape can be easily suppressed by defining specific conditions of the recognized text directly in the code. Results like this one prove that the approach to the visual control of tires with chosen hardware can be performed by training a neural network and object detector based on it.
2.5. Design of the Testing Rig
The requirement from industry is to automate the visual inspection of essentially all surfaces on the tire. However, as in the ongoing phase of the research it is first necessary to find out whether the proposed procedure can be applied to a given issue or not, and a test procedure for visual inspection was proposed.
With it, the sidewall of the tire will be inspected, as it is the most complex surface, and images will always be captured after a certain rotation of the object. For this purpose, the test equipment was built up. This is due to its design with a servo-driven spreading platform. The rotation of the platform is ensured by a servomotor Festo EMMS-AS-70-M-LS-RS with a nominal power of 1061 W. This motor is supplemented by a CMMP-AS-C5-3A-M3 controller and transmission EMGA-60-P-G5-SAS-70 with a gear ratio of 5:1, which allows the rotation of the examined object and its rotation by a precisely defined angle with guaranteed repeatability.
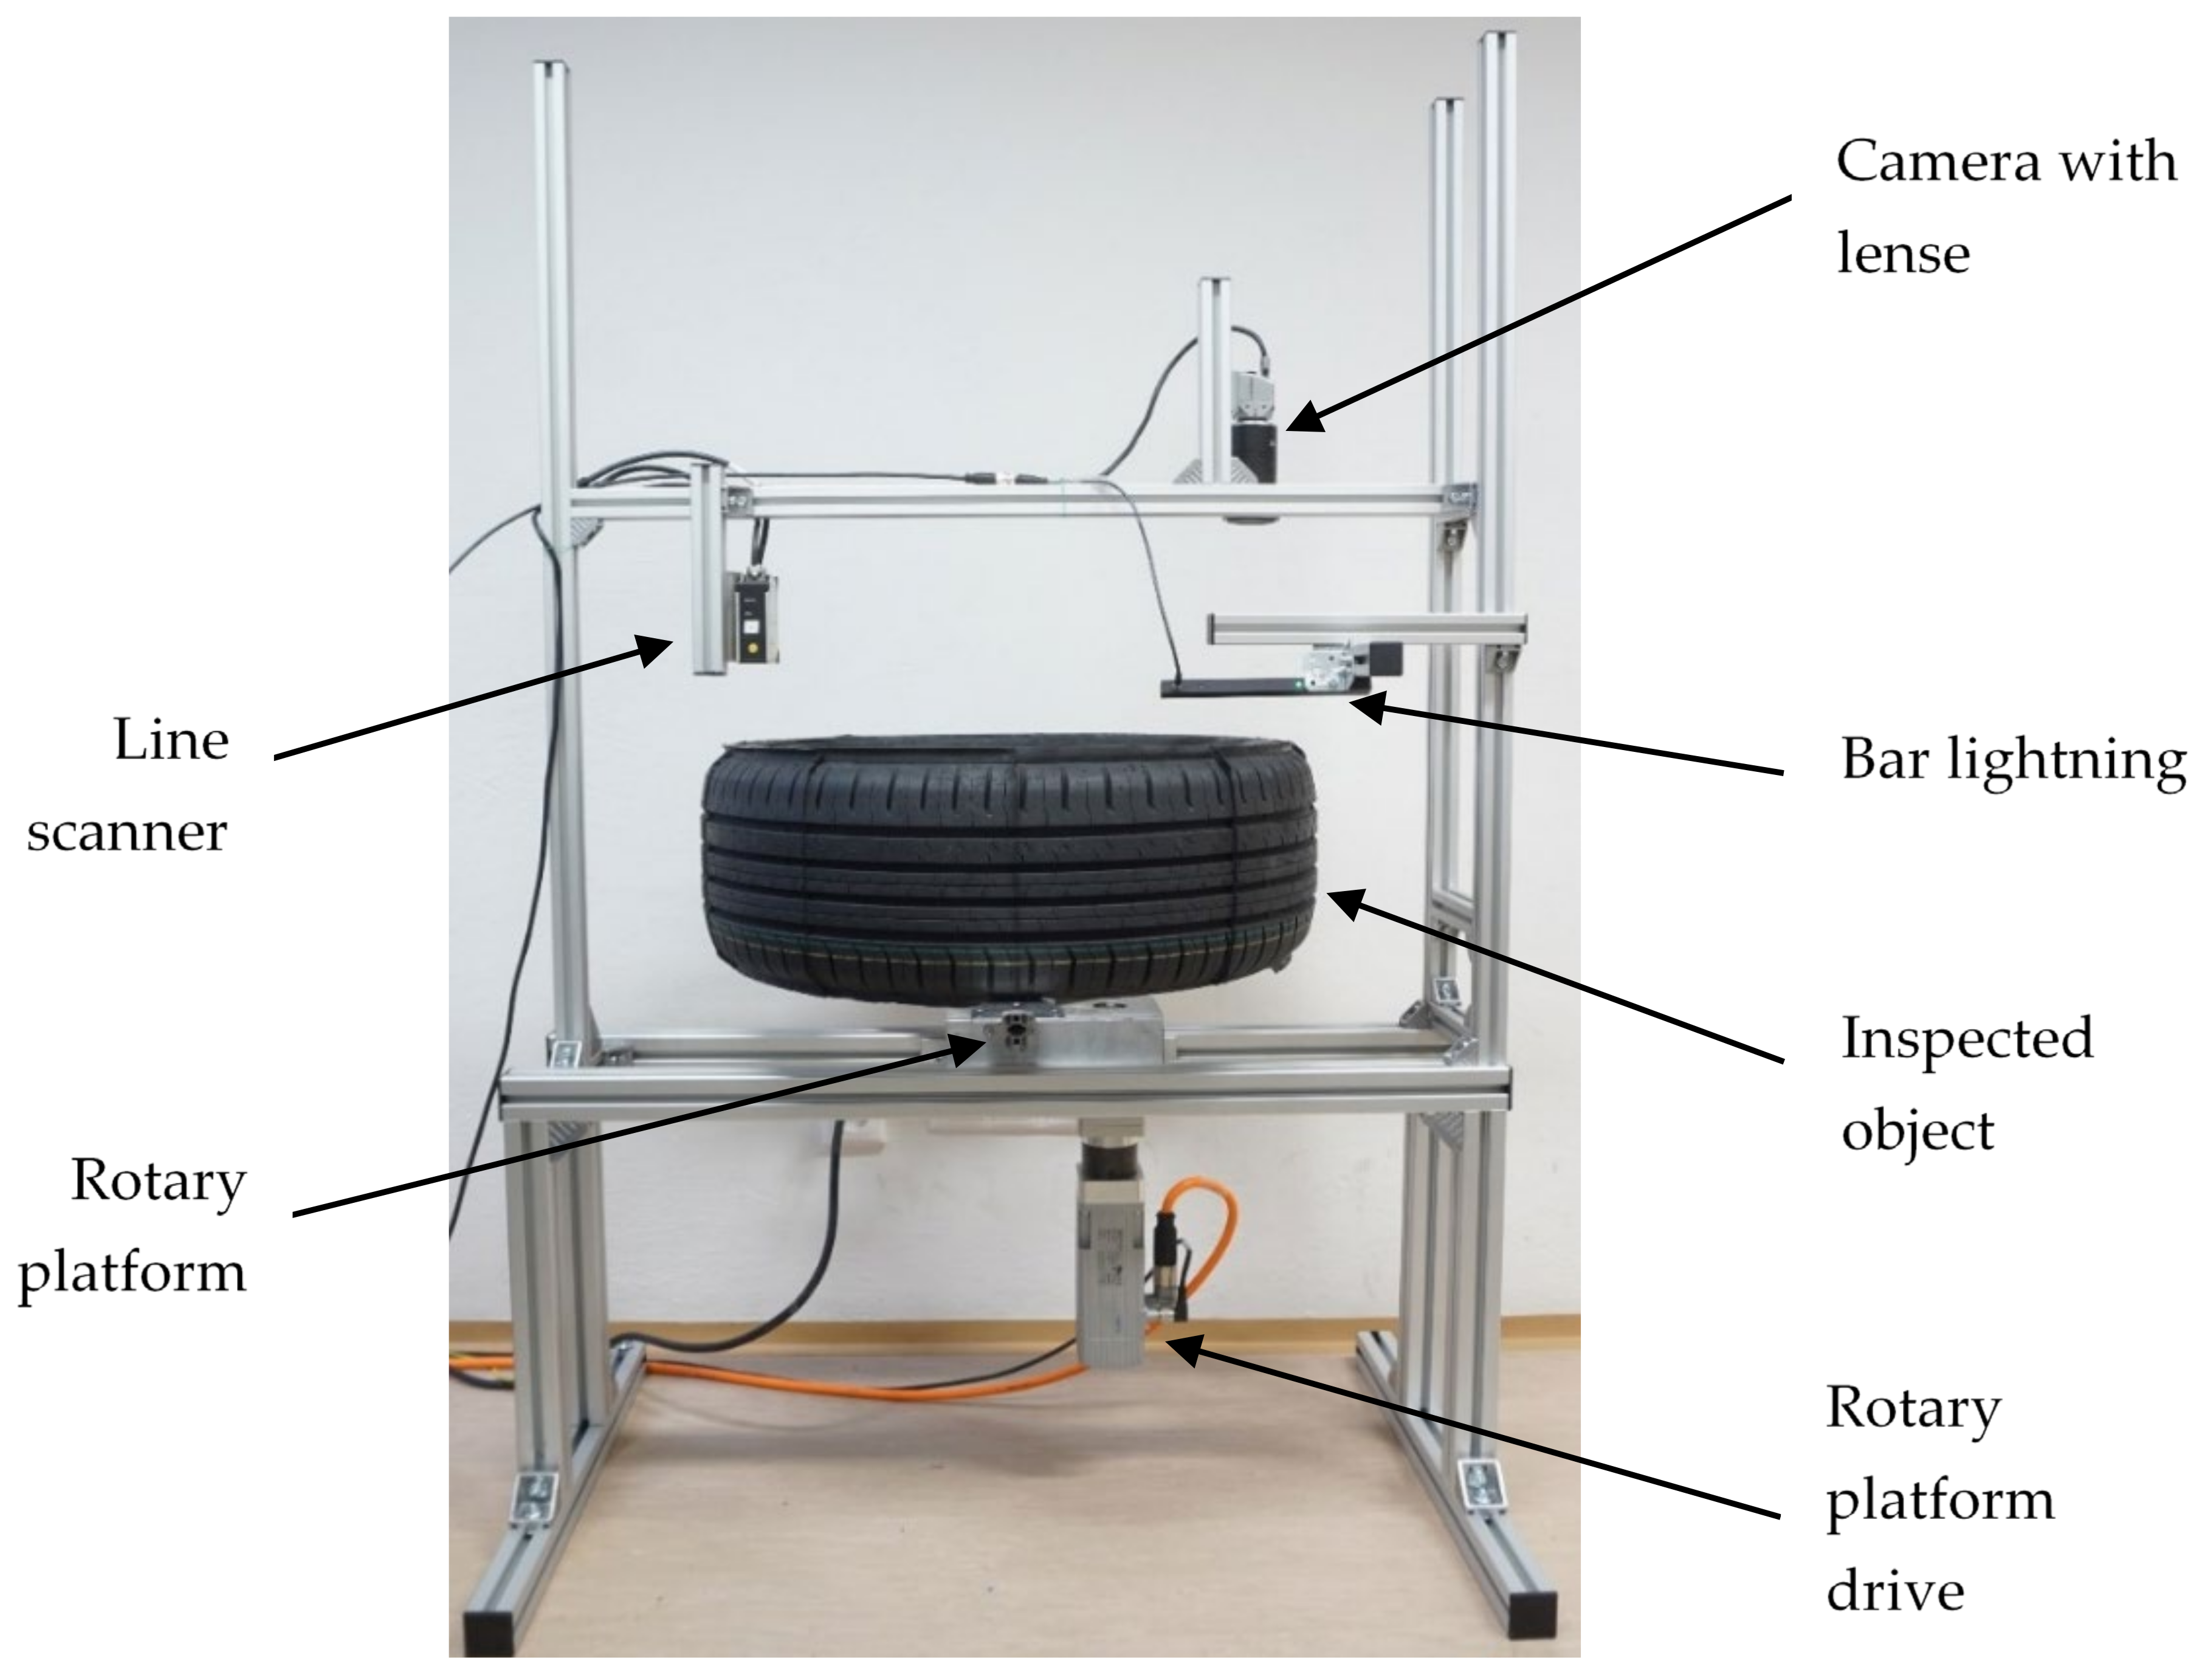
The testing rig (
Figure 10) was designed with an emphasis on the possibility of easy reconfigurability for specific placement needs, whether scanning technology or lighting, or other devices used. An easy configuration change is important in the tests, especially in terms of saving time and allowing the testing of as many methods as possible using a single design. The device is also designed to allow scanning of the surface by means of said line scanner and industrial camera simultaneously considering the intended use of both approaches in deployment. As the goal is ideally to scan the tread and sidewall of the tire at the same time, the proposed design allows the camera and scanner to be moved or other scanning devices to be placed in different places so that the best possible scanning results can be achieved for testing purposes.
3. Visual Inspection Methodology and Data Processing Design
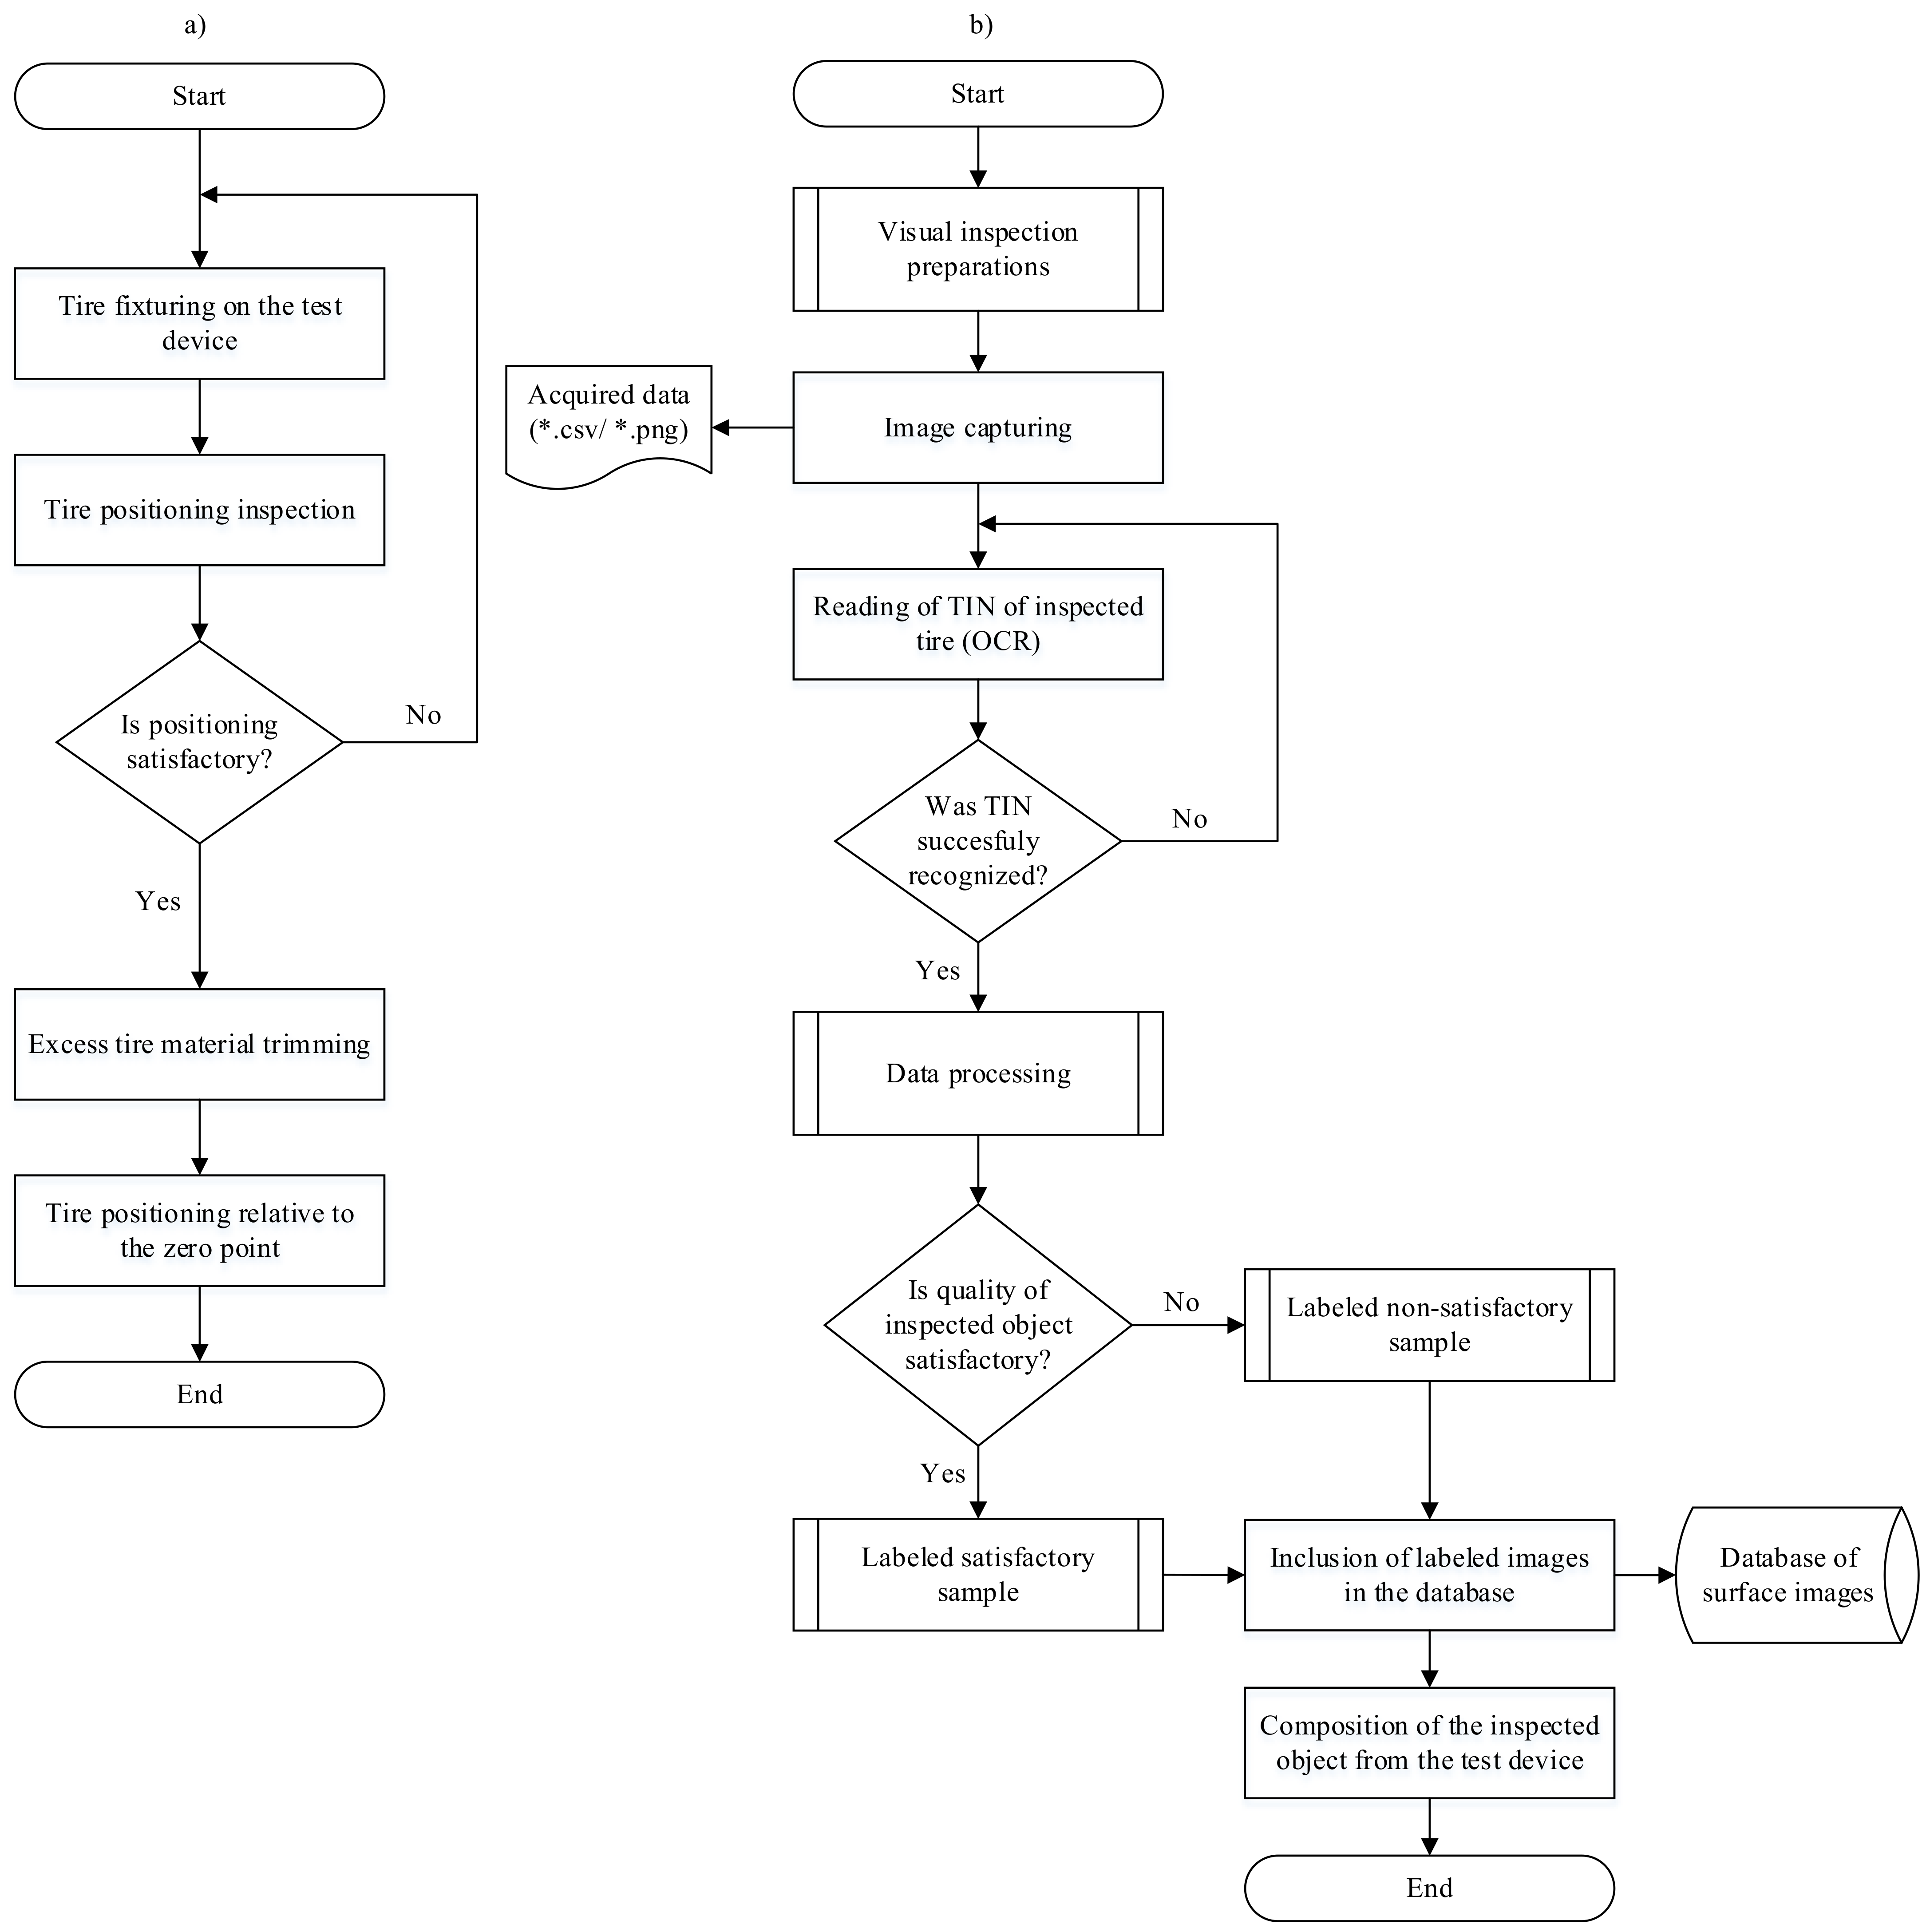
Designed visual inspection process on the testing rig runs as shown in the flowchart in (
Figure 11b) where the first proposed step after the start is “Visual inspection preparations” (
Figure 11a). This sub-process includes other processes shown in the aforementioned flowchart.
The aforementioned sub-process includes, in the first place, setting the tire to the desired position on the testing rig and clamping it. This action is followed by a check of the establishment, when the positive evaluation process (“Yes” option) continues the preparation process. If the alignment of the tire is evaluated to be unsatisfactory (“No” option), the alignment and clamping process is repeated until it is satisfactory. The evaluation of the correct positioning of the inspected product will be ensured by means of the chosen scanning technique used for the overall visual inspection.
After setting and clamping the tire, the next step is to cut the excess material using specially designed trimming knives. There is a possibility that in practice this step would prove difficult due to the generated waste on one device together with visual inspection. In such a case it would be necessary to perform it before the tire is set and clamped. The last step of the thread described would be to position the tire in position relative to the determined zero point, when it would be possible to scan its identification code.
3.1. Deep Neural Network Selection and Data Preparation
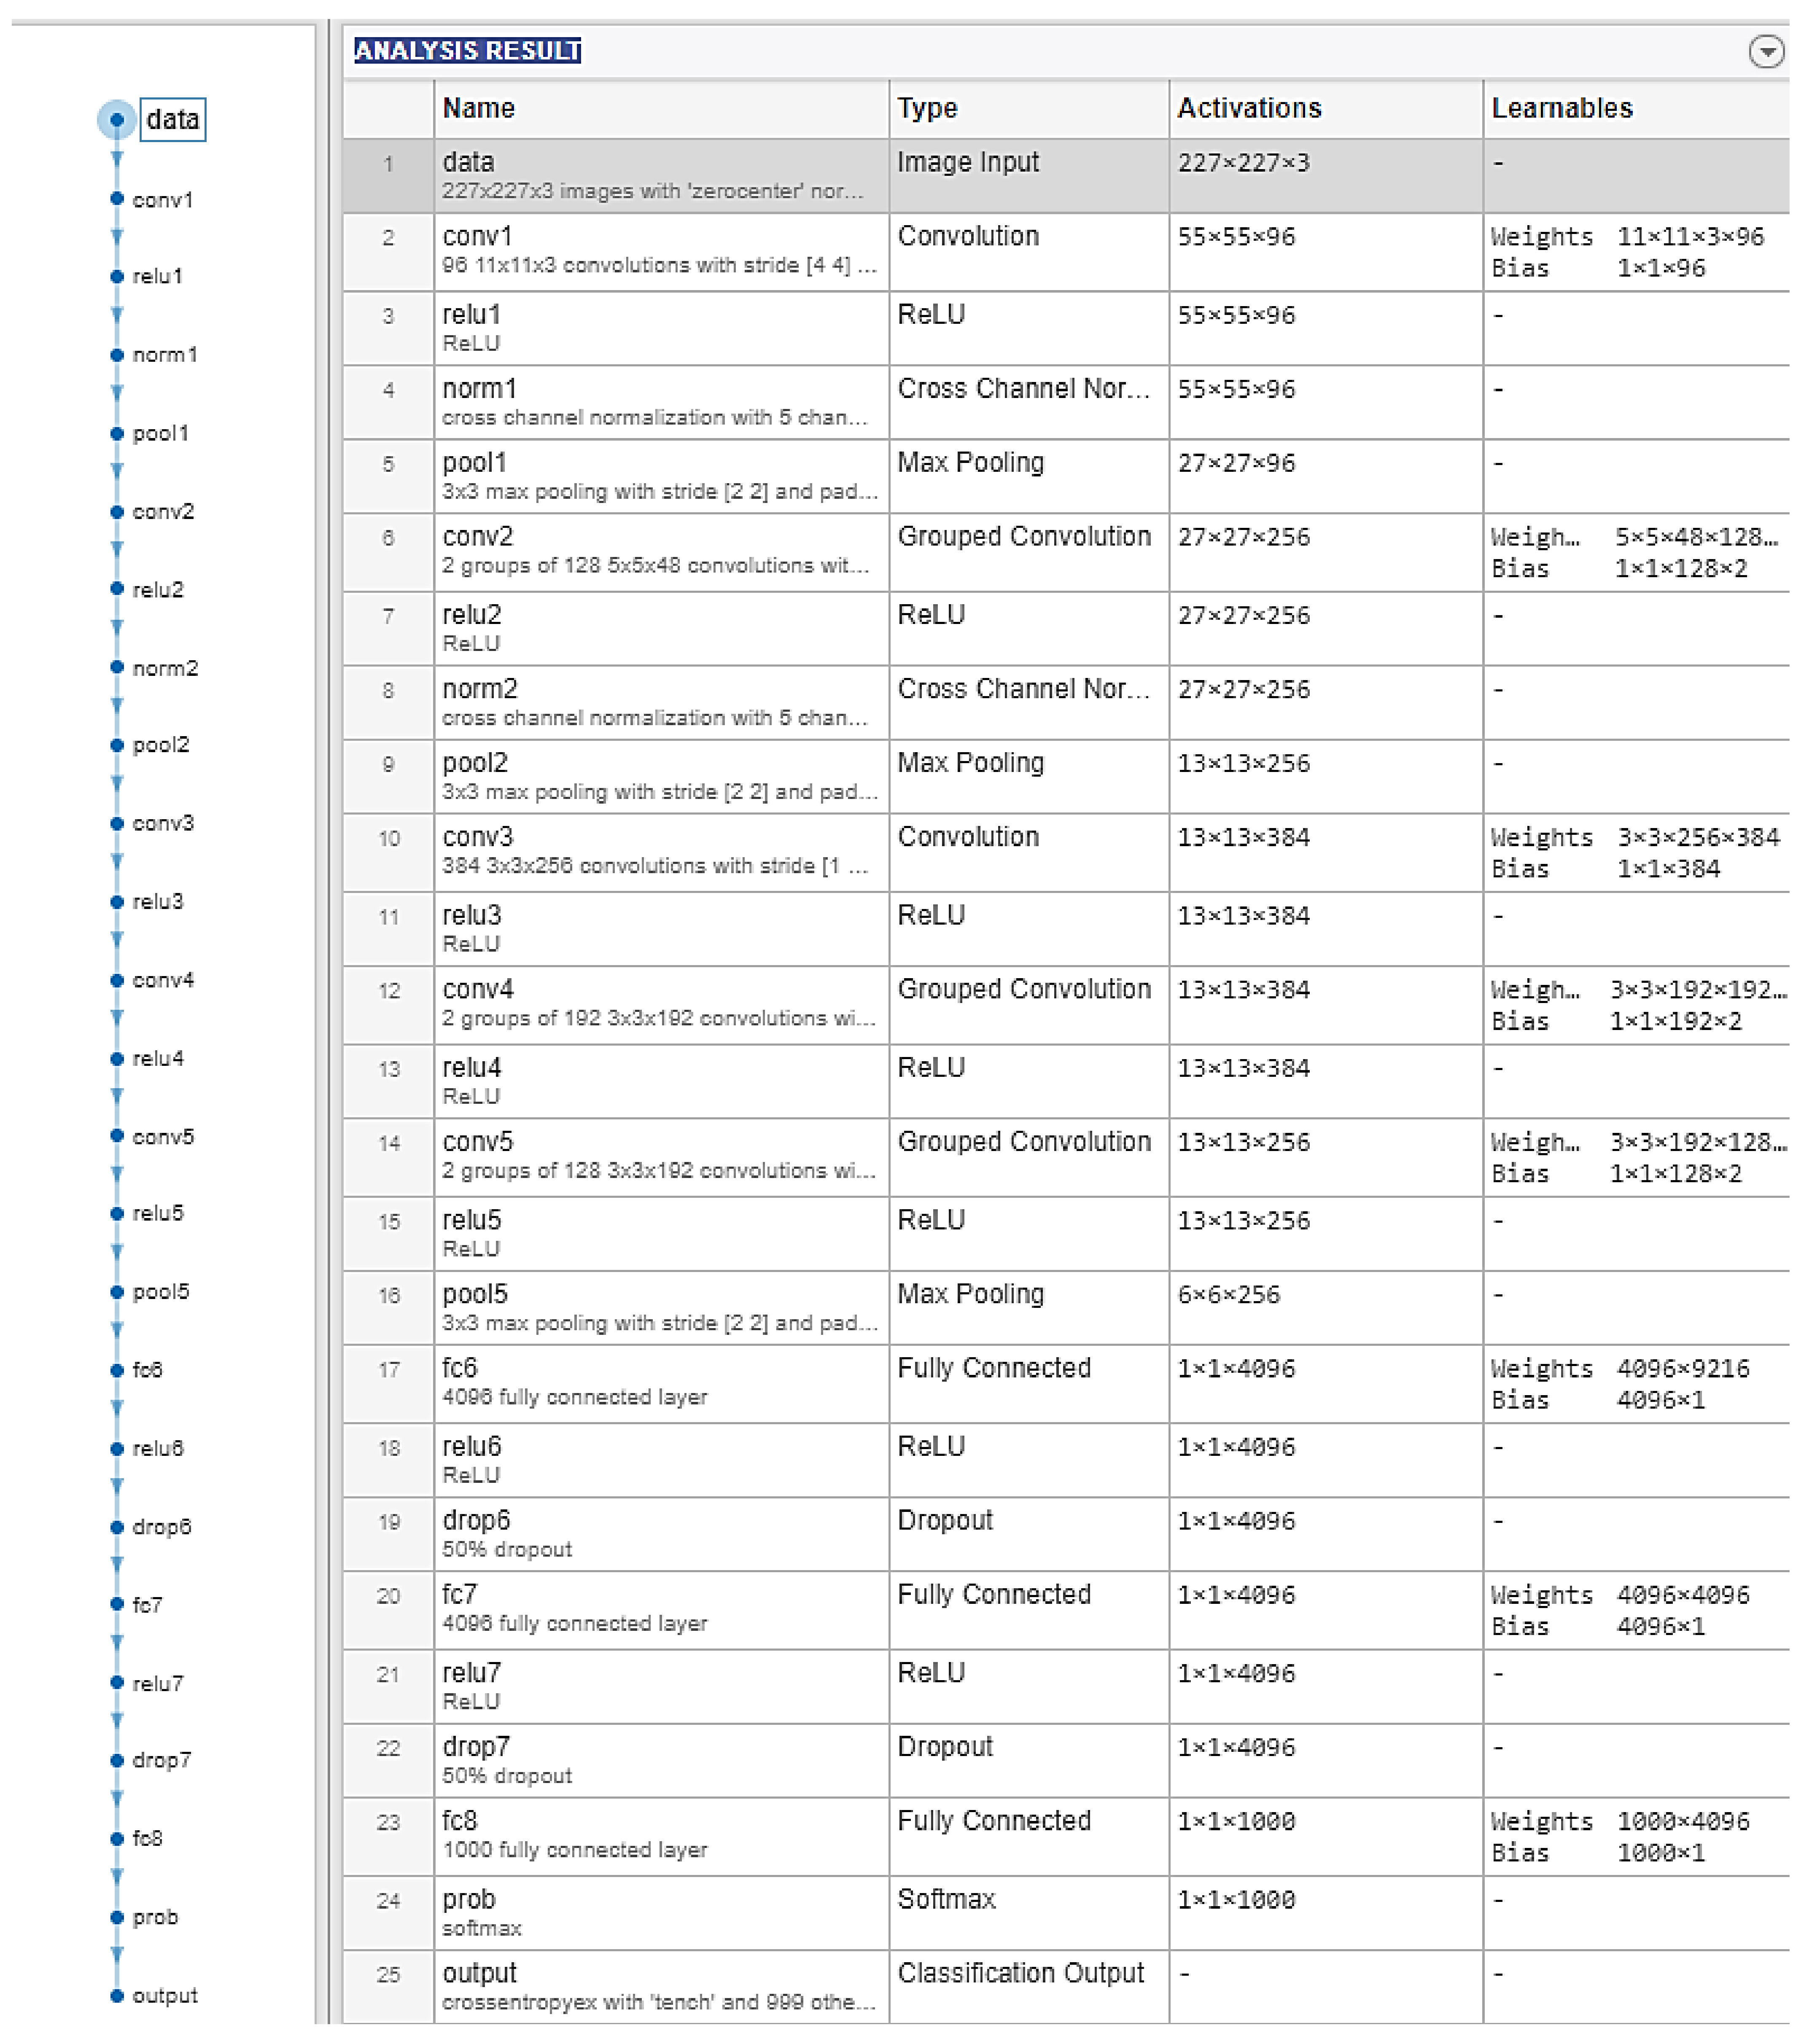
For the purpose of Transfer Learning in this research, the AlexNet network was chosen [
13]. The algorithm will take care of the classification of the selected area with the expected occurrence of the searched objects. The AlexNet network was created by Alex Krizhevsky under the leadership of Geoffrey Hinton in 2012. The network consists of 25 layers and ranks among convolutional deep neural networks. It is trained on 1,200,000 high-resolution images from the LSVRC-2010 ImageNet dataset, which divides into 1000 different categories [
14,
28].
As mentioned, the used network is pre-trained to determine up to 1000 categories of objects and in the case of the given task solved only six defect classes (CH01-CH06). Transfer Learning used without changing only the first 22 layers of the network. The last three layers, which were directly related to the number of classified classes, were changed according to the needs of the solved task. The layers that have been modified are “fc8” (Fully connected layer), “prob” (Softmax Layer) and “output” (Classification Layer).
The images obtained from the industrial camera were of the size 2000 × 3736 pixels after trimming the redundant areas and monochrome in the *.png format. These images had to be adjusted so that the input layer (“data”) of the selected network could process them. The input layer of the AlexNet network requires data with parameters 227 × 227 × 3. This means that the resolution of images entering for network processing should be 227 × 227 pixels, and the network requires three-channel RGB images. In view of these facts, the input data had to be adjusted to meet these conditions. For this purpose and also for the purpose of training data quantity enlarging, the imageAugmenter function and the gray2rgb function were used.
The input layer of the network requires images with certain parameters and also the used detector receives only a certain type of data. In the case described, the data entering the detector must be in the form of a table, in this case with two columns. The first column represents the path to the image on the disk and the second column consists of four values that define the location of the bounding box of the searched objects created in the “Image Labeler” application.
The aforementioned application allows you to upload images from a specified folder on the hard disk and use one of three methods (defining frames, lines and marking individual pixels), define areas where the searched objects occur, and thus prepare the input data for learning. The output from the object marking application is a file in *.mat format and contains the so-called “Ground Truth” which represents the aforementioned designations of areas of interest in the pictures. In the program, these labels are stored in the Truth variable. In order to be able to use this data together with images for detection, it was necessary to use the combine function, which was used to create a combined data repository with images and the corresponding values of the location of the boundary frames of the elements. Subsequently, a table was created using the objectDetectorTrainingData function, which was used as input data for the detector.
3.2. Object Detector and Training Options
In order to detect objects using neural networks in images, several methods can be used in MATLAB software [
29]. Within the solution of the problem of this work, the most used object detectors YOLO, ACF, SSD, R-CNN, R-FCN, ACF and its variations were considered. From previous experience and further research ongoing at the department, the use of the R-CNN detector seems to be a suitable approach for these testing purposes.
Although this type of detector has several disadvantages compared to other algorithms, such as longer training time and the associated problematic use in real-time applications, its advantages are an excellent ability to detect even small objects, and in conjunction with the use of the Transfer Learning method, its relatively simple implementation. This makes it a suitable choice for the purpose of fulfilling the aim of this research.
The applied R-CNN model consists of four basic steps:
- –
Selection of expected areas of interest;
- –
Extraction of elements using a deep convolutional neural network;
- –
Classification of elements using the selected model;
- –
Marking the classified elements in the image with a bounding boxes.
After loading and appropriate editing of input data, training settings were defined. A pre-prepared “optimization algorithm” called stochastic gradient descent with momentum (SGDM) was used in this process, and adjusted values of some training parameters were added to it. Major modifications of the chosen deep neural network were described above, but there was also need to change some of training options, to reach required level of prediction precision. Selected parameters are:
- –
‘MiniBatchSize’, 32, the default value SGDM setting of 128 and represents a subset of training data intended for subsequent evaluation of the network training and adjustment of weights.
- –
‘InitialLearnRate’, 1e-6, which was changed from 0.01 to 0.000001. The smaller the value of this parameter, the longer the training takes, but the network should achieve better results under favorable conditions.
- –
‘MaxEpochs’, 10, specifies the maximum required number of epochs where an epoch represents one whole course of the algorithm training on the training set.
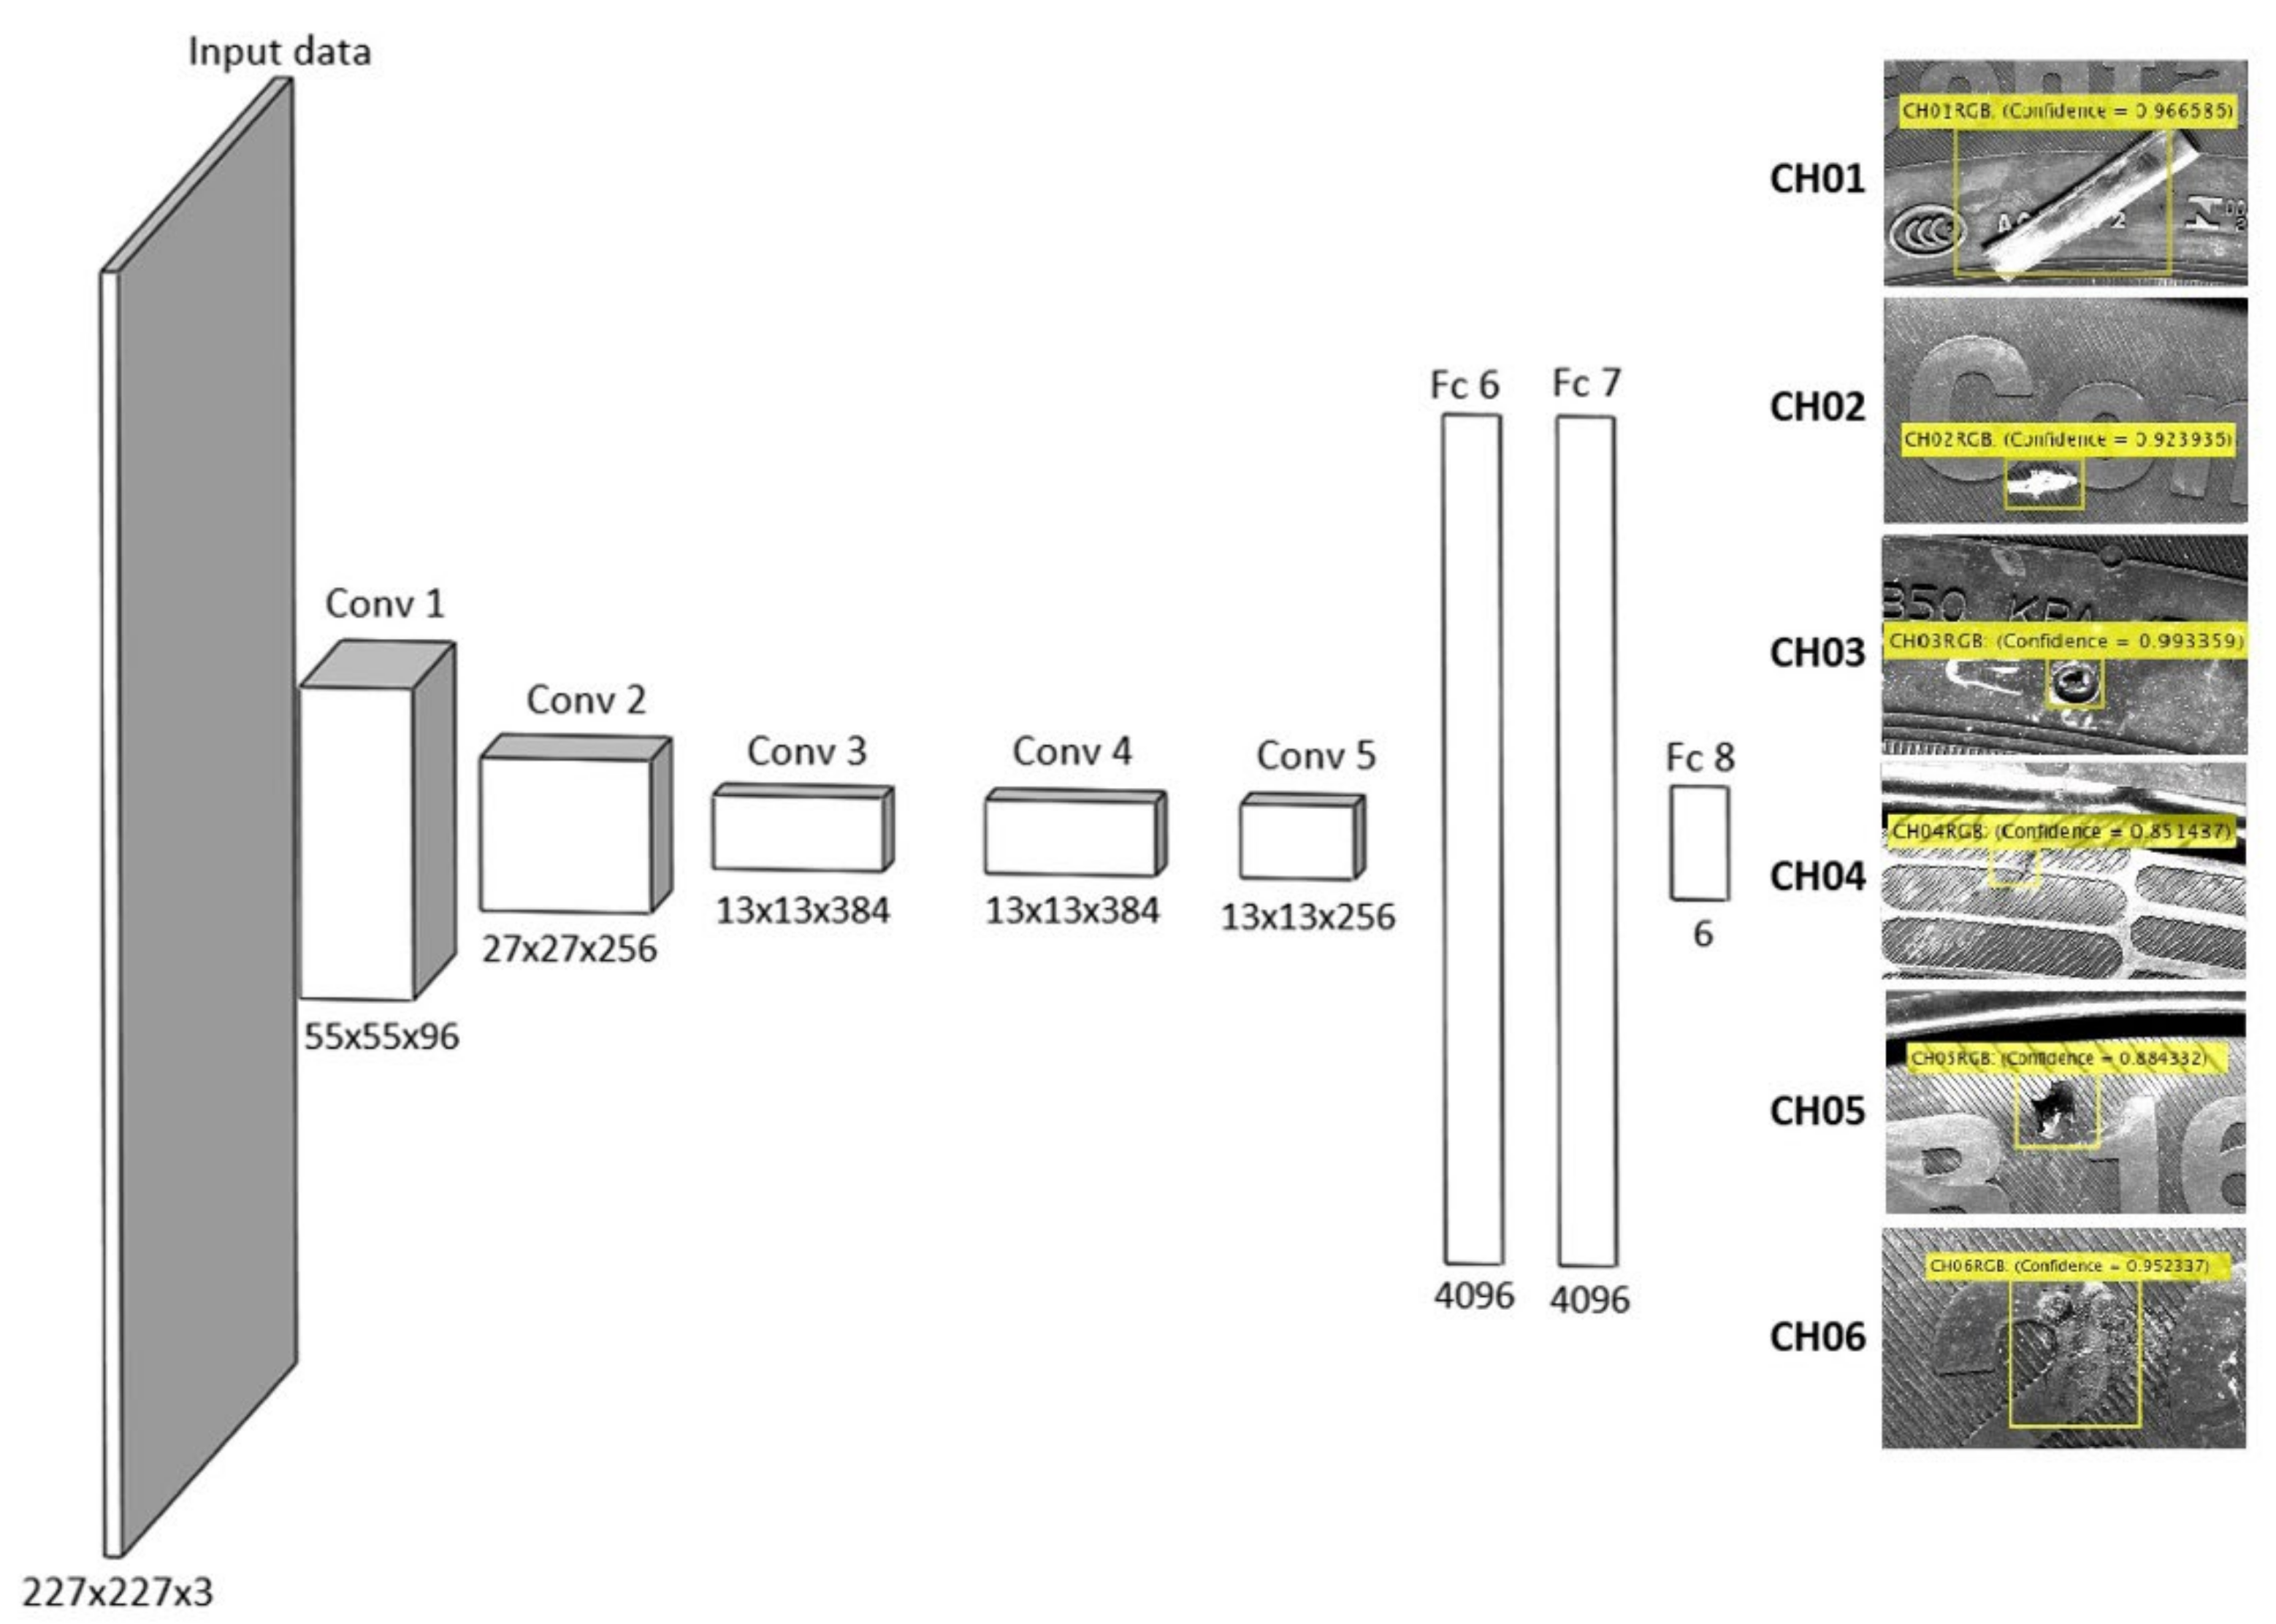
The code written in Matlab R2020a was subsequently applied on real data obtained by scanning the tire surface using a selected industrial camera under predefined conditions. The test images were not included in the training phase in order to verify the real functionality of the system and thus created for the detection of selected types of defect. R-CNN detector was trained for each one of the chosen defects, using 60 images with a given type of individual defect. The architecture of the convolutional neural network for object detector was developed on an AlexNet pre-trained network basis, in a similar way to [
29], available in Deep Learning Toolbox™ of Matlab/Simulink (Mathworks). Transfer Learning was used via the replacement of the last three layers by new layers to perform net training for our task and to obtain final network architecture and a setup suitable for our object detector (see
Figure 12 and
Figure 13). The last layer (Fc8) provides the final decision-making for individual defects CH01-CH06.
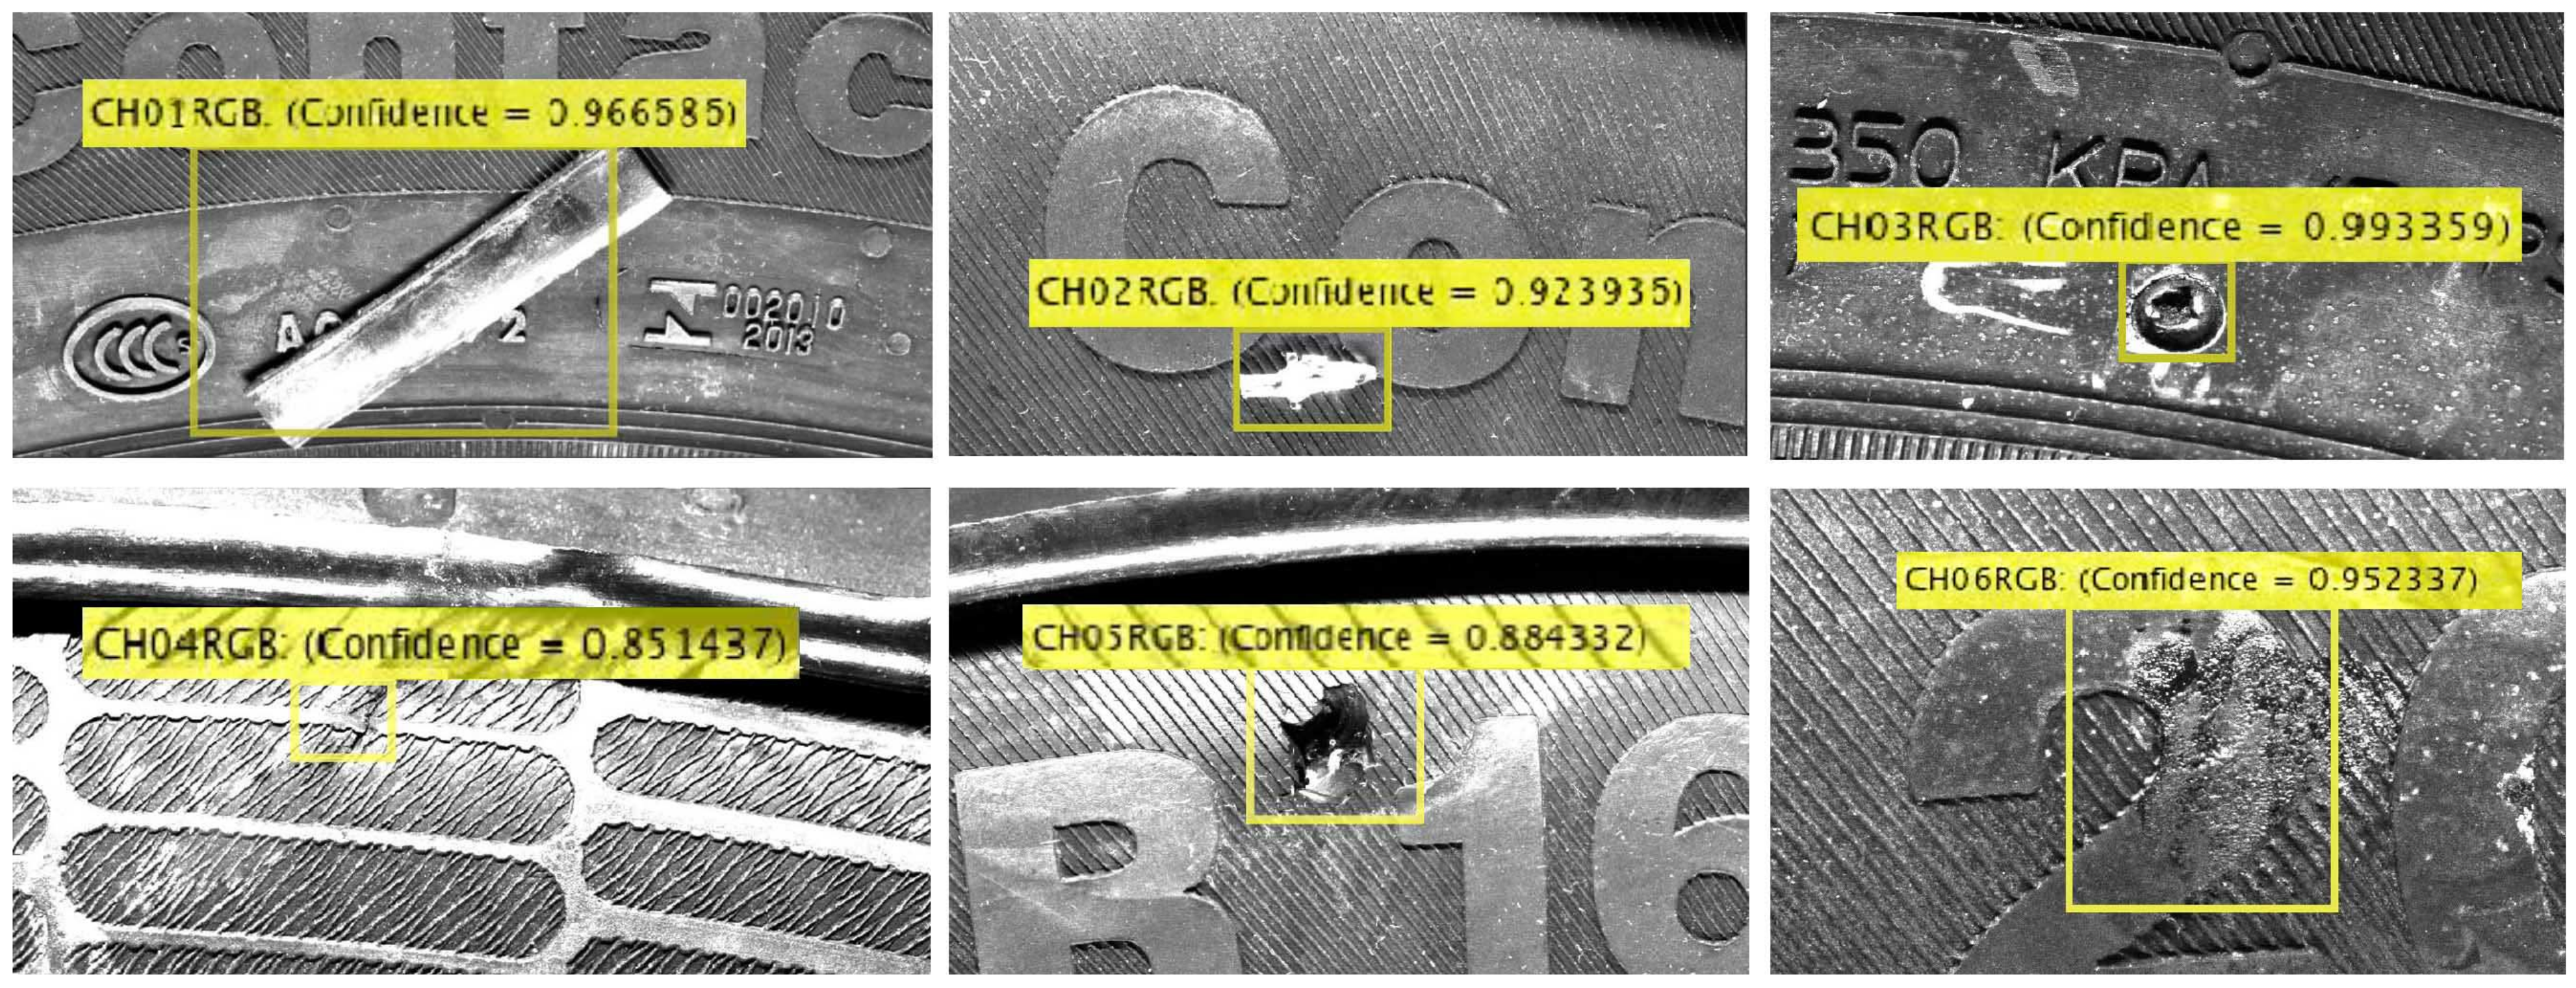
3.3. Object Detection Results
Figure 14 shows the chosen detection results performed on random tire pictures with the occurrence of all types of predefined defect. For all types, the test results were satisfactory on all test images, except for the CH04 type. CH04 is designation for cracks, notches and fissures, which are probably the most difficult to detect with the naked eye. These elements are usually small in size and often merge with the texture of the captured object. Minor problems also occurred with elements that were much larger in test images than in training images. In these cases, only part of the defects were marked and not its entire surface. However, this fact does not represent a big problem in the case of the given task, as the proposed procedure is for the first step of the inspection of the examined object. In this step, it is evaluated whether or not any defect occurs on the tire and not its exact position and severity.
4. Results and Discussion
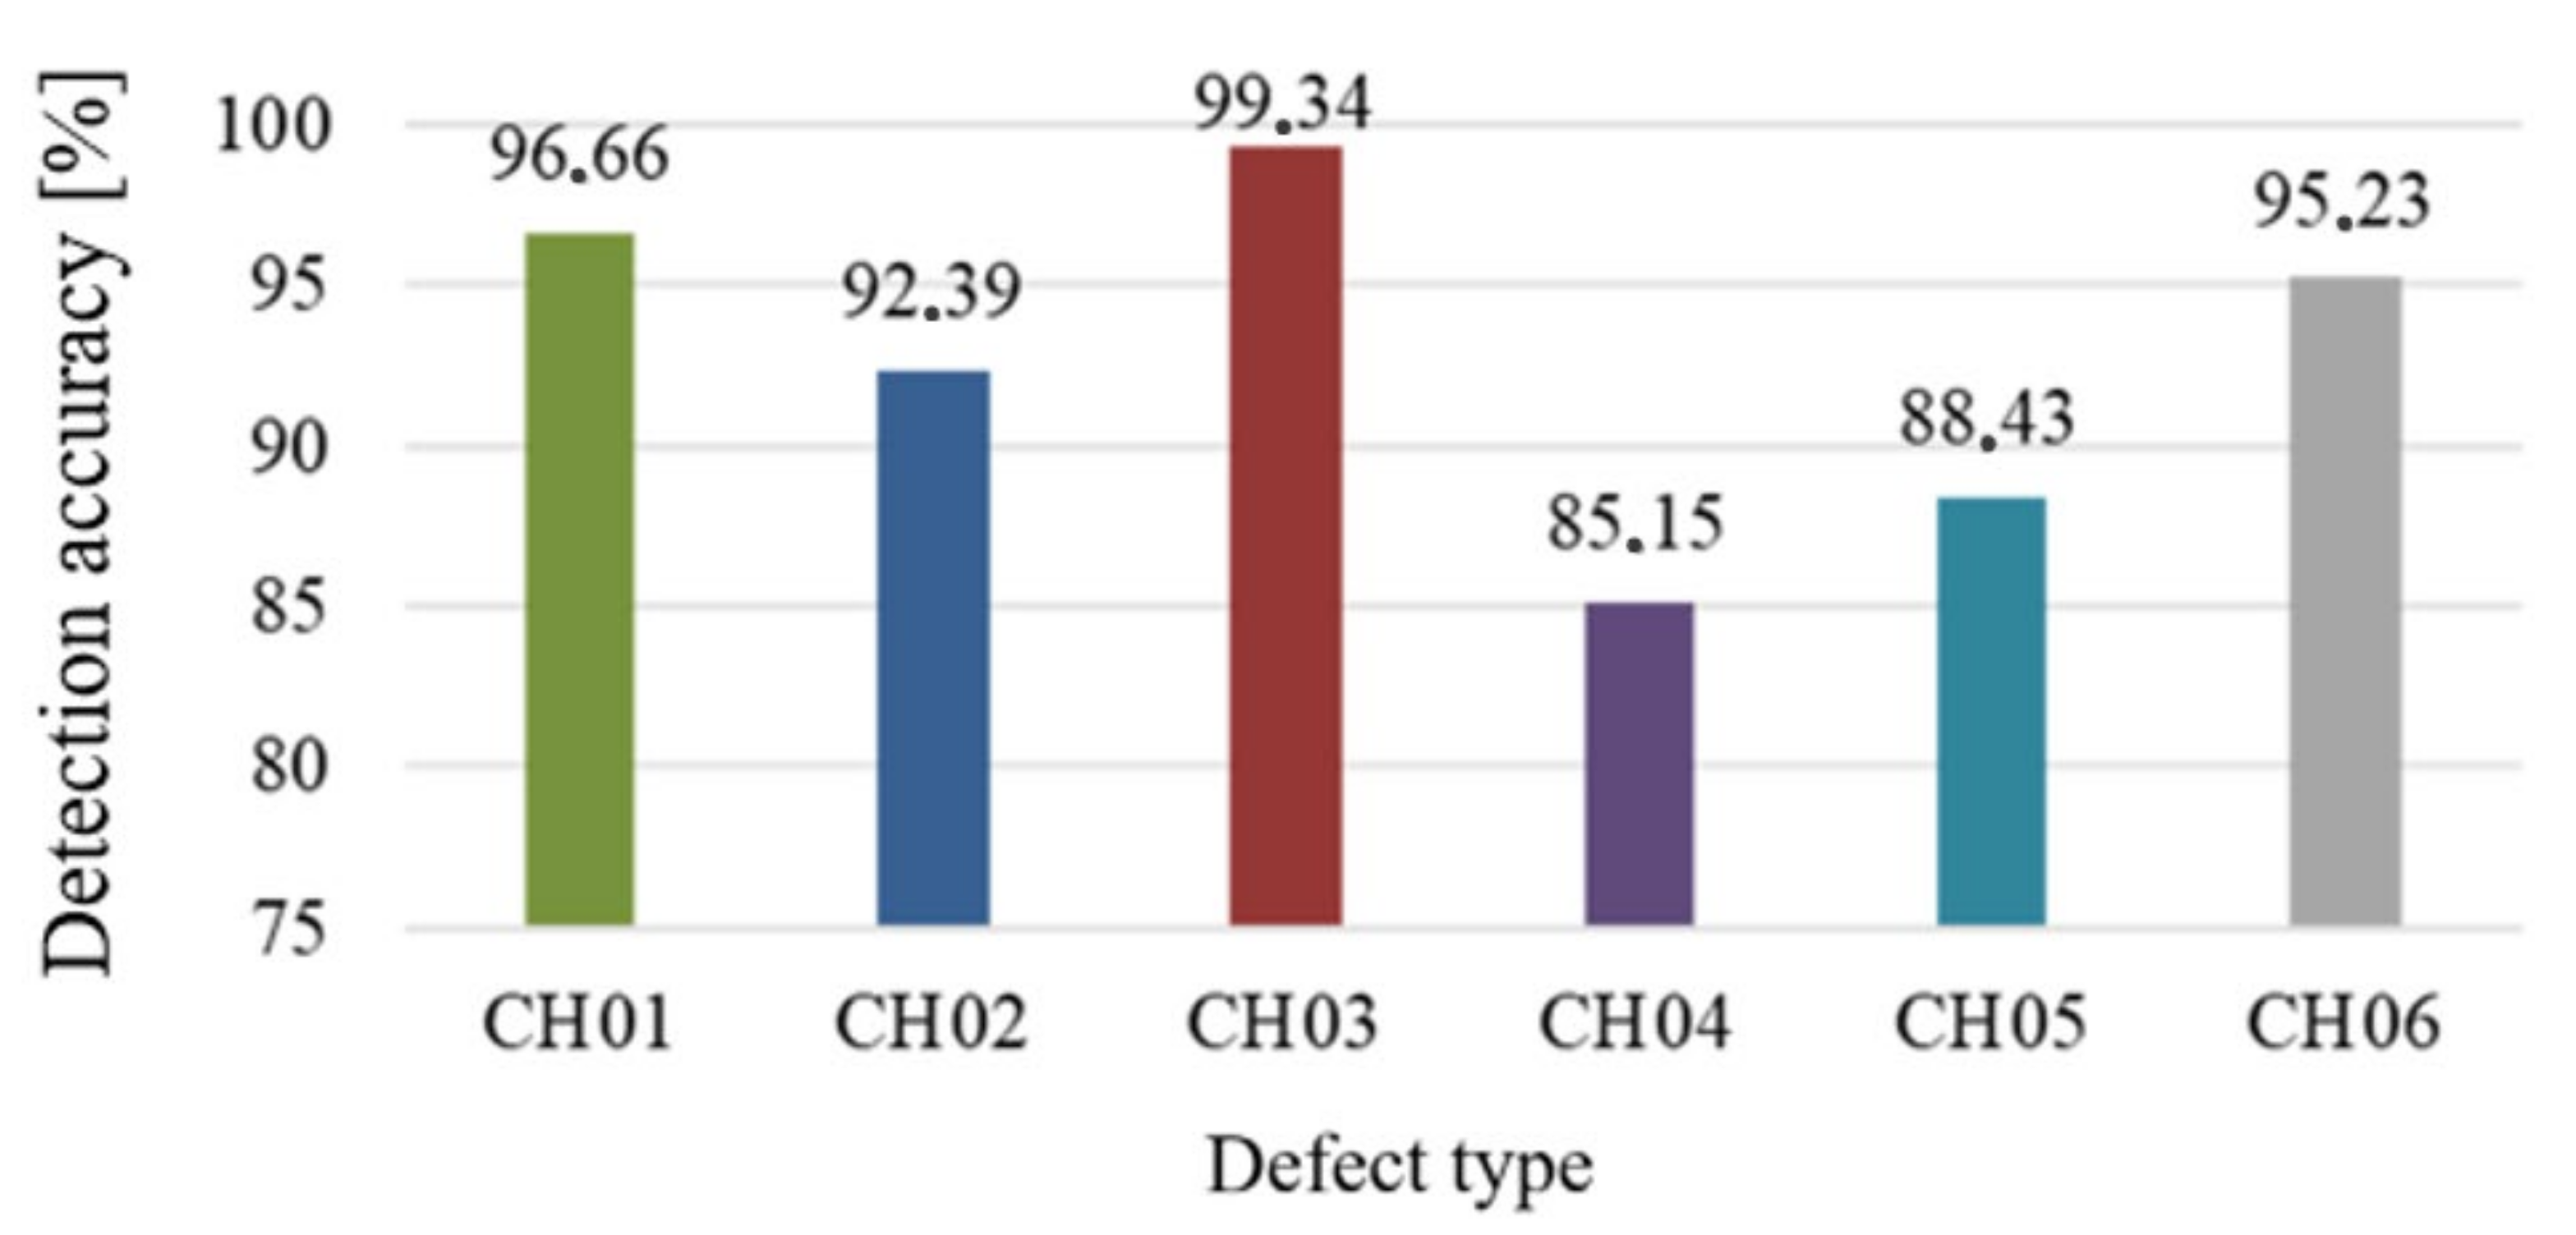
Testing of pre-trained object detector performance was determined for each type of chosen defect on several selected images, while the graph in
Figure 15 shows the best achieved results for each type. Defects were detected on the test images using the pre-trained AlexNet classification network and the R-CNN detector with modified SGDM optimizer. When training for a specific tire defect detection task, a combined dataset of 60 images was used for each type of defect with boundary boxes indicating the area where the defect occurred. During network training on these images, the confidence of defect detection and localization on the default “mini-batch” sample was achieved at the level of 90.63–100% and network training lasted on average from 4–25 min depending on the type of defect and the quality of input given. In subsequent testing of the network’s success on selected test images of types CH01 to CH06, the highest values of successful defect detection certainty were achieved from 85.15% for CH04 to 99.34% for CH03 samples (
Figure 15).
Although high detection confidence was achieved in most test samples, in some cases the elements were either detected incorrectly or not found by the system at all. Problems related to these results could be solved by designing a specific deep neural network for a given task. However, as already mentioned, in order to train such a network, it would be necessary to have a minimum number of 1000 marked images for each detected class, therefore such a solution will not be possible in experiments performed with the limited amount of training samples in the workplace outside an actual production line.
Based on the results displayed in
Figure 15, it can be concluded following statements. The first statement is based on the different values of the individual defects CH01 and CH02, which represents a similar type of defect but with a different material. A better result is obtained for defect CH01 due to impurities of the same material as the tire. The defect CH01 is categorized as the defect from the same material as a tire and displaying these defects in the data can be presented as homogeneous. The highlighted parts of defects depend on the shape, topology, relative position of the defect to the light source, and type of light system. The CH02 includes other impurities with different types of material than rubber, so the defects are captured and visualized by a colour spectrum. This issue is suitable for future work as well, for exploring more possibilities, and for conditions aimed at improving defect detection of variable types of material. The lowest confident value of defect detection is for CH04. The cracks or tears (CH04) can be classified as very difficult objects to capture in the data due to their topology and edge occurrence which can be highlighted under the light only to a limited extent. A very similar issue is with defects of the type CH05 as mechanical integrity damages. The highest values of detection are CH03, CH01 and CH06 generalizable to defects with the same material as the inspected object (tire) with a difference in shape and surface topology. Based on the aforementioned, it can be concluded that for successful implementation of a visual inspection system in tire production (detection and correct classification of all defects) there are key dependencies, both in terms of software and hardware design that provide data with sufficient quality and a well-known set of properties.
5. Conclusions
Visual inspection of finished products is one of the steps to achieve the high quality of products offered on the market and manage the reliability of services. In mass production inspection systems, machine vision has long been used, which can in some way process the visual data obtained by the camera and thus ensure the control of the presence of certain elements on products or products themselves. Further classification of these objects can then be based on reading barcodes and other types of codes, or inspect their shape and presence in the prescribed area. In industry, however, there are cases where the products need to be visually inspected, but the use of conventional systems for visual inspection is not sufficient. The reason may, for example, be the complexity of the product, the quality of its surface, the inability to ensure sufficiently constant conditions for sensing the surface, frequent changes in the shape and dimensions of the sought defects and others.
At a time when artificial intelligence is experiencing the greatest development so far, such an approach allows the use of machine vision in the field of visual control even in conditions where classical approaches to machine vision are no longer sufficient. The use of convolutional neural networks has proven to be a suitable method for image processing. Their subsequent training on the required type of data allows them to be used for example, to detect objects in the images, and such an approach to the problem of detecting selected types of defect on car tires was used in this particular paper.
In order to obtain data from the surface of car tires, the method tested uses an industrial camera in combination with a suitable lens and lighting. As part of the preparatory phase of the experiment, several combinations of camera types, lenses and lighting methods were tested. The analysis of the obtained results shows that for the purpose of obtaining test images, a suitable choice is a monochrome 12 Mpx camera BVS CA-M4112Z00-35-000 with a Tamron BAM LS-VS-007-C1/1-5018-C lens and two 200 mm-long bar red LED lights. The data from the equipment used were subsequently processed using a common personal computer with the necessary software. Due to the results of previous research, the primary method of obtaining visual data from the tire surface was chosen to scan the surface using the industrial camera and their subsequent processing in MATLAB 2020a software.
As a solution to the problems described above, the use of deep convolutional neural networks and the R-CNN element detector seems to be right. As part of the experimental part of the paper, a method of detecting defects on tires in this way was proposed. Due to the insufficient amount of input data, the principle of Transfer Learning was used, where no special deep neural network is created, but an already pre-trained network (AlexNet) is employed, modified (last three layers) and trained again on a smaller sample of our own data. By applying the Transfer Learning approach, we were able to accelerate the development of our own system for optical defect detection even on a relatively small sample of data. Implementation and verification of such an approach together with the designed methodology of a tire visual inspection process (flowchart shown in
Figure 11) to obtain improved classification results for six different defects can be considered as the main novelty of the presented research. It was possible to design and train an object detector by using such an approach, which with a success rate in the range of 70–99% can detect certain types of defect in the training samples of the examined objects. However, in some cases, the proposed approach encountered problems, probably due to a lack of unique input data. The solution to this situation would be to build a specified deep neural network, layer by layer and then train it on a huge amount of data. The presented article also offers space for training other types of neural network and detectors in connection with the use of the proposed methodology in the control of other products, when common approaches to machine vision due to the complexity of these objects and defects do not allow the desired results to be achieved.


 ,
, 
