Article

Varietal Discrimination of Trebbiano d’Abruzzo, Pecorino and Passerina White Wines Produced in Abruzzo (Italy) by Sensory Analysis and Multi-Block Classification Based on Volatiles, Organic Acids, Polyphenols, and Major Elements

by
Alessandra Biancolillo
1,
Angelo Antonio D’Archivio
1,*,
Fabio Pietrangeli
2,
Gaia Cesarone
1,
Fabrizio Ruggieri
1,
Martina Foschi
1,
Samantha Reale
1,
Leucio Rossi
1 and
Marcello Crucianelli
1
1
Dipartimento di Scienze Fisiche e Chimiche, Università degli Studi dell’Aquila, Via Vetoio, Coppito, 67100 L’Aquila, Italy
2
Dipartimento delle Politiche dello Sviluppo Rurale e della Pesca, Regione Abruzzo, Via Nazionale 38, Cepagatti, 65012 Pescara, Italy
*
Author to whom correspondence should be addressed.
Appl. Sci. 2022, 12(19), 9794; https://doi.org/10.3390/app12199794
Submission received: 28 July 2022 / Revised: 23 September 2022 / Accepted: 26 September 2022 / Published: 28 September 2022

Abstract

:
Reliable analytical methods able to establish wine authenticity and compliance with the origin/variety denomination are essential tools for the safeguarding of consumers from fraud. In this work, we attempted the discrimination of certified monovarietal white wines produced in the Abruzzo region (Central Italy) in 2015 with Trebbiano d’Abruzzo, Pecorino or Passerina grapes, all belonging to the Trebbiano variety. A preliminary sensory analysis revealed a high similarity among the three wines. The aroma profile and polyphenol and organic acid profiles were collected by gas chromatography and ultra-high-performance liquid chromatography, respectively, on 46 samples representing the three wine varieties. Eventually, the concentration of 14 elements in the same samples, determined by inductively coupled plasma optical emission spectrometry, was considered. Partial Least Squares Discriminant Analysis pursued on the individual analytical responses gave unsatisfactory results in terms of varietal discrimination. A data fusion approach, Sequential and Orthogonalized Partial Least Squares Linear Discriminant Analysis, on the other hand, provided better results as it misclassified only three (out of eighteen) external samples. Tartaric acid, malic acid, Cu, Na, Ni, Sr, Ca, Fe, 3-methyl-1-butanol, 2-methyl-1-butanol, ethyl hexanoate, and 2-phenylethyl acetate were found to be the variables relevant in the discrimination of the three monovarietal wines.

1. Introduction

The white wine Trebbiano d’Abruzzo, together with the red variety Montepulciano d’Abruzzo, are emblematic of the viticulture in Abruzzo, a region located in Central Italy extending from the heart of the Apennines to the Adriatic Sea (Figure 1), which is the fifth Italian region for wine production [1]. Trebbiano d’Abruzzo wine, the third Italian white wine in terms of quantitative production after Prosecco and Soave, is obtained by the homonymous Trebbiano Abruzzese and Trebbiano Toscano grapes extensively cultivated in the hills next to the coastal territory and some internal areas of Abruzzo (2804 and 5213 ha, respectively, in 2015). The Pecorino cultivar belongs to the Trebbiano family, as well. Its name comes from the Italian word for sheep (“pecora”) and remarks upon the fact that it was the only kind of grape that could be eaten by sheep during the transhumance, because of its early ripening compared to other local varieties. This grape cultivar was thought extinct, until some cuttings were taken from wild-growing plants found in the neighboring Marche region in the 1980s and re-implanted. Following this, the production of Pecorino in the Abruzzo and Marche regions has grown exponentially: the global area cultivated with Pecorino grapes in Abruzzo, for instance, has increased from 22 to 1080 ha in the years between 2000 and 2015, which is reputed as the fastest growth worldwide in the cultivation of a grape variety. Passerina white grape is also an ancient variety belonging to the wider Trebbiano family. Traditionally cultivated in the border area between the Abruzzo and Marche regions, Passerina, like the Pecorino variety, was replaced by the more-productive Trebbiano Abruzzese and Trebbiano Toscano varieties since 1960–1970 and was only recently rediscovered. The global surface of Passerina vineyards in Abruzzo increased, in fact, from 85 ha in 2005 to 369 ha in 2015.
Wine is often the subject of commercial fraud [2,3,4]; for instance, water, sugars, alcohol, sweeteners, and flavoring agents can be added illegally. Misrepresentation of the cultivar and the geographical origin is another form of fraud more difficult to uncover compared to chemical adulteration, and several cases have been documented in the last decades. In Europe, most of the wines of high quality and high commercial value are strictly linked to the production area and specific method of production, and, according to the EU regulations, are certified by Protected Designation of Origin (PDO), Protected Geographical Indication (PGI), or Traditional Speciality Guaranteed (TSG) marks. Several PDO wines are also produced with a single grape variety (mono-varietal wines). In this scenario, reliable analytical methods able to determine wine authenticity and compliance with the origin/variety denomination are essential tools for the safeguarding of consumers from fraud and for ensuring honest market competitiveness. For this purpose, specific analytical techniques based on categories of chemical species (volatiles, polyphenols [2,5], organic acids [6], trace elements [7,8], and isotopes [9], for instance) or spectroscopic methods [10,11,12] have been proposed. In this context, metabolomics plays an important role. Organic acids, phenolic compounds, and volatile components, in particular—whose content in wines is influenced by different factors, such as grape variety, geographical origin, vintage, and winemaking process—are not only powerful geographical/varietal markers but also affect the wine’s taste and aroma. Regardless of the analytical technique applied to characterize the samples, chemical information provided by both targeted or untargeted responses needs to be handled by suitable chemometric tools to differentiate or authenticate wines [4,13,14], for instance: Principal Component Analysis, Linear Discriminant Analysis (LDA), Partial Least Squares Discriminant Analysis (PLS-DA), or Soft Independent Modelling of Class Analogy (SIMCA). Because of the complexity of wine composition, application of a single analytical technique may be inadequate, especially in the discrimination of varieties produced with grapes of the same family and/or cultivated in close territories. On the other hand, data-fusion approaches, which can combine information arising from data of different natures in a single classification model, are expected to perform better than individual-block analyses [15]. Nevertheless, it is less common to find papers where data from different analytical platforms are jointly processed to classify wines according to their geographical or botanical origin [16,17,18,19,20,21].
In the present work, we analyzed certified mono-varietal wines produced with Trebbiano d’Abruzzo, Pecorino or Passerina grapes in specific territories with well-established reputations for their winemaking tradition, covering as much as possible the four provinces of Abruzzo region (Figure 1), and attempted a classification of the wines on a varietal basis. It must be remarked that the three grape varieties are not cultivated in specific territories but are widespread in the Abruzzo region, and the most prestigious vineries produce all the three kinds of wine. As previously discussed, in Trebbiano d’Abruzzo, Pecorino, or Passerina wines labeled as mono-varietal, misrepresentation of the grape variety represents a potential commercial fraud. In this context, the similarity of the grape variety and the common geographical origin make varietal discrimination a challenging issue. It follows that a single analytical technique might not provide sufficient information to differentiate the three wine varieties. To overcome such potential limitations, we characterized the three wine varieties by means of different, and somewhat complementary, analytical methods. In particular, a headspace (HS)-SPME method coupled with gas chromatography–mass spectrometry (GC–MS) was used to collect the aroma profile of the wine samples, whereas polyphenols and organic acid profiles were determined by means of ultra-high-performance liquid chromatography (UHPLC). In addition, the concentration of 14 elements (Ba, Ca, Co, Cu, Fe, K, Li, Mg, Mn, Na, Ni, Sr, V, and Zn), previously determined by inductively coupled plasma optical emission spectrometry (ICP-OES) [22], was considered. Further, a panel of experts conducted a sensory analysis on representative wine samples extracted from the same pool subjected to chemical analysis. Despite the fact that correlation between chemical data and sensorial properties is an attractive issue in the context of wine research, it must be noted that sensory terms used to describe the wines are generic (e.g., fruity, fresh) and are unsuitable as descriptors for the prediction of the grape variety [2]. To improve the discrimination of the three wine varieties, we combined chemical information provided by the three above-cited analytical techniques and processed the multi-block data by means of some innovative chemometric strategies. In particular, the experimental data obtained by UHPLC, ICP-OES, and GC–MS were handled by two multi-block approaches: Sequential and Orthogonalized Partial Least Squares Linear Discriminant Analysis (SO-PLS-LDA) [23] and Sequential and Orthogonalized Covariance Selection Linear Discriminant Analysis (SO-CovSel-LDA) [24]. The outcomes of the data-fusion strategies were compared to the results obtained by applying a common classification method, such as PLS-DA, on the individual experimental data blocks.

2. Materials and Methods
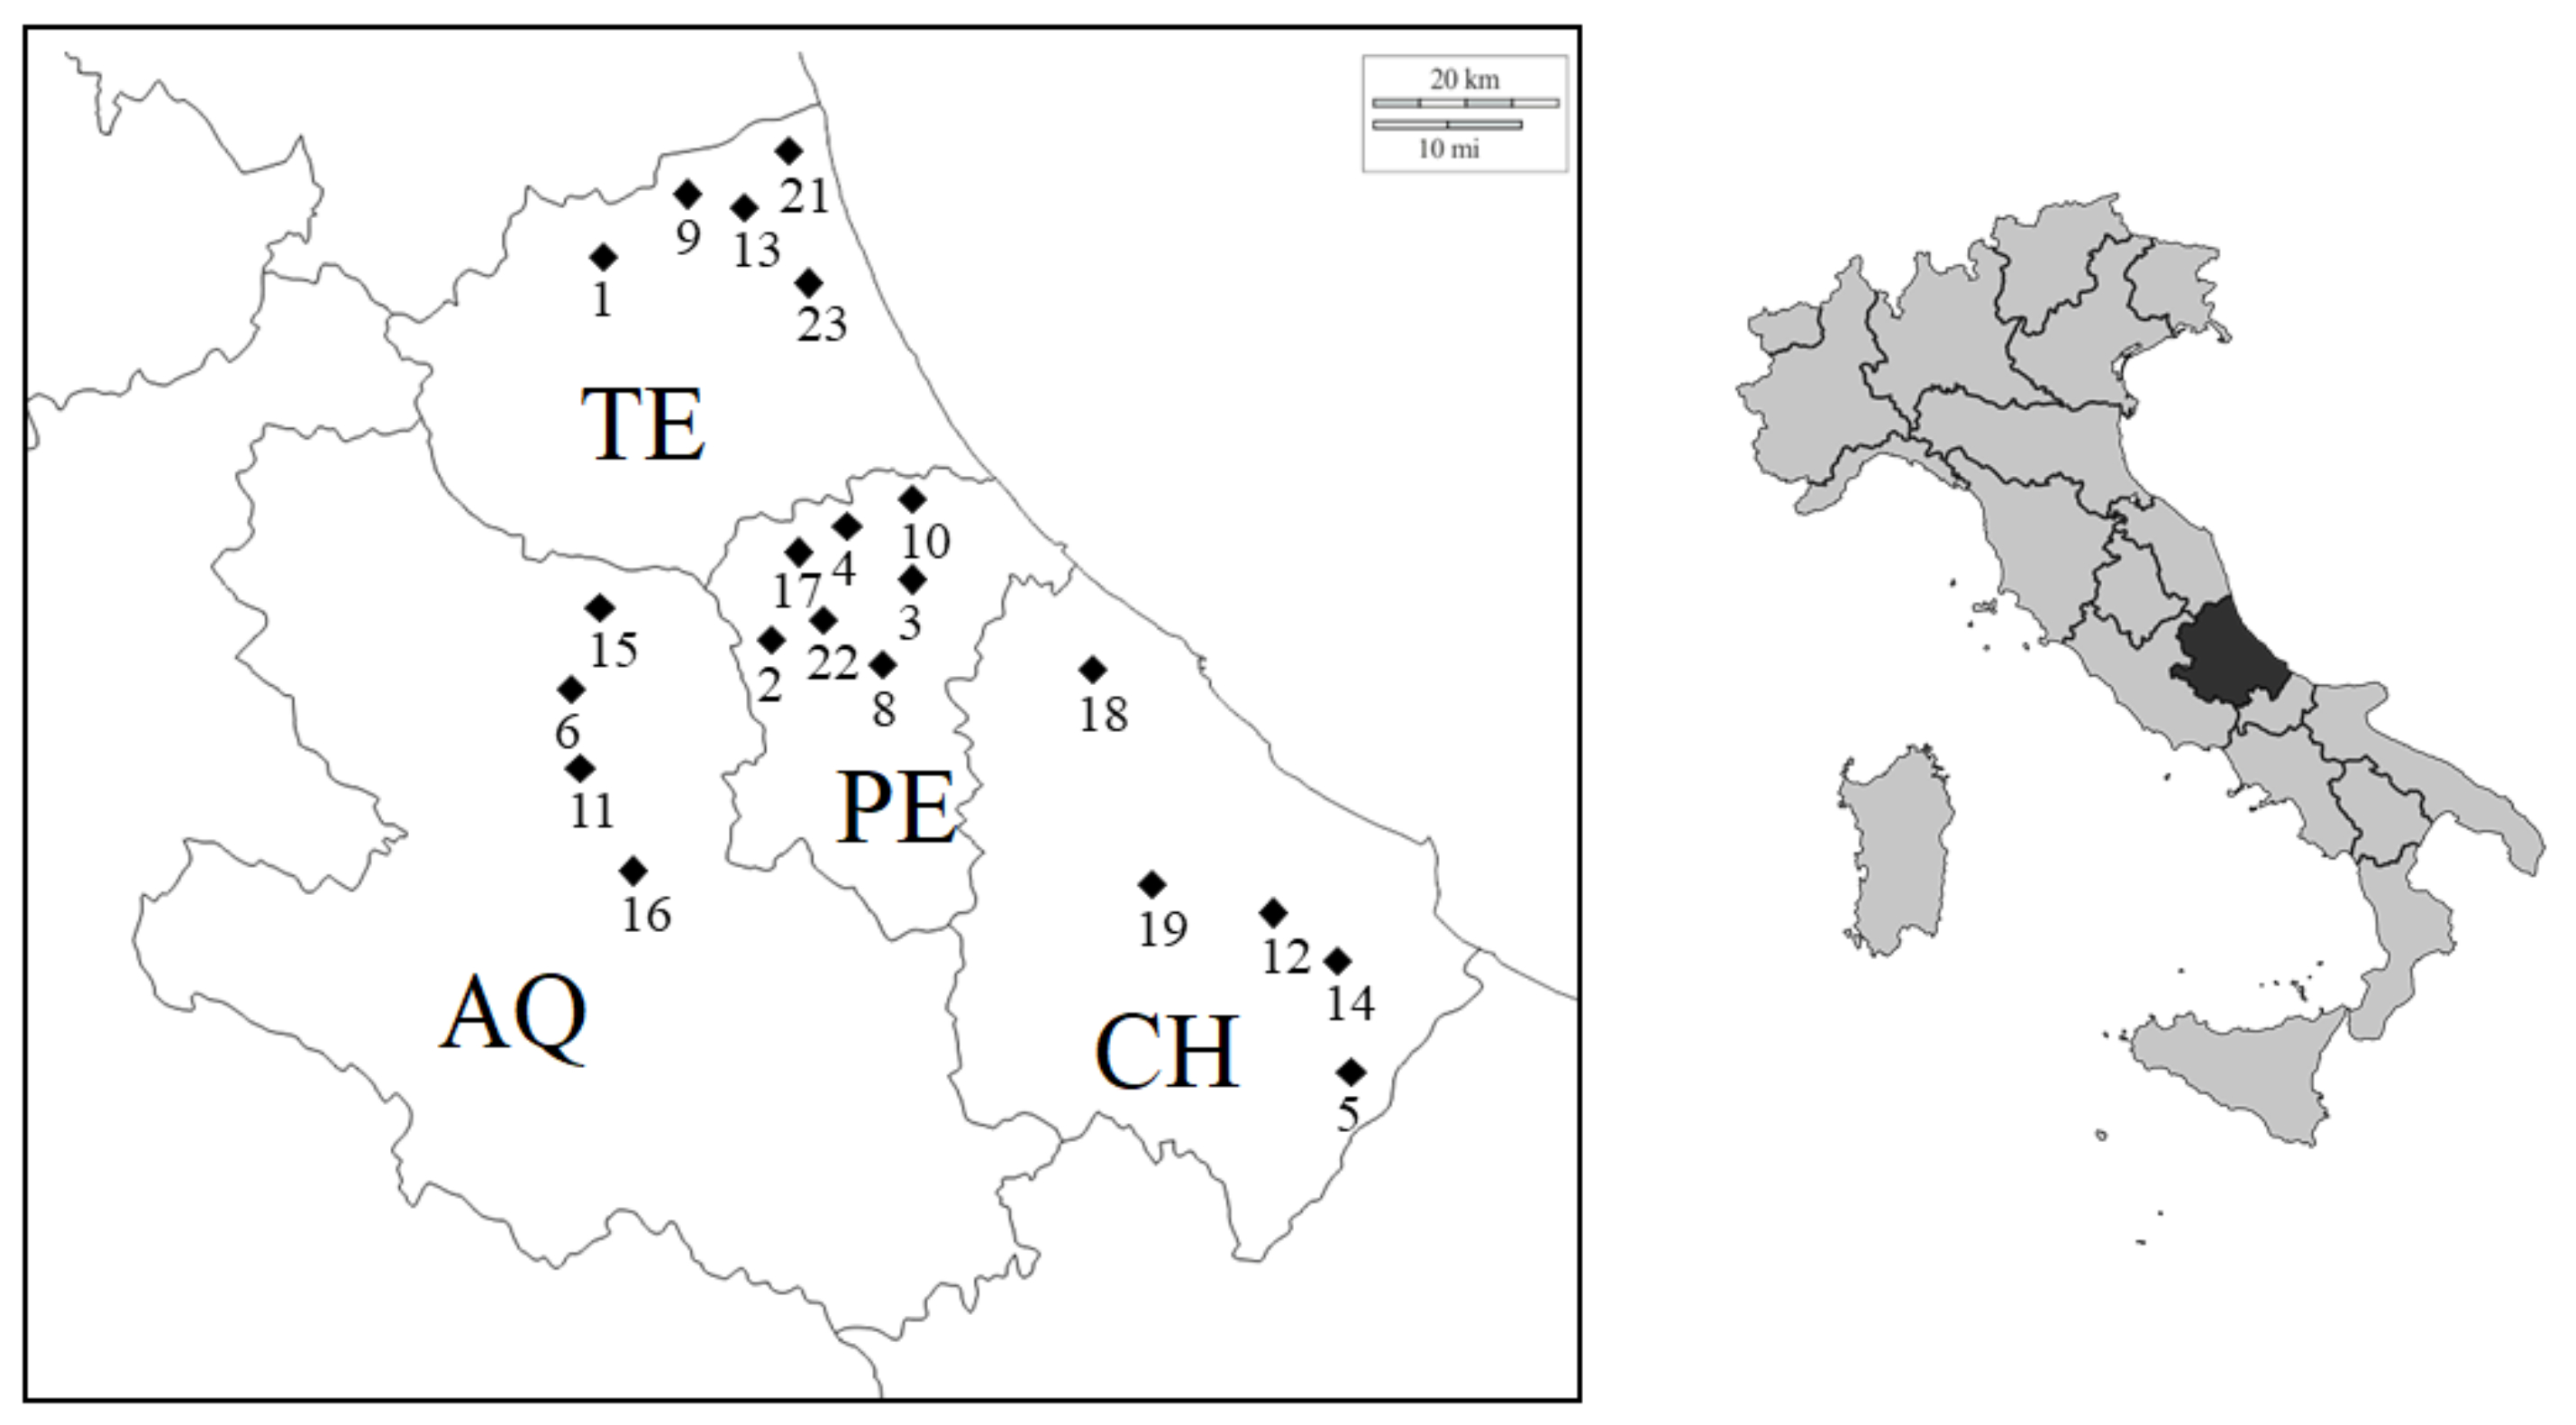
2.1. Wine Samples

Bottled white wines (2015 vintage) produced with Pecorino (18), Trebbiano d’Abruzzo (17), and Passerina (11) grape varieties in various sites of Abruzzo (Figure 1) were kindly donated by prestigious wineries that guaranteed their mono-varietal composition. The wines, labeled either as PDO or PGI, all sealed with a cork, had an alcohol content ranging from 12.0% to 13.5% (v/v) and the same aging in steel before bottling. The wine bottles were acquired between December 2015 and February 2016. To avoid alteration of wine composition and sensorial properties due to aging, the analysis of the aroma profile, polyphenols, and organic acids was carried out on freshly opened bottles within the period of May–July 2016.

2.2. Sensory Analysis

Sensory analysis was performed by a panel of nine expert judges (four females and five males, aged between 30 and 60), with more than ten years of experience as wine tasters or sommeliers, in July 2016. The sensory analysis was conducted in a professional room prepared in accordance with ISO 8589:2007 [25]. All the tastings were made in transparent glasses with a constant volume, 30 mL, in accordance with ISO 3591:1977 [26]. The wines were served anonymously, at a uniform serving temperature, and divided by type: first Passerina (10 samples), then Trebbiano d’Abruzzo (13 samples) and finally Pecorino (14 samples). Between two tastings, the judges were asked to rinse their mouths out with water, eat some plain crackers and finally rinse their mouths again with water. The sensory analysis consisted of 18 compulsory descriptors grouped by visual examination (color intensity and shades), olfactory (olfactory intensity and complexity, floral, fruity, and grassy as the main wine bouquet descriptors) and olfactory-taste (pseudo-warm sensation, softness, acidity, saltiness, body, intensity and persistence, evolutionary state, harmony, typological coherence, and score). Panelists rated each attribute on a scale from 1 (absence) to 10 (maximum presence); the wine score was assigned within the 75–100 range. In the case of a lower score, the judges were asked to declare any negative comment. In the processing of the data, the samples declared defective by more than one panel member were excluded. The final score for each descriptor was given as the mean value of the responses provided by the judges including the extreme minimum and maximum values.

2.3. Chemicals and Materials

Sodium chloride (purity > 99.5%) and Retention Index Standard (aliphatic C7–C24 hydrocarbons dissolved in hexane) were purchased from Sigma-Aldrich (Saint Louis, MO, USA). A divinylbenzene/Carboxen/polydimethylsiloxane (DVB/CAR/PDMS) 50/30 µm (Supelco, Bellafonte, PA, USA) was used in SPME-HS/GC–MS analysis. Standards of the following organic acids and phenolic compounds (purity greater than 97%) were obtained from Sigma-Aldrich: caffeic acid, citric acid, coumaric acid, ellagic acid, ferulic acid, gallic acid, kaempferol, malic acid, protocatechuic acid, quercetin, succinic acid, syringic acid, tartaric acid, tyrosol, and vanillic acid. HPLC-grade acetonitrile ChromasolvTM (Riedel-de HaënTM, Seelze, Germany) and double-deionized water, obtained from a milli-Q water filtration/purification system (Millipore, Bedford, MA, USA), were used for the preparation of the UHPLC mobile phase.

2.4. Headspace Solid-Phase Micro-Extraction (HS-SPME) of Wine Volatiles

Experimental conditions for HS-SPME wine aroma sampling were optimized previously (unpublished data). Three different fibers (Supelco, Bellafonte, PA, USA), coated with polydimethylsiloxane 100 mm, Carbowax/divinylbenzene 65 µm, and divinylbenzene/Carboxen/polydimethylsiloxane (DVB/CAR/PDMS) 50/30 mm, were tested; for each sorbent, a multivariate design of experiments coupled with surface-response methodology was applied to model the mutual influence of the sample temperature, the exposure time of the fiber to the headspace, and the NaCl concentration added to the sample on the global extraction efficiency. The DVB/CAR/PDMS sorbent was finally preferred because it extracted the largest number of volatiles and provided the most intense chromatogram. The optimal HS-SPME conditions are the following: Aliquots of 5 mL of wine samples and NaCl at 30% w/v are introduced in a 10 mL vial tightly capped with a PTFE–silicone septum. The sample, kept under magnetic stirring, is placed inside a cylindrical cavity in an aluminum block heated by an electrical heater at a constant temperature of 30 ± 1 °C. The temperature is controlled by a Vertex probe immersed in a vial filled with water, located inside of a second cavity close to the wine sample. The fiber—previously conditioned at 270 °C, as recommended by the manufacturer—is exposed to the sample headspace for 30 min, then successively removed and inserted into the GC injection port where desorption takes place at 270 °C for 5 min.

2.5. GC–MS Analysis of Volatile Profile

The wine aroma profiles were collected with a Varian Saturn 2000 GC–MS system composed by a Star GC 3400 CX instrument connected to an ion-trap mass detector. The GC apparatus was equipped with a 1078 split/splitless injector having a SPME liner inside. All the analyses were performed in a split mode with a 50:1 split ratio. A Varian FactorFourTM VF5-ms capillary column (30 m × 0.25 mm × 0.25 µm film thickness) was used and the carrier gas was Helium IP supplied at a flow rate of 1.0 mL/min. The column oven temperature program was the following: initial temperature 35 °C for 5 min, then raised at 5 °C/min to 150 °C and held for 1 min, and finally increased to 280 °C at a rate of 10°/min and held for 5 min. Retention indices of the extracted compounds were determined based on the observed retention times of aliphatic hydrocarbons (C7–C24). These data were collected by HS-SPME/GC–MS analysis of the Retention Index Standard after dilution with a water-ethanol mixture, under application of the same temperature program used in the analysis of wine aroma.

2.6. UHPLC Analysis of Organic Acids and Polyphenols

The analysis was conducted by means of an ACQUITY UPLC® system (Waters, Milford, MA, USA) coupled with either a diode-array detector (DAD) or an ESI-QToF MS detector. The wine samples were filtered through a 0.2 μm pore size PTFE filter (Whatman) for HPLC analysis. Then, 2 μL was injected into the UHPLC system, equipped with a degassing system, a quaternary solvent manager, a sample manager, and a column heater. UHPLC-DAD data handling was managed by Empower v.3.0 software (Waters). The chromatographic separations were performed on a 2.1 × 50 mm ACQUITY UPLC BEH C18 reversed-phase column with 1.7 μm particle size, protected by an ACQUITY UPLC BEH C18 VanGuard 2.1 × 5 mm pre-column with the same particle size as the analytical column. The mobile phase consisted of water (eluent A) and acetonitrile (eluent B), supplied according to the gradient profile reported in Table S1 (Supplementary Materials). The column temperature was set at 30 °C and the samples were kept at 15 °C. The data for wine varietal classification were acquired on a DAD detector, but polyphenol identification was attempted by coupling the UHPLC system with an ESI-QToF mass spectrometer (Xevo G2 QToF, Waters). In this circumstance, the chromatographic separation was carried out under the same conditions used in UHPLC-DAD analysis, but the aqueous phase (A) was acidified with 0.1 % formic acid. The ESI source parameters were set as follows: capillary voltage at 2 kV (negative mode) and 3 kV (positive mode); sampling cone at 15 V (negative mode) and 30 V (positive mode); extraction cone at 1 V (negative mode) and 4 V (positive mode); source temperature at 150 °C; desolvation temperature at 500 °C; and desolvation gas flow rate at 800 L h−1. Each sample was analyzed in positive and negative ionization modes recording the full scan spectra in the 100–1200 m/z range.

2.7. Multivariate Statistical Analysis

The investigated data set has been analyzed by two different multi-block approaches: Sequential and Orthogonalized Partial Least Squares Linear Discriminant Analysis (SO-PLS-LDA) [23] and Sequential and Orthogonalized Covariance Selection Linear Discriminant Analysis (SO-CovSel-LDA) [24]. For comparison, the individual data matrices have been also analyzed by Partial Least Squares Discriminant Analysis (PLS-DA) [27,28]. A brief description of SOPLS and SO-CovSel algorithms will be given in the sub-paragraphs below; for PLS-DA, the reader is directed to the related literature.

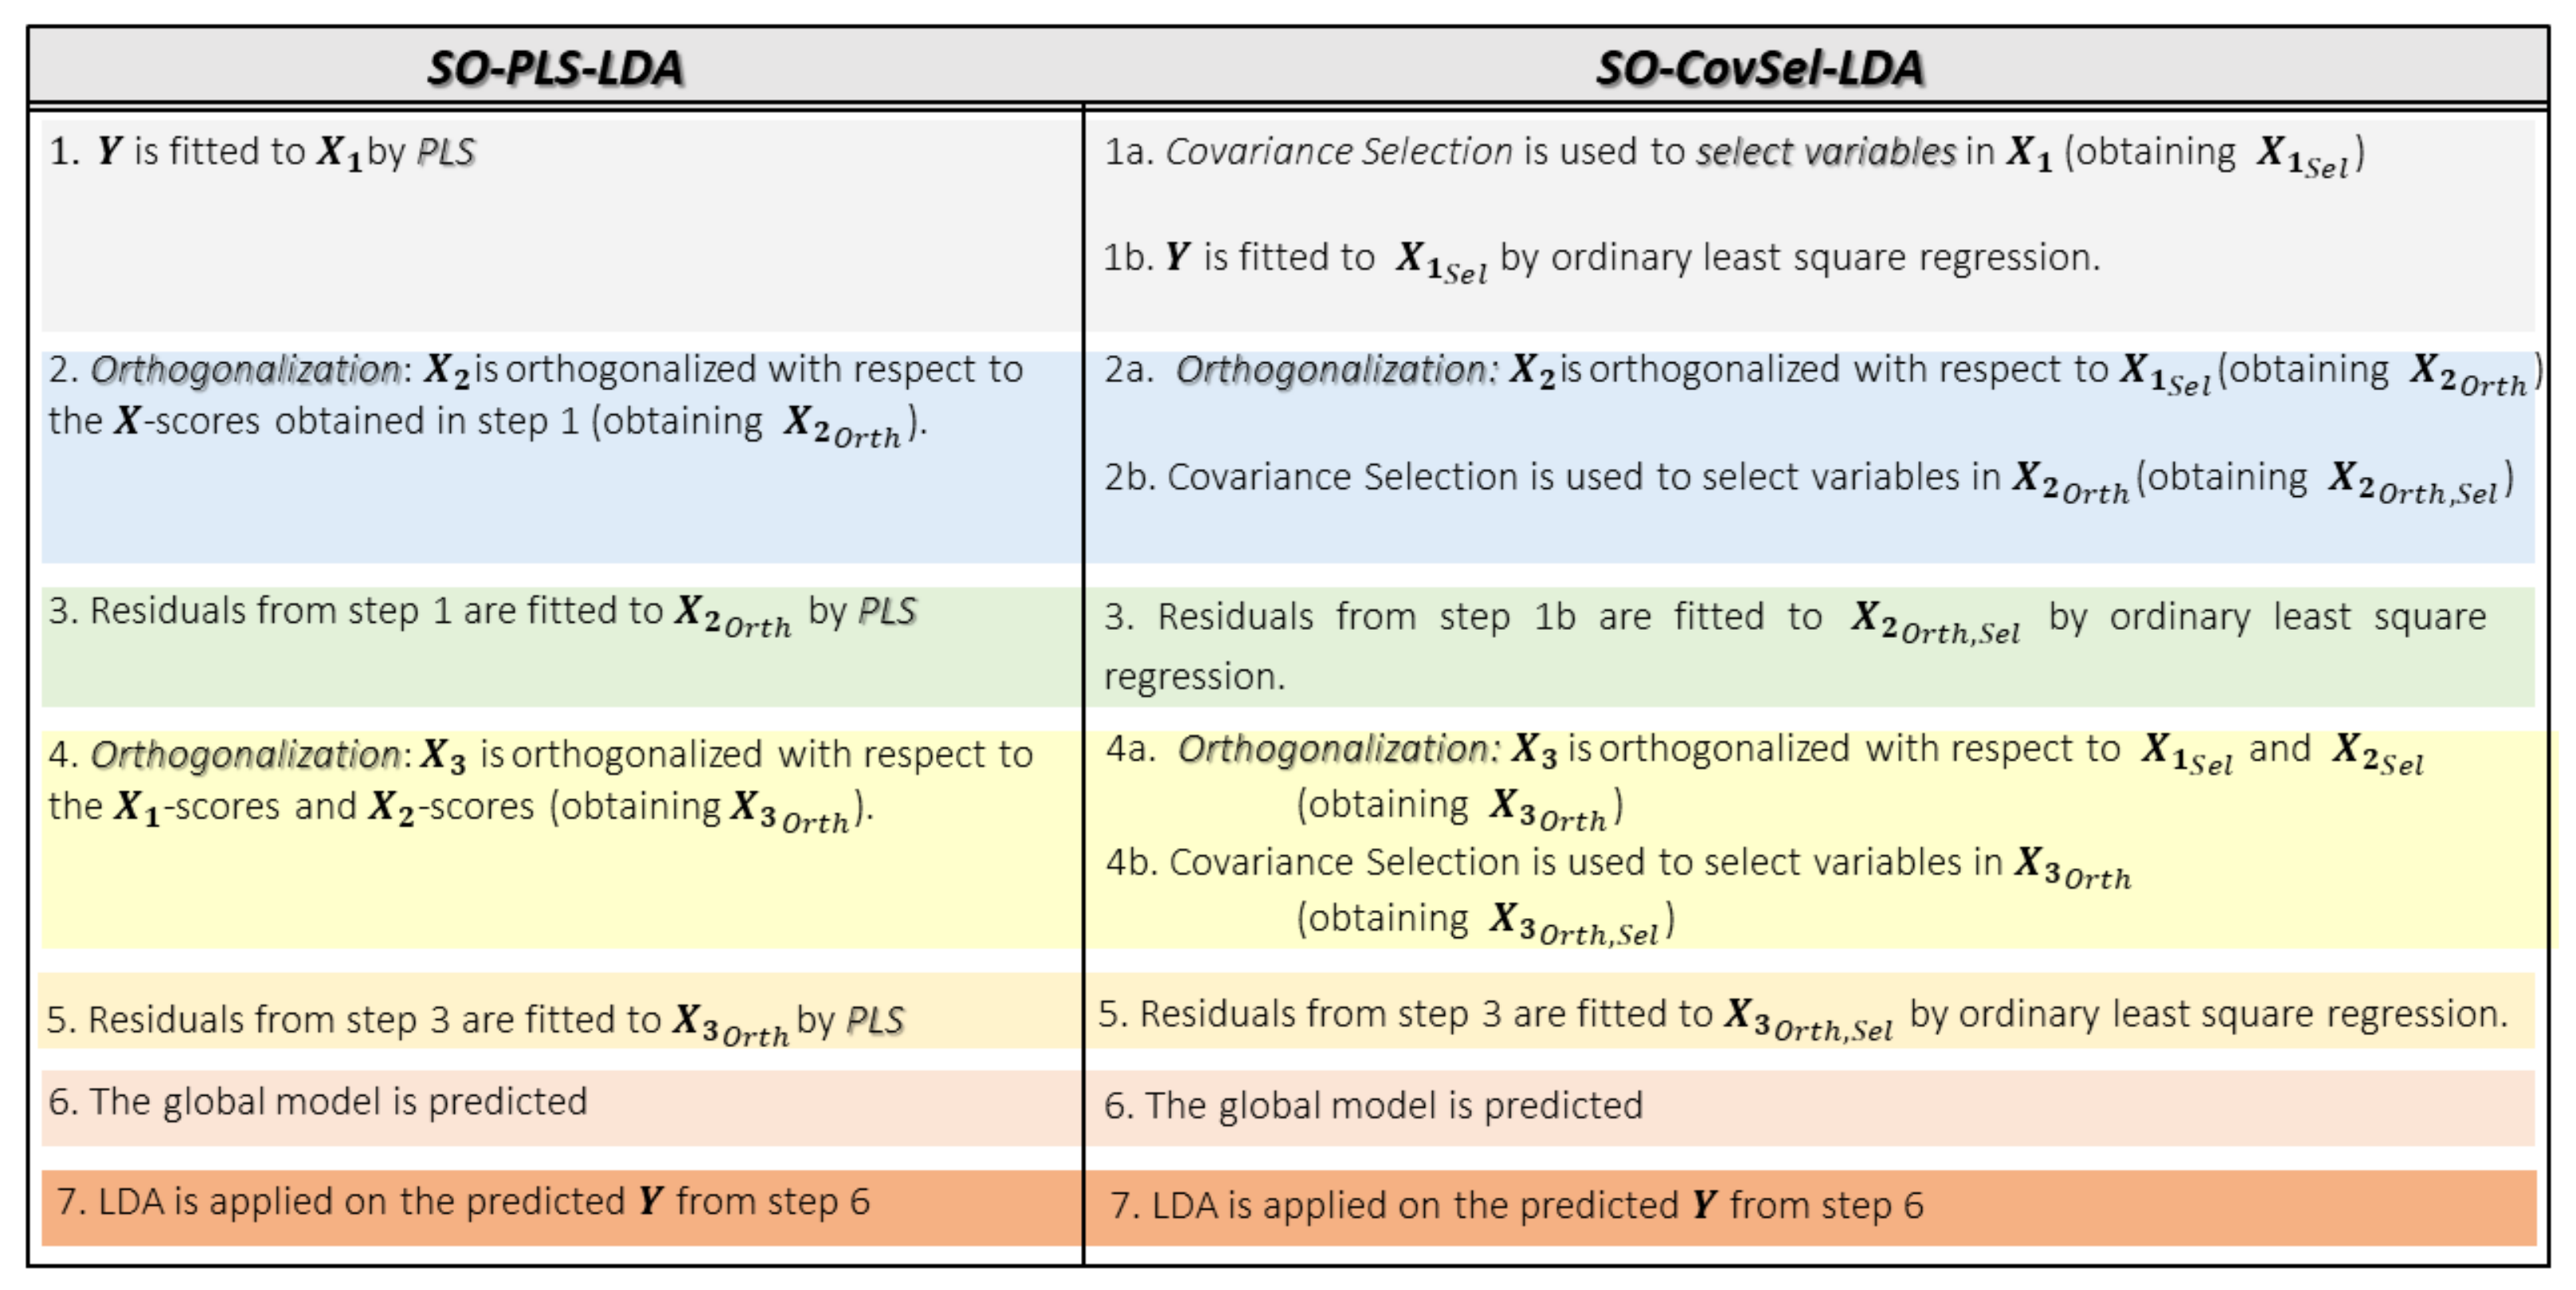
2.8. Multi-Block Classifiers

Sequential and Orthogonalized Partial Least Square Linear Discriminant Analysis (SO-PLS-LDA) and Sequential and Orthogonalized Covariance Selection Linear Discriminant Analysis (SO-CovSel-LDA) are multi-block classifiers conceived to simultaneously handle several blocks of data. Taking into account a three predictor block case ( X 1 , X 2 , and X 3 ) (as in the present study) used to estimate a dummy Y response encoding class memberships, their algorithms can be summarized as shown in the scheme in Figure 2; for more details on SO-PLS-LDA and SO-CovSel-LDA, the reader is directed to [29] and [24], respectively.

3. Results and Discussion

3.1. Sensory Analysis

Figure 3 displays the sensory profiles of representative wines belonging to each of the three varieties, selected to cover as far as possible the different cultivation site locations within the regional territory. Specific tasting notes on the three wine varieties are reported in Appendix A.
It can be observed that Pecorino wines produced in different locations within the Abruzzo region exhibit small differences in some sensorial attributes, mainly Color Intensity and Mineral. Trebbiano wines, on the other hand, present very stable scores for of all the sensory indicators except Color Shade. The three representative Passerina wines, although coming from relatively close localities in northern Abruzzo, exhibit appreciable variations in the Color Shade and Mineral attributes and, to a lesser extent, in Color Intensity. The mean sensory profiles of the three wine varieties are compared in Figure 4.
This figure reveals the high degree of similarity among the three wine varieties, especially Trebbiano and Pecorino, as Passerina presents a slightly lower amplitude of most of the sensory indicators. The lower complexity in the olfactory notes of Passerina was attributed by panelists to a scarce acidity (Appendix A). Nevertheless, the dissimilarities among the mean sensory indicators are comparable or lower than the differences internal to Passerina and Pecorino wines. Under this condition, unequivocal attribution of the varietal origin of the wines seems hard to achieve based only on sensory analysis.

3.2. Characterization of Wines by HS-SPME/GC–MS, UHPLC and ICP-OES

The qualitative identification of the volatile components of Trebbiano d’Abruzzo, Pecorino, and Passerina aroma was performed by GC–MS analysis. Figure S1 (Supplementary Materials) shows a typical chromatogram. Table S2 (Supplementary Materials) displays the list of the detected compounds and their mean content in the aroma of the three wine varieties, expressed as the relative (%) area in the GC–MS chromatogram, together with the related standard deviation. Table S3 (Supplementary Materials) displays the list of the organic acids and polyphenols detected by UHPLC whereas a typical chromatogram is shown in Figure S2 (Supplementary Materials). The identification carried out by means of GC–MS and UHPLC is in strong agreement with the literature. In fact, many of the determined compounds have also been reported by other authors [30,31] as present in white wines of different cultivars grown both in Italy (such as those under investigation) and in other countries.
The mean concentration of the 14 elements detected by ICP-OES in the three wine varieties is reported in Table S4 (Supplementary Materials). Part of the novelty of the present work lies in the fact that the mineral composition of the investigated wines had never been discussed before. However, the estimated concentrations are in excellent agreement with those reported in the literature on white wines of different cultivars. A complete discussion over the quantification of mineral elements falls outside the scope of the present work; consequently, for more details, the reader is addressed to Gajek [32] for the concentrations of Co, Cu, Fe, K, Li, Mg, Mn, Na, Ni, Sr, and Zn; to Drava [33] for Ca and V; and to Titarenko [34] for Ba.

3.3. Single- and Multi-Block Varietal Classification

The data set available for the classification analysis is made of three data blocks: UHPLC signals ( X 1 ), ICP-OES data ( X 2 ), and GC chromatograms ( X 3 ). The absolute peak areas of the detected analytes in UHPLC (X1) and GC–MS (X3) chromatograms were considered as variables in the respective blocks. All the calculations were run in Matlab 2015a (The Mathworks, Natick, MA, USA) using in-house functions.
Prior to the creation of the classification models, samples were divided into a training and a test set using the Duplex algorithm [35] in order to perform external validation. This process aims at estimating the predictive error provided by the models. Basically, a portion of the available samples (at least the 30% of the total) is left as an external test set and treated as if it were unknown. Once the model is built, the validation set is predicted, and, since the class membership of these objects is known, the predictive error can be estimated. The application of the Duplex algorithm ensures the representativeness of the two sets. To reorganize the objects in subsets while simultaneously taking into account the variation present in all the blocks, the procedure described in [36] was applied. Briefly, a Principal Component Analysis model was calculated on each (mean-centered) data matrix and five components (PCs) were extracted by X 1 , X 2 , and X 3 . These PCs were row-augmented (obtaining T s u p 47 × 15 ) and the Duplex algorithm was applied on the resulting matrix T s u p . The outcome of this procedure led to the reorganization reported in Table 1.
Firstly, classification models were calculated on the individual data matrices by PLS-DA. Depending on the nature of the data, different preprocessing approaches have been tested: mean-centering (MC), autoscaling, probabilistic quotient normalization (PQN) [37], and logarithm base 10 (Log10). The model parameters (i.e., the most suitable pretreatment and the number of latent variables (LVs) to be extracted) have been defined into a five-fold cross-validation procedure; the results are reported in Table 2. The optimal PLS-DA models (i.e., those leading to the lowest average classification error in cross-validation, bolded in Table 2) were than applied to the test set (preprocessed accordingly). PLS-DA analysis on (mean-centered) UHPLC data provided correct classification rates of 50.0%, 75.5%, and 83.3% for samples belonging to class Passerina, class Pecorino, and class Trebbiano, respectively.
The PLS-DA model created on the ICP-OES data (preprocessed by Log10) correctly assigned 40.0% of samples appertaining to class Passerina, 75.0% of the objects from class Pecorino, and 50.0% of Trebbiano samples; the PLS-DA model calculated on mean-centered GC data led to correct classification rates of 25.0%, 62.5%, and 83.3% for samples belonging to Class Passerina, Class Pecorino, and Class Trebbiano, respectively.
Next, SO-PLS-LDA and SO-CovSel-LDA models were built on the data preprocessed in agreement with the outcomes of PLS-DA analysis; the results are reported in Table 3. As expected, the data fusion strategies provided better results (from the prediction point of view) than the individual-block analysis.
The SO-PLS-LDA model required the extraction of one LV from the UHPLC block, four from the ICP and one from the GC. On the other hand, SO-CovSel required 13 variables: five from the UHPLC chromatograms, seven from the ICP, and one from GC signals. As can be seen from the correct classification rates reported in Table 3, both approaches performed well. In particular, SO-PLS-LDA misclassified only three samples (two from class Passerina and one belonging to class Trebbiano) out of eighteen in the test set. Similarly, SO-CovSel-LDA erroneously assigned four samples: one each belonging to class Passerina and to class Pecorino, and two appertaining to class Trebbiano.
A graphical representation of the SO-PLS-LDA outcome is reported in Figure 5; in the plot, the samples are projected onto the canonical variate space [38]. All the investigated objects are quite well-divided into the three categories: the first canonical variate allows discriminating samples appertaining to class Pecorino (purple squares, at positive values of CV1) and those belonging to class Trebbiano (blue diamonds, at negative values of CV1). On the other hand, objects belonging to class Passerina (red dots) can be distinguished from those appertaining to the other two categories along CV2.
From the figure, however, it is possible to notice a slight overlap between class Passerina and the other two categories; this led to some erroneous assignments (highlighted by a black cross). In particular, two misclassified objects belonging to class Passerina were assigned to class Pecorino, and one Trebbiano sample was predicted as belonging to class Passerina. Interestingly, the relatively large intra-class variability of Passerina individuals in the canonical variate space seems to reflect the higher heterogeneity in the sensorial attributes observed for this wine variety compared to the others. By contrast, Trebbiano individuals give rise to a compact cluster, which is in line with the high homogeneity of sensory characteristics within the wines of this variety detected by panelists, whereas the intra-class variability of Pecorino samples, according to both sensorial and chemical properties, is between that of the other two wine categories.
The possibility that sequential multi-block methods would have provided accurate predictions had its own rationale in the literature. In fact, as mentioned in the introduction, in some articles, multi-block analysis has already been applied for the discrimination of wines. In particular, in some works, low- or mid-level data-fusion (DF) approaches were exploited. An example is the work by Rios-Reina et al. [18], where Argentine white wines were classified using low-, mid-, and high-level data-fusion approaches. All the classification outcomes were extremely satisfying, but the most accurate solutions were provided by mid- or high-level DF strategies.
Variable Projection Indices (VIPs) can be computed to find the variables of each block that contribute the most to the varietal discrimination [39]; VIP > 1 is the criterion usually adopted to establish whether a predictor significantly contributes to the model or not. This kind of analysis identified tartaric and malic acid from the UHPLC data block, as well as Cu, Na, Ni, Sr, Ca, and Fe from the ICP-OES block as discriminant variables, whereas 3-methyl-1-butanol, 2-methyl-1-butanol, ethyl hexanoate, and 2-phenylethyl acetate were found to be the volatile components (GC–MS data block) relevant in the varietal discrimination of the three wines. The significant role of tartaric acid—which is the main organic acid in wines—in contributing to the chemical stability, color, and taste of the wine [40] is related to the differing acidity of Passerina, Trebbiano, and Pecorino varieties, as highlighted by sensory analysis (Appendix A). On the other hand, the discriminant volatiles are associated with specific pleasant sensorial attributes—such as fruity (ethyl hexanoate) and floral (2-phenylethyl acetate)—or unpleasant odors, namely solvent or pungent notes (3-methyl-1-butanol) [41]. Nevertheless, the difference in the concentration of the above odor-active components did not result in distinct and systematic differences in the attributes evaluated by the panelists, which reveals the greater efficiency of the combined chemical analysis and chemometrics compared to sensory analysis in the varietal discrimination of the three wines here investigated. Concerning the discriminant ability of the major (Na and Ca) or minor (Cu, Ni, Sr, and Fe) mineral elements, a possible difference in the soil composition cannot be invoked as the reason for the observed effect because, as discussed before, the samples of the three wine varieties here-analyzed are not cultivated in specific and different areas and, regardless of the grape variety, the prevalent cultivation environment is the hilly zone between the Adriatic Sea and Apennine Mountains. Instead, as documented in the literature for other wine varieties [4,7,42], the different content of the above elements in the three wines can be attributed to a selective ability of the different grape plants to absorb the mineral elements from the cultivation soil, or a different maturity of the grapes subjected to the winemaking process.

4. Conclusions

The objective of this work, namely, the varietal discrimination of Trebbiano d’Abruzzo white wine and two recently rediscovered ancient varieties, Pecorino and Passerina, was ambitious, since the three investigated varieties belong to the same family of grapes and the winemaking processes are quite similar. In addition, cultivation of the three grape varieties, rather than being localized in specific and different areas of the Abruzzo region, are spread over the whole regional territory, with the only exception being Passerina grape which is mainly cultivated in the Northern part of the region. In this regard, this factor did not allow an optimal representativeness of the last variety, 11 being the only available samples. Sensory analysis revealed that Trebbiano and Pecorino exhibit very similar attributes, while Passerina wines present less-ample values of most of the sensory indicators, and the samples of this variety—although coming from a restricted area—exhibit a relatively high variability in some sensorial attributes. In summary, the differences in the sensorial attributes seem too small to consider them efficient markers of the grape varietal origin.
Despite the relatively high homogeneity in the sensorial properties of the three wine varieties, the approaches proposed here to attempt a varietal discrimination were severely tested by generation of an external data set formed by 18 wine samples out of the 46 collected ones. While conventional PLS-DA based on individual classes of molecular/atomic markers (polyphenols and organic acids, trace elements, or volatile compounds, respectively) did not provide a satisfactory predictive performance, data fusion by SO-PLS-LDA misclassified only three samples of the external set. It is worth noting that two classification errors regarded Passerina samples that were erroneously attributed to the Pecorino variety, while the Passerina class wrongly accepted one Trebbiano sample. These classification errors may be ascribed to the inadequate description of the compositional variability of the Passerina category in calibration, because of the low number of training samples compared to the relatively high variability in the sensorial properties of this kind of wine. On the other hand, Pecorino and Trebbiano wines, which are both represented by a greater, although still not ideal, number of samples (10 and 11), were never confused for each other. Bearing in mind that these two varieties exhibit almost coincident sensorial attributes, this outcome is particularly encouraging and supports the adequacy of the proposed multi-block approach for the varietal discrimination of wines produced in close territories with grapes of a same family.

Supplementary Materials

The following supporting information can be downloaded at: https://www.mdpi.com/article/10.3390/app12199794/s1. Figure S1: Typical GC–MS chromatogram of volatile components; Figure S2: Typical UHPLC chromatogram of polyphenols and organic acids; Table S1: Gradient profile of the binary mobile phase consisting of water (eluent A) and acetonitrile (eluent B) used in the UHPLC separation of organic acids and polyphenols; Table S2: List of the volatiles detected by HS-SPME/GC–MS: observed and literature values of the retention index (RI), mean peak areas (%) in the aroma profiles of the three wine varieties and related standard error (SE) values; Table S3: Organic acids and polyphenols detected in the UHPLC chromatograms of the analyzed wines; Table S4: Mean concentrations (mg/L) of the elements detected by ICP-OES in the three wine varieties and related standard error (SE) values.

Author Contributions

Conceptualization, A.A.D., A.B. and M.C.; methodology, A.B., F.P. and L.R.; software, A.B.; validation, S.R., F.R. and A.B.; formal analysis, A.B.; investigation, M.F., G.C., S.R. and F.P.; resources, M.C.; data curation, M.C. and F.P.; writing—original draft preparation, A.B. and A.A.D.; writing—review and editing, A.A.D. All authors have read and agreed to the published version of the manuscript.

Funding

This research received no external funding.

Institutional Review Board Statement

Not applicable.

Informed Consent Statement

Not applicable.

Acknowledgments

We would like to thank the following wine producers who contributed to this study by providing us the samples analyzed: Barone Cornacchia; Biagi; Bosco Nestore; Chiarieri; Ciavolich; Contesa; Del Casale Sergio; Gentile; Jasci e Marchesani; Lampato; Lepore; Marchesi de Cordano; Margiotta; Masciarelli; Montori; Mucci; Pasetti; Pietrantonj; Talamonti; Terraviva; Torre dei Beati; Valle Martello; and Valle Reale.

Conflicts of Interest

The authors declare no conflict of interest.

Appendix A

Tasting notes on the Passerina wines
(1)
We noticed a certain uniformity on the descriptors found, with the only exception of the intensity and shade of color and mineral character. Prevailing were yellow flowers, ripe fruit and minerals.
(2)
Yellow flowers and ripe fruit indicate mature wines; in fact, the wines were quite evolved.
(3)
Regarding the vegetable, we can point out, within the descriptors, the one most highlighted at every single tasting: in almost all cases it was aromatic grass, being fresh grass just once.
(4)
Identifications, when indicated: chamomile and broom among the flowers, peach, apricot, and pineapple among the fruits; gentian among the aromatic herbs.
(5)
Compared to Pecorino and Trebbiano, Passerina seems less complex in the olfactory analysis, but this depends probably on a scarce acidity.
(6)
The three Passerina samples examined showed an olfactory component based on fruity and floral notes with a light vegetable trace.
(7)
The taste component showed average and rather uniform values of the various sensations, without any particular prominence.
(8)
The sensory characteristics detected are not perfectly in line with the typological characteristics of Passerina wine, but this may depend on the fact that the wines were tasted when they were beyond the optimal ripening. As already pointed out, the scarce acidity penalizes, in addition to the olfaction, the evaluation of all the other sensory components.
Tasting notes on the Pecorino wines
(1)
Pecorino wine samples are distinguished by a fresh olfactory-taste and aromatic profile, which demonstrates a relevant acidity. This means that wines are better preserved over time and when tasted, they were still perfectly healthy.
(2)
White flowers are not always described. The most frequent recognition, even if reported only by a few tasters in every wine, is jasmine.
(3)
The type of fruit that is most often found are citrus fruits in a generic sense, grapefruit in particular. Pineapple was also detected several times and, less frequently, apple.
(4)
The minerality has been detected.
(5)
An important aromatic profile can be noted: the individual values of the sensations detected stand on medium-high values.
(6)
The wines have an important sapidity.
(7)
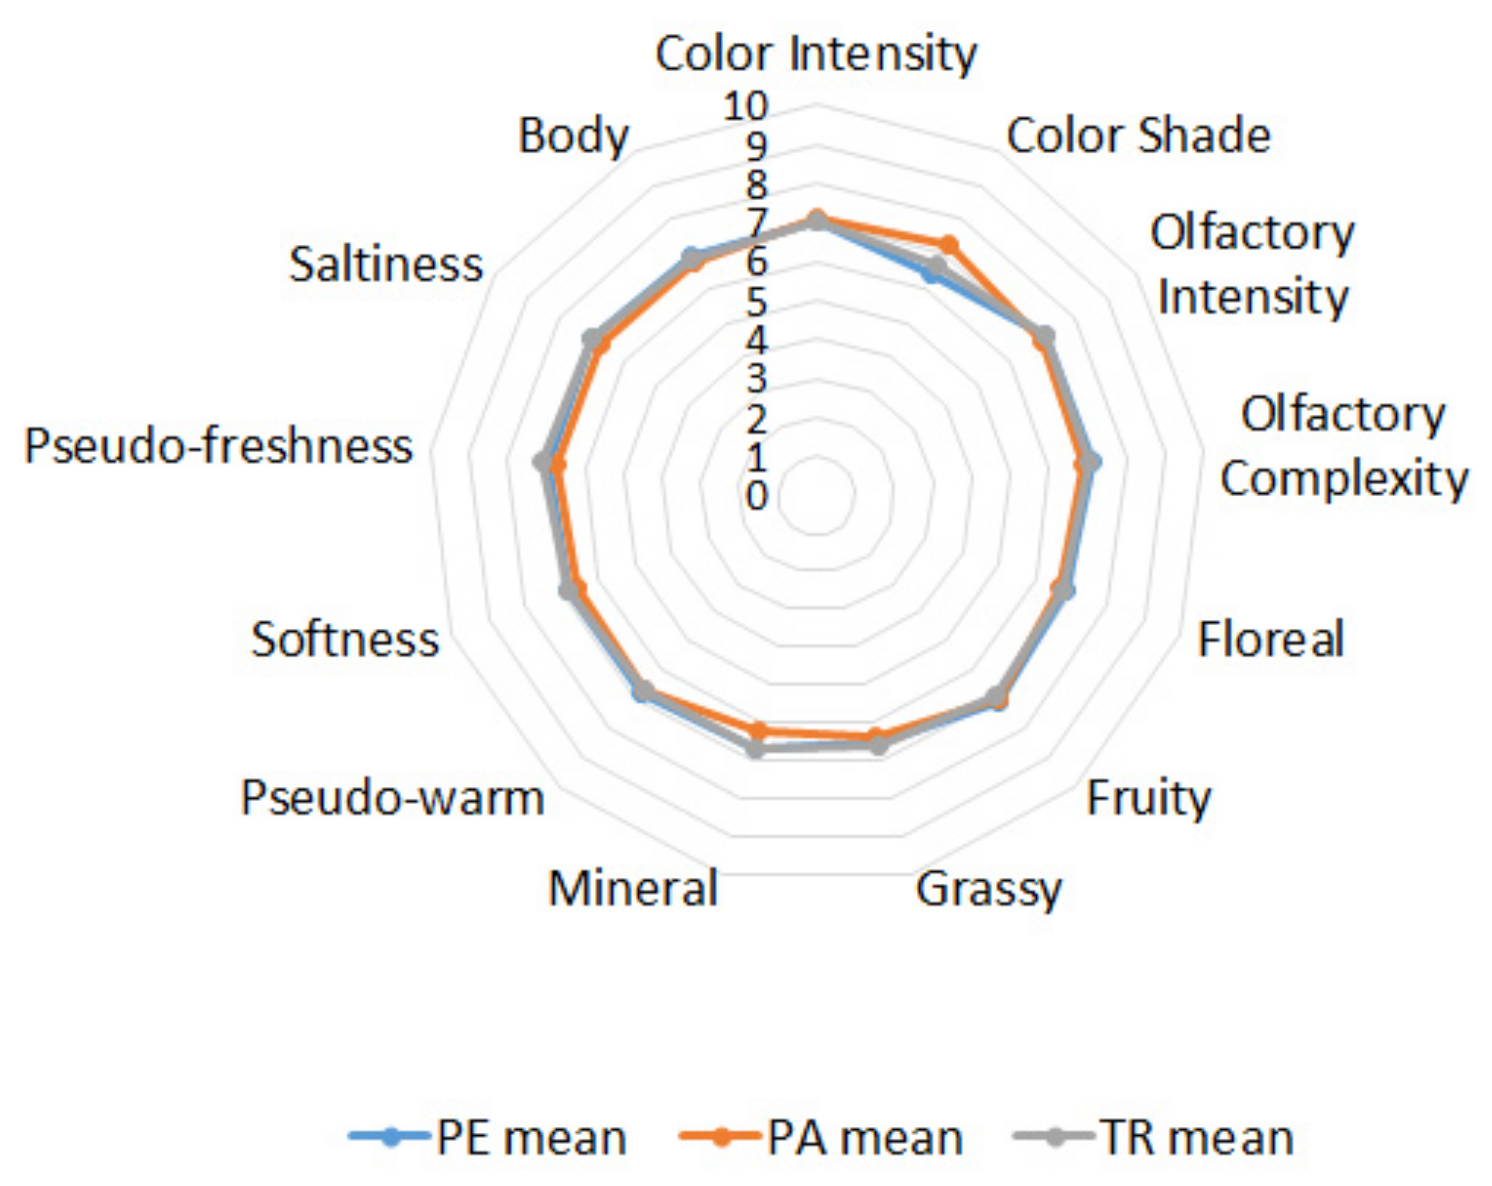
The most relevant differences showed in the graphs are related to color intensity and shade, mineral, and saltiness notes.
Tasting notes on the Trebbiano d’Abruzzo wines
(1)
Yellow flowers prevail over white flowers, ripe fruit over fresh fruit, aromatic herb over fresh grass. Taken together, however, these notes show that Trebbiano wines were tasted in a phase in which either the characteristics of maturity or youngness were still both perceptible.
(2)
Trebbiano samples demonstrated balanced olfactory and olfactory-taste characteristics.
(3)
The wine samples showed a fruity and floral olfactory component more important than the mineral component.
(4)
The aromatic complexity is fair.
(5)
In the gustatory component, the pseudo-freshness stands out above the others.
(6)
The sensory characteristics of the Trebbiano wines tasted were in line with the typological characteristics of a Trebbiano wine of medium longevity.
(7)
The graphs showed very homogeneous values except for the color shade.

References

  1. Pietrangeli, F.; Odoardi, M. L’Abruzzo Della Vite e del Vino; Menabò Srl: Ortona, Italy, 2017. [Google Scholar]
  2. Villano, C.; Lisanti, M.T.; Gambuti, A.; Vecchio, R.; Moio, L.; Frusciante, L.; Aversano, R.; Carputo, D. Wine varietal authentication based on phenolics, volatiles and DNA markers: State of the art, perspectives and drawbacks. Food Control 2017, 80, 1–10. [Google Scholar] [CrossRef]
  3. Holmberg, L. Wine fraud. Int. J. Wine Res. 2010, 2, 105–113. [Google Scholar] [CrossRef]
  4. Versari, A.; Laurie, V.F.; Ricci, A.; Laghi, L.; Parpinello, G.P. Progress in authentication, typification and traceability of grapes and wines by chemometric approaches. Food Res. Int. 2014, 60, 2–18. [Google Scholar] [CrossRef]
  5. Valentin, L.; Barroso, L.P.; Barbosa, R.M.; de Paulo, G.A.; Castro, I.A. Chemical typicality of South American red wines classified according to their volatile and phenolic compounds using multivariate analysis. Food Chem. 2020, 302, 125340. [Google Scholar] [CrossRef]
  6. Milovanovic, M.; Žeravík, J.; Obořil, M.; Pelcová, M.; Lacina, K.; Cakar, U.; Petrovic, A.; Glatz, Z.; Skládal, P. A novel method for classification of wine based on organic acids. Food Chem. 2019, 284, 296–302. [Google Scholar] [CrossRef]
  7. Pérez-Álvarez, E.P.; Garcia, R.; Barrulas, P.; Dias, C.; Cabrita, M.J.; Garde-Cerdán, T. Classification of wines according to several factors by ICP-MS multi-element analysis. Food Chem. 2019, 270, 273–280. [Google Scholar] [CrossRef]
  8. Bronzi, B.; Brilli, C.; Beone, G.M.; Fontanella, M.C.; Ballabio, D.; Todeschini, R.; Consonni, V.; Grisoni, F.; Parri, F.; Buscema, M. Geographical identification of Chianti red wine based on ICP-MS element composition. Food Chem. 2020, 315, 126248. [Google Scholar] [CrossRef]
  9. Epova, E.N.; Bérail, S.; Séby, F.; Barre, J.P.G.; Vacchina, V.; Médina, B.; Sarthou, L.; Donard, O.F.X. Potential of lead elemental and isotopic signatures for authenticity and geographical origin of Bordeaux wines. Food Chem. 2020, 303, 125277. [Google Scholar] [CrossRef]
  10. Chandra, S.; Chapman, J.; Power, A.; Roberts, J.; Cozzolino, D. Origin and Regionality of Wines—The Role of Molecular Spectroscopy. Food Anal. Methods 2017, 10, 3947–3955. [Google Scholar] [CrossRef]
  11. Gougeon, L.; da Costa, G.; Guyon, F.; Richard, T. 1H NMR metabolomics applied to Bordeaux red wines. Food Chem. 2019, 301, 125257. [Google Scholar] [CrossRef]
  12. Mascellani, A.; Hoca, G.; Babisz, M.; Krska, P.; Kloucek, P.; Havlik, J. 1H NMR chemometric models for classification of Czech wine type and variety. Food Chem. 2021, 339, 127852. [Google Scholar] [CrossRef]
  13. Cozzolino, D. Metabolomics in Grape and Wine: Definition, Current Status and Future Prospects. Food Anal. Methods 2016, 9, 2986–2997. [Google Scholar] [CrossRef]
  14. Saurina, J. Characterization of wines using compositional profiles and chemometrics. TrAC Trends Anal. Chem. 2010, 29, 234–245. [Google Scholar] [CrossRef]
  15. Biancolillo, A.; Boqué, R.; Cocchi, M.; Marini, F. Data Fusion Strategies in Food Analysis. In Data Fusion Methodology and Applications; Cocchi, M., Ed.; Elsevier: Amsterdam, The Netherlands, 2019; Volume 31, pp. 271–310. [Google Scholar]
  16. Crook, A.A.; Zamora-Olivares, D.; Bhinderwala, F.; Woods, J.; Winkler, M.; Rivera, S.; Shannon, C.E.; Wagner, H.R.; Zhuang, D.L.; Lynch, J.E.; et al. Combination of two analytical techniques improves wine classification by Vineyard, Region, and vintage. Food Chem. 2021, 354, 129531. [Google Scholar] [CrossRef]
  17. Mazerolles, G.; Preys, S.; Bouchut, C.; Meudec, E.; Fulcrand, H.; Souquet, J.M.; Cheynier, V. Combination of several mass spectrometry ionization modes: A multiblock analysis for a rapid characterization of the red wine polyphenolic composition. Anal. Chim. Acta 2010, 678, 195–202. [Google Scholar] [CrossRef]
  18. Ríos-Reina, R.; Azcarate, S.M.; Camiña, J.M.; Goicoechea, H.C. Multi-level data fusion strategies for modeling three-way electrophoresis capillary and fluorescence arrays enhancing geographical and grape variety classification of wines. Anal. Chim. Acta 2020, 1126, 52–62. [Google Scholar] [CrossRef]
  19. Silvestri, M.; Bertacchini, L.; Durante, C.; Marchetti, A.; Salvatore, E.; Cocchi, M. Application of data fusion techniques to direct geographical traceability indicators. Anal. Chim. Acta 2013, 769, 1–9. [Google Scholar] [CrossRef]
  20. Silvestri, M.; Elia, A.; Bertelli, D.; Salvatore, E.; Durante, C.; Li Vigni, M.; Marchetti, A.; Cocchi, M. A mid level data fusion strategy for the Varietal Classification of Lambrusco PDO wines. Chemom. Intell. Lab. Syst. 2014, 137, 181–189. [Google Scholar] [CrossRef]
  21. Tan, J.; Li, R.; Jiang, Z.T.; Zhang, Y.; Hou, Y.M.; Wang, Y.R.; Wu, X.; Gong, L. Geographical classification of Chinese Cabernet Sauvignon wines by data fusion of ultraviolet–visible and synchronous fluorescence spectroscopies: The combined use of multiple wavelength differences. Aust. J. Grape Wine Res. 2016, 22, 358–365. [Google Scholar] [CrossRef]
  22. Ruggieri, F.; D’Archivio, A.A.; Foschi, M.; Maggi, M.A. Multivariate optimization of an analytical method for the analysis of Abruzzo white wines by ICP OES. Anal. Methods 2020, 12, 2772–2778. [Google Scholar] [CrossRef]
  23. Biancolillo, A.; Måge, I.; Næs, T. Combining SO-PLS and linear discriminant analysis for multi-block classification. Chemom. Intell. Lab. Syst. 2015, 141, 58–67. [Google Scholar] [CrossRef]
  24. Biancolillo, A.; Marini, F.; Roger, J.-M. SO-CovSel: A novel method for variable selection in a multiblock framework. J. Chemom. 2020, 34, e3120. [Google Scholar] [CrossRef]
  25. ISO 8589 2007; Sensory Analysis. General Guidance for the Design of the Test Rooms. International Organization for Standardization: Geneva, Switzerland, 2007.
  26. ISO 3591 1977; Sensory Analysis. Apparatus Wine Tasting Glass. International Organization for Standardization: Geneva, Switzerland, 1977.
  27. Ståhle, L.; Wold, S. Partial least squares analysis with cross-validation for the two-class problem: A Monte Carlo study. J. Chemom. 1987, 1, 185–196. [Google Scholar] [CrossRef]
  28. Barker, M.; Rayens, W. Partial least squares for discrimination. J. Chemom. 2003, 17, 166–173. [Google Scholar] [CrossRef]
  29. Biancolillo, A.; Næs, T. The Sequential and Orthogonalized PLS Regression for Multiblock Regression: Theory, Examples, and Extensions. In Data Fusion Methodology and Applications; Cocchi, M., Ed.; Elsevier: Amsterdam, The Netherlands, 2019; Volume 31, pp. 157–177. [Google Scholar]
  30. Han, S.; Yang, J.; Choi, K.; Kim, J.; Adhikari, K.; Lee, J. Chemical Analysis of Commercial White Wines and Its Relationship with Consumer Acceptability. Foods 2022, 11, 603. [Google Scholar] [CrossRef]
  31. Karabagias, I.K.; Karabagias, V.K.; Badeka, A. V Volatilome of white wines as an indicator of authenticity and adulteration control using statistical analysis. Aust. J. Grape Wine Res. 2021, 27, 269–279. [Google Scholar] [CrossRef]
  32. Gajek, M.; Pawlaczyk, A.; Szynkowska-Jozwik, M.I. Multi-Elemental Analysis of Wine Samples in Relation to Their Type, Origin, and Grape Variety. Molecules 2021, 26, 214. [Google Scholar] [CrossRef]
  33. Drava, G.; Minganti, V. Mineral composition of organic and conventional white wines from Italy. Heliyon 2019, 5, e02464. [Google Scholar] [CrossRef]
  34. Titarenko, V.O.; Khalafyan, A.A.; Temerdashev, Z.A.; Kaunova, A.A.; Ivanovets, E.A. Application of Statistical Methods for Classification of Varietal and Regional Origin of White Wines. Inorg. Mater. 2018, 54, 1435–1442. [Google Scholar] [CrossRef]
  35. Snee, R.D. Validation of Regression Models: Methods and Examples. Technometrics 1977, 19, 415–428. [Google Scholar] [CrossRef]
  36. Firmani, P.; Nardecchia, A.; Nocente, F.; Gazza, L.; Marini, F.; Biancolillo, A. Multi-block classification of Italian semolina based on Near Infrared Spectroscopy (NIR) analysis and alveographic indices. Food Chem. 2020, 309, 125677. [Google Scholar] [CrossRef]
  37. Dieterle, F.; Ross, A.; Schlotterbeck, G.; Senn, H. Probabilistic quotient normalization as robust method to account for dilution of complex biological mixtures. Application in 1H NMR metabonomics. Anal. Chem. 2006, 78, 4281–4290. [Google Scholar] [CrossRef]
  38. Krzanowski, W. Principles of Multivariate Analysis, 2nd ed.; Oxford University Press: Oxford, UK, 2000. [Google Scholar]
  39. Wold, S.; Johansson, E.; Cocchi, M. PLS-partial least-squares projections to latent structures. In 3D QSAR Drug Design; KLUWER ESCOM Science Publisher: Alphen aan den Rijn, The Netherlands, 1993; pp. 523–550. [Google Scholar]
  40. Ivanova-Petropulos, V.; Petruševa, D.; Mitrev, S. Rapid and Simple Method for Determination of Target Organic Acids in Wine Using HPLC-DAD Analysis. Food Anal. Methods 2020, 13, 1078–1087. [Google Scholar] [CrossRef]
  41. Welke, J.E.; Nicolli, K.P.; Hernandes, K.C.; Biasoto, A.C.T.; Zini, C.A. Adaptation of an olfactometric system in a GC-FID in combination with GCxGC/MS to evaluate odor-active compounds of wine. Food Chem. 2022, 370, 131004. [Google Scholar] [CrossRef]
  42. Dutra, S.V.; Adami, L.; Marcon, A.R.; Carnieli, G.J.; Roani, C.A.; Spinelli, F.R.; Leonardelli, S.; Ducatti, C.; Moreira, M.Z.; Vanderlinde, R. Determination of the geographical origin of Brazilian wines by isotope and mineral analysis. Anal. Bioanal. Chem. 2011, 401, 1575–1580. [Google Scholar]
Figure 1. Location of the cultivation sites of the investigated wines within the four provinces, L’Aquila (AQ), Teramo (TE), Pescara (PE) and Chieti (CH), of the Abruzzo region.
Applsci 12 09794 g001
Figure 2. Scheme of the algorithm for SO-PLS (left) and SO-CovSel (right).
Applsci 12 09794 g002
Figure 3. Sensory profiles of representative, from top to bottom, Pecorino (PE), Trebbiano d’Abruzzo (TR), and Passerina (PA) wines. The number refers to the production site, as reported in Figure 1).
Applsci 12 09794 g003
Figure 4. Mean sensory profiles of Pecorino (PE), Passerina (PA), and Trebbiano d’Abruzzo (TR) wines.
Applsci 12 09794 g004
Figure 5. SO-PLS-LDA analysis. Wine samples projected onto the space of the two canonical variates (CV1 and CV2).
Applsci 12 09794 g005
Table 1. Class memberships of the wine samples in the training and the test set.
Training Set (n. Samples)Test Set (n. Samples)
PasserinaPecorinoTrebbianoTot.PasserinaPecorinoTrebbianoTot.
710112848618
Table 2. PLS-DA models on the individual UHPLC, ICP-OES and GC data blocks with related number of latent variables (LVs). Average classification error rates are calculated in a 5-fold cross-validation (CV). Optimal calibration models are bolded.
Data BlockPretreatmentLVsAverage Classification Error Rate (CV)
UHPLCMean-Centering (MC)50.41
AutoScaling20.42
PQN (+MC)80.43
ICP-OESMean-Centering (MC)50.34
AutoScaling40.31
PQN (+MC)80.29
Log1070.28
GCMean-Centering (MC)60.43
AutoScaling10.49
PQN (+MC)50.48
Table 3. Data-block (SO-PLS-DA and SO-CovSel-LDA) models: number of latent variables (LVs) for each block and classification rate on the external prediction set.
Classifier LVs
( X 1 , X 2 , X 3 )
Classification Rates (External Set)
Class PasserinaClass PecorinoClass Trebbiano
SO-PLS-LDA1,4,150.0100.083.3
SO-CovSel-LDA5,7,175.087.566.6
Publisher’s Note: MDPI stays neutral with regard to jurisdictional claims in published maps and institutional affiliations.

