Article

Large Scale Model Test Study of Foundation Pit Supported by Pile Anchors

1
Key Laboratory of Disaster Mitigation in Civil Engineering of Gansu Province, Lanzhou University of Technology, Lanzhou 730050, China
2
Western Center of Disaster Mitigation in Civil Engineering, Ministry of Education, Lanzhou University of Technology, Lanzhou 730050, China
*
Authors to whom correspondence should be addressed.
Appl. Sci. 2022, 12(19), 9792; https://doi.org/10.3390/app12199792
Submission received: 24 August 2022 / Revised: 23 September 2022 / Accepted: 23 September 2022 / Published: 28 September 2022
(This article belongs to the Special Issue Geo-Environmental Problems Caused by Underground Construction)

Abstract

:
Due to the special time–space and environmental effects of the foundation pit, there are many unstable factors in the construction process of the field test. The indoor model test can avoid many uncertainties in the construction process due to its operability, which can reduce the interference with the test results and improve the accuracy of the test. In order to further discuss the force-bearing characteristics and deformation laws of loess pits’ support structure in Northwest China, a large model test of foundation pit supported by a pile anchor with a geometric similarity ratio of 1:10 was designed and completed. The force and deformation characteristics of the support structure were systematically studied by simulating the conditions of additional load at the pit edge, soil layered excavated, and anchors tensioned. The test results show that: for the pile-anchor support structure, the anchors have significant limiting effects on the displacement of the piles. Especially, when the position of the first row of anchors is closer to the pile top, the displacement of the pile is smaller. The stress state of the piles was changed by the prestressed anchor. The passive stress state of piles is changed from one side of tension and the other side of compression to the active stress state of “S” shape, which makes the distribution of the bending moment of piles more reasonable. The measured earth pressure in the process of soil unloading has a nonlinear distribution, which is different from the classical Rankine earth pressure distribution; specifically, the passive earth pressure in front of the pile is more obvious. In addition, the prestress applied to the anchors has a more significant effect on the internal forces of the other anchors. Compared with sequential tensioning, the prestress loss caused by interval hole tensioning is significantly reduced. The greater the number of spaced holes, the smaller the prestress loss and the better the anchoring effect of the anchor. The results of the study can provide reference for similar model tests, and also for related engineering applications.

1. Introduction

The limited land available for construction in northwest China has constrained the sustainable development of the region. In order to solve the problem of insufficient land for construction, the development and expansion of underground space has become an effective way to solve the problem, but this has also given rise to many complex foundation pit projects at the same time. [1]. A deep foundation pit is a complex high-risk system, the engineering of which is performed in a multi-phase and multi-field manner, composed of structure, soil and groundwater. It involves the stress path during excavation and unloading of soil, which is closely related to the nature of the soil body [2,3]. However, the current theories and methods of foundation pit design are only based on component design, and the experimental research is also based on field test. Restricted by the factors such as site construction conditions and project attributes, field tests sometimes failed to comprehensively test and analyze the stress characteristics of the support structure. Therefore, the indoor model test research can make up for the insufficiency of the field test and can qualitatively analyze the mechanical characteristics of the support structure.
There are many scholars who have carried out a lot of research on the model test of foundation pits. Xie Yu [4] studied the bending moment and earth pressure of passive piles subjected to horizontal force through model tests, believing that the bending moment curve of passive piles changes with the distance between the pile and the load boundary and intersects at the lower part of the pile. Xie Jiang [5] simulated the excavation process of the foundation pit through the photoelastic test and studied the force chain and its variation characteristics of the soil around the foundation pit. Liu Yiao [6] conducted a 1:30 indoor model test of foundation pit excavation. He obtained the earth pressure distribution, the horizontal displacement of the wall and the settlement law behind the wall, which were verified by finite element method. Bai bing [7] derived the generalized effective stress principle, which differs from the classical effective stress principle in that the model can automatically take into account the effects of stress paths, temperature paths, and soil structure. Yu Suhui [8] studied the influence of foundation pit excavation and construction on adjacent existing buildings and surrounding soil through model tests; he discussed the horizontal and vertical displacements of the adjacent buildings, the earth pressure around the foundation pit and the variation law of the existing building foundation under different parameters. Xiao Yang [9] used a large model box to simulate the whole process of underground space excavation and studied the influence of several parameters on the h-shaped support system with double-row piles. The test results showed that significant load transfer effects were generated between the rows of piles and that increasing the row spacing within a certain range could result in a more reasonable distribution of bending moments and pile forces. Zheng Gang [10,11] studied the influence of local anchor failure on the soldier pile support system through an indoor model test system. They clarified the mechanism of the continuous failure of the foundation pit and proposed an active, real-time, targeted deformation control method. Tang Deqi [12] studied the evolution of supporting structure performance and earth pressure through large-scale model tests. Wu Honggang [13] studied the synergistic deformation of a combined structure of high-fill slopes through model tests, which was composed of a pile-anchor and reinforced soil. Liang Fayun [14], Lin Hai [15] and Zhao Zhuangfu [16] studied the bearing and deformation characteristics of axially loaded piles and horizontally loaded piles, respectively, through indoor model tests. Zhou Dong [17] measured the deformation of the soil around the passive pile under the action of lateral displacement by model tests and obtained the displacement law of the soil around the pile under different embedment depths. Xia Yuanyou [18,19] studied the ultimate bearing capacity of anchors with different shapes and the failure mechanism of the fixed anchor length. Shen Hong [20] analyzed the horizontal displacement of the pile top, the internal force of the pile body and the single-row cantilever pile group through model tests. Zhou Dequan [21] conducted an in-depth study of the pile-side soil pressure and strain on the pile body of this combined structure of inclined straight piles by model tests, which also included the horizontal displacement of the outer pile. The unilateral force–deformation mechanism and damage mode of the combined structure were revealed. Fan Qiuyan [22] studied the changes in soil stress, anchorage section stress and lateral displacement of support structure in soil foundation pit during excavation and prestressed anchor construction by large indoor model test. Ye Shuaihua [23,24] conducted a systematic study on the deformation of the foundation pit and surrounding structures and analyzed the safety of the adjacent subway tunnel during the excavation of the foundation pit.
As a non-linear elastic material, the stress, strain, and strength properties of soil under stress distortion are quite different from those under conventional perimeter pressure. Conventional model tests are conducted under 1 g (g is the acceleration of gravity), and therefore, the conventional method underestimates the earth pressure and soil deformation caused by the excavation of the foundation pit [25,26]. Centrifugal tests, which can be performed under ng conditions, can create artificial gravity to compensate for this aspect. Zhang Ga [27] designed a centrifuge model test for foundation excavation used a loading system instead of excavated soil to increase the centrifugal acceleration to achieve a suitable self-weight stress state before excavation. After a series of tests, he was concluded that the real path of stress and deformation of the foundation pit could be reasonably simulated by the centrifuge model test. Sun Yuyong [28] studied the deformation characteristics of the foundation pit through field measurements and centrifuge model tests. It was concluded that the maximum sidewall displacements of the inner and outer pits decreased approximately linearly with the increase of the inner pit spacing but increased with the growth of the inner pit excavation width. Jin Hongliu [29] conducted a series of centrifuge model tests and numerical analyses. The deformation and earth pressure of the retaining structure, and the deformation characteristics of the retaining structure under various restricted soil widths, were studied. Jia Jinqing [30], Ma Xianfeng [31], Xu Qianwei [32], Zhou Qiujuan [33], and Li Lianxiang [34,35] carried out a series of centrifuge model test studies on foundation pits in soft soil areas from different degree perspectives and summarized the internal force and deformation law of the support structure.
Most of the above studies are focused on the economically developed soft soil areas in eastern China. Since the economic level and urban construction in the loess region of northwest China lag behind those in the soft soil region, the research on foundation pit engineering has not kept pace with the soft soil region. Foundation pit engineering has obvious regional characteristics; in other words, there is a huge difference between the engineering characteristics of loess and soft soil, which determines that foundation pits in loess region cannot copy all the experience of foundation pits in soft soil region. For this reason, it is very necessary to carry out the study of indoor model tests for foundation pits in loess areas.
In this paper, based on the previous research [4,8,12,21,22], a large-scale model test study of foundation pits supported by pile-anchors was carried out using a self-researched model box. The displacement and internal force of the supporting pile and the change of the internal force and earth pressure of the anchor during the excavation process are analyzed. The influence of different working conditions such as soil unloading and anchor tensioning on the internal force of the supporting pile is analyzed. The distribution of the axial force and shear stress of the anchor during the pulling process and the influence of the pulling of the adjacent anchor on its internal force are discussed. Eventually, the research results can provide reference for the model test research of pits supported by pile anchors and also for engineering applications.

2. Model Test Design

According to the purpose and conditions of this test, on the basis of a comprehensively considered variety of factors, the test mainly considers 9 key physical dimensions for the test: geometric dimension l, weight γ, displacement δ, strain ε, stress σ, elastic modulus E, Poisson’s ratio ν, concentrated force p and additional load q. Based on the similarity theory, the similarity criterion between the model and the prototype is deduced by means of dimension analysis, and then the model design and test are carried out according to the similarity criterion. According to the test requirements and the conditions of the test site, the geometric similarity ratio between the model and the prototype was set as 1:10. The results of the similarity relationship and similarity coefficient of each physical quantity of the model are shown in Table 1.

3. Model Test Production

3.1. Model Box and Test Soil

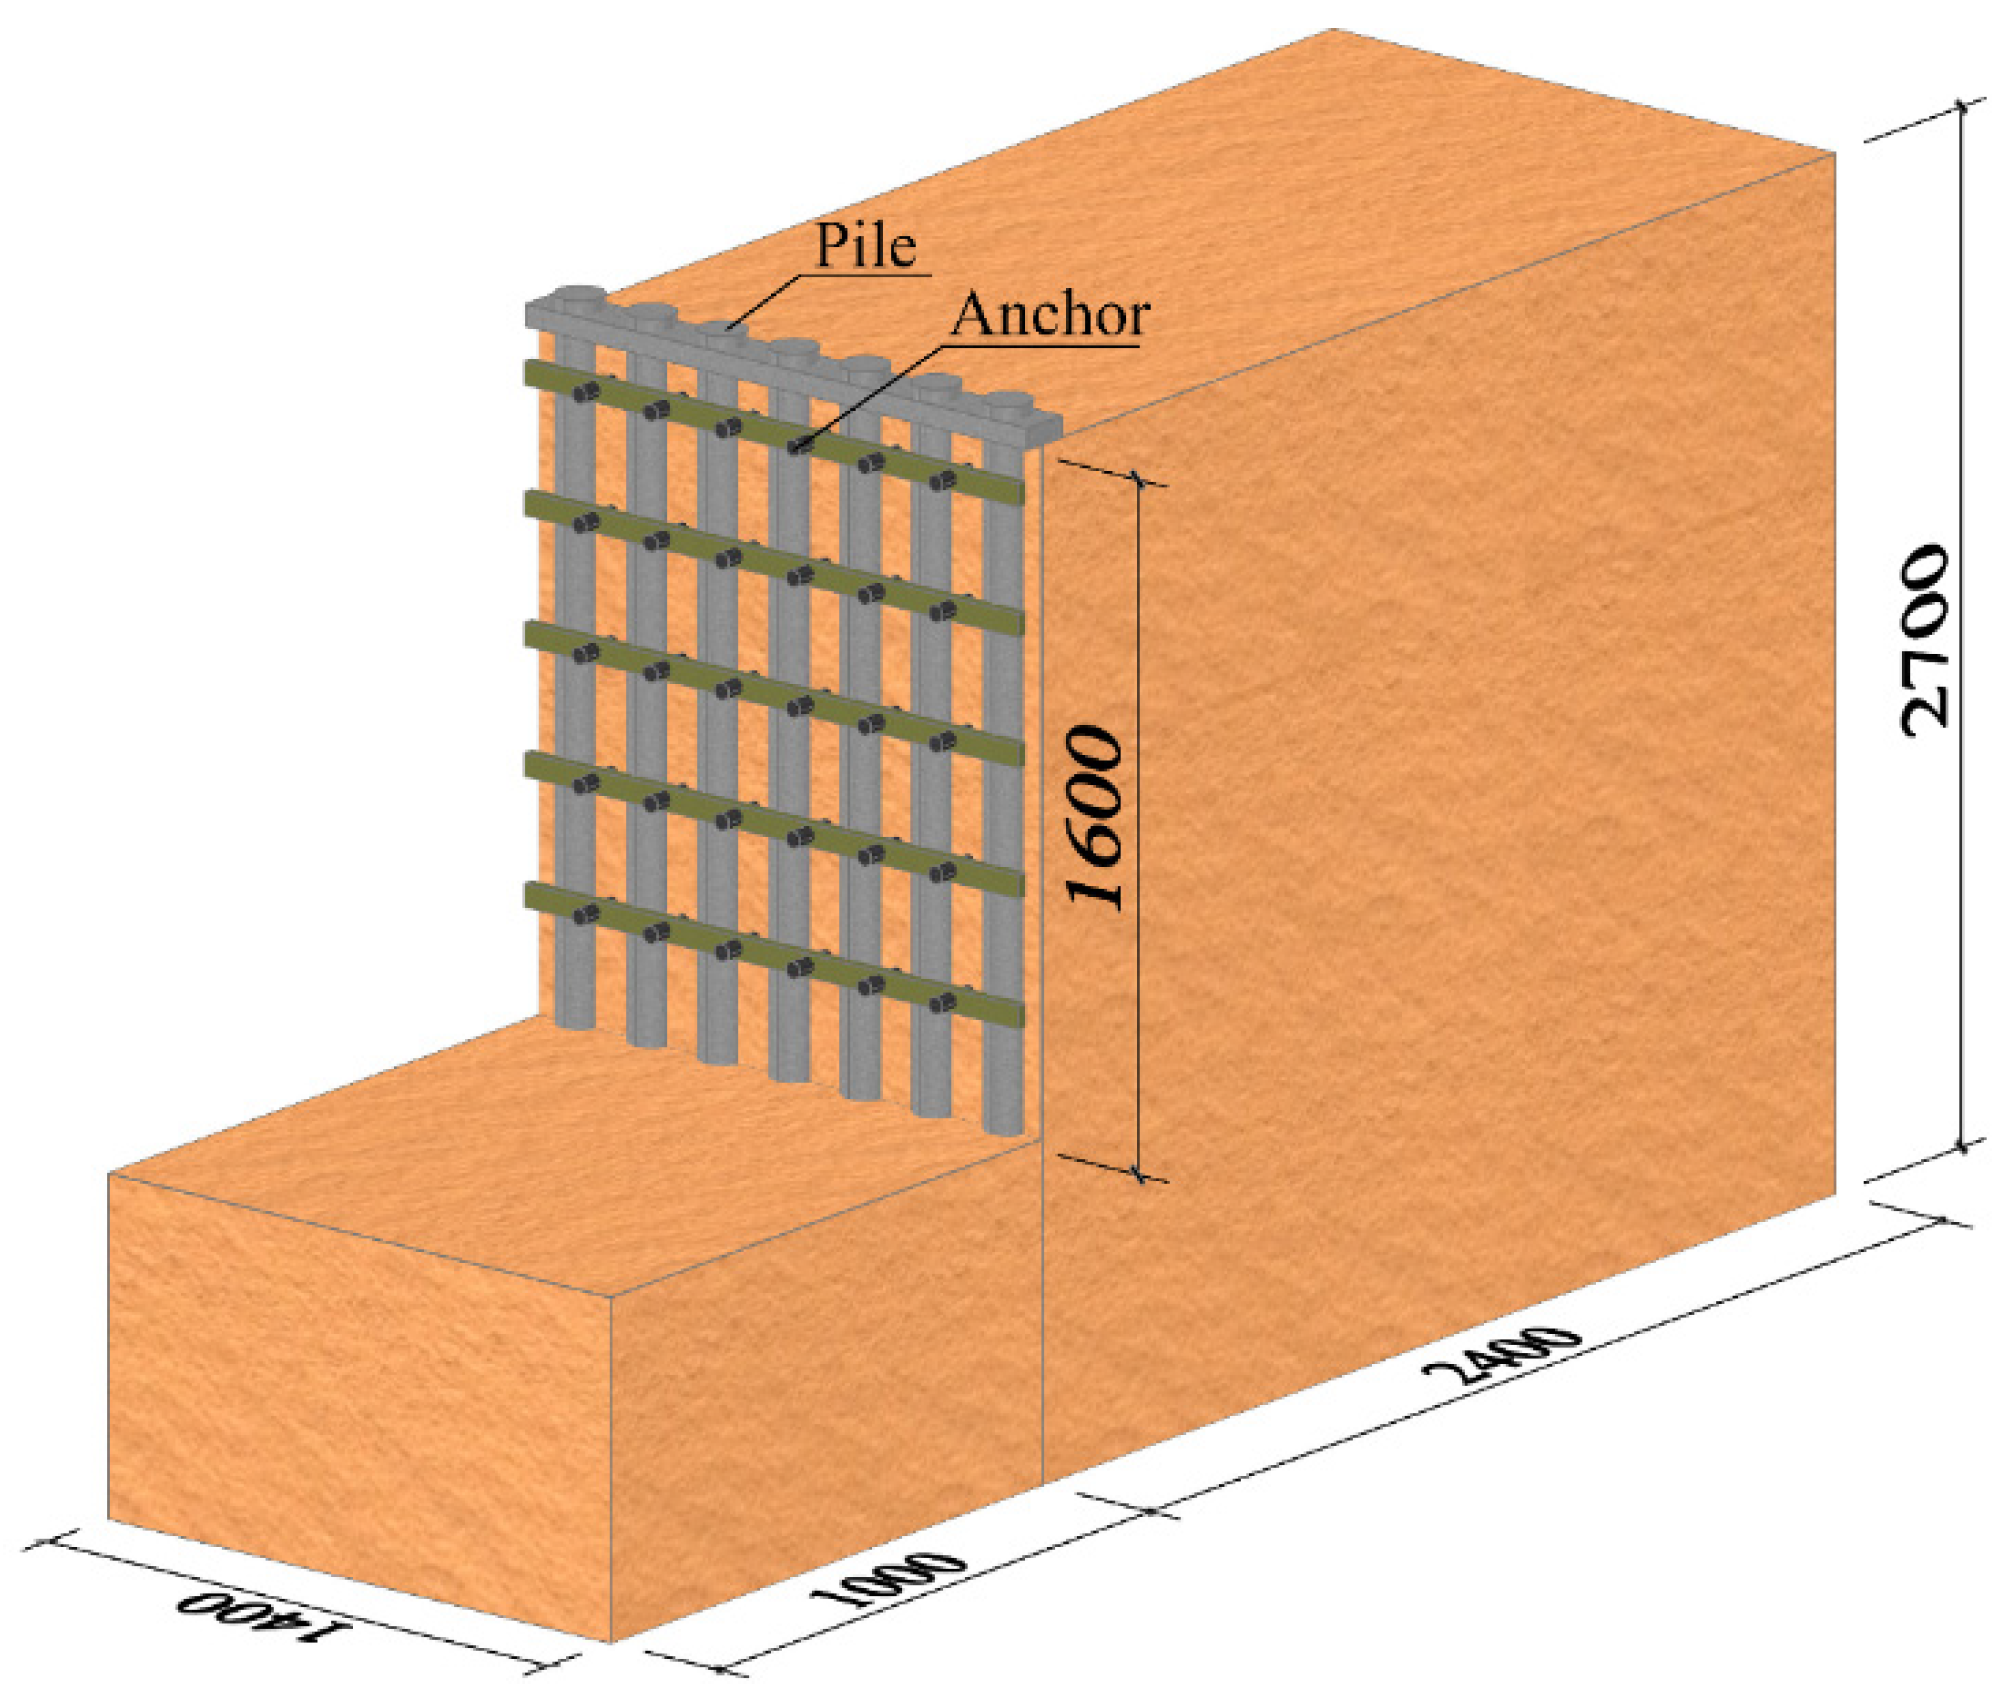
The excavation depth of the indoor scaled-down model test pit is 1.60 m. The support form of the foundation pit is an pile-anchor structure. The self-researched model box’s internal dimensions are 3.4 m (length) × 1.4 m (width) × 2.7 m (height), and the model schematic is shown in Figure 1. In order to ensure that the soil deformation can be observed visually during the test, 12 mm-thick plexiglass was used on both sides of the model box. The soil for this test was taken from the site of the foundation pit, and the soil was yellowish brown with a more uniform quality. The soil was filled in layers after sieving, mixing with water and stewing, and each layer was filled with 15 cm, and then leveled and compacted evenly to ensure the compaction coefficient reached 0.90. In order to reduce the influence of the boundary effect on the test results, simethicone was evenly applied inside the model box. Considering the remodeling effect of the soil after the completion of filling, the model was left to stand for more than 24 h before the test was conducted, and samples were taken during the filling process for indoor geotechnical tests. The physical and mechanical parameters of the soil were obtained, as shown in Table 2.

3.2. Support Piles and Anchors

The geometric parameters of the piles and anchors are shown in Table 3. The pile body reinforcement adopted No.8 galvanized iron wire. The concrete was made of particulate concrete, with a ratio of 0.49 (water): 1 (cement): 1.370 (sand): 2.486 (stone). Seven piles are arranged along the lateral row, three of the piles are tested, numbered pile 1 to pile 3 in order from left to right. The three piles were tested for strain and pile-top displacement. The anchor body is made of an 8 mm diameter reinforcement; its grouting material ratio is 1 (water): 0.5 (cement). There were 30 anchors in total. The anchors were numbered Mi-j from left to right and from top to bottom, i being the row number and j being the column number. All anchors in columns 1, 3 and 5 were tested for axial force. The numbering of the components was shown in Figure 2. Considering the fact that the fill was filled horizontally in layers and the anchors were prefabricated in advance, the test ignored the fact that the anchors needed a certain horizontal inclination to ensure the grouting effect in the actual project, so the anchors were arranged horizontally to facilitate the application and measurement of the axial force. The free section of the anchors was covered with corrugated pipe to release the contact between itself and the soil. The anchors were threaded from inside to outside through the holes reserved in the breast beam and fitted with anchors and clips. It was anchored to the breast beam after being tensioned by anchor puller KBT-10T. The anchor length and applied prestress are shown in Table 4.

3.3. Sensor Arrangement and Loading System

Strain gauges are attached to the surface of the concrete of the support piles and the surface of the anchor’s reinforcement. The surface of the strain gauge after pasting was treated with physical protection and waterproof measures. The earth pressure box was fixed on the surface of the pile. The parameters of the sensors are shown in Table 5 and Table 6. The location and dimensions of the sensor arrangement are shown in Figure 3. A steel plate is laid on the surface of the soil behind the top of the support pile, and the role of the plate is to transfer the jack load to the soil. The steel plate size is 138 mm (length) ∗ 48 mm (width) ∗ 30 mm (thickness). The additional load around the foundation pit was simulated by a self-designed vertical loading system consisting of a hydraulic jack, a counterforce frame (beam), a load sensor and a pressure-bearing steel plate. The jack axis coincides with the shape center of the steel plate. The equivalent effect of 20 kPa uniform load in this test is 30 kN after conversion.

3.4. Test Procedure and Data Collection

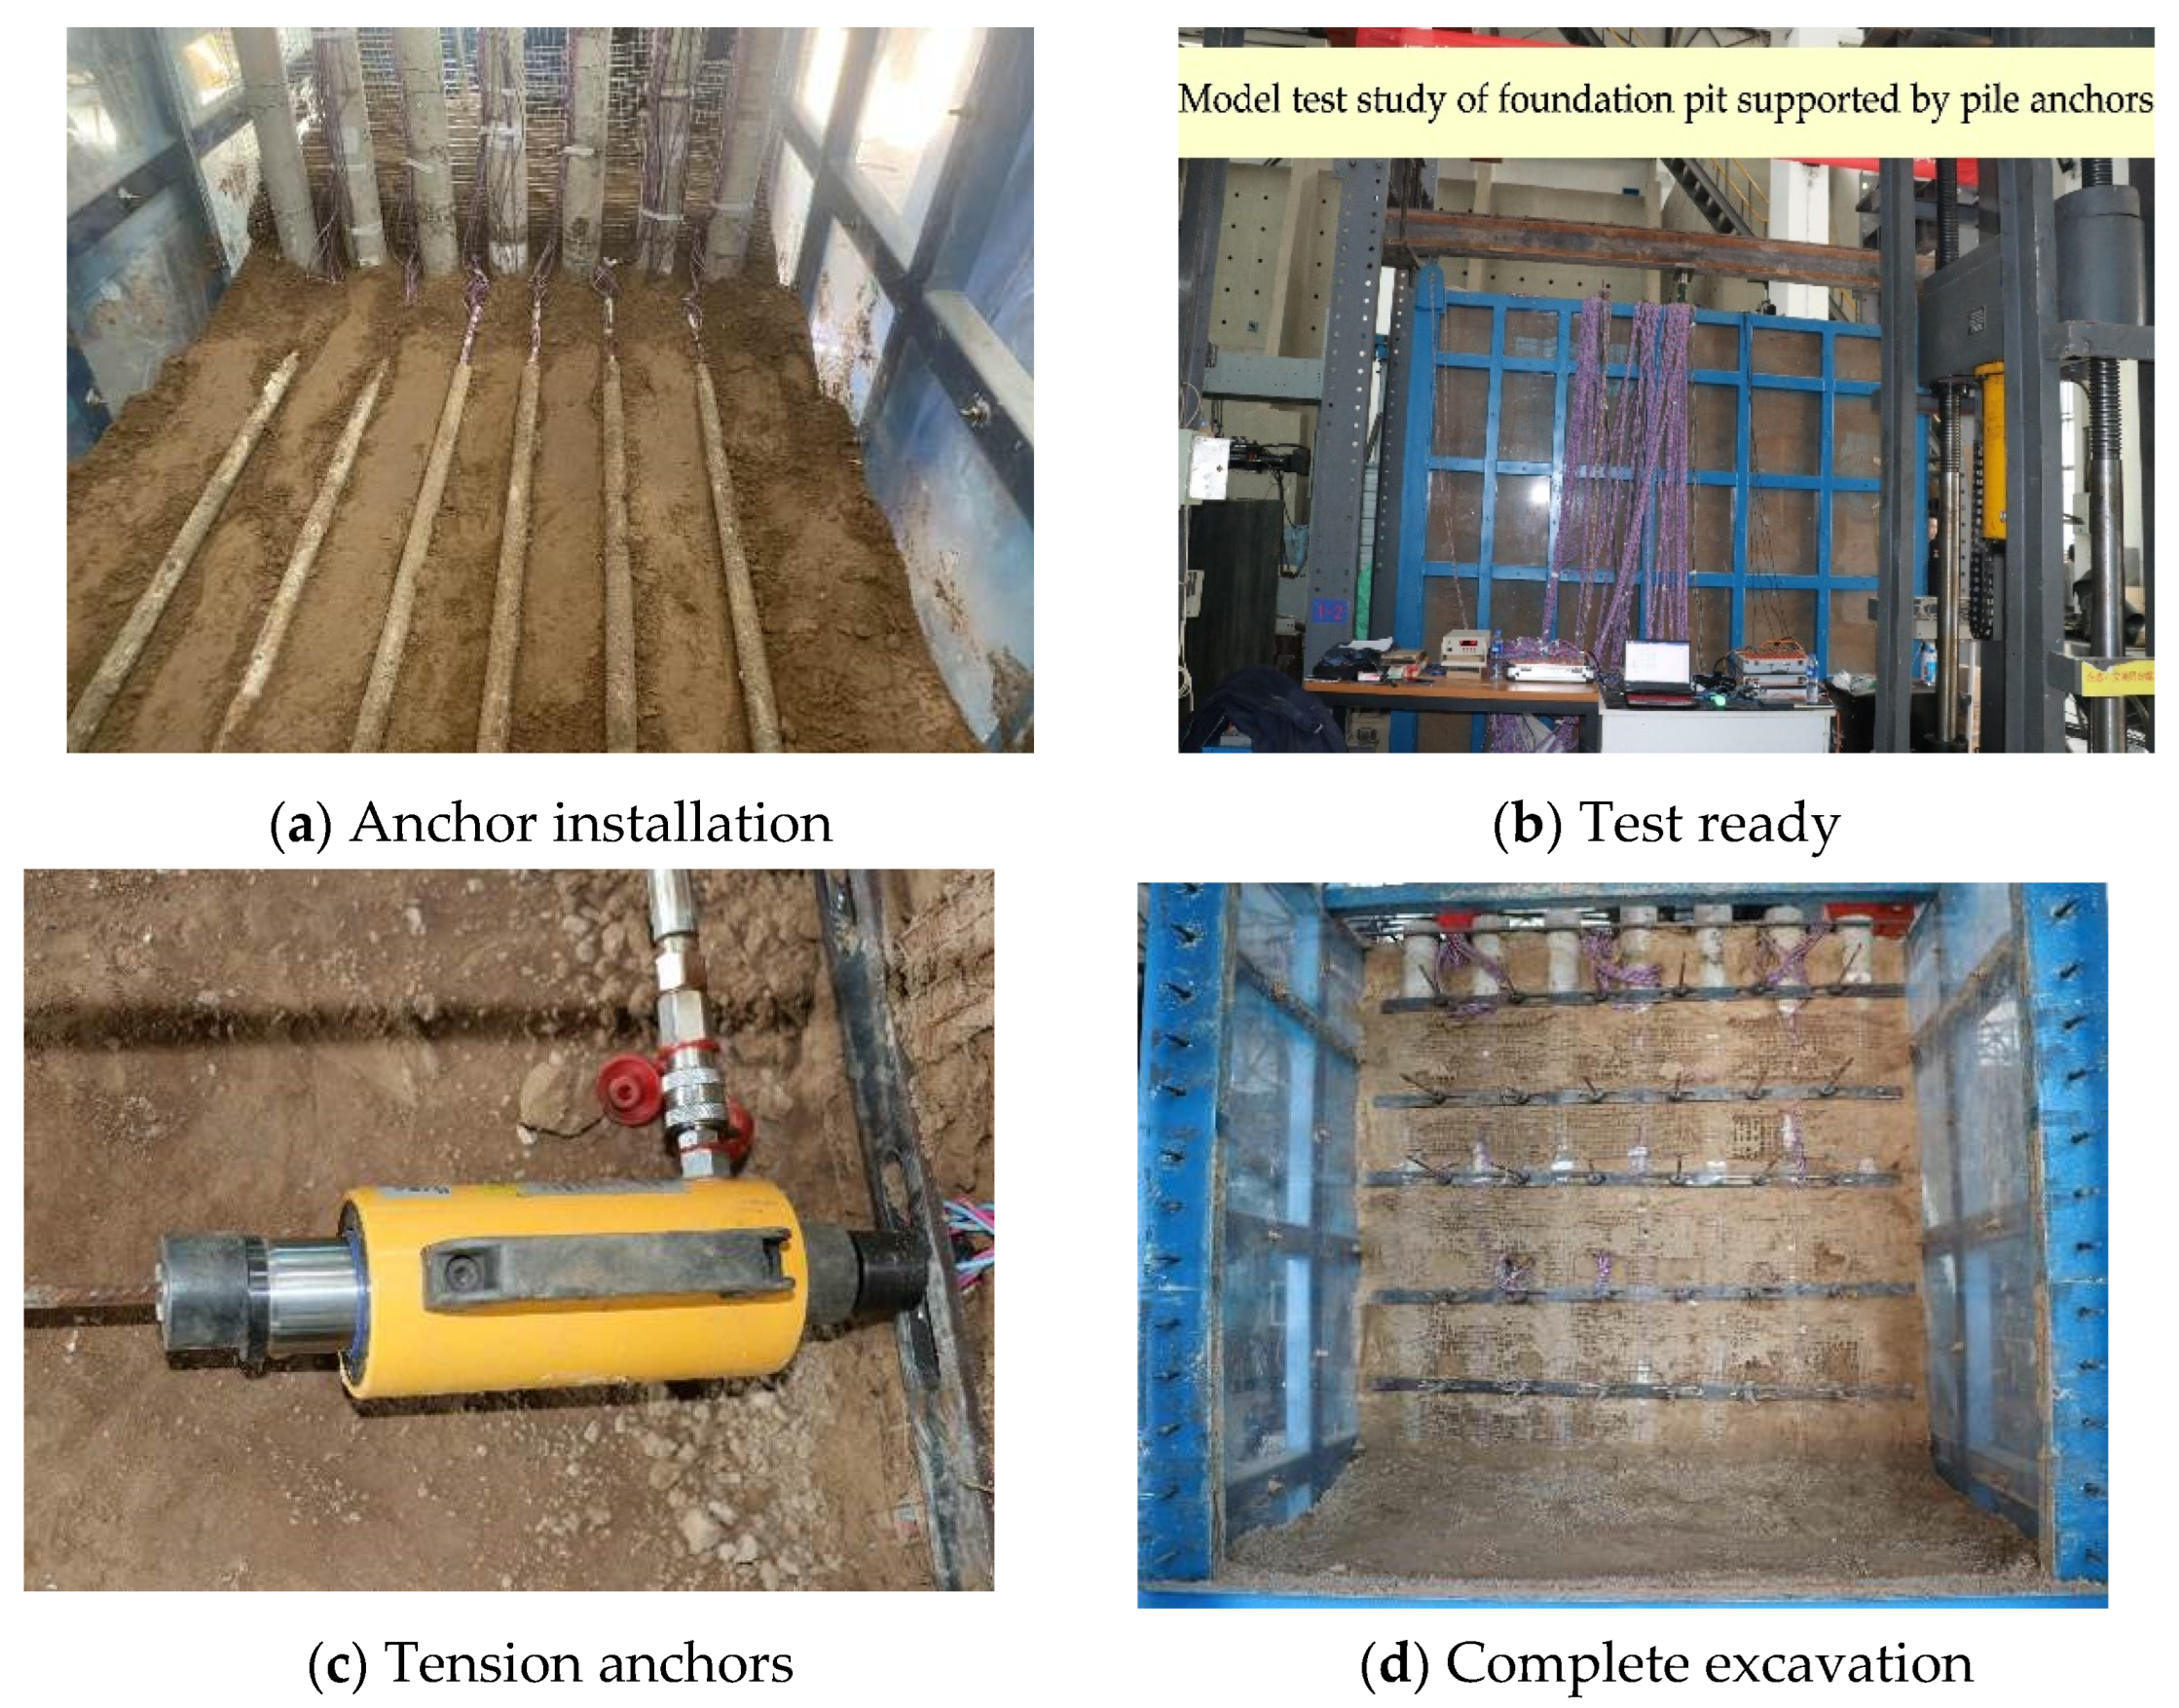
In order to facilitate the excavation of the soil in layers, six 40 mm thick hardwood boards were used for the front baffle of the model box. A layer of soil was excavated at 24-h intervals, and then the anchors were tensioned and locked. The working conditions design of excavation and anchor tensioning were shown in Table 7. A fine wire mesh sheet was arranged at the pile–soil interface to simulate a shotcrete surface, which is used to avoid soil gushing out from between the piles. The DH3816 N static stress–strain test and analysis system was used for data collection, and the test process and model completion are shown in Figure 4.

4. Analysis of Test Results

4.1. Analysis of Horizontal Displacement of Pile Top

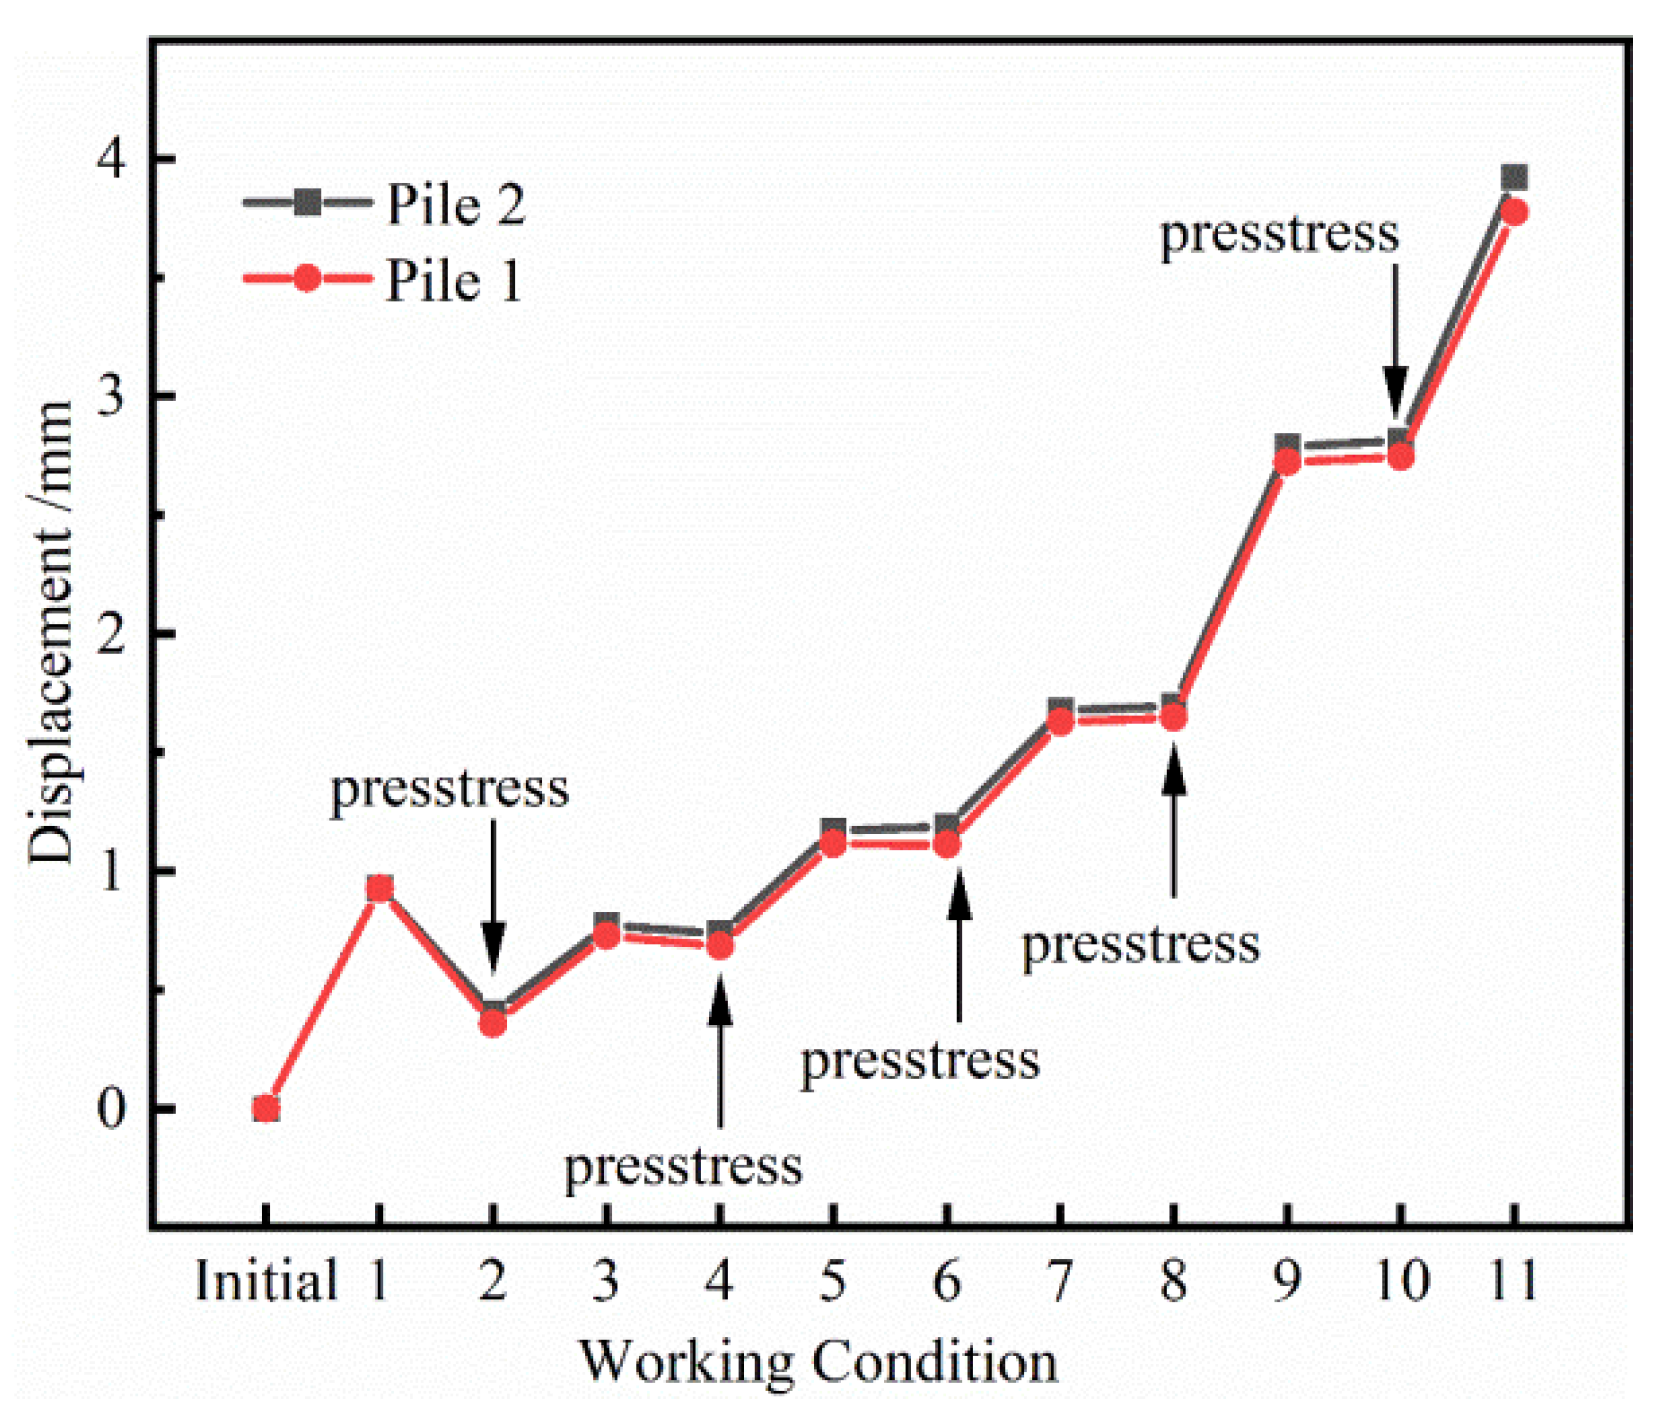
Figure 5 shows the horizontal displacement of the pile top under each working condition. From Figure 5, it can be seen that the displacement of the pile tops tends to increase non-linearly with the excavation of the soil in front of the piles and the tensioning of the anchors. The maximum horizontal displacement of the pile on the edge is 3.78 mm and the middle pile is 3.92 mm. After the prestressed anchors were tensioned, it changed the shear strength of the soil and increased the frictional resistance between the soil and the anchor solid, which slowed down the horizontal displacement of the soil and limited the horizontal displacement of the piles. The control effect of the first anchors on the horizontal displacement of the pile was obvious, which made the piles produce negative displacement and had a slowing effect on the development of the displacement of the subsequent piles. It can be seen that the first anchors played a crucial role in the deformation control of the piles, which further verified that the anchors could effectively control the deformation of the pile and the soil behind the pile.
Figure 6 shows the horizontal displacement rate of the pile tops under each working condition. It may be explained the fact that the soil resistance in front of the piles was reduced after the soil in front of the piles was excavated, which led to the displacement of the piles in the direction of the airside; after this, the displacement rate showed an increasing trend. When the prestressing anchors were tensioned, the tendency of soil displacement was limited, and the displacement rate showed a decreasing trend. Therefore, each excavation of soil and tensioning of anchor caused the displacement rate to fluctuate up and down. It can be seen that the anchor has obvious effects on limiting the displacement of supporting pile and soil.

4.2. Stress Analysis of Supporting Piles

According to the knowledge of material mechanics, the formula for calculating the pile bending moment from strain is [21]:
M = E I ε i 1 ε i 2 B
where EI is the bending stiffness of the pile body, εi1, εi2 are the strain values on both sides of the i measuring point, and B is the pile diameter.
It can be seen from the above formula that for the piles, their flexural stiffness EI and pile diameter B are fixed values, so the distribution of the bending moment of the piles’ body is the same as the distribution of the strain difference. In order to analyze the change law of the internal force of the pile body intuitively, this paper uses strain instead of bending moment to analyze the strain of pile 2 under different excavation conditions and anchors tensioning conditions, and its distribution is shown in Figure 7. As the soil in front of the pile is excavated, the distribution of strain in the pile body shows itself to be nonlinear. When the pile is in working condition 1 (cantilever stage), the retaining side of the pile is under tension and the maximum value is at the top of the pile, and the strain distribution is in a shape which is small at both ends and large at the middle. As the pile moves from the cantilever state to the single pivot state, the pile bending moment changes from tension on the retaining side to tension on the hollow side. As the supporting pile enters the multi-supported state, the soil resistance in the passive zone gradually increases, the maximum bending moment, the anti-bending point of the pile are shifted downward, and the value of the maximum bending moment on the airside is significantly reduced. Unlike the pile in cantilever state, which is only subject to the soil force, the pile-anchor support structure is subject to the interaction of both soil unloading and anchor tensioning. The bending moment at the embedded end also changes from being characterized by tension on the retaining side in the initial working condition, to tension on the hollow side in the multi-pivot stage, and then returns to a state of tension on the retaining side after excavation is completed. This shows that the anchor is tensioned to form a synergistic effect with the pile and the soil, which effectively changes the force state of the supporting pile and avoids the ultimate force state of the supporting pile.
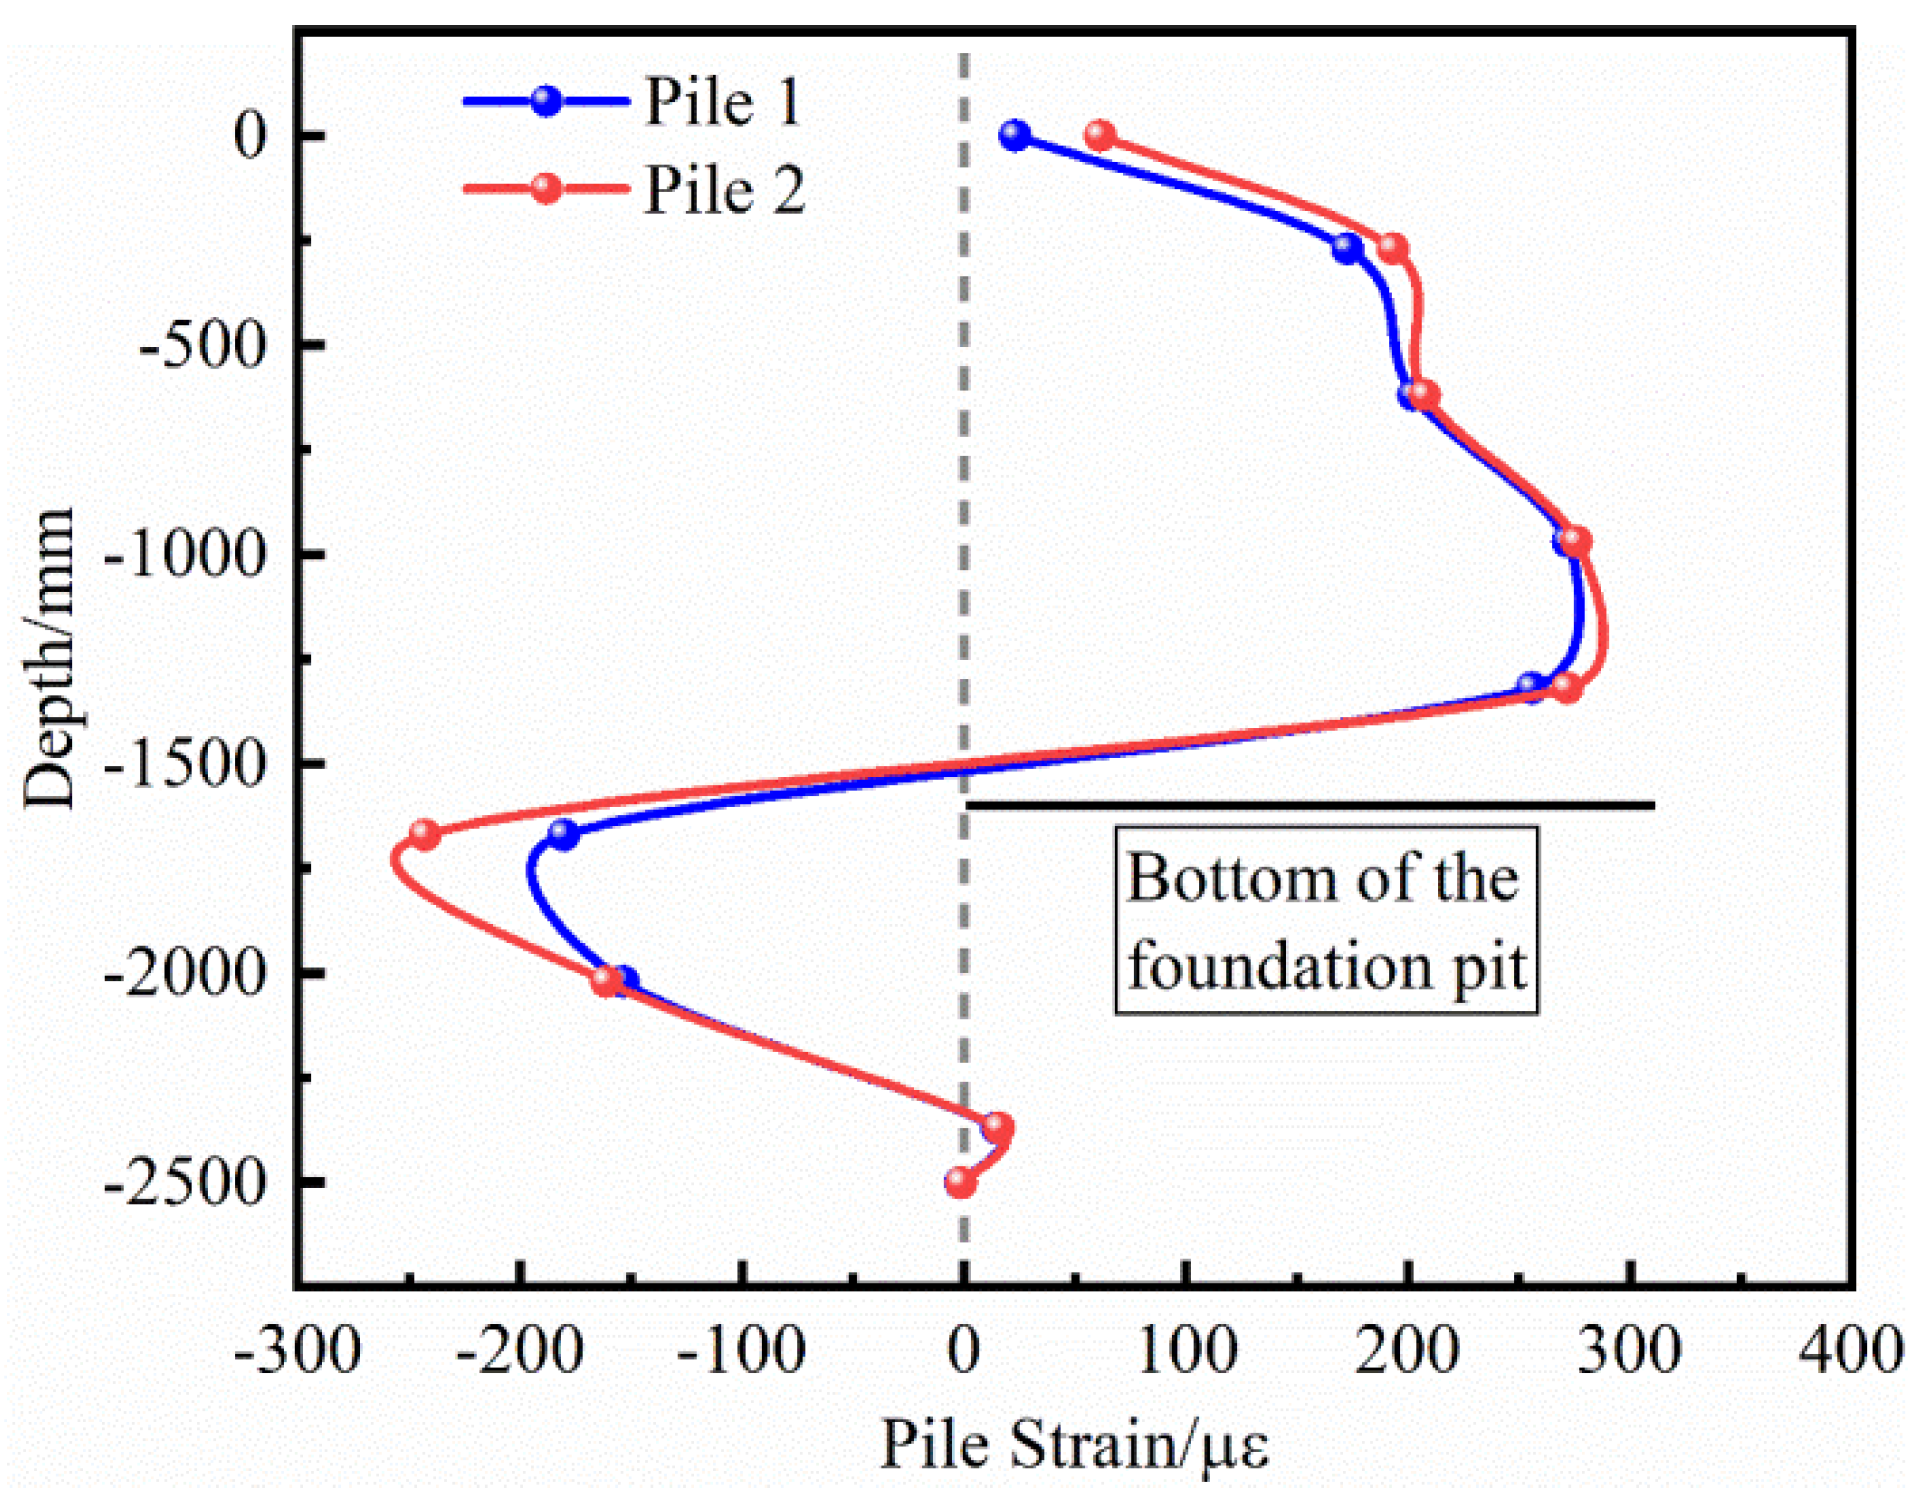
Since the spatial position of the supporting pile has an influence on the bending moment of the pile, it is necessary to further analyze the bending moment law of the supporting pile at different positions. The strains of different supporting piles under the final working condition are shown in Figure 8. It can be seen from the figure that the bending moment of pile 2 (intermediate pile) is larger than pile bending moment of pile 1 (side pile). Specifically, the embedded end bending moment is more obviously so. This is due to the boundary effect near the side-pile: the soil near the pile is more self-stabilizing, and the soil pressure acting on the pile is relatively small. This makes the pile bending moment smaller. In the actual situation on site, the supporting piles located at the corner of the pit have smaller pile bending moment than the supporting piles in the middle due to the existence of the shaded angle. The whole pile moment distribution is “S” type, and the reverse bending point is near the bottom of the pit. The supporting pile is under tension on the hollow side above the pit bottom and under tension on the retaining side below the pit bottom, and the maximum positive bending moment is greater than the maximum negative bending moment. The pile–soil–anchor interaction makes the pile moment distribution more reasonable than the cantilever state, reduces the pile internal force and improves the safety and stability of the support structure.

4.3. Earth Pressure Analysis

Figure 9 shows the measured soil pressure variation curves under different working conditions. For the measured active earth pressure, the active earth pressure above the bottom of the pit gradually increases under each excavation condition, showing a small distribution at the top and large at the bottom. This is because the supporting pile moves into the pit under the action of the excavated soil in front of the pile and the additional load at the top after the pile, which drives the soil behind the pile to move forward as well, and the soil stress in the active zone increases gradually. For the passive zone soil pressure, as the excavation depth increases, the measured soil pressure below the excavation surface is displaced onto the excavation side due to the supporting pile, and the stress of the soil in front of the pile increases due to the extrusion. In the early stage of excavation, the soil stress in the passive zone in front of the pile increases with depth and shows a small distribution in the upper part and large in the lower part of the figure. At the later stage of excavation, the passive soil pressure in front of the pile is distributed in the shape of large at the top and small at the bottom.
In order to verify the reasonableness of the measured soil pressure, we calculated the Rankine soil pressure of the support structure and compared it with the measured soil pressure. We found that the measured soil pressure is smaller than the Rankine soil pressure and has a non-linear distribution. This is because the Rankine earth pressure theory is based on the rigid retaining wall, which assumes that the soil reaches the ultimate state [36], while the foundation pit does not allow the soil to reach the ultimate state. Therefore, when designing and analyzing the pile-anchored support structure based on the Rankine earth pressure theory of traditional rigid retaining walls, the calculation results may be large. In the presence of complex excavation conditions or where the deformation range of the support structure is strictly limited, the results calculated by the classical Rankine earth pressure theory may not meet the requirements of the project. Therefore, further research on non-limit states of earth pressure applicable to the foundation pit enclosure structure is needed at a later stage.

4.4. Analysis of Internal Forces of Anchors

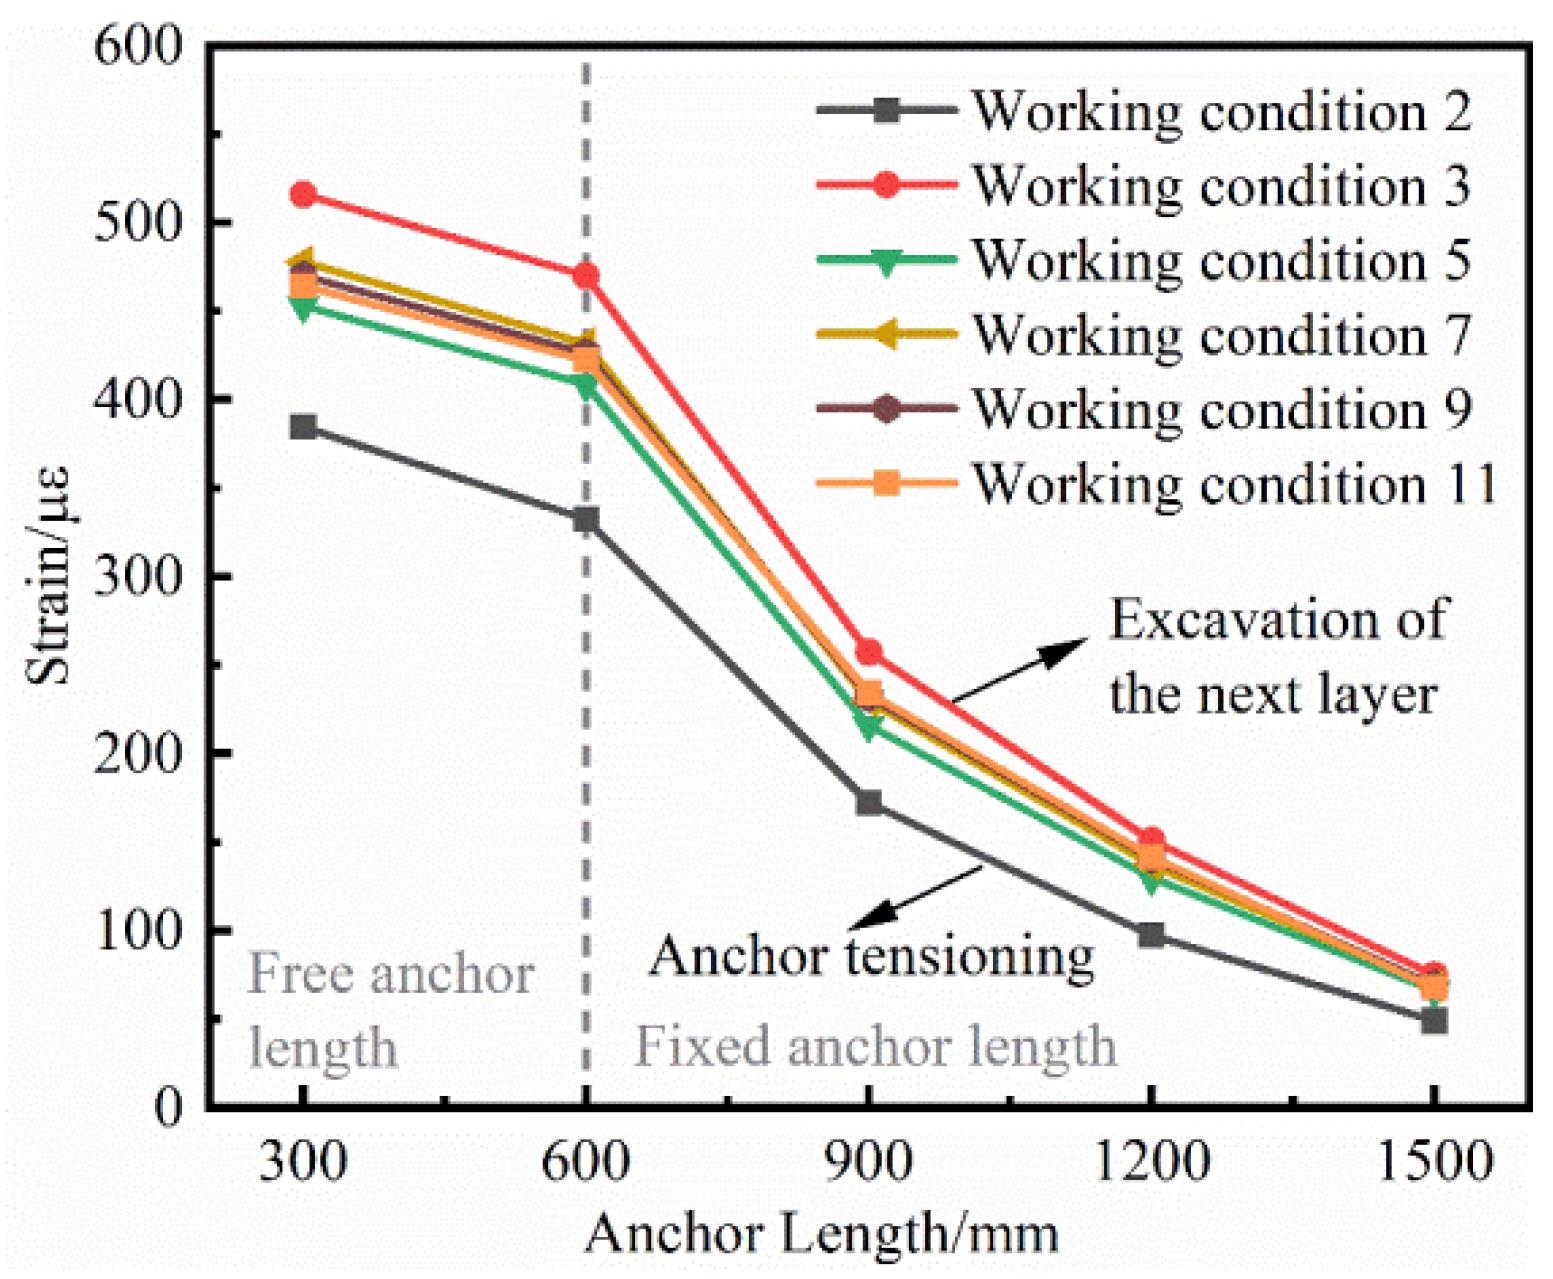
Figure 10 shows the axial strain distribution of the five anchors at different depths. From the theory of elasticity, it is known that the axial force and axial strain distribution are the same for the same anchors. Therefore, it is more intuitive to use strain instead of axial force when analyzing the axial force. From Figure 10, the axial force of the anchor tends to be zero for the whole length when it is not tensioned. When the prestressing force is applied, the axial force at each point starts to increase and gradually reaches the peak. After the anchor is tensioned, the frictional resistance at the interface between the anchor solid and the soil starts to play, and the anchor section shares part of the axial force coming from the free section. So, the axial force starts to decrease with the length of the anchor solid and drops to the minimum at the end of the anchor [37]. After the anchor tensioning is completed and the jack is removed, the internal force at each measurement point of the anchor shows a certain decrease. At this time, the relative displacement of the anchor solid and its surrounding soil body no longer increases, and the internal force stabilizes. It can also be seen from the figure that the magnitude of the axial force of the anchor also depends on the magnitude of the applied external force. The greater the applied external force, the greater the axial force of the anchor, so the external force within a reasonable range can give full play to the frictional resistance of the anchor solid and the soil. By connecting with the girders and piles, the anchor reduces the deformation of the supporting pile and the soil behind the pile, improves the force state of the pile, and increases the safety and stability of the supporting structure.
Due to the large number of anchors tested in this experiment, only anchor M2-5 was used to analyze the axial force and shear stress distribution of anchors under different excavation conditions. Figure 11 shows the distribution of the axial force of anchor M2-5 under different excavation conditions. From Figure 11, it can be seen that the anchor axial force starts to increase with the application of prestress and continues to reach its peak after the next layer of soil excavation. The reason for this is that the passive earth pressure starts to decrease due to the continuous unloading of the soil in front of the pile. The pile has a tendency to move into the pit under the action of the soil in the active zone, and this tendency is suppressed by the presence of the anchor. In the later excavation conditions, the anchor shaft force starts to decrease gradually, but it is higher than the initial shaft force after the anchor is tensioned. This indicates that once the anchor is prestressed, its limiting effect on the displacement of the pile and the soil behind the pile will continue to exist, thus ensuring the safety of the support structure.
After the anchor is tensioned, the internal force of any section of the anchored section is equal to the sum of the internal force of the reinforcement and the internal force of the anchor, and the quotient of the difference between the internal force of the two sections and the surface area of the anchor is the shear stress of the anchor. Its calculation formula is given by Liu Yongquan [38].
τ = ( ε j ε j + 1 ) E A s π d Δ s
where E is the modulus of elasticity of the reinforcement, As is the cross-sectional area of the reinforcement, εi is the strain value of any section i, Δs is the distance between two measurement points and d is the diameter of the anchor solid.
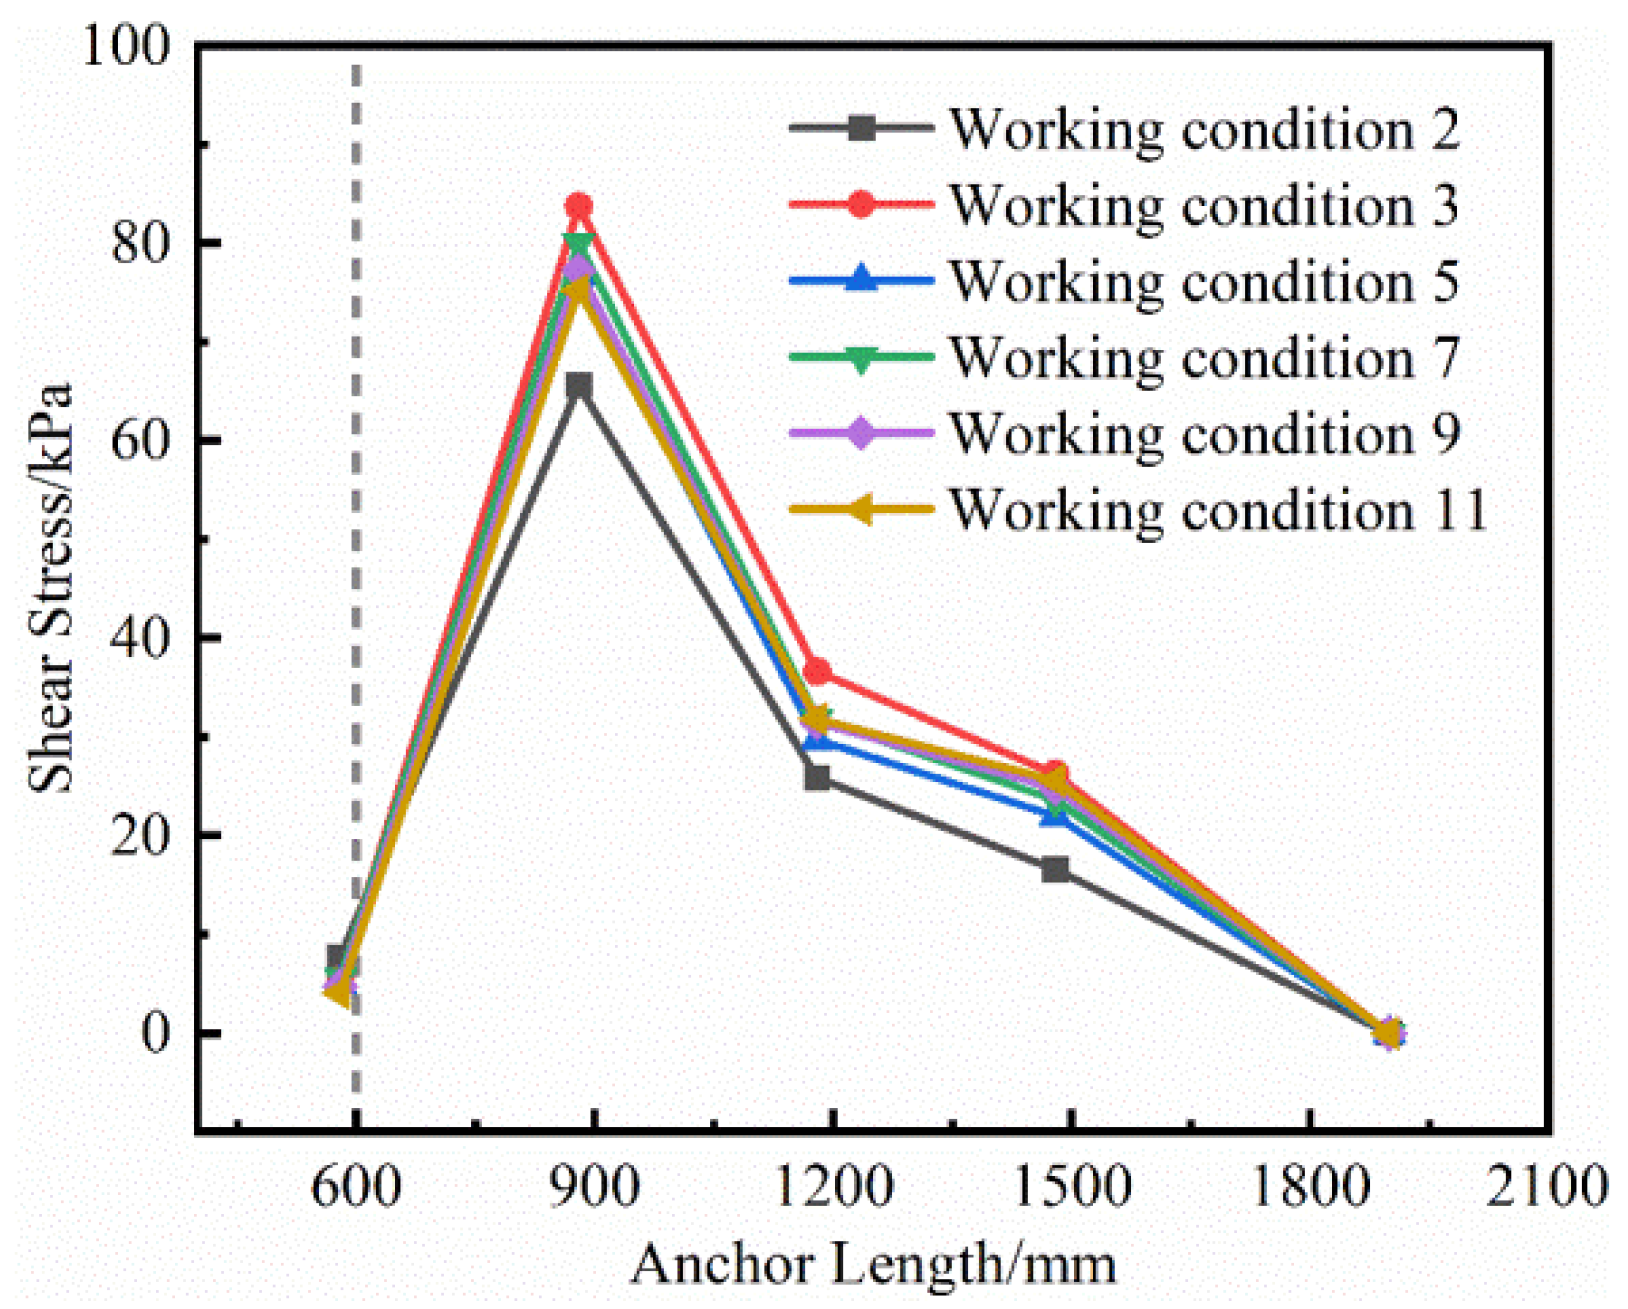
Based on Equation (2), the shear stress distribution of anchor M2-5 under excavation conditions was shown in Figure 12. What can be seen is that, for the tension type anchor, the shear stress distribution of the anchor solid shows a trend of increasing first and then decreasing. It reaches the peak after a certain distance from the beginning of the anchorage section, and then starts to decrease and tends towards zero at the end of the anchorage section. Therefore, for tension anchors, the anchor solid shear stress is mainly borne by the first half of the anchorage section, and the second half of the anchorage section takes up a relatively small proportion. This shows that the anchor solid is not as long as possible, but that there is an optimal anchorage length. After the anchorage section exceeds a certain length, the shear stress provided by the anchor solid is very limited, which is not conducive to the conservation of resources and the sustainable development of the foundation pit project.
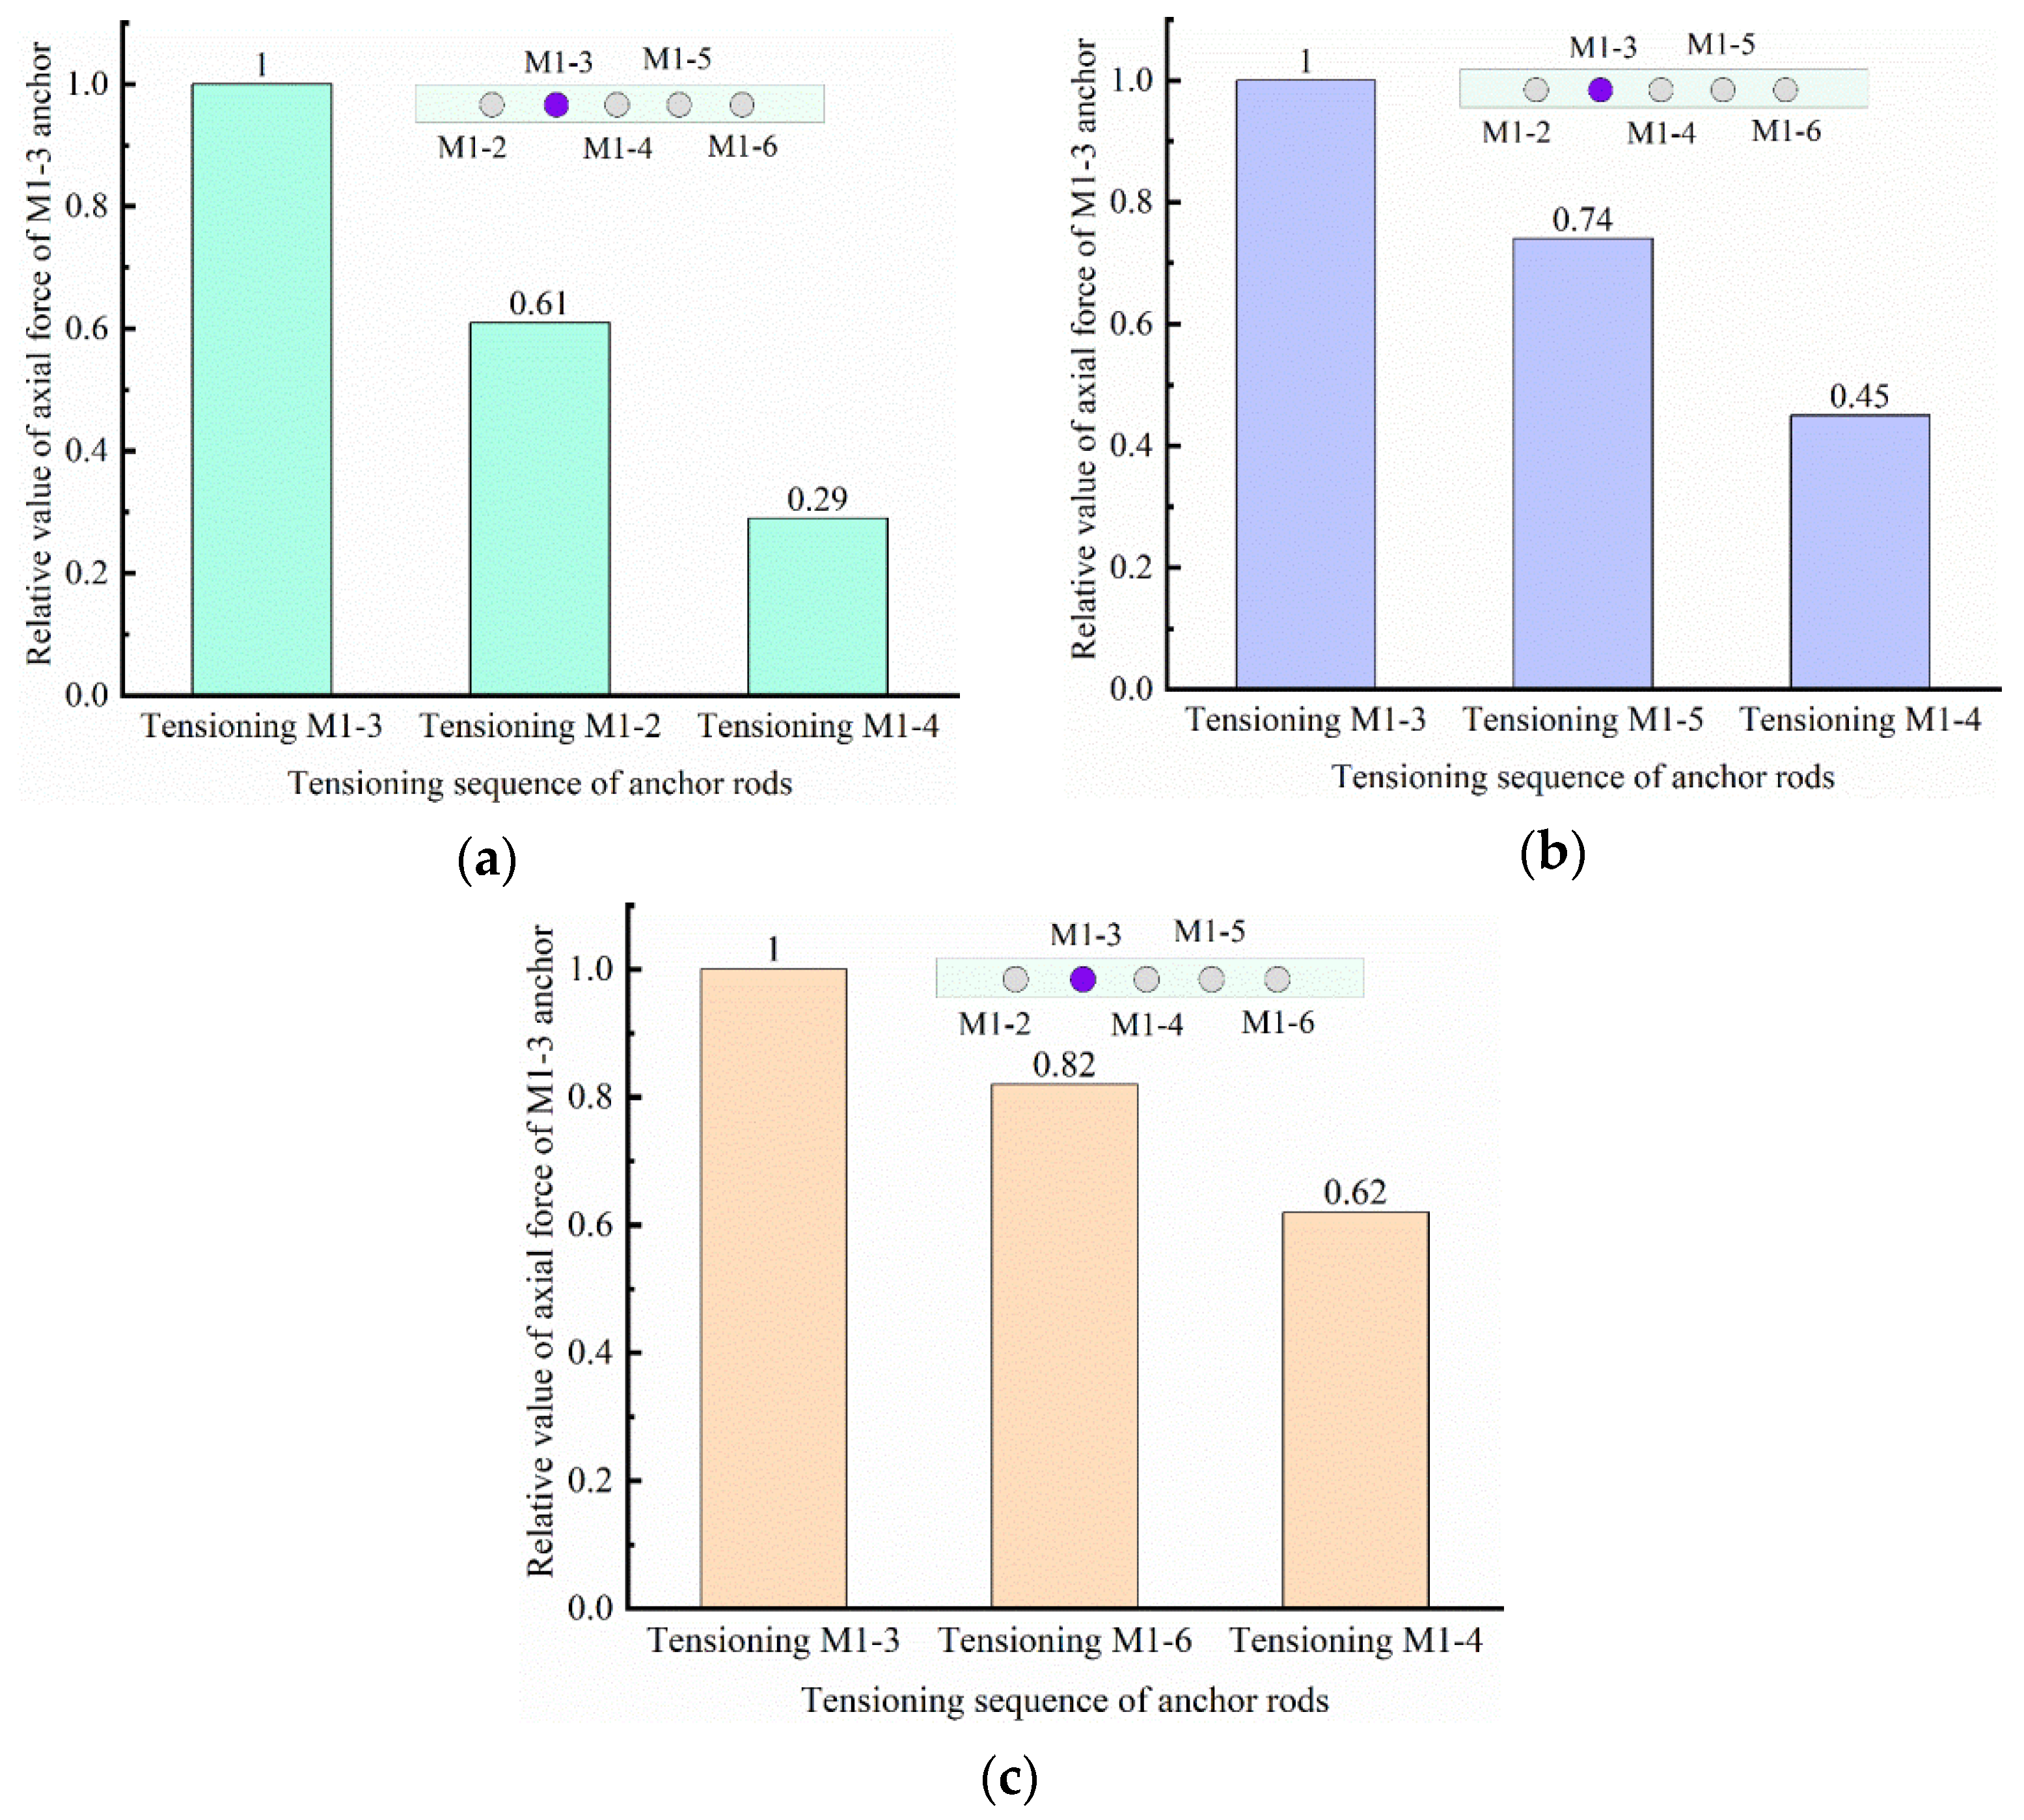
Due to the group anchor effect between soil anchors, the tensioning of adjacent anchors affects the internal force of each anchor. The following is an example of anchor M1-3; the effect of tensioning the anchors adjacent to anchor M1-3 on the internal force of M1-3 is investigated, and the results are shown in Figure 13. In order to facilitate visual analysis of the loss of axial force of anchor M1-3, the internal force of anchor M1-3 during tensioning of adjacent anchors is normalized and expressed as the relative value of its axial force. The initial value of the axial force of anchor M1-3 after treatment was 1. The anchor M1-3 was tensioned first, followed by the adjacent anchors in sequence. When the anchors were tensioned according to the sequence in Figure 13a, it can be seen that the axial force of the target anchor M1-3 lost 39% when the anchor M1-2 to the left of M1-3 was tensioned, and the axial force of M1-3 lost another 32% when the anchor M1-4 to its right was tensioned. This was only 29% of its initial value. When tensioned according to the sequence shown in Figure 13b, the axial force of anchor M1-3 is 74% and 45% of its initial value, respectively. When tensioned in the order shown in Figure 13c, the axial forces of anchors M1-3 are 82% and 62% of their initial values, respectively. It can be seen that the tensioning sequence of anchors has a large effect on the axial force of anchors. When the anchors were tensioned sequentially, the loss of axial force of the target anchors was more obvious. The axial force loss of the target anchor is significantly reduced if tensioning is done at a certain number of intervals. The greater the distance between tensions, the smaller the axial force loss of the target anchor; for the inverse, the greater is the axial force loss. Therefore, the tensioning sequence of anchors in actual construction can follow the principle of a certain distance between tensions in order to reduce the loss of axial force of anchors during the construction process, which leads to the decrease of anchoring effect of anchors. This can effectively avoid the situation that the axial force loss of anchor is too large to control the deformation of the foundation pit and reduce the potential safety of the foundation pit.

5. Conclusions

(1) The pile-anchor support structure has good support effect for foundation pit in loess area. The reason is that the interaction of pile–soil–anchor makes the deformation of soil and support structure coordinate with each other, which can effectively restrain the lateral deformation of soil after the pile, especially as the position of the first anchor point has a more obvious limiting effect on the displacement of support pile.
(2) Compared with cantilever piles, where the bending moment is distributed in tension on one side and compression on the other side, the pile-anchor support structure has an “S”-type distribution of bending moment due to the presence of prestressed anchors. With the excavation of the soil and the effect of the prestressing anchor, the maximum value of the pile bending moment and the position of the anti-bending point are decreasing. This avoids the possible extreme force state of the supporting pile, thus improving the bearing capacity of the supporting pile.
(3) Different from the classical linear distribution of earth pressure, the active and passive earth pressure of the pile-anchor-retaining structure show nonlinear distribution due to the unloading effect caused by soil excavation on the passive side and the action of prestressed anchor. The distribution mode of the measured earth pressure is quite different from that of Rankine earth pressure, and the measured earth pressure is smaller than that of Rankine earth pressure. Therefore, the use of earth pressure theory in the design and analysis of foundation pit support should be carefully considered and verified with engineering experience, so as to ensure that the design of foundation pit support is reasonable, economic and safe.
(4) After the prestressing force is applied to the anchors, the axial force starts to decrease at the beginning of the anchorage section and decreases to the minimum at the end of the anchorage section. The shear stress of the anchors starts to increase at the beginning of the anchorage section, reaches the peak after a certain distance, and then starts to decrease gradually.
(5) Due to the effect of group anchors, the tensioning of adjacent anchors will reduce each other’s internal force and affect the anchoring effect. It is recommended that anchor rods at the same horizontal position be tensioned at interval holes. This can reduce the prestress loss of the front anchors, and the larger the interval distance, the smaller the prestress loss and the better the corresponding anchorage effect.

Author Contributions

Conceptualization, Y.Z. and T.S.; methodology, T.S. and Z.W.; formal analysis, T.S., Z.W., Y.Z. and S.Y.; investigation, T.S.; data curation, T.S.; writing—original draft preparation, T.S.; writing—review and editing, Y.Z., Z.W. and S.Y. All authors have read and agreed to the published version of the manuscript.

Funding

This research was funded by the National Natural Science Foundation of China (Grant No. 51568042) and Technology Project of Gansu Provincial Department of Housing and Urban-Rural Development Construction (Grant No. JK2022-03).

Institutional Review Board Statement

Not applicable.

Informed Consent Statement

Not applicable.

Data Availability Statement

The data of simulation and monitoring in the article is not freely available due to legal concerns and commercial confidentiality. Nevertheless, all the concepts and procedures are explained in the presented research and parts of the research may be available upon request.

Acknowledgments

The authors of the present work feel grateful and would like to thank National Natural Science Foundation of China, Western Center of Disaster Mitigation in Civil Engineering.

Conflicts of Interest

The authors declare that they have no conflict of interest.

References

  1. Zheng, G. Method and application of deformation control of excavations in soft ground. Chin. J. Geotech. Eng. 2022, 44, 1–36+201. [Google Scholar] [CrossRef]
  2. Bai, B.; Wang, Y.; Rao, D.Y.; Bai, F. The effective thermal conductivity of unsaturated porous media deduced by pore-scale SPH simulation. Front. Earth Sci. 2022, 10, 943853. [Google Scholar] [CrossRef]
  3. Bai, B.; Yang, G.C.; Li, T.; Yang, G.S. A thermodynamic constitutive model with temperature effect based on particle rearrangement for geomaterials. Mech. Mater. 2019, 139, 103180. [Google Scholar] [CrossRef]
  4. Xie, Y.; Zhang, S.H.; Zhou, D.Q. Experimental Study of Mechanical Behavior of Passive Loaded Piles Adjacent to Piled Foundation. Ksce J. Civ. Eng. 2018, 22, 3818–3826. [Google Scholar] [CrossRef]
  5. Xie, J.; Lu, X.J.; Wang, J.N.; Yang, L.; Han, X.G. Force Chain Effect of Deep Foundation Pit Supported by Soldier Piles in the Sand-Gravel Layer. Shock. Vib. 2021, 2021, 9617807. [Google Scholar] [CrossRef]
  6. Liu, Y.A.; Wang, C.M.; Gao, R.Y.; Li, B.L.; Liu, X.Y.; Liang, Z.; Jiang, N.; Chen, Z.D. Experimental Study for the Embedded Depth of Support Structure Foundation Pit in Granite Residual Soil Area. Adv. Civ. Eng. 2020, 2020, 6645942. [Google Scholar] [CrossRef]
  7. Bai, B.; Zhou, R.; Cai, G.Q.; Hu, W.; Yang, G.C. Coupled thermo-hydro-mechanical mechanism in view of the soil particle rearrangement of granular thermodynamics. Comput. Geotech. 2021, 137, 104272. [Google Scholar] [CrossRef]
  8. Yu, S.H.; Geng, Y.C. Influence Analysis of Underground Excavation on the Adjacent Buildings and Surrounding Soil Based on Scale Model Test. Adv. Civ. Eng. 2019, 2019, 6527175. [Google Scholar] [CrossRef]
  9. Xiao, Y.; Wang, X.G.; Yu, F.; Wang, Z.J. Experimental Investigation of h-Type Supporting System for Excavation beneath Existing Underground Space. Buildings 2022, 12, 635. [Google Scholar] [CrossRef]
  10. Zheng, G.; Lei, Y.W.; Cheng, X.S.; Li, X.Y.; Wang, R.Z. Influences and mechanisms of anchor failure on anchored pile retaining system of deep excavations. Chin. J. Geotech. Eng. 2020, 42, 421–429. [Google Scholar] [CrossRef]
  11. Zheng, G.; Wang, R.Z.; Cheng, X.S.; Lei, Y.W.; Li, X.Y.; Zhou, Q. Mechanism and control of progressive collapse caused by local anchor failure in multiple-level anchored pile excavation. Chin. J. Geotech. Eng. 2022. Available online: http://kns.cnki.net/kcms/detail/32.1124.TU.20220512.1844.006.html (accessed on 13 May 2022).
  12. Tang, D.Q.; Yu, F.; Chen, Y.T.; Liu, N.W. Model excavation tests on double layered retaining structure composed of existing and supplementary soldier piles. Rock Soil Mech. 2019, 40, 1039–1048. [Google Scholar] [CrossRef]
  13. Wu, H.G.; Pai, L.F.; Lai, T.T.; Zhang, J.D.; Zhang, Y.P.; Li, Y.R. Study on cooperative performance of pile-anchor-reinforced soil combined retaining structure of high fill slopes in mountainous airports. Chin. J. Rock Mech. Eng. 2019, 38, 1498–1511. [Google Scholar] [CrossRef]
  14. Liang, F.Y.; Yao, G.S.; Chen, H.B.; Li, J.P. Model tests on behavior of axially loaded piles subjected to lateral soil movement. Chin. J. Geotech. Eng. 2010, 32, 1603–1609. [Google Scholar]
  15. Lin, H.; Lei, G.H.; Xu, L.; Lei, G.G. Similarity analysis of deflection behavior of laterally loaded piles in 1g model tests. J. Cent. South Univ. 2012, 43, 3639–3645. [Google Scholar]
  16. Zhao, Z.F.; YE, S.H.; Zhu, Y.P.; Tao, H.; Chen, C.L. Scale model test study on negative skin friction of piles considering the collapsibility of loess. Acta Geotech. 2021, 17, 601–611. [Google Scholar] [CrossRef]
  17. Zhou, D.; Liu, H.L.; Zhang, W.G.; Ding, X.M.; Yang, C.Y. Transparent soil model test on the displacement field of soil around single passive pile. Rock Soil Mech. 2019, 40, 2686–2694. [Google Scholar] [CrossRef]
  18. Xia, Y.Y.; Chen, C.; Ni, Q. Pull-out mechanism of continuous ball shape anchors in transparent soil. Chin. J. Geotech. Eng. 2017, 39, 804–812. [Google Scholar] [CrossRef]
  19. Xia, Y.Y.; Chen, C.; Ni, Q. Comparative modelling of pull-out process of four different anchorages by using transparent soil. Chin. J. Geotech. Eng. 2017, 39, 399–407. [Google Scholar] [CrossRef]
  20. Shen, H.; Li, X.; Lei, M.Q.; Xu, W.B.; Yu, X.L. Conception and model test of shear bond supporting system. Rock Soil Mech. 2019, 40, 2574–2580. [Google Scholar] [CrossRef]
  21. Zhou, D.Q.; Feng, C.X.; Xiao, C.; Hu, P.; Cao, Z.Y.; Liu, C.X.; Zhu, Q.; Cai, G.Q. Experimental study on the failure mode of inclined-straight pile composite structure on declining soft foundation under single side load. China J. Highw. Transp. 2021, 34, 201–214. [Google Scholar] [CrossRef]
  22. Fan, Q.Y.; Chen, B.; Shen, B. Model test research of bolt supporting of foundation pit considering construction process. Rock Soil Mech. 2005, 26, 1874–1878. [Google Scholar] [CrossRef]
  23. YE, S.H.; Zhao, Z.F.; Wang, D.Q. Deformation analysis and safety assessment of existing metro tunnels affected by excavation of a foundation pit. Undergr. Space 2021, 6, 421–431. [Google Scholar] [CrossRef]
  24. Ye, S.H.; Ding, S.H.; Gong, X.N.; Gao, S.; Chen, C.L. Monitoring and numerical simulation of deep foundation pit of a subway station in Lanzhou. Chin. J. Geotech. Eng. 2018, 40, 177–182. [Google Scholar] [CrossRef]
  25. Chen, Y.M.; Han, C.; Ling, D.S.; Kong, L.G.; Zhou, Y.G. Development of geotechnical centrifuge ZJU400 and performance assessment of its shaking table system. Chin. J. Geotech. Eng. 2011, 33, 1887–1894. [Google Scholar]
  26. Ma, X.F.; Cao, M.Y. Centrifuge model tests on excavation in Shanghai soft soil layers using in-flight excavation tools. China Civ. Eng. J. 2022. [Google Scholar] [CrossRef]
  27. Zhang, G.; Yan, G.C. In-Flight Simulation of the Excavation of Foundation Pit in Centrifuge Model Tests. Geotech. Test. J. 2016, 39, 59–68. [Google Scholar] [CrossRef]
  28. Sun, Y.Y.; Xiao, H.J. Wall Displacement and Ground-Surface Settlement Caused by Pit-in-Pit Foundation Pit in Soft Clays. Ksce J. Civ. Eng. 2021, 25, 1262–1275. [Google Scholar] [CrossRef]
  29. Jin, H.L.; Zhang, G.; Yang, Y.S. Experimental and numerical study on behavior of retaining structure with limited soil. Geomech. Eng. 2021, 26, 77–88. [Google Scholar] [CrossRef]
  30. Jia, J.Q.; Gao, J.C.; Tu, B.X.; Zhang, L.; Wang, H.T.; Gao, R.Z. Centrifugal model test of flexible retaining structures with pressured prestressed anchor in deep excavation. Rock Soil Mech. 2017, 38, 304–310. [Google Scholar] [CrossRef]
  31. Ma, X.F.; Zhang, H.H.; Zhu, W.J.; Zheng, Y.F.; Xu, Q.W. Centrifuge model tests on deformation of ultra-deep foundation pits in soft ground. Chin. J. Geotech. Eng. 2009, 31, 1371–1377. [Google Scholar]
  32. Xu, Q.W.; Ma, X.F.; Zhu, H.H.; Ding, W.Q. Centrifugal model test on extra-deep foundation pit excavations in soft ground. China Civ. Eng. J. 2009, 42, 154–161. [Google Scholar] [CrossRef]
  33. Zhou, Q.J.; Chen, X.P.; Xu, G.M. Centrifugal model test and numerical simulation of soft soil foundation pit. Chin. J. Rock Mech. Eng. 2013, 32, 2342–2348. [Google Scholar]
  34. Li, L.X.; Fu, Q.H.; Huang, J.J. Centrifuge model tests on cantilever foundation pit engineering in sand ground and silty clay ground. Rock Soil Mech. 2018, 39, 529–536. [Google Scholar] [CrossRef]
  35. Li, L.X.; Fu, Q.H.; Huang, J.J. Research and application of a new excavation method in centrifuge model tests on foundation pit engineering. Chin. J. Rock Mech. Eng. 2016, 35, 856–864. [Google Scholar] [CrossRef]
  36. Dang, F.N.; Zhang, L.E.; Wang, X.; Ding, J.L.; Gao, J. Analysis of earth pressure on retaining walls with limited displacement based on elastic theory. Chin. J. Rock Mech. Eng. 2020, 39, 2094–2103. [Google Scholar] [CrossRef]
  37. Zheng, X.G.; Zhang, N.; Xue, F. Study on stress distribution law in anchoring section of prestressed bolt. J. Min. Saf. Eng. 2012, 29, 365–370. [Google Scholar]
  38. Liu, Y.Y.; Liu, X.R.; Yang, Z.P.; Kang, J.W. Field test on anchorage performance of different types of prestressed cables. Chin. J. Rock Mech. Eng. 2016, 35, 275–283. [Google Scholar] [CrossRef]
Figure 1. Schematic diagram of the model (mm).
Applsci 12 09792 g001
Figure 2. Schematic diagram of component numbering.
Applsci 12 09792 g002
Figure 3. Schematic diagram of test monitoring point arrangement (mm).
Applsci 12 09792 g003
Figure 4. Model test process diagram.
Applsci 12 09792 g004
Figure 5. Horizontal displacement of pile top.
Applsci 12 09792 g005
Figure 6. Horizontal displacement rate of pile top.
Applsci 12 09792 g006
Figure 7. Strain distribution curve of pile 2. (a) Strain distribution of pile 2 under soil excavation conditions; (b) strain distribution of pile 2 under anchor tensioning conditions.
Applsci 12 09792 g007
Figure 8. Final strain of different support piles.
Applsci 12 09792 g008
Figure 9. Soil pressure test results under different working conditions compared with Rankine soil pressure.
Applsci 12 09792 g009
Figure 10. Axial force distribution of anchors. (a) Axial force distribution of Anchor M1-3; (b) Axial force distribution of Anchor M2-3; (c) Axial force distribution of Anchor M3-3; (d) Axial force distribution of Anchor M4-3; (e) Axial force distribution of Anchor M5-3.
Applsci 12 09792 g010
Figure 11. Axial force distribution of M2-5 anchors under excavation conditions.
Applsci 12 09792 g011
Figure 12. Shear stress distribution of M2-5 anchors under excavation conditions.
Applsci 12 09792 g012
Figure 13. Effect of adjacent anchor tensioned on the axial force of anchor M1-3. (a) Sequential tensioning; (b) Tensioning at intervals of one hole; (c) Tensioning at intervals of two hole.
Applsci 12 09792 g013
Table 1. Similarity relationship of model tests.
Physical QuantityRelationship FormulaScale Factor
Material PropertiesStrain ε Cε = 1.01
Stress σCσ = CγCl1/10
Elastic Modulus ECE = 1.01
Poisson’s Ratio νCμ = 1.01
Unit Weight γCγ1
Geometric PropertiesLength lCl1/10
Displacement δCδ = ClCε1/10
LoadConcentrated Force pCp = CECl21/100
Additional Load qCq = CECl1/10
Table 2. Soil parameters.
Soil LayerUnit Weight/kN/m3Cohesion/kPaAngle of Internal Friction/°Ultimate Bond Strength of Anchor and Soil/kPa
Plain Fill16.516.025.050.0
Table 3. Model parameters.
Project NameNumber of Anchor RowsAnchorage Body Diameter/mmVertical Spacing of Anchors/mHorizontal Spacing of Anchors/mDepth of Foundation Pit/mDiameter of Row Pile/mLength of Pile/mPile Spacing/m
Prototype53003.52.0171.0252.0
Test Model5300.350.21.70.12.50.2
Table 4. Anchors parameters.
Anchor PositionTotal Length/mFixed Anchor Length/mPrestressing/kN
First row1.91.23.4
Second row1.81.23.4
Third row1.81.23.1
Fourth row1.61.13.1
Fifth row1.51.03.1
Table 5. Parameters of strain gauges.
Strain Gauge TypeMeasured MaterialResistance Value/ΩSize/mmSensitivity Factor
BE120-3AA-P200Rebar119.9 ± 0.12.8 × 2.02.22 ± 0.1%
BQ120-80AA-P200Concrete120.3 ± 0.180 × 2.52.20 ± 0.1%
Table 6. Parameters of displacement gauges and earth pressure boxes.
Name of the SensorMeasuring RangeResolutionPrecision
Earth pressure box0.1 MPa0.01 kPa ±0.25%F.S.
Displacement gauge100 mm-0.05%F.S.
Table 7. Test conditions design.
Serial NumberType of Working ConditionDepth of Each Excavation/mmCumulative Excavation Depth/mmDuration/hInterval Time from the Previous Working Condition/h
1Excavate the first layer of soil1801802.0
2Tension the first row of anchor1.52.0
3Excavate the second layer of soil3205002.024.0
4Tension the second row of anchor1.52.0
5Excavate the third layer of soil3208202.024.0
6Tension the third row of anchor1.52.0
7Excavate the fourth layer of soil32011402.024.0
8Tension the fourth row of anchor1.52.0
9Excavate the fifth layer of soil32014602.024.0
10Tension the fifth row of anchor1.52.0
11Excavation to the bottom of the foundation pit14016002.024.0
Publisher’s Note: MDPI stays neutral with regard to jurisdictional claims in published maps and institutional affiliations.