Article

An Artificial Intelligence-Based Algorithm for the Assessment of Substitution Voicing

by
Virgilijus Uloza
1,
Rytis Maskeliunas
2,*,
Kipras Pribuisis
1,
Saulius Vaitkus
1,
Audrius Kulikajevas
2 and
Robertas Damasevicius
2
1
Department of Otorhinolaryngology, Academy of Medicine, Lithuanian University of Health Sciences, 44240 Kaunas, Lithuania
2
Department of Multimedia Engineering, Faculty of Informatics, Kaunas University of Technology, 44249 Kaunas, Lithuania
*
Author to whom correspondence should be addressed.
Appl. Sci. 2022, 12(19), 9748; https://doi.org/10.3390/app12199748
Submission received: 5 September 2022 / Revised: 20 September 2022 / Accepted: 25 September 2022 / Published: 28 September 2022

Abstract

:
The purpose of this research was to develop an artificial intelligence-based method for evaluating substitution voicing (SV) and speech following laryngeal oncosurgery. Convolutional neural networks were used to analyze spoken audio sources. A Mel-frequency spectrogram was employed as input to the deep neural network architecture. The program was trained using a collection of 309 digitized speech recordings. The acoustic substitution voicing index (ASVI) model was elaborated using regression analysis. This model was then tested with speech samples that were unknown to the algorithm, and the results were compared to the auditory-perceptual SV evaluation provided by the medical professionals. A statistically significant, strong correlation with rs = 0.863 (p = 0.001) was observed between the ASVI and the SV evaluation performed by the trained laryngologists. The one-way ANOVA showed statistically significant ASVI differences in control, cordectomy, partial laryngectomy, and total laryngectomy patient groups (p < 0.001). The elaborated lightweight ASVI algorithm reached rapid response rates of 3.56 ms. The ASVI provides a fast and efficient option for SV and speech in patients after laryngeal oncosurgery. The ASVI results are comparable to the auditory-perceptual SV evaluation performed by medical professionals.

1. Introduction

1.1. Issue

Laryngeal carcinoma is one of the rare oncological illnesses with a declining 5-year survival rate over the last several decades. In the last 40 years, it has fallen from 66 to 63 percent. Some researchers ascribe this considerable decline to better organ-preserving treatment procedures and circumstances that may affect the patient’s follow-up, most notably a lack of specialist medical care near the patient’s domicile [1]. Meanwhile, the American Cancer Society predicts that there will be 12,470 new cases and 3820 fatalities from laryngeal cancer in the United States alone in 2022 [2]. The true impact of the COVID-19 pandemic on the 5-year survival rate and quality of life of these patients remains unknown. However, allocating specialized medical facilities and personnel to contain the recent COVID-19 pandemic led to delayed diagnostics and treatment of both primary and recurrent laryngeal cancer [3,4]. Due to the fact that more than half of laryngeal cancer patients arrived with stage III or IV at their initial consultation, this necessitated more aggressive laryngeal cancer therapies and increased patient mortality [1].
Laryngeal preserving surgery, complete removal of the larynx, chemotherapy, radiotherapy, or a combination of these methods are usually used to achieve remission [5]. A complete removal of the larynx may also be necessary if chemotherapy and radiotherapy are ineffective or unavailable. Following laryngeal oncosurgery treatments, these individuals are often limited to using only a single vocal fold oscillating with the remaining laryngeal and pharyngeal tissues for phonation. After total laryngectomy, the only way to communicate is by alaryngeal (esophageal or tracheoesophageal) speaking. This causes varying degrees of speech impairment or even total inability to speak. Substitution voicing (SV) is the situation that occurs following laryngeal oncosurgery when voicing is achieved without one or two vocal folds [6]. The body begins to use the remaining structures (ventricular folds, aryepiglottic folds, pharyngeal mucosa), which were not previously used, to substitute the missing laryngeal structures in closing the phonatory gap and producing voice. The patient retains the ability to phonate and speak, but previously unintended anatomical structures substitute voice production. The downside of this phenomenon is that both SV and speech following laryngeal oncosurgery exhibit significant irregularity, frequency changes, aperiodicity, and phonatory interruptions [7]. With traditional approaches, these characteristics render SV assessment potentially incorrect, if not impossible [8,9].
Voice loss substantially impacts the quality of life of laryngeal cancer patients, significantly affecting their social life and well-being [10]. Furthermore, because impaired communication abilities cause discomfort, 40–57 percent of these people develop depression [10]. This can be alleviated in part by postsurgical voice and speech rehabilitation. Despite their effectiveness, all recognized speech rehabilitation procedures produce distinctively altered patient speech patterns. These discrepancies are particularly obvious when the patient is compelled to speak in a loud setting or on the phone [11]. Additionally, patients who were unable to use a phone independently during the COVID-19 epidemic had to rely on text messaging to communicate with their relatives and found it challenging to get basic social or telemedicine care.
Healthcare providers frequently rely on specialists’ opinions on perceived speech quality, disability classification, and pathology diagnosis. This method is frequently time-consuming and prone to parameter sensitivity [12]. Computer-assisted medical approaches have grown in prominence over the last few decades. According to conventional wisdom, the acoustic prosodic qualities of a speech signal can be altered by a range of health-related events [13]. The use of machine learning algorithms to automate the diagnosis of diseases using variations in human speech has piqued the interest of medical researchers [14].

1.2. A State of the Art Review in Machine Learning Applications for Vocal Pathology Detection and Analysis

The human voice production system is a complex natural mechanism capable of changing pitch and volume. The section in which folding is the principal source of underlying internal and external elements frequently destroys the rationale of vocal folds [15]. While many approaches for detecting voice pathology have been proposed in recent research, they tend to focus on distinguishing normal voices from pathological sounds [12,14,16]. The aforementioned papers focus on the design of the algorithm, while neglecting to test it with the clinical professionals whom the software is supposed to help or even replace. Additionally, the classification into healthy and pathological voices proves the concept, but does not track the scope of the problem or any changes over time. Foregoing the comparison of the final algorithm to its human counterparts and the binary classification approach eventually hinders the practical application of the research.
In the recent study, in order to identify, extract, and evaluate substitution voicing following laryngeal oncosurgery, we proposed employing convolutional neural networks for the categorization of speech representations (spectrograms). The proposed algorithm takes an input of a Mel-frequency spectrogram as an input of deep neural network architecture. This approach has shown the best true-positive rate of any of the compared state-of-the-art approaches, achieving an overall accuracy of 89.47% [16]. In the present study, the acoustic substitution voicing index (ASVI) model was elaborated on, accomplishing quantification of SV assessment. The ASVI results were comparable to the auditory-perceptual SV evaluation performed by medical professionals. Therefore, the ASVI demonstrates the potential to provide a fast and efficient option for SV and speech assessment in patients after laryngeal oncosurgery. Furthermore, this approach determines the research gap in automated speech pathology detection concerning laryngeal cancer. In some circumstances, speech signals used with machine learning algorithms cannot ensure high accuracy or save time in pathology monitoring systems, limiting their practical application. This results in the need for research highlighting the essential concerns and challenges confronting vocal pathology detection systems and their practical application. To the best of our knowledge, there is very little evidence in the literature on the use of AI technology for SV evaluation [17,18,19,20,21]. As a result, using AI-based models for objective SV evaluation and categorization might pave the way for new research and clinical practice directions. Furthermore, a consistent computerized objective SV evaluation technique would enable comparisons of patient groups in different medical centers without the need for expert professional assistance. The same data sets might be utilized to refine the algorithm further.
Several recent research articles have attempted to discriminate between normal and abnormal voices by employing a variety of machine learning-based classifiers capable of detecting diseased voices [14,22,23]. A broad range of statistical, machine learning-based, and other algorithms are currently available for detecting disordered voices based on computed acoustic aspects of the input signal [24]. Pathology categorization approaches typically fall under two categories: statistical and deep learning-based [25]. The statistical approach is frequently based on k-nearest neighbor, random forests, support vector machines, Gaussian mixture models, and others [26,27,28,29,30,31,32,33]. The Online Sequential Extreme Learning Machine (OSELM) is one of the more noteworthy machine learning methods that can be considered a more current technique, as well as a faster and more accurate algorithm than classic adaptations in the categorization process of voice disorders [28]. The majority of recent research falls into the latter category, as the focus has shifted to deep learning applications and notable variations of convolutional and recurrent neural networks [34,35]. Deep learning can manage more extensive data sets and distinguish more diverse speech characteristics, potentially outperforming medical experts in various vocal pathology classification tasks. Chen et al. showed this in their deep learning approach by employing 12 Mel-frequency cepstral coefficients from each speech sample as row attributes or as cepstrum vectors [36,37,38]. Zakariah et al. showed that MFCC-based approaches could be enhanced by including gender-specific information [38]. By extracting and analyzing variable-length speech signal segments utilizing the prisms of the energy, primary tone, and spectrum, Miliaresi et al. proposed assessing several characteristics of the voice signal window as low-level descriptors [39]. They then trained their model using the obtained data. Various functional factors, including moments, extremes, percentiles, and regression parameters, may be provided for the network, resulting in a collection of aggregate characteristics for healthy and impaired speech. In order to show how multipath learning and learning transfer applications could be used in accordance with the multifunctional LSTM-RNN paradigm, Kim et al. collected features from voice samples of the vowel sound /a:/ and computed the Mel-frequency cepstral coefficients (MFCCs), which can be used to differentiate between patients with laryngeal cancer and healthy controls [40,41]. Similar findings in additional studies indicated that the recurrent neural network’s accuracy was comparable to CNN, and the predicted outcomes were almost identical. Mittal et al. proposed filtering the input voice signal using deep learning, followed by a decision-level fusion of deep learning with a non-parametric learner [40,41,42,43]. Chaiani demonstrated that employing suitable speech enhancement pre-processing improves the accuracy of automated categorization of vocal diseases by reducing the inherent noise caused by voice impairment [44,45]. The FC-SMOTE approach described by Fan et al. handles the original class-imbalanced dataset and outperforms standard imbalanced data oversampling algorithms [45]. The application of kernel-based extreme learning machines, data pre-processing, a combination of the k-means clustering-based feature weighting approach and a complex-valued artificial neural network, and other techniques were also demonstrated [23,45,46]. Muhammed et al. utilized a hybrid system using microphones and electroglottography (EGG) sensors as inputs. These signals are converted into spectrograms and input into a pre-trained convolutional neural network (CNN). The CNN features are merged and processed using a bi-directional long short-term memory network [47]. Analogic hybrid fusion produced by Omerlogu et al. achieved a similar outcome [48].
Despite the favorable results which were produced utilizing classic approaches machine learning and modern deep learning techniques, some worries and unresolved difficulties, such as the correct prediction of a large number of characteristics, remain [49]. There is a scarcity of medical voice training data for machine learning models. Furthermore, comprehending voice-impacting illnesses and their varieties is more complicated than other activities, and the result often is valid only in narrow given conditions. Finally, pathological voice is inherently noisy, complicating the algorithms with real-life data even further [44].

1.3. Proposed Research

For temporal audio signal analysis, most contemporary deep learning voice analysis systems use some sort of recurrent gates. This method is famously challenging to teach and suffers from poor performance. We seek to employ areas of machine learning (deep learning) research to extract, measure, and objectively describe SV and speech following laryngeal oncosurgery through audio signals instead of the current ineffective methodologies that require prior medical expertise for signal analysis. Furthermore, we aim to streamline the obtained objective estimates to the point where they can be interpreted without specialized medical training. The automated speech and SV evaluation programs may offer the patients reliable early laryngeal cancer recurrence follow-up and decrease the requirement for specialist medical treatment, which may result in enhancement of their 5-year survival rate. Furthermore, the same tools might improve patient safety during the COVID-19 pandemic by eliminating unnecessary follow-up visits to medical institutions, thereby lessening the risk of infection [21]. Finally, this strategy might lessen the strain and stress on specialized medical workers, which has been critical during the COVID-19 epidemic [30]. This may be accomplished without contributing additional expenditures to the healthcare system.
We discovered three main issues when reviewing existing machine learning-based audio feature processing techniques: categorization, screening, and heavy computer workload. First, the accuracy varies due to the wide range of treatment options applied to laryngeal cancer patients, combined with high irregularity, frequency shifts, and aperiodicity found in SV. This implies that pathology detection is not universal. Second, most techniques are slow to operate and excessively dependent on hardware, necessitating expensive GPUs to train and run the models [7].
By converting the waveform into Mel’s spectrogram-based cochleagrams and putting it into a modified lightweight classification network, we suggest using a hybrid convolutional neural network model to evaluate audio inputs in this study. We were able to classify the speech pathology of the sub-subjects with an overall accuracy of 89.47 percent using this optimized network architecture, which allowed the approach to be used on low-end computing devices with only a Central Processing Unit (CPU) and no specific Graphical Processing Unit (GPU). Consequently, the present study aimed to elaborate on an artificial intelligence-based algorithm for the assessment of substitution voicing after laryngeal oncosurgery.

2. Materials and Methods

2.1. Groups

Speech samples were collected from 379 male participants (100 after laryngeal oncosurgery and 279 healthy) assessed at the Lithuanian University of Health Sciences Department of Otorhinolaryngology in Kaunas, Lithuania. The ages of the subjects ranged from 18 to 80 years. The study included 100 male patients (mean age 63.1; SD 22.8 years) who were surgically treated for histologically confirmed laryngeal cancer. Patients with endolaryngeal cordectomy type III/IV, partial vertical laryngectomy, or total laryngectomy with tracheoesophageal prosthesis implantation were specifically selected for this investigation, since they communicate via speech created by either a single vocal fold or none [50,51]. This sort of speech creation is known as substitution voicing (SV) [6]. Patients were divided into groups based on the number of residual vibrating laryngopharyngeal structures employed for SV production. The single vocal fold group (endolaryngeal cordectomy and partial laryngectomy) included 70 patients, whereas the total laryngectomy group had 30 individuals. Patient voice recordings were gathered at least 6 months following surgery to guarantee that healing and speech rehabilitation programs could be completed.
The control group included 279 healthy male volunteers with normal speech (mean age 38.1; standard deviation (SD) 12.7 years). They had no current or previous speech, neurological, hearing, or laryngeal abnormalities. At the time of speech recording, the control group was clear of a common cold or upper respiratory illness. Individuals with any pathological laryngeal changes discovered after laryngeal endoscopy were excluded from the study.
For the cordectomy, partial laryngectomy, and control groups, laryngeal endoscopy was conducted without topical anesthesia using the XION EndoSTROB DX instrument (XION GmbH, Berlin, and Germany) with a 70° rigid endoscope. Before recording, the tracheoesophageal prosthesis was examined for signs of leakage or infection and, if necessary, replaced.
The collected speech recordings from control and patients’ groups were randomized. Then, the SV recordings were split into two subgroups, i.e., cordectomy and partial laryngectomy (phonation with single vocal fold) and total laryngectomy (phonation without vocal folds). Speech recordings of 309 subjects were used to train the algorithm. The additional speech recordings of 70 subjects were reserved to evaluate how the algorithm performs with recordings unknown to it. The arrangement of the study groups is presented in Table 1.

2.2. Speech Recordings

The spoken Lithuanian phrase “Turėjo senelė žilą oželį” which means “the granny had a small grey goat”, was recorded. The phrase was chosen following Lithuanian language rules on phonetic balancing. Participants had to speak both utterances at a steady speed. A D60S Dynamic Vocal microphone (AKG Acoustics, Vienna, Austria) and a T-series quiet room for hearing testing (CA Tegner AB, Bromma, Sweden) were used for the recording. A microphone was positioned approximately 90 degrees from the mouth and 10.0 cm from the lips. The speech was created as uncompressed 16-bit deep WAV audio files and captured at 44.100 samples per s. The recordings were set up to contain an unvoiced fragment of the same length of 300 ms at the start and end of each one, using Praat version 6.2.14 [52]. Eight acoustic speech features were extracted from the aforementioned speech recordings, and are described in Table 2.

2.3. Auditory-Perceptual Evaluation

A panel of three native Lithuanian-speaking otolaryngologists with at least 10 years of experience in the field of laryngeal pathology and phoniatrics were recruited for the auditory perceptual evaluation of the speech samples. Over the course of three auditory-perceptual evaluation sessions, they were asked to rate the same group of recordings that were used for training and testing the current algorithm using the Impression, Intelligibility, Noise, Fluency, and Voicing perceptual rating scale (IINFVo), which is aimed specifically at quantifying the perception of SV and speech after laryngeal oncosurgery [9]. The IINFVo scale rates the impression (first I) of voice quality; intelligibility (second I), the amount of effort required to understand a given segment of speech; unintended additive noise (N); fluency (F), hesitations between successive sounds and within continuous sounds; and quality of voicing (Vo), unintentionally voiced or unvoiced speech fragments. Each parameter of the IINFVo scale is scored on a 10.0-cm long visual analog scale (VAS) from left (worst/absent) to right (optimal) [6]. The total IINFVo score can range from 0 to 50 points, with a higher score indicating better speech quality.
The purpose of the study, SV and speech evaluation standards, and retesting were all explained to the panel ahead of time. Before each rating, a training session was held to standardize the criteria and achieve a better level of unanimity. An independent training set of five speech samples was supplied (two samples of normal speech and three samples of SV from distinct SV subgroups, i.e., cordectomy, partial and total laryngectomy). The primary rating set does not include these speech recordings.
The SV rating processes were conducted in a quiet area with little ambient noise. Speech samples were presented at a suitable hearing level using MacBook Pro model A1211 stereo speakers (Apple Inc., Cupertino, CA, USA). Each voice sample was played in random order. Before a choice, each sample was repeated as many times as necessary. Following the training session, no conversation among panel members was permitted.

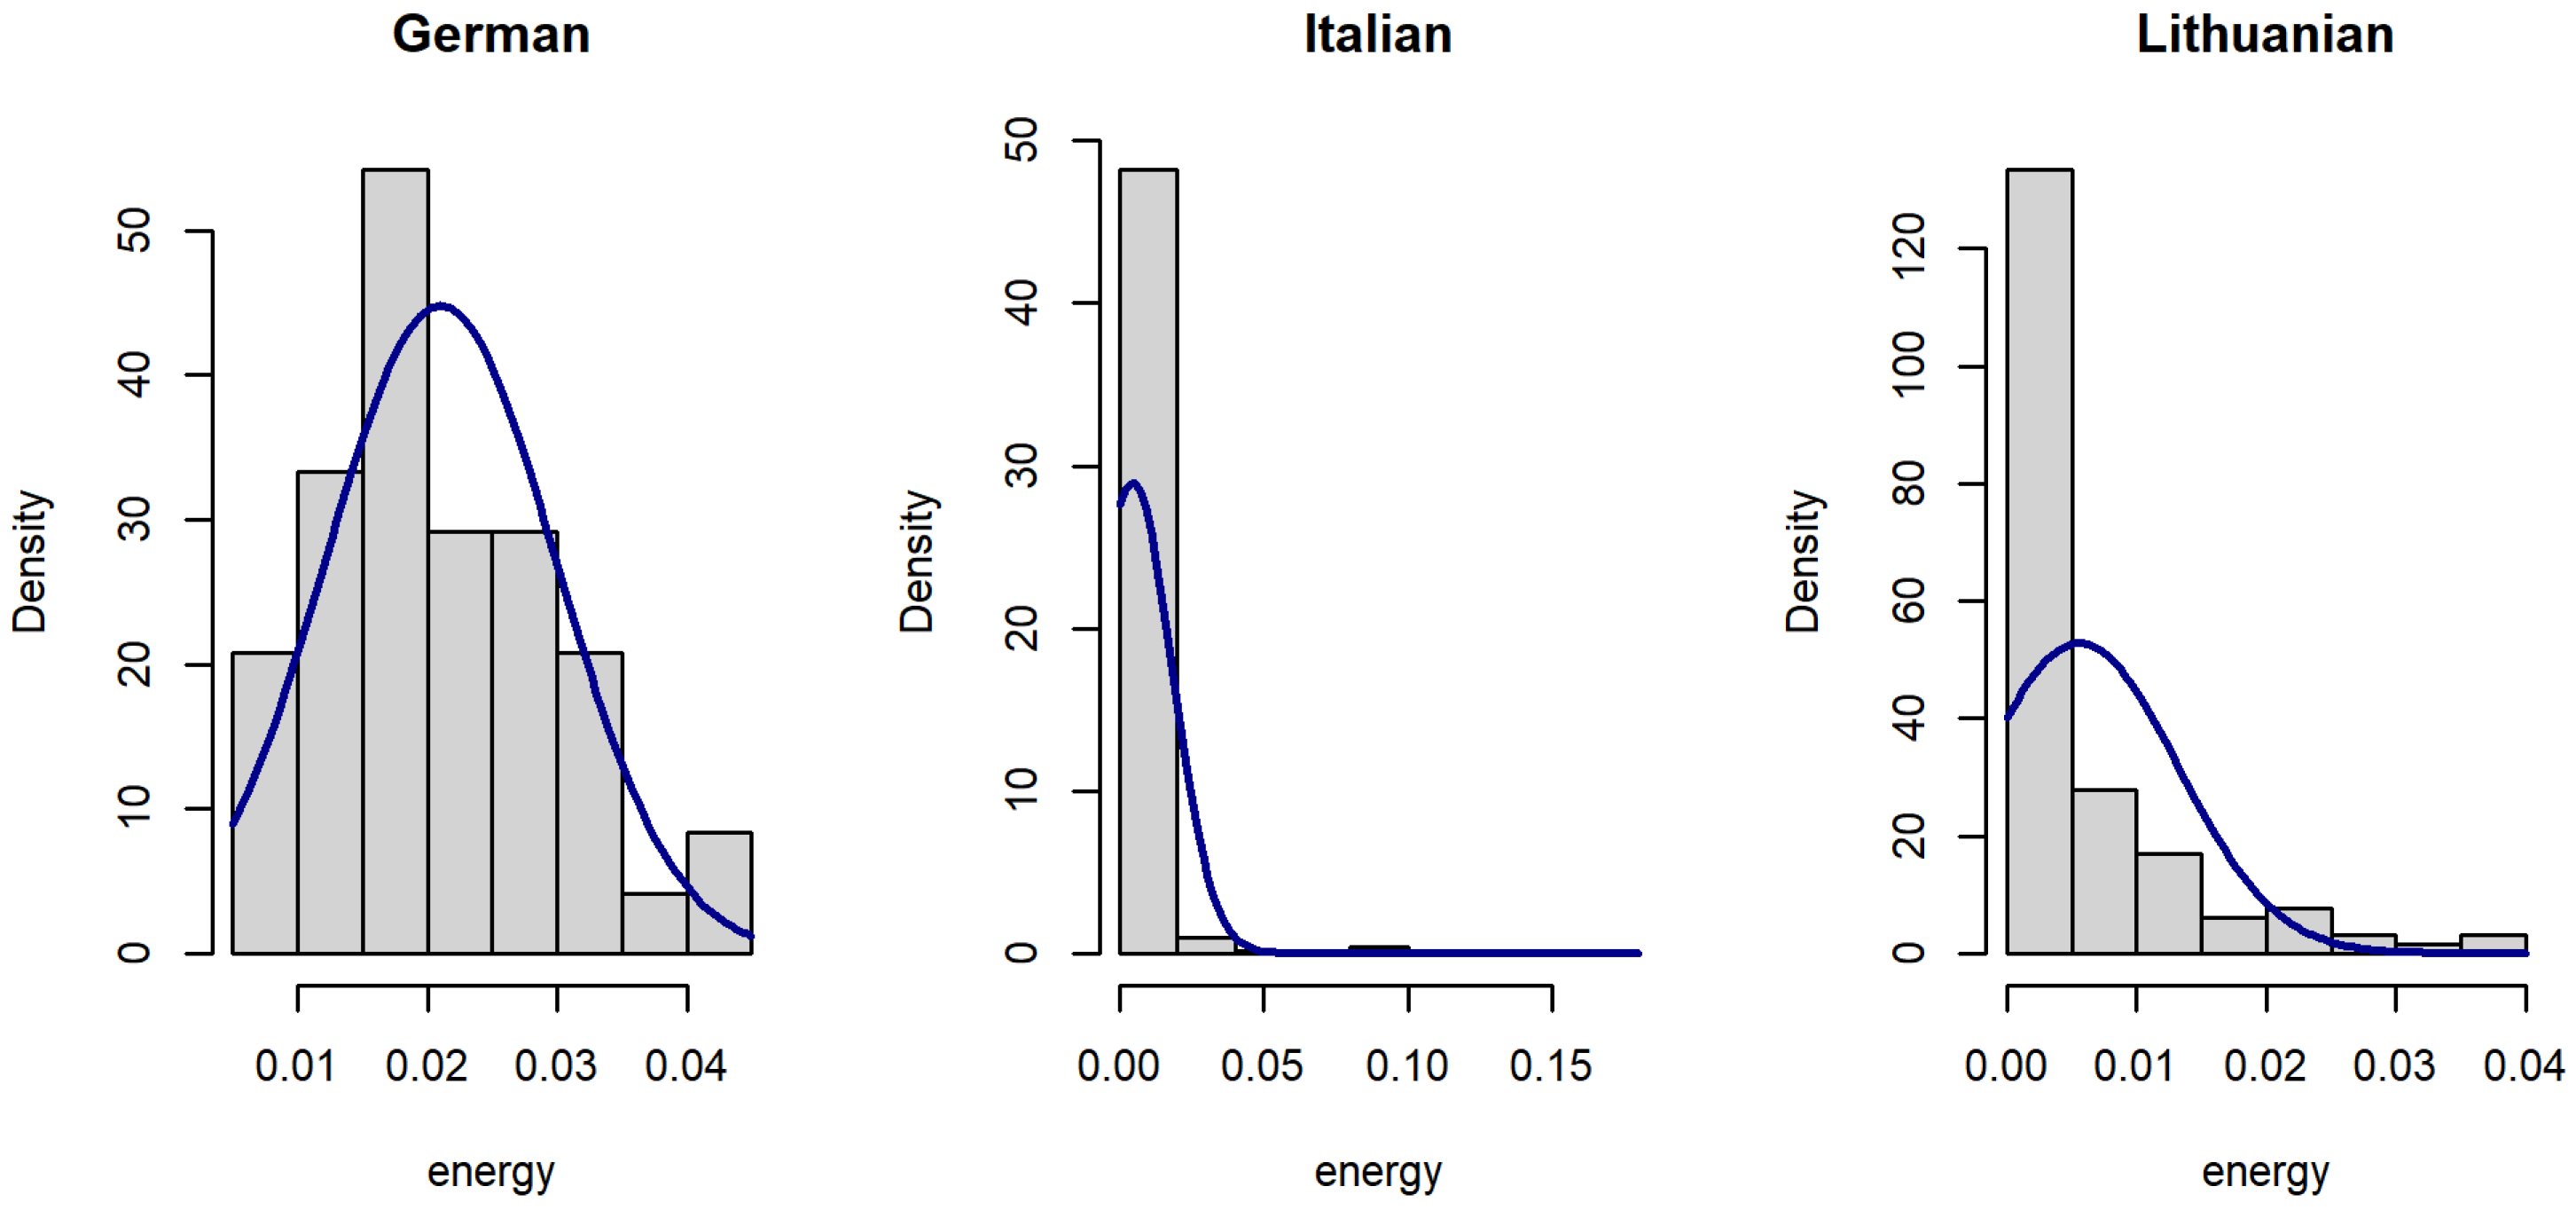
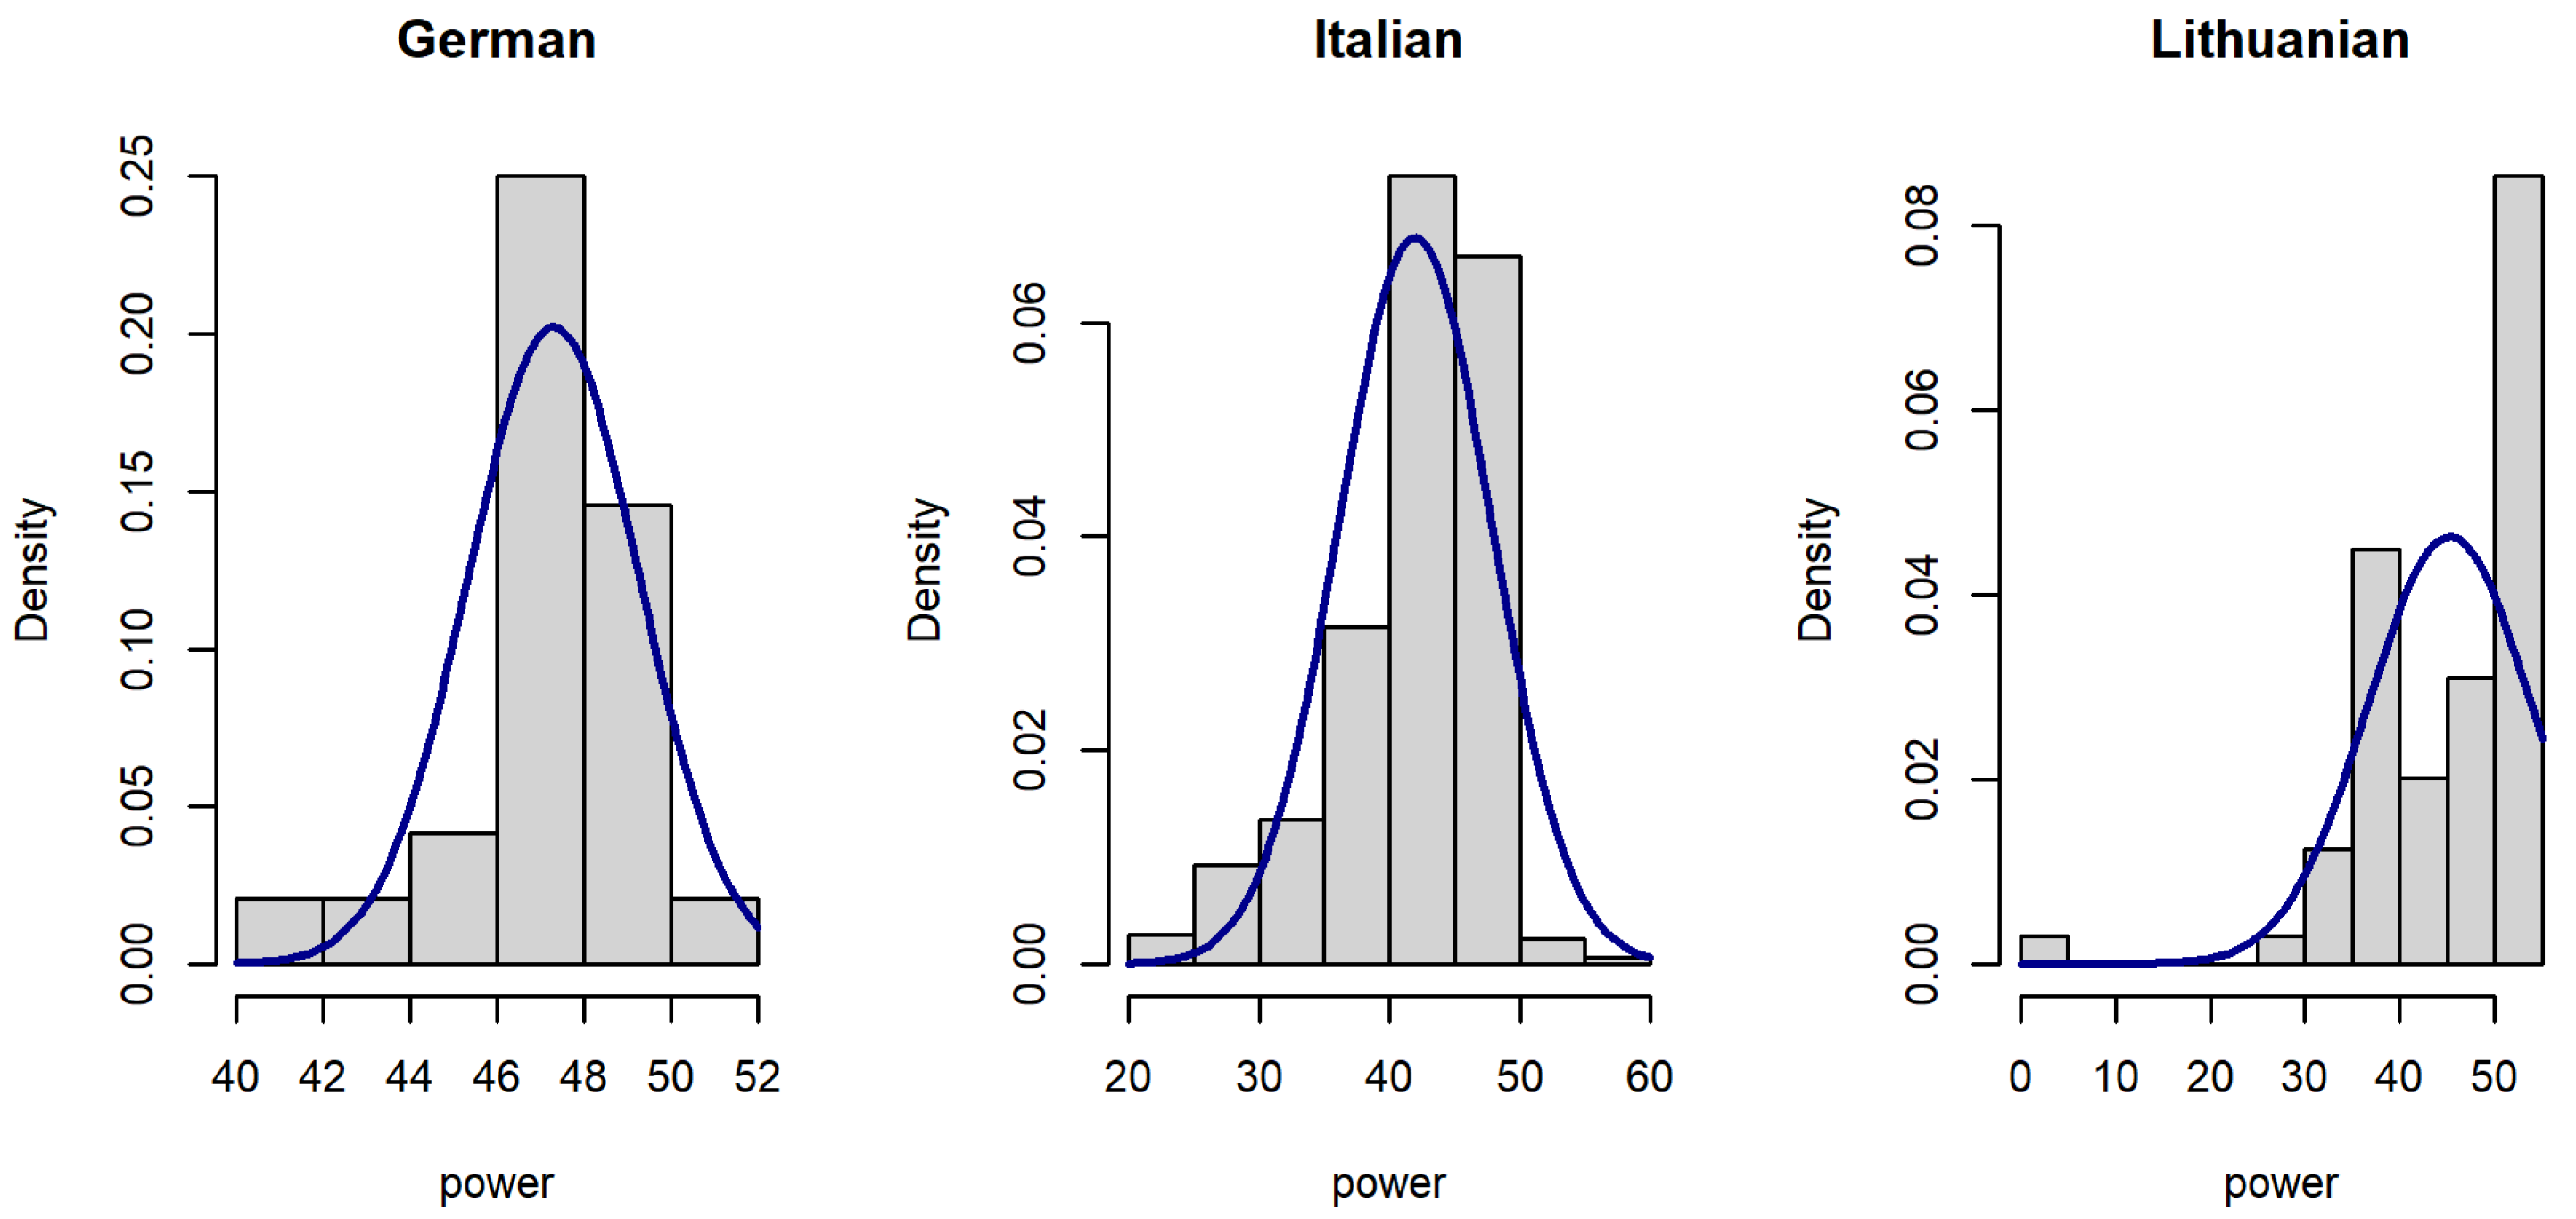
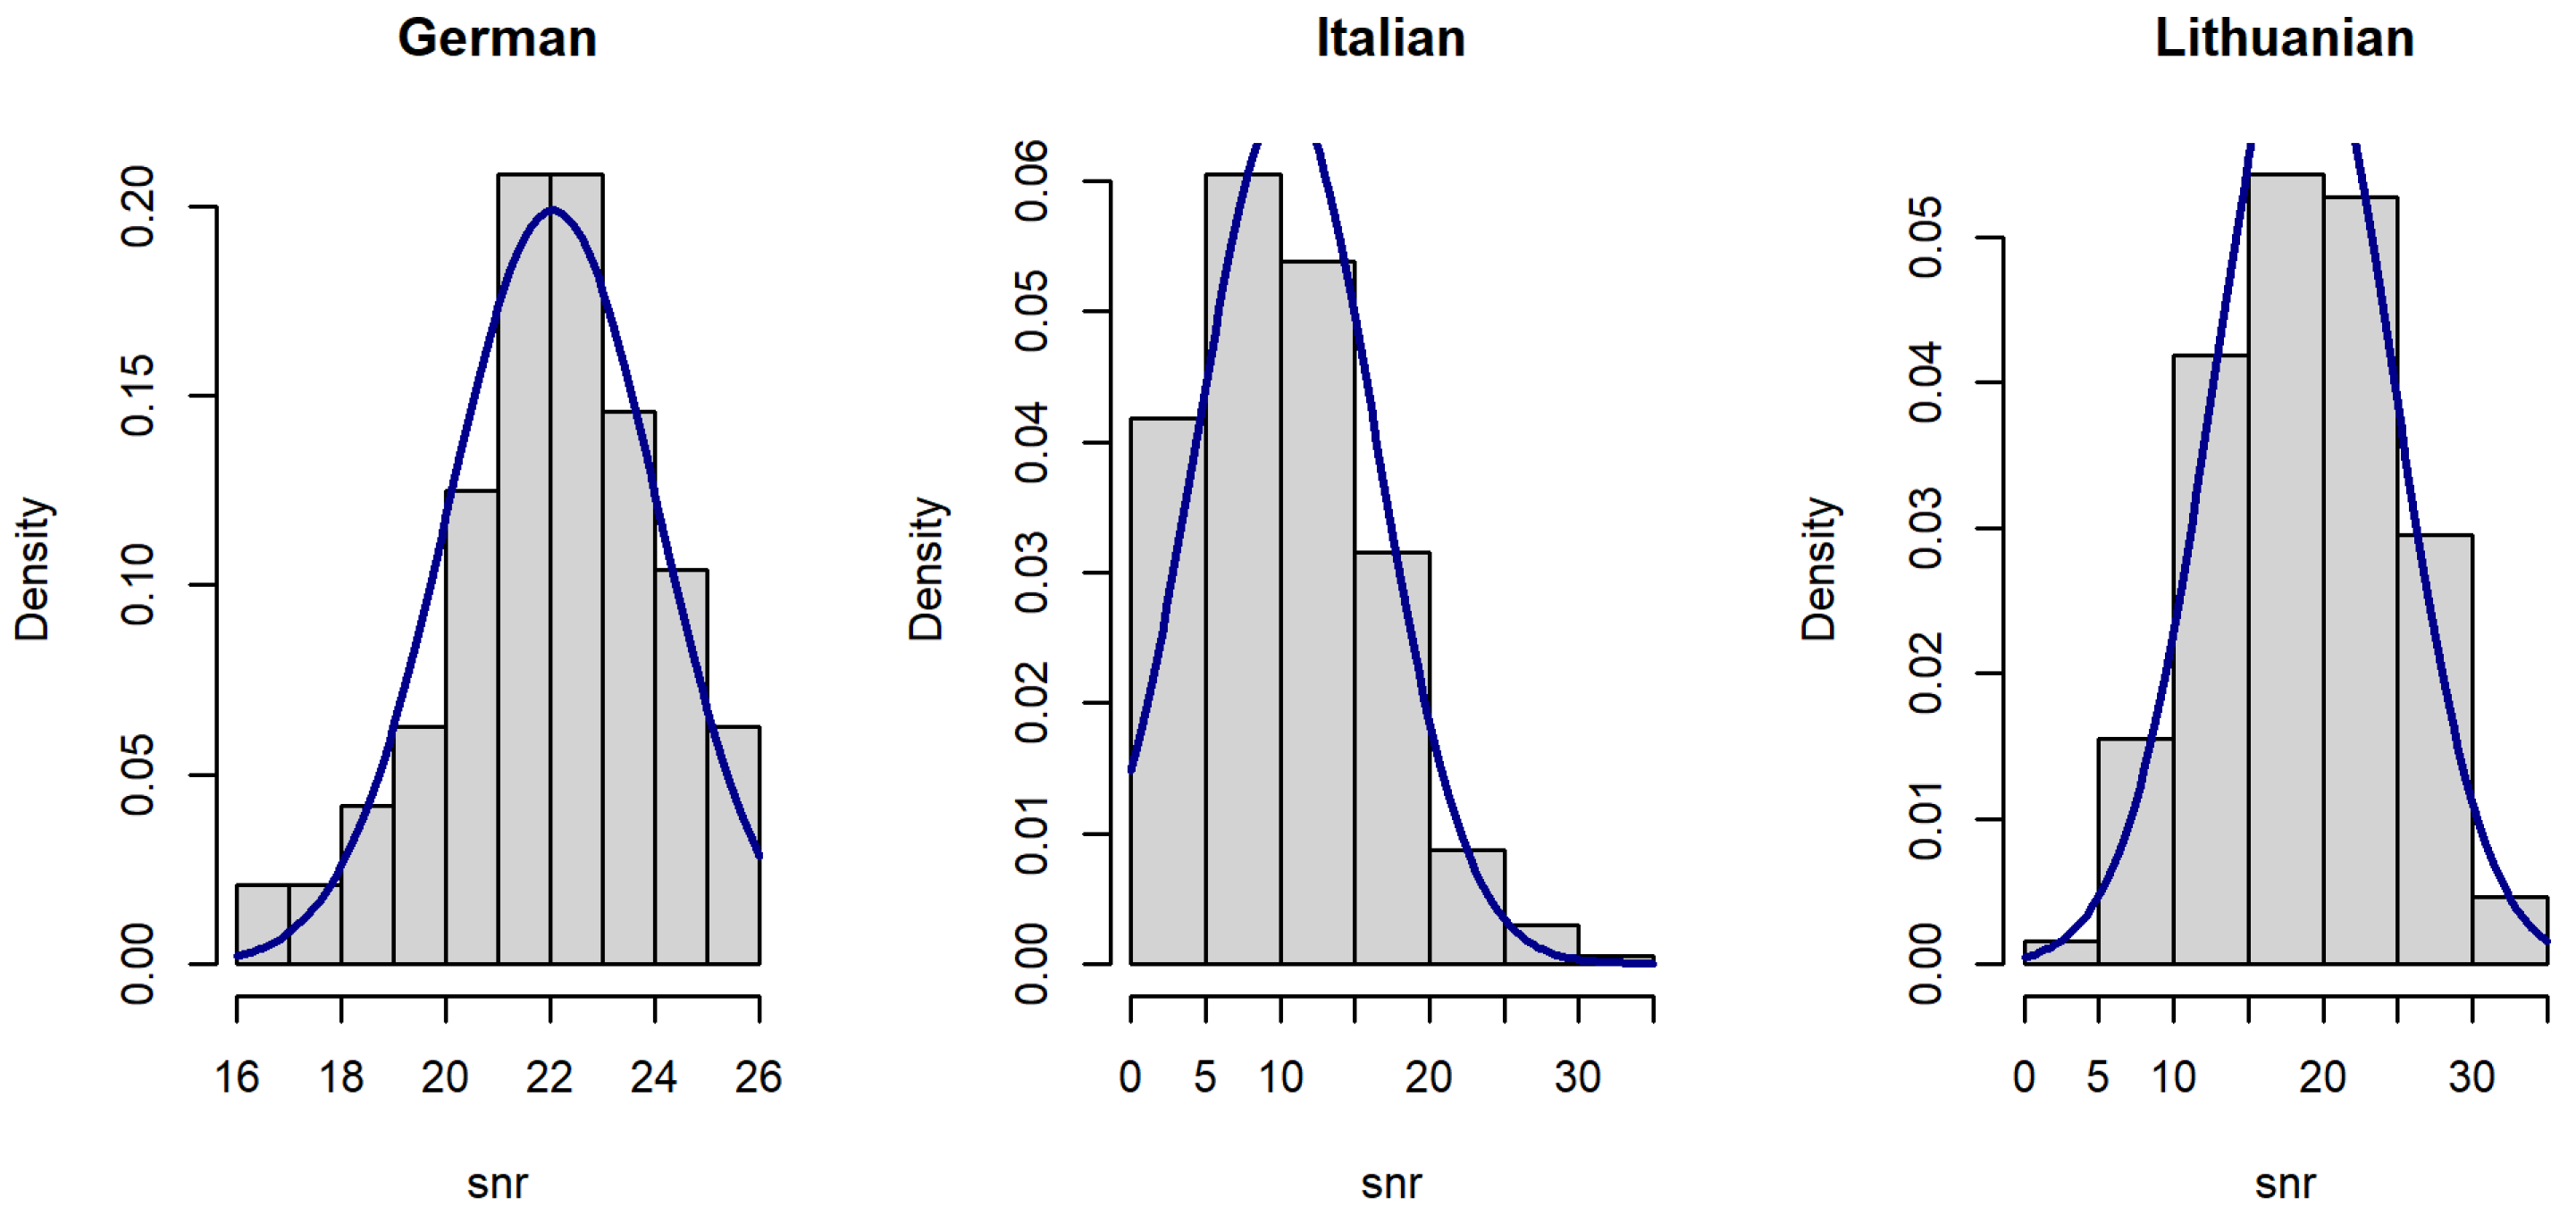
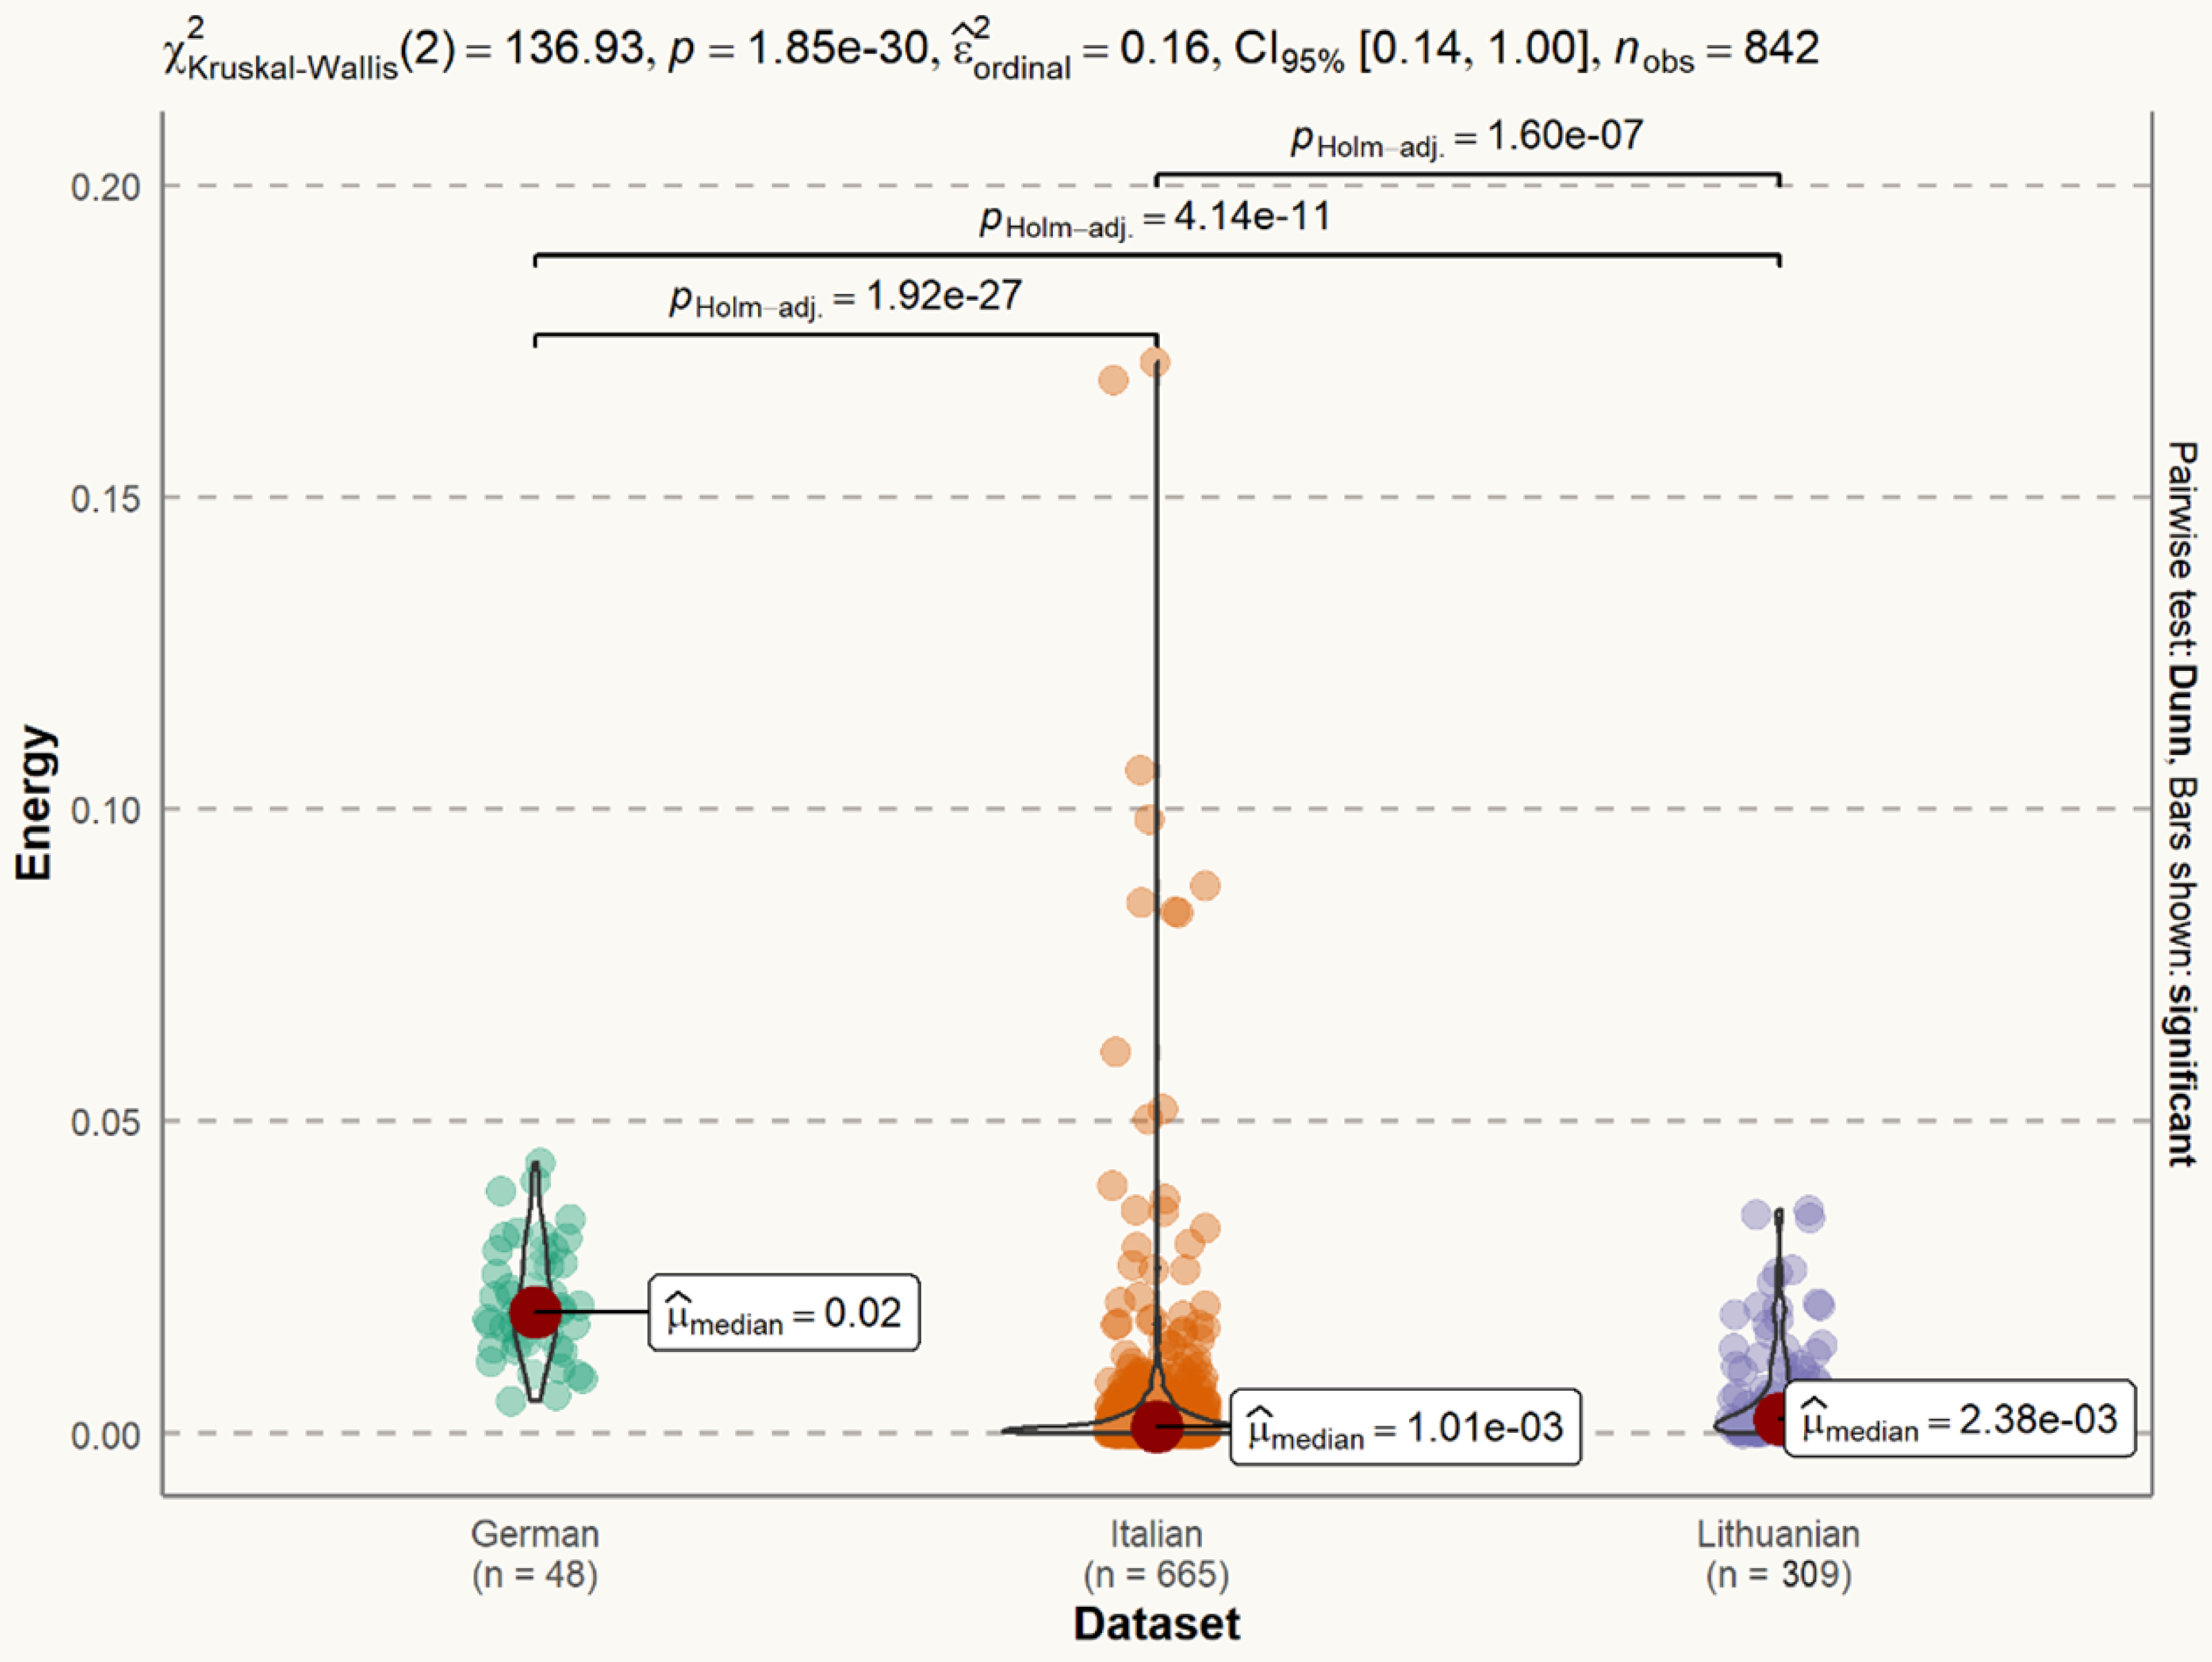
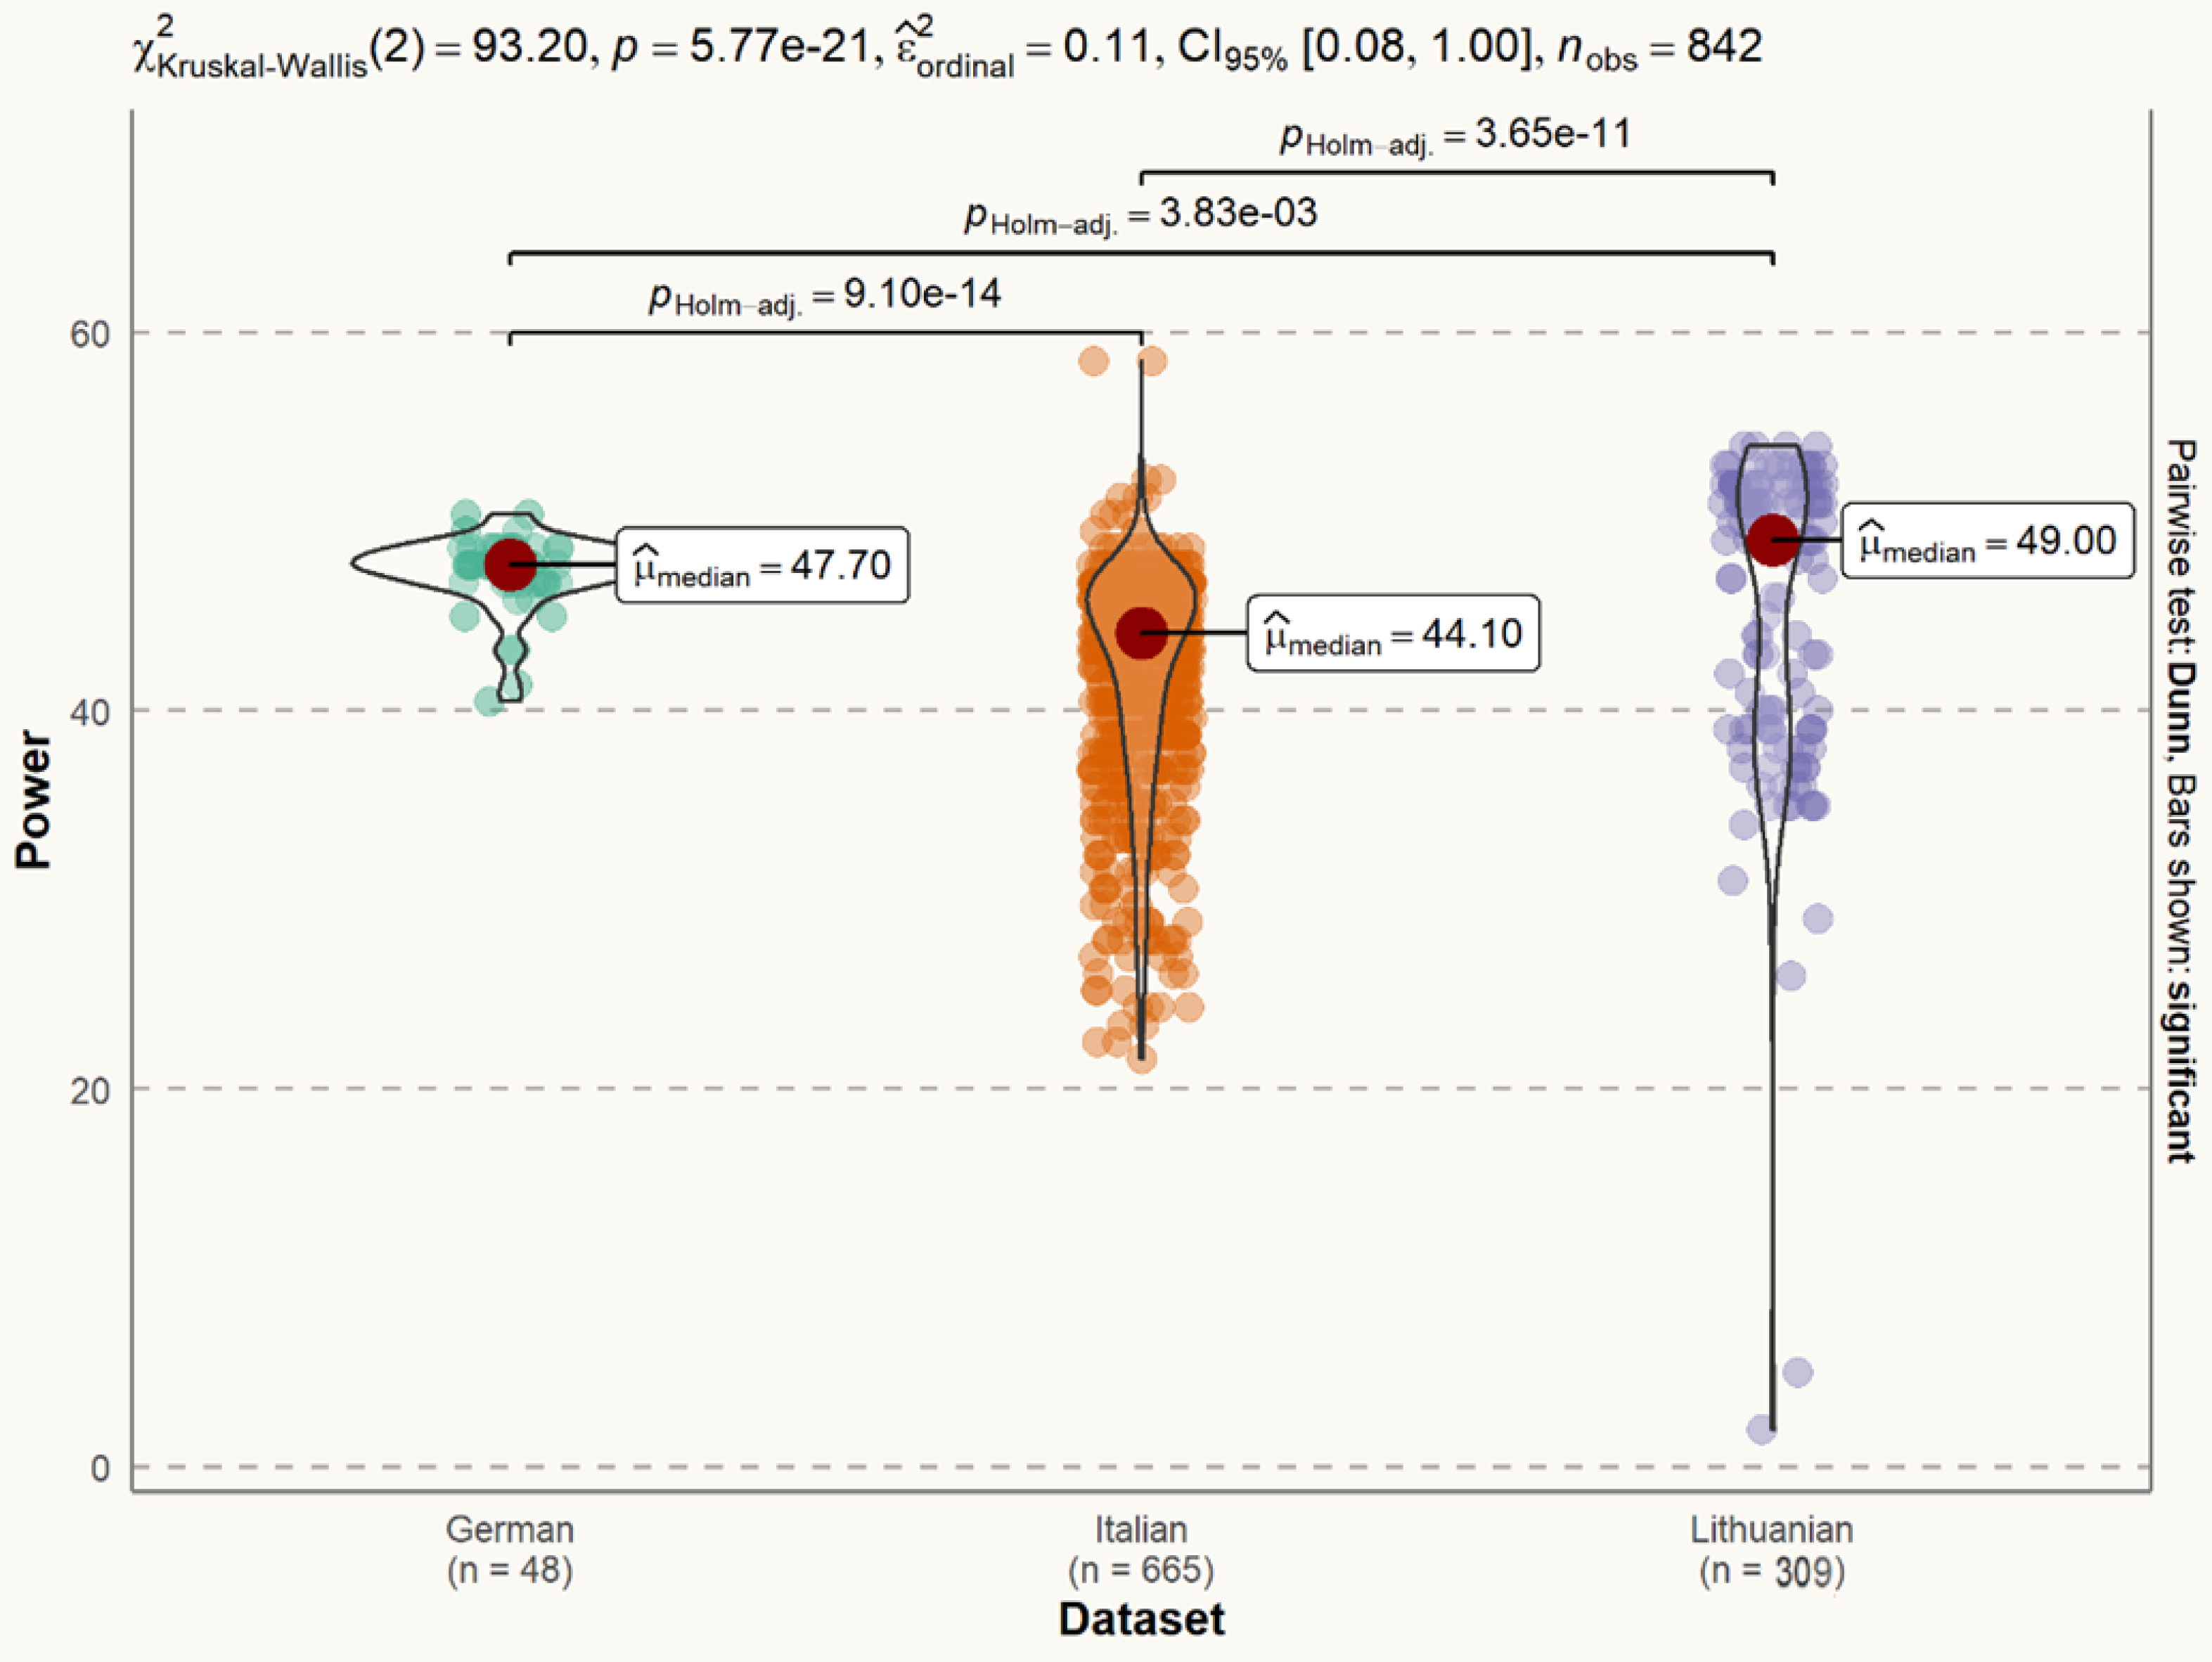
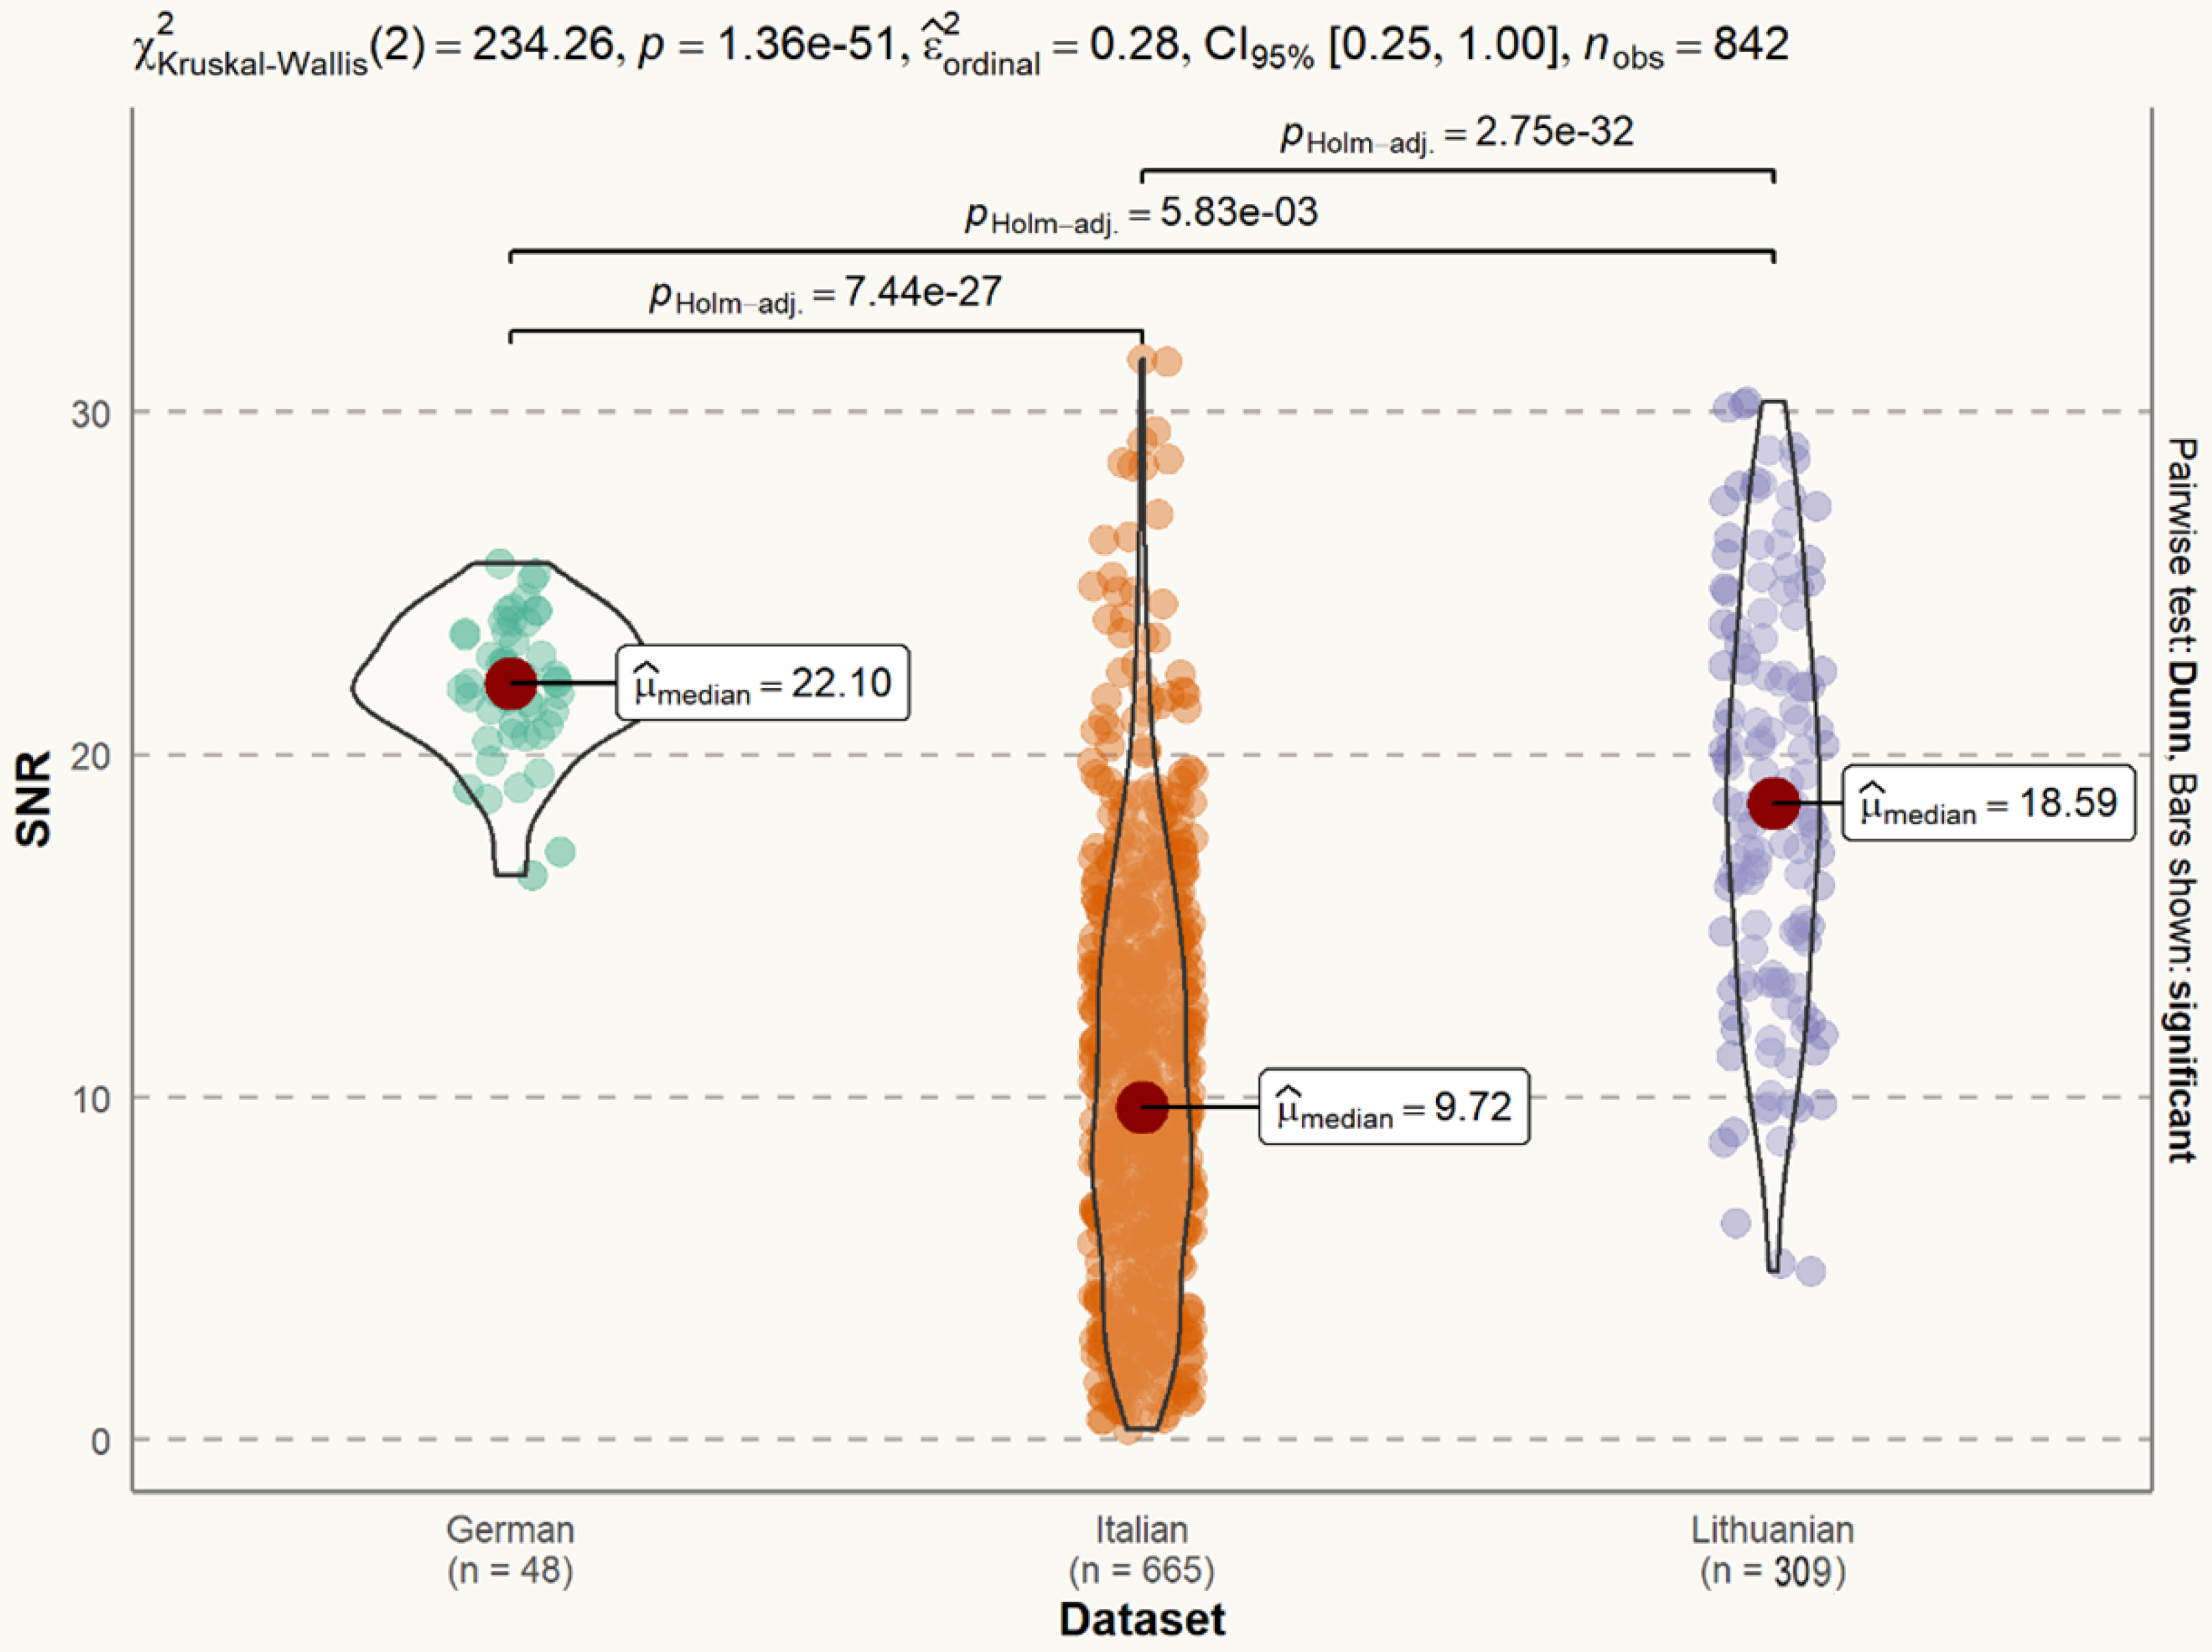
2.4. Exploratory Analysis of the Datasets

We evaluated the distributions of energy (Figure 1), power (Figure 2), and signal-to-noise ratio (SNR) (Figure 3) in our dataset compared to those in other relevant datasets commonly used in medical voice analysis, as was proposed by the reviewers (as our algorithm does not alter the signal in any way) [53,54].
Since the distribution of voice features was skewed (Figure 1, Figure 2 and Figure 3), data were analyzed using a Kruskal–Wallis rank sum test with Holm correction. The Kruskal–Wallis test is a nonparametric statistical test that evaluates differences on a non-normally distributed continuous variable between independently sampled groups. The results indicate that our dataset is more coherent when compared to others.
The signal energy of the Lithuanian dataset (median = 0.002) is smaller than signal power of the German dataset (median = 0.02), but larger than that of the Italian dataset (median = 0.001). The difference is statistically significant (Figure 4).
The signal power of the Lithuanian dataset (median = 49.00) is larger than signal power of both the German dataset (median = 47.70) and the Italian dataset (median = 44.10 dB). The difference is statistically significant (Figure 5).
The SNR of the Lithuanian dataset (median = 18.59 dB) is lower than the SNR of the German dataset (median = 22.10 dB), but larger than the SNR of the Italian dataset (median = 9.72 dB). The difference is statistically significant (Figure 6).

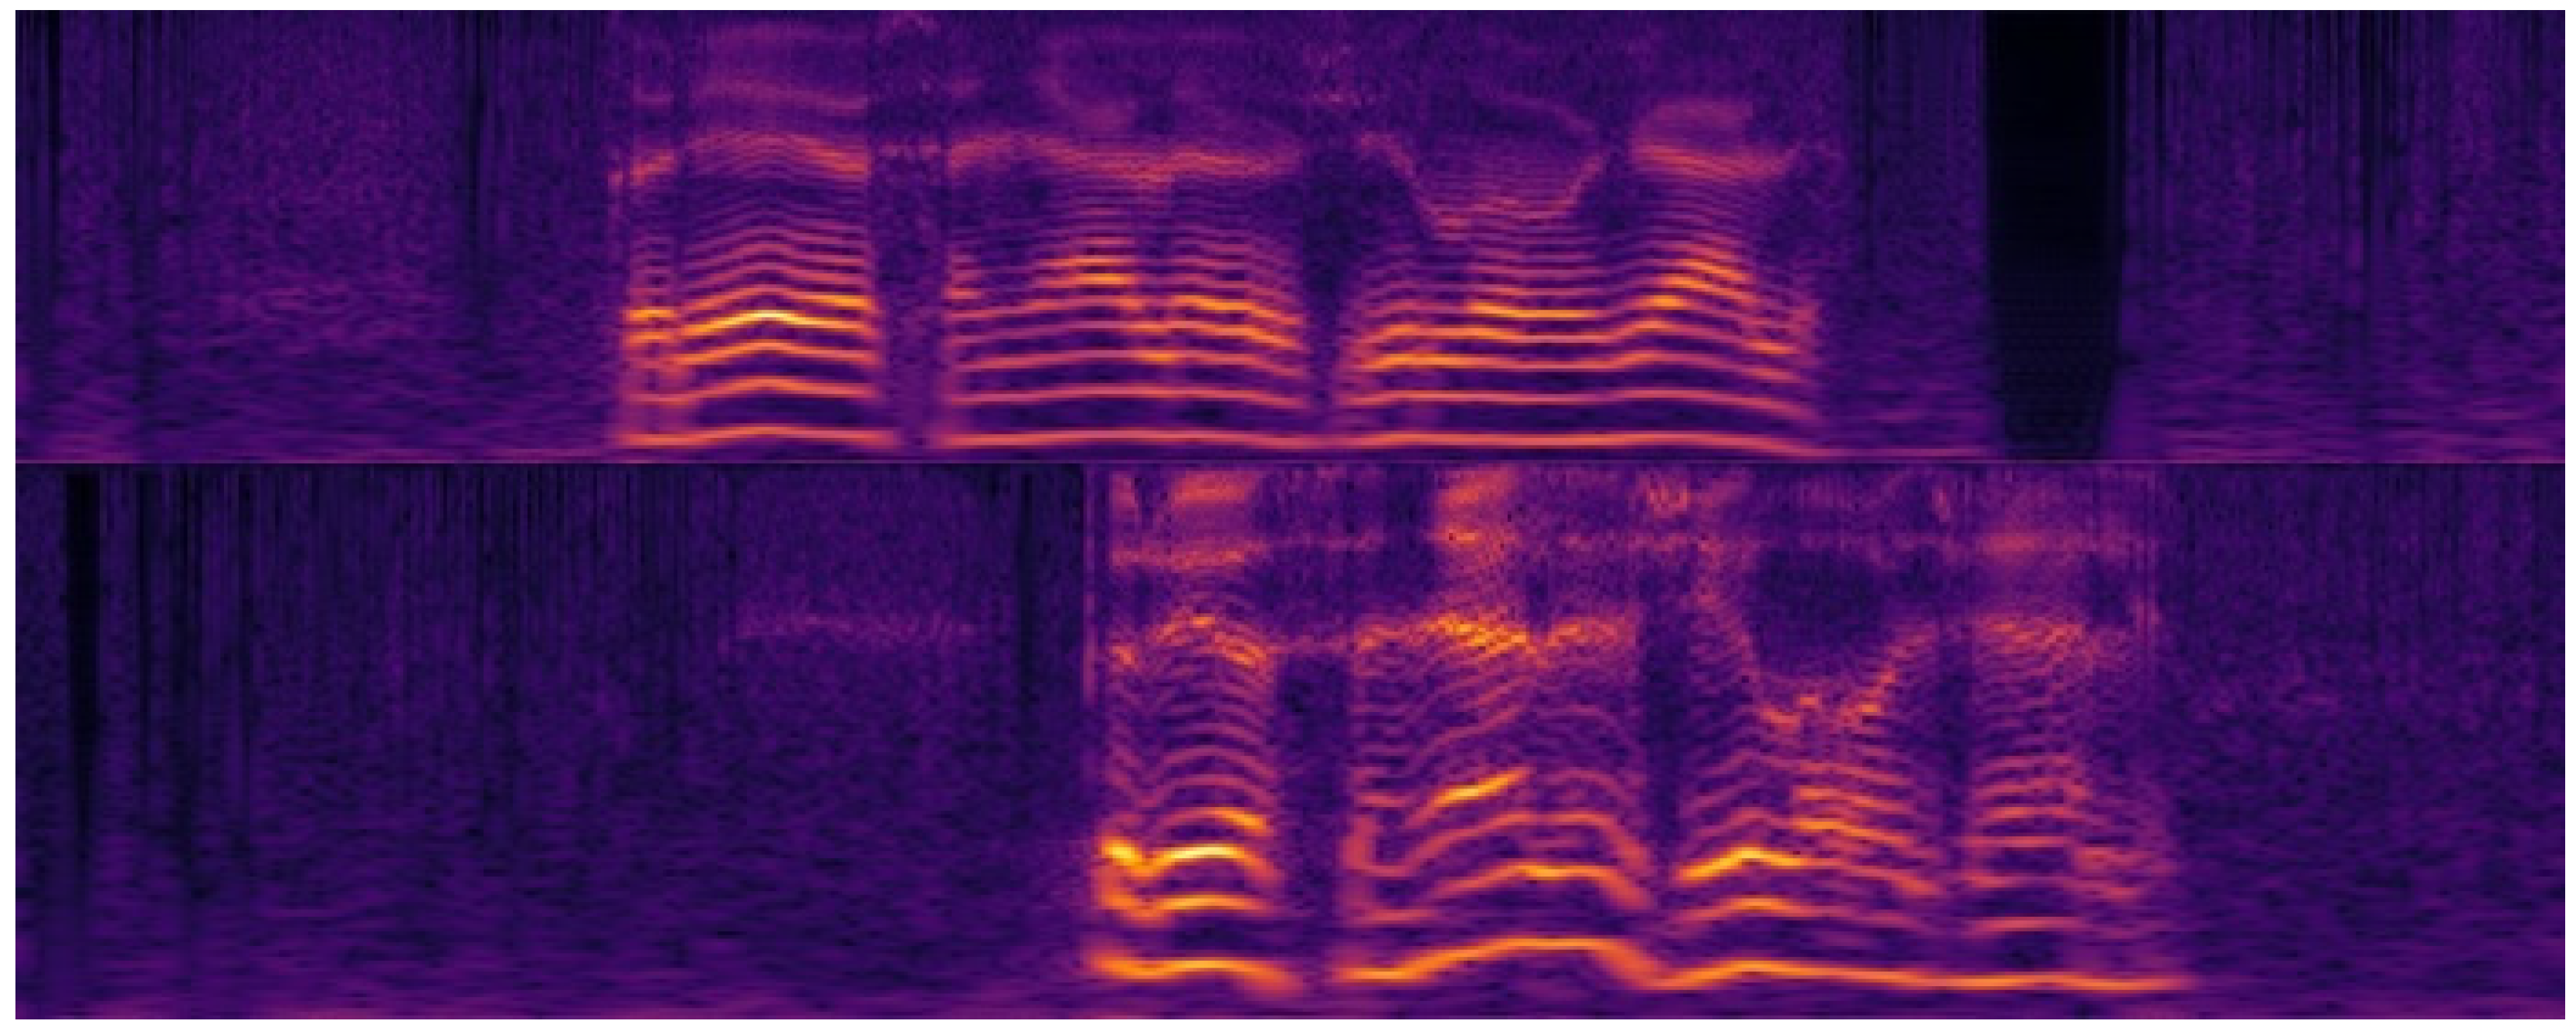
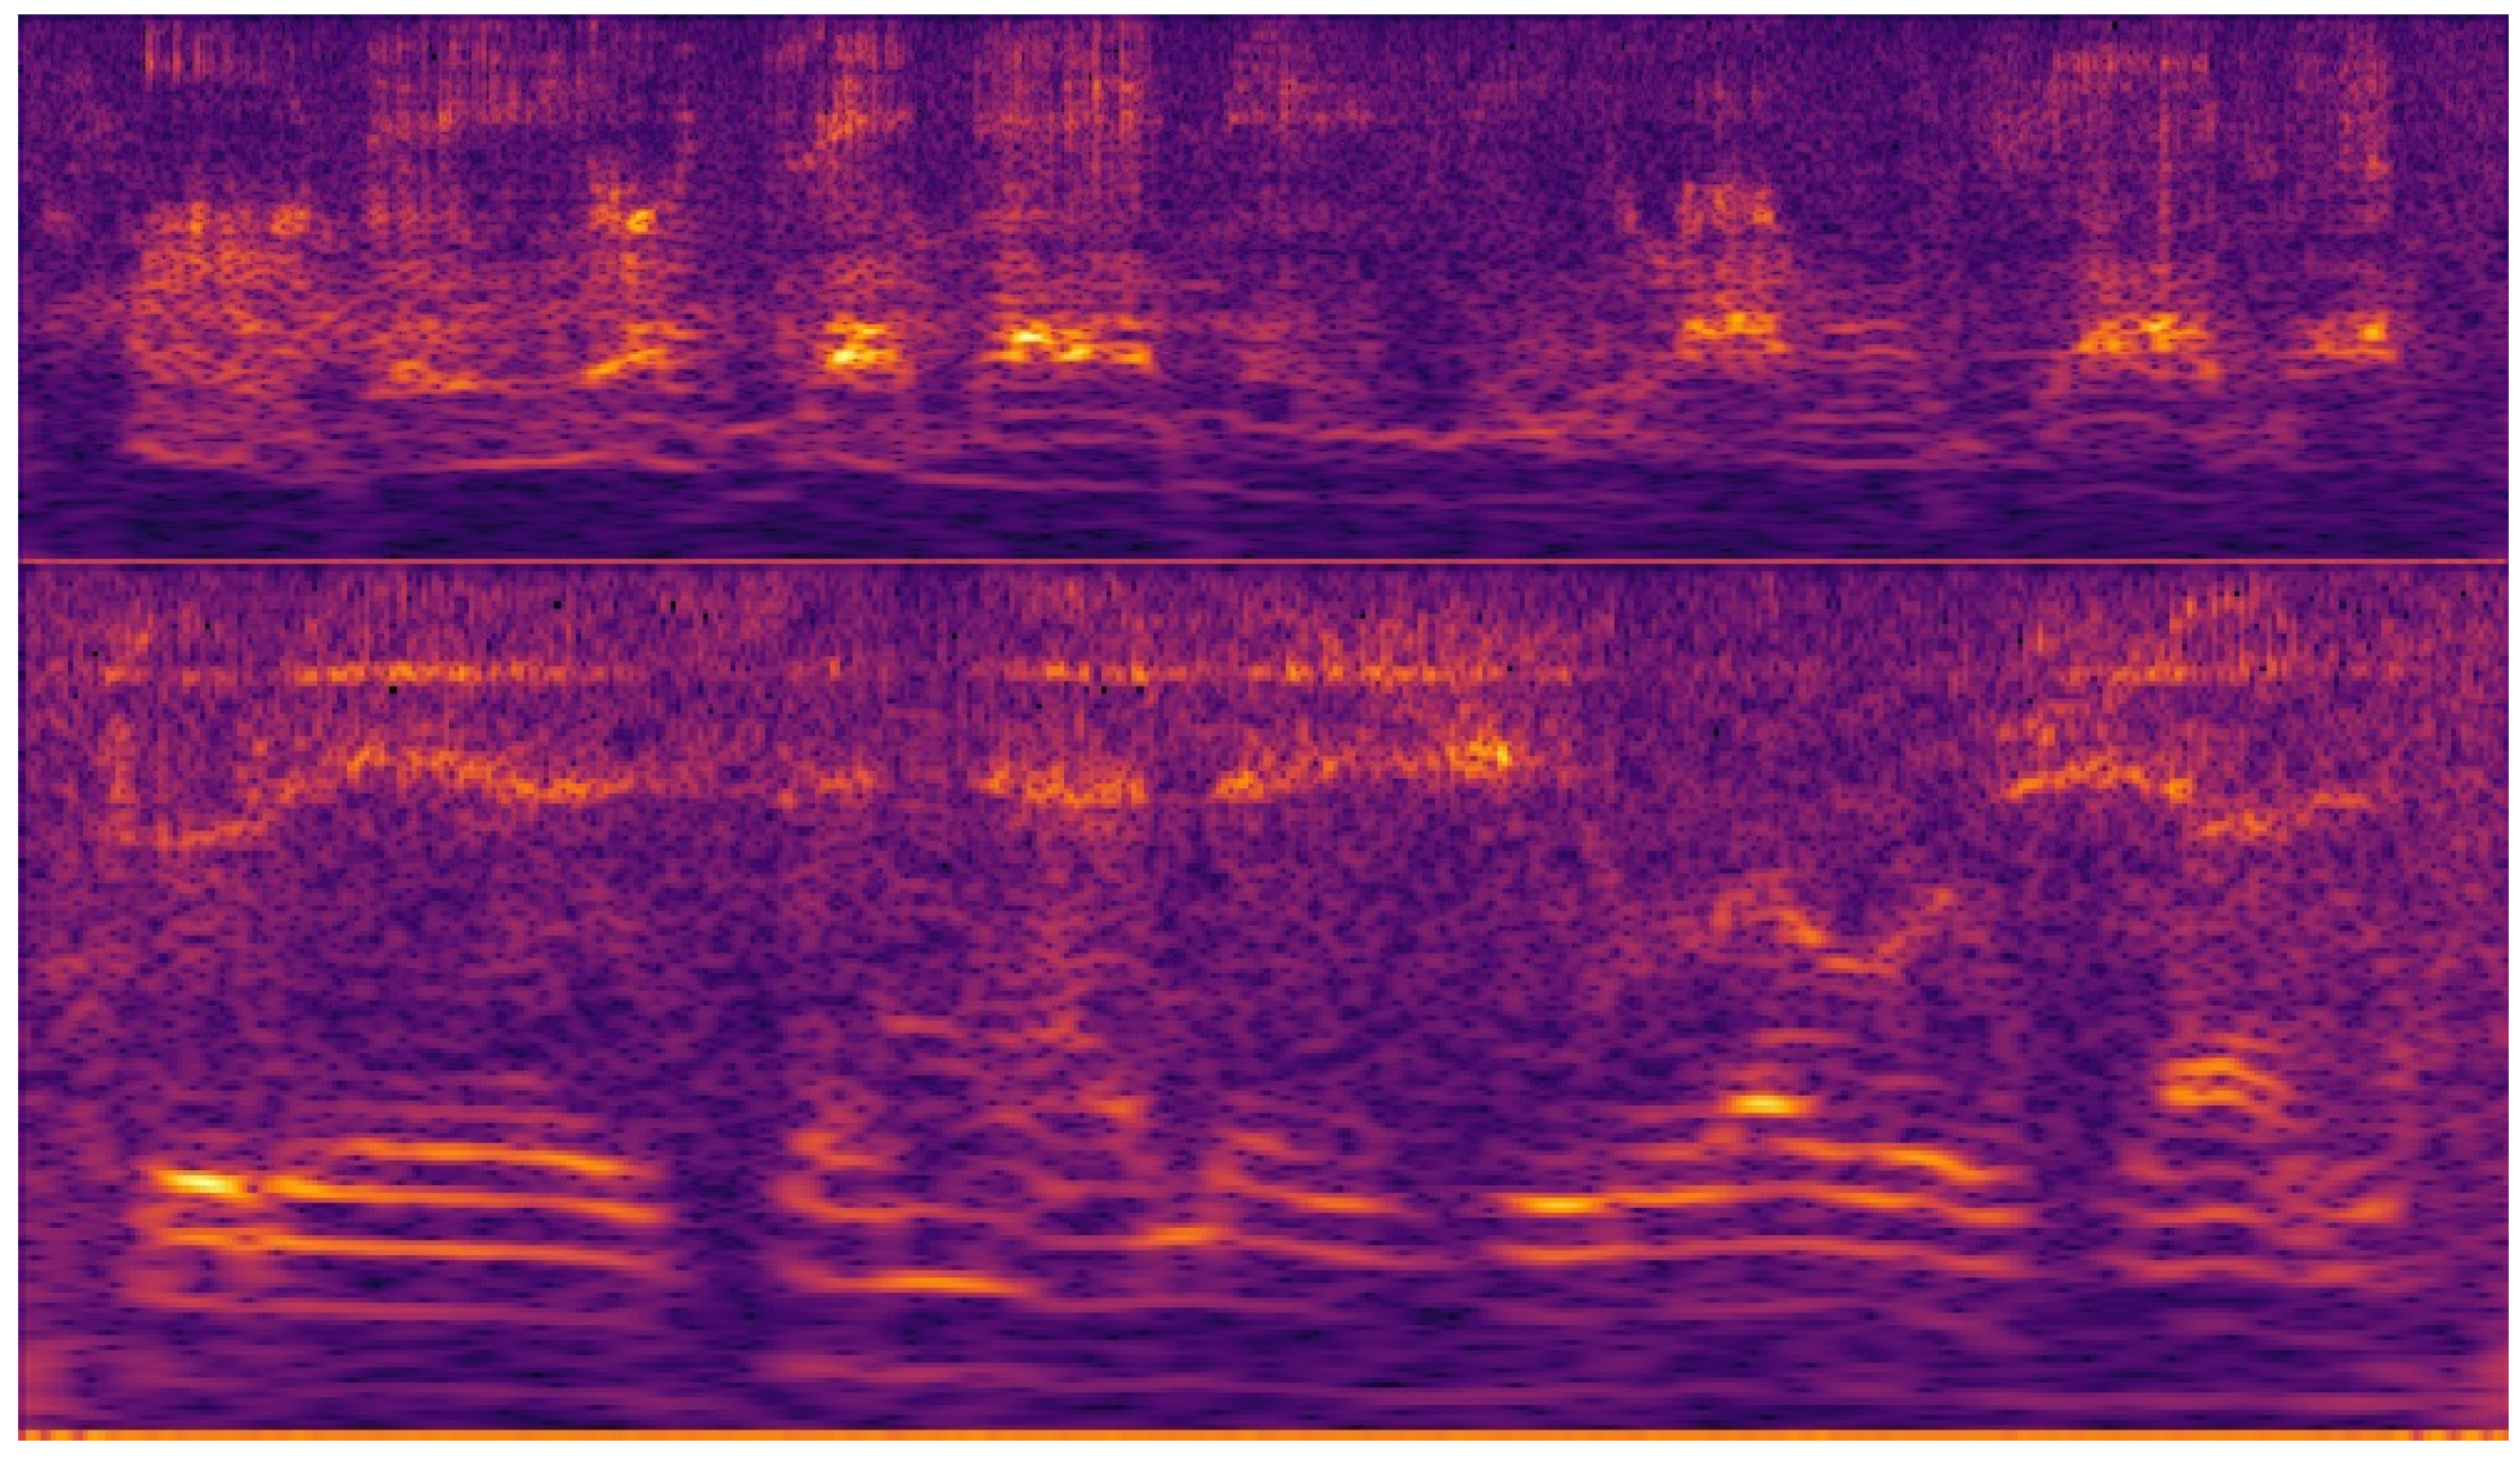
2.5. Cochleagrams of the Speech Signal
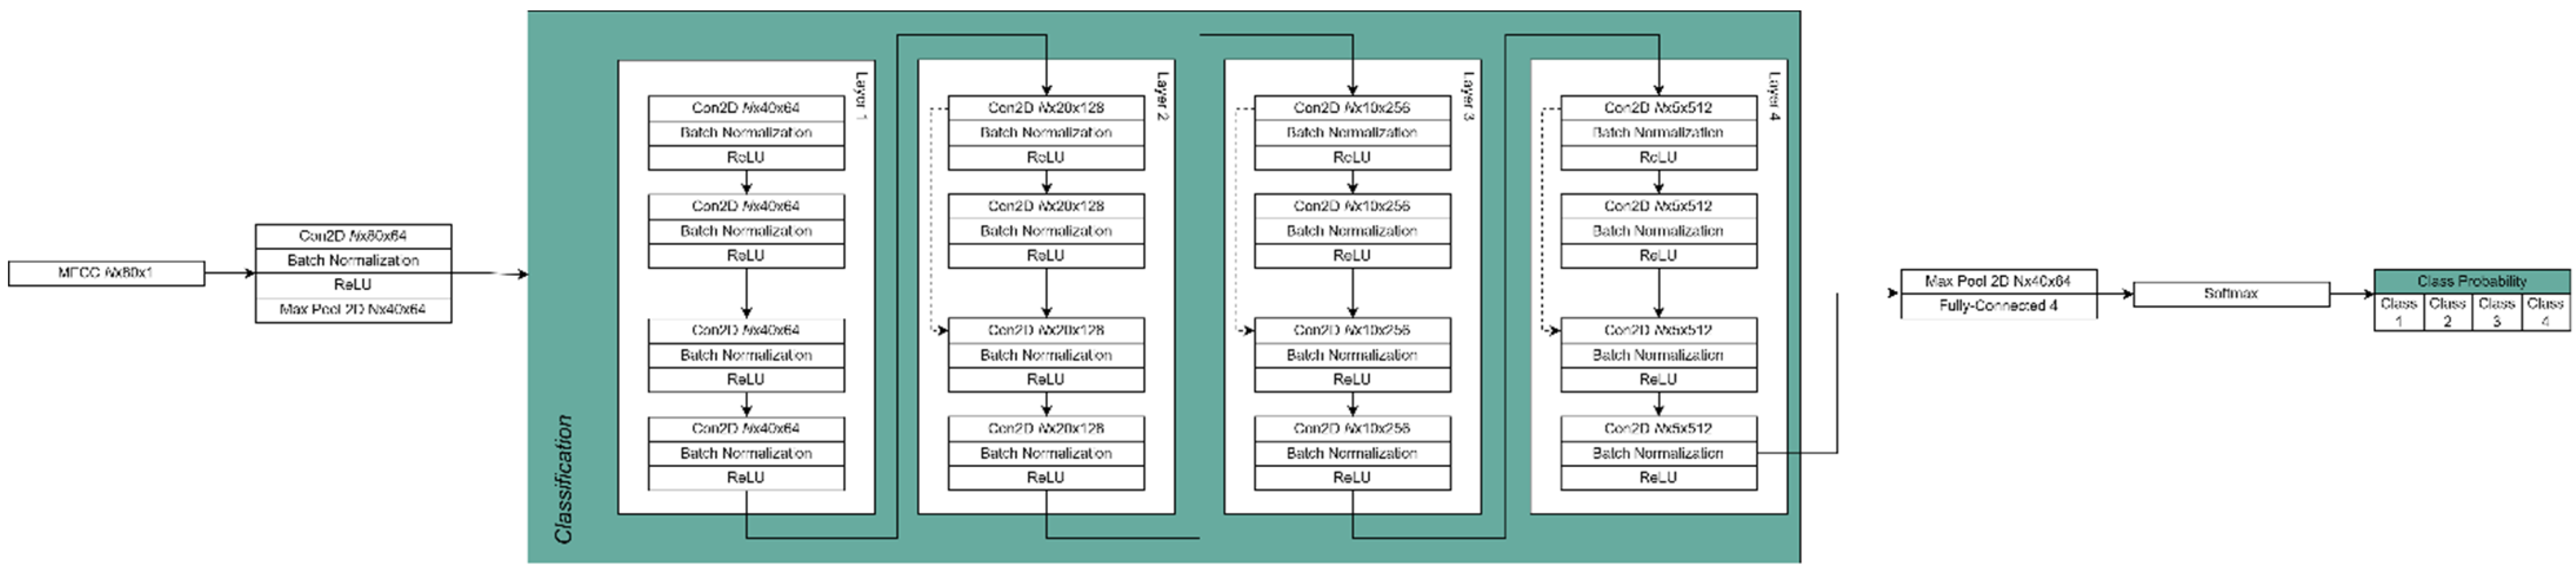
Figure 7 shows a cochleagram for a normal male voice. Figure 8 shows a cochleagram for substitution voicing after total laryngectomy and TEP implantation. They were generated from sound data for a frequency range of 30–5000 Hz using a 128-channel filter bank. A cochleagram is a time-frequency representation of a sound signal generated by a filter bank. It divides the sound into different frequencies based on a model that mimics the internal structure and composition of the human ear (outer and middle ear, membrane, cochlea, and hair cells) [55]. A comparative visual analysis of cochleagrams reveals the detectable features of cochleograms that reflect high irregularity, frequency shifts, aperiodicity, and phonatory interruptions of substitution voicing.
In terms of classification performance, the cochleagram can outperform the spectrogram [56]. We consider cochleagrams to be a useful addition to the domain of audio analysis, which can be used in conjunction with traditional acoustic features provided by Fast Fourier Transformation (FFT) and work well with deep learning audio analysis applications [57,58].

2.6. Network Model

The chaotic character of the substitution voicing signal renders examination of substitution voicing unsuitable, if not impossible, using standard clinical acoustic voice analysis procedures. In order to perform automatic speech pathology categorization and diagnosis, it is critical to collect trustworthy signal qualities, which are critical for the dependability of the outcome. Clinical interpretation of voice characteristics is frequently performed before pathology identification. Based on the analysis of other studies, many researchers distinguish signal processing functions such as Mel-frequency Coefficients (also chosen to feed the deep neural network approach), waveform packet transformations, and features reflecting a variety of human physiological and etiological reasons [59,60,61]. Multiple characteristics, including height, vibration, and flicker, were used to determine speech roughness, as well as additional approaches, such as the Harmonic to Noise Ratio, Normalized Noise Energy, and Smooth-to-Noise Ratio [62].
The hybrid neural network was used to develop the speech screening solution methodology. Given an input speech line, firstly, we convert the voice line into 16 kHz mono-channel audio to normalize inputs from potentially different sources into a single standardized input type. Once the speech line is processed, the input is then converted into an MFCC spectrogram using 80 MFC coefficients, which is then converted into the cochleagram [55]. This results in a 2D image-like input of N × 80 × 1, where N is the length of the clip. Unlike a 1D voice clip, 2D MFCC representation allows us to use 2D convolution kernels for the given voice clip input. The given spectrogram is then processed in the initial feature extraction layer. This layer consists of 80 × 64 convolution, batch normalization, and ReLU activation functions. A feature extraction max pooling is then applied. The network then branches out into a feature extraction network. The feature extraction architecture is as follows: the network consists of 4 layers, each having 4 blocks. Each block consists of convolution, batch normalization, and ReLU activation functions. The first and third blocks in the layer are residually connected with the input from the previous layer, whereas the blocks themselves are chained linearly. Additionally, the fourth block halves the latent space, reducing the input dimensionality. The fourth layer is then connected to the output layer, and the output layer depends on the network branch. The classification branch consists of max pooling followed by a fully connected layer of 4 neurons, one for each class. There are three softmaxed probabilities for each of the speech abnormalities, as can be seen in Figure 9. This approach provides us with a simple network architecture in terms of latent space variable count, therefore allowing for the potential application of the method in embedded systems such as phones.
The deep neural network consists of four feature extraction layers, and each of the layers subsists of four feature extraction nodes. The node in this context consists of three operations: convolution, normalization, and non-linearity function. The convolution operation takes an input cochleagram image that can be represented as a 2D matrix, and the convolutional kernel selects the latent features. The output matrix is then fed into a batch normalization operation, which has been shown to reduce training times, improve recall rates, and reduce occurrences of gradient explosion or vanishing [63,64]. The batch normalized result is then applied with a non-linearity function. In our case, we used a Rectified Linear Unit (ReLU), as it was experimentally determined to be the best non-linearity function when dealing with cochleagram images, in addition to its mathematical simplicity [65,66]. Each layer’s first convolutional operation kernel also performs a stride operation of size 2. This reduces the input dimensionality by skipping every other value in the input. Dimensionality reduction is not only necessary to perform the operations in real-time on modern hardware, but also improves the recall rate by removing potential noise from the input by selecting only the most prominent features. In each layer except the first, the first and third nodes are connected residually (skip connections). Skip connections have been shown to improve gradient propagation due to the spatial structuring of the gradients [63]. Finally, each layer’s second and fourth feature extraction nodes are summed up and sent to the following layer.

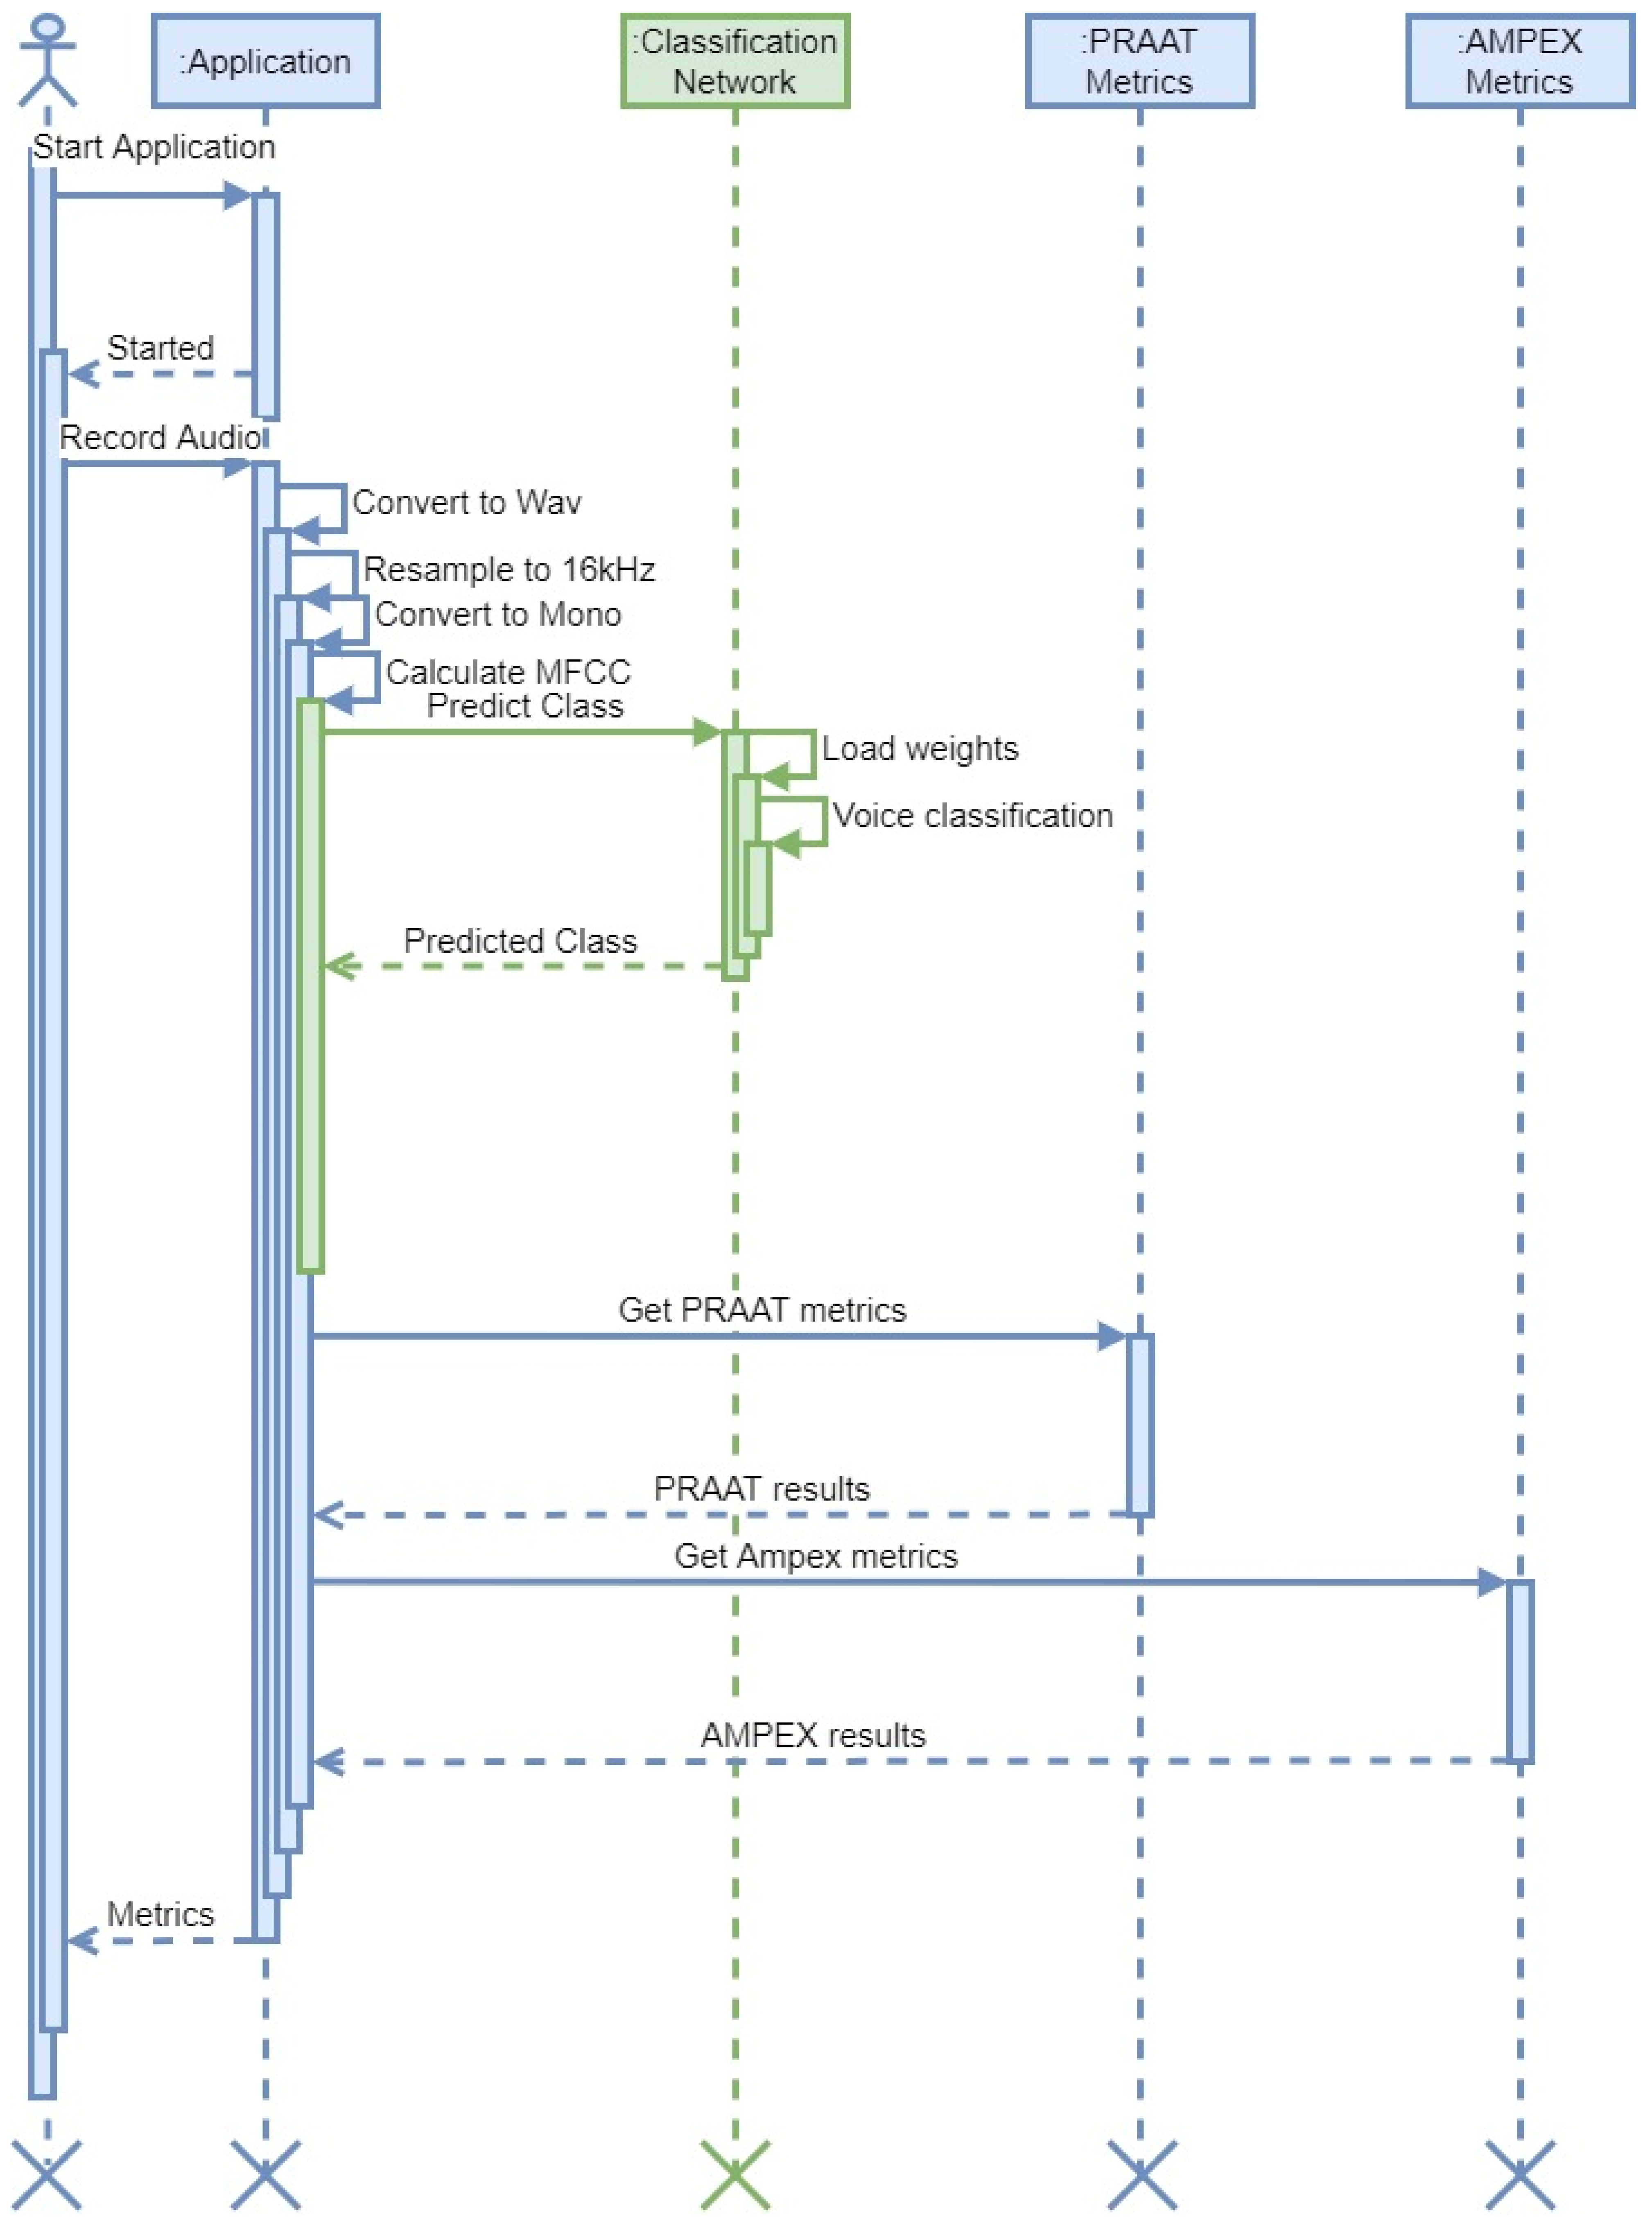
2.7. Fast Response Network

Unlike many other voice analysis approaches which use recurrent or transformer neural networks, we opted to use convolutional neural networks by analyzing the input voice data as a 2D spectrogram. This, together with the choice of the tiny ResNet-18 backbone, allowed us to reach rapid response rates of 3.56 ms for a voice line that averages around 5 s per clip when tested. This allows our approach to be used in real-time speech analysis, not only prerecorded audio clips.

2.8. Network Implementation

In Figure 10, the implementation from the software engineering perspective and the UML activity diagram of our approach are showcased. The application processes the signal by converting it to a wav format, resampling to 16 kHz Mono, calculating Mel-frequency Cepstral Coefficients, and then producing cochleagrams. The hybrid deep neural network is then employed to classify the sound file, as shown in Figure 10.
The application also uses PRAAT API functionality and AMPEX Diva API functionality as the ground truth for signal feature estimation (pitch, harmonics, average voicing, etc.) [53,67].

3. Results

3.1. Auditory-Perceptual Speech Evaluation Outcomes

The overall IINFVo scores ranged from 34 to 50 points in the control group, 18 to 40 points in the cordectomy and partial laryngectomy groups, and 0 to 35 points in the total laryngectomy group, respectively. With a Cronbach’s alpha of 0.961, the IINFVo scale demonstrated strong inter-rater reliability. The Interclass Correlation Coefficient was 0.891 on average (ranging from 0.843 to 0.927). There was no statistically significant difference in the mean IINFVo scores of the classes utilized for teaching and training the algorithm (shown in Table 3).

3.2. Developing a Combined Model for SV and Speech Assessment in Patients after Laryngeal Oncosurgery

Regression analysis was employed in order to streamline a vast number of different results provided by the algorithm into a single numeric scale, which would be easier to interpret, and therefore more applicable in a clinical setting. Data from 309 speech recordings were used for the algorithm training. A linear stepwise backward regression was used to find the most reduced model which best explained the data, and to reduce suppressor effects that may have falsely impacted the significance of predictors. Possible predictors were probabilities and digital speech features provided by the algorithm, with the total IINFVo score chosen as the dependent variable. IINFVo was chosen as a dependent in order to make the model-based speech evaluation comparable to the IINFVo evaluation performed by the trained otorhinolaryngologist. The correlation between the observed and predicted values (R) was used to measure how well the regression model matched the data. The modified R2 was used to estimate the model’s quality for the population while considering the sample size and number of predictors utilized.
The starting variable formula was as follows: Class = PVF + PVS + AVE + PVFU + MD + MDc + Jitter + F0 + Probability the recording belongs to class 0 (Prob0) + Probability the recording belongs to class 1 (Prob1) + Probability the recording belongs to class 2 (Prob2). Out of all possible models, a model with the lowest Akaike Information Criterion (AIC) was chosen. A final model for assessment of SV quality, i.e., acoustic substitution voicing index (ASVI), consisted of the constant combined with statistically significant parameters (F0, AVE, Prob0, Prob1, and Prob2):
ASVI = 8.0518 + 29.534 × AVE − 0.03 × F0 − 0.1876 × Prob2 − 0.172 × Prob1 − 0.0336 × Prob0
The possible range of the ASVI was 0 to 30, with higher values indicating better overall speech quality. The model exhibited a correlation between the predicted and observed values (R = 0.922) with an adjusted R2 of 0.842.

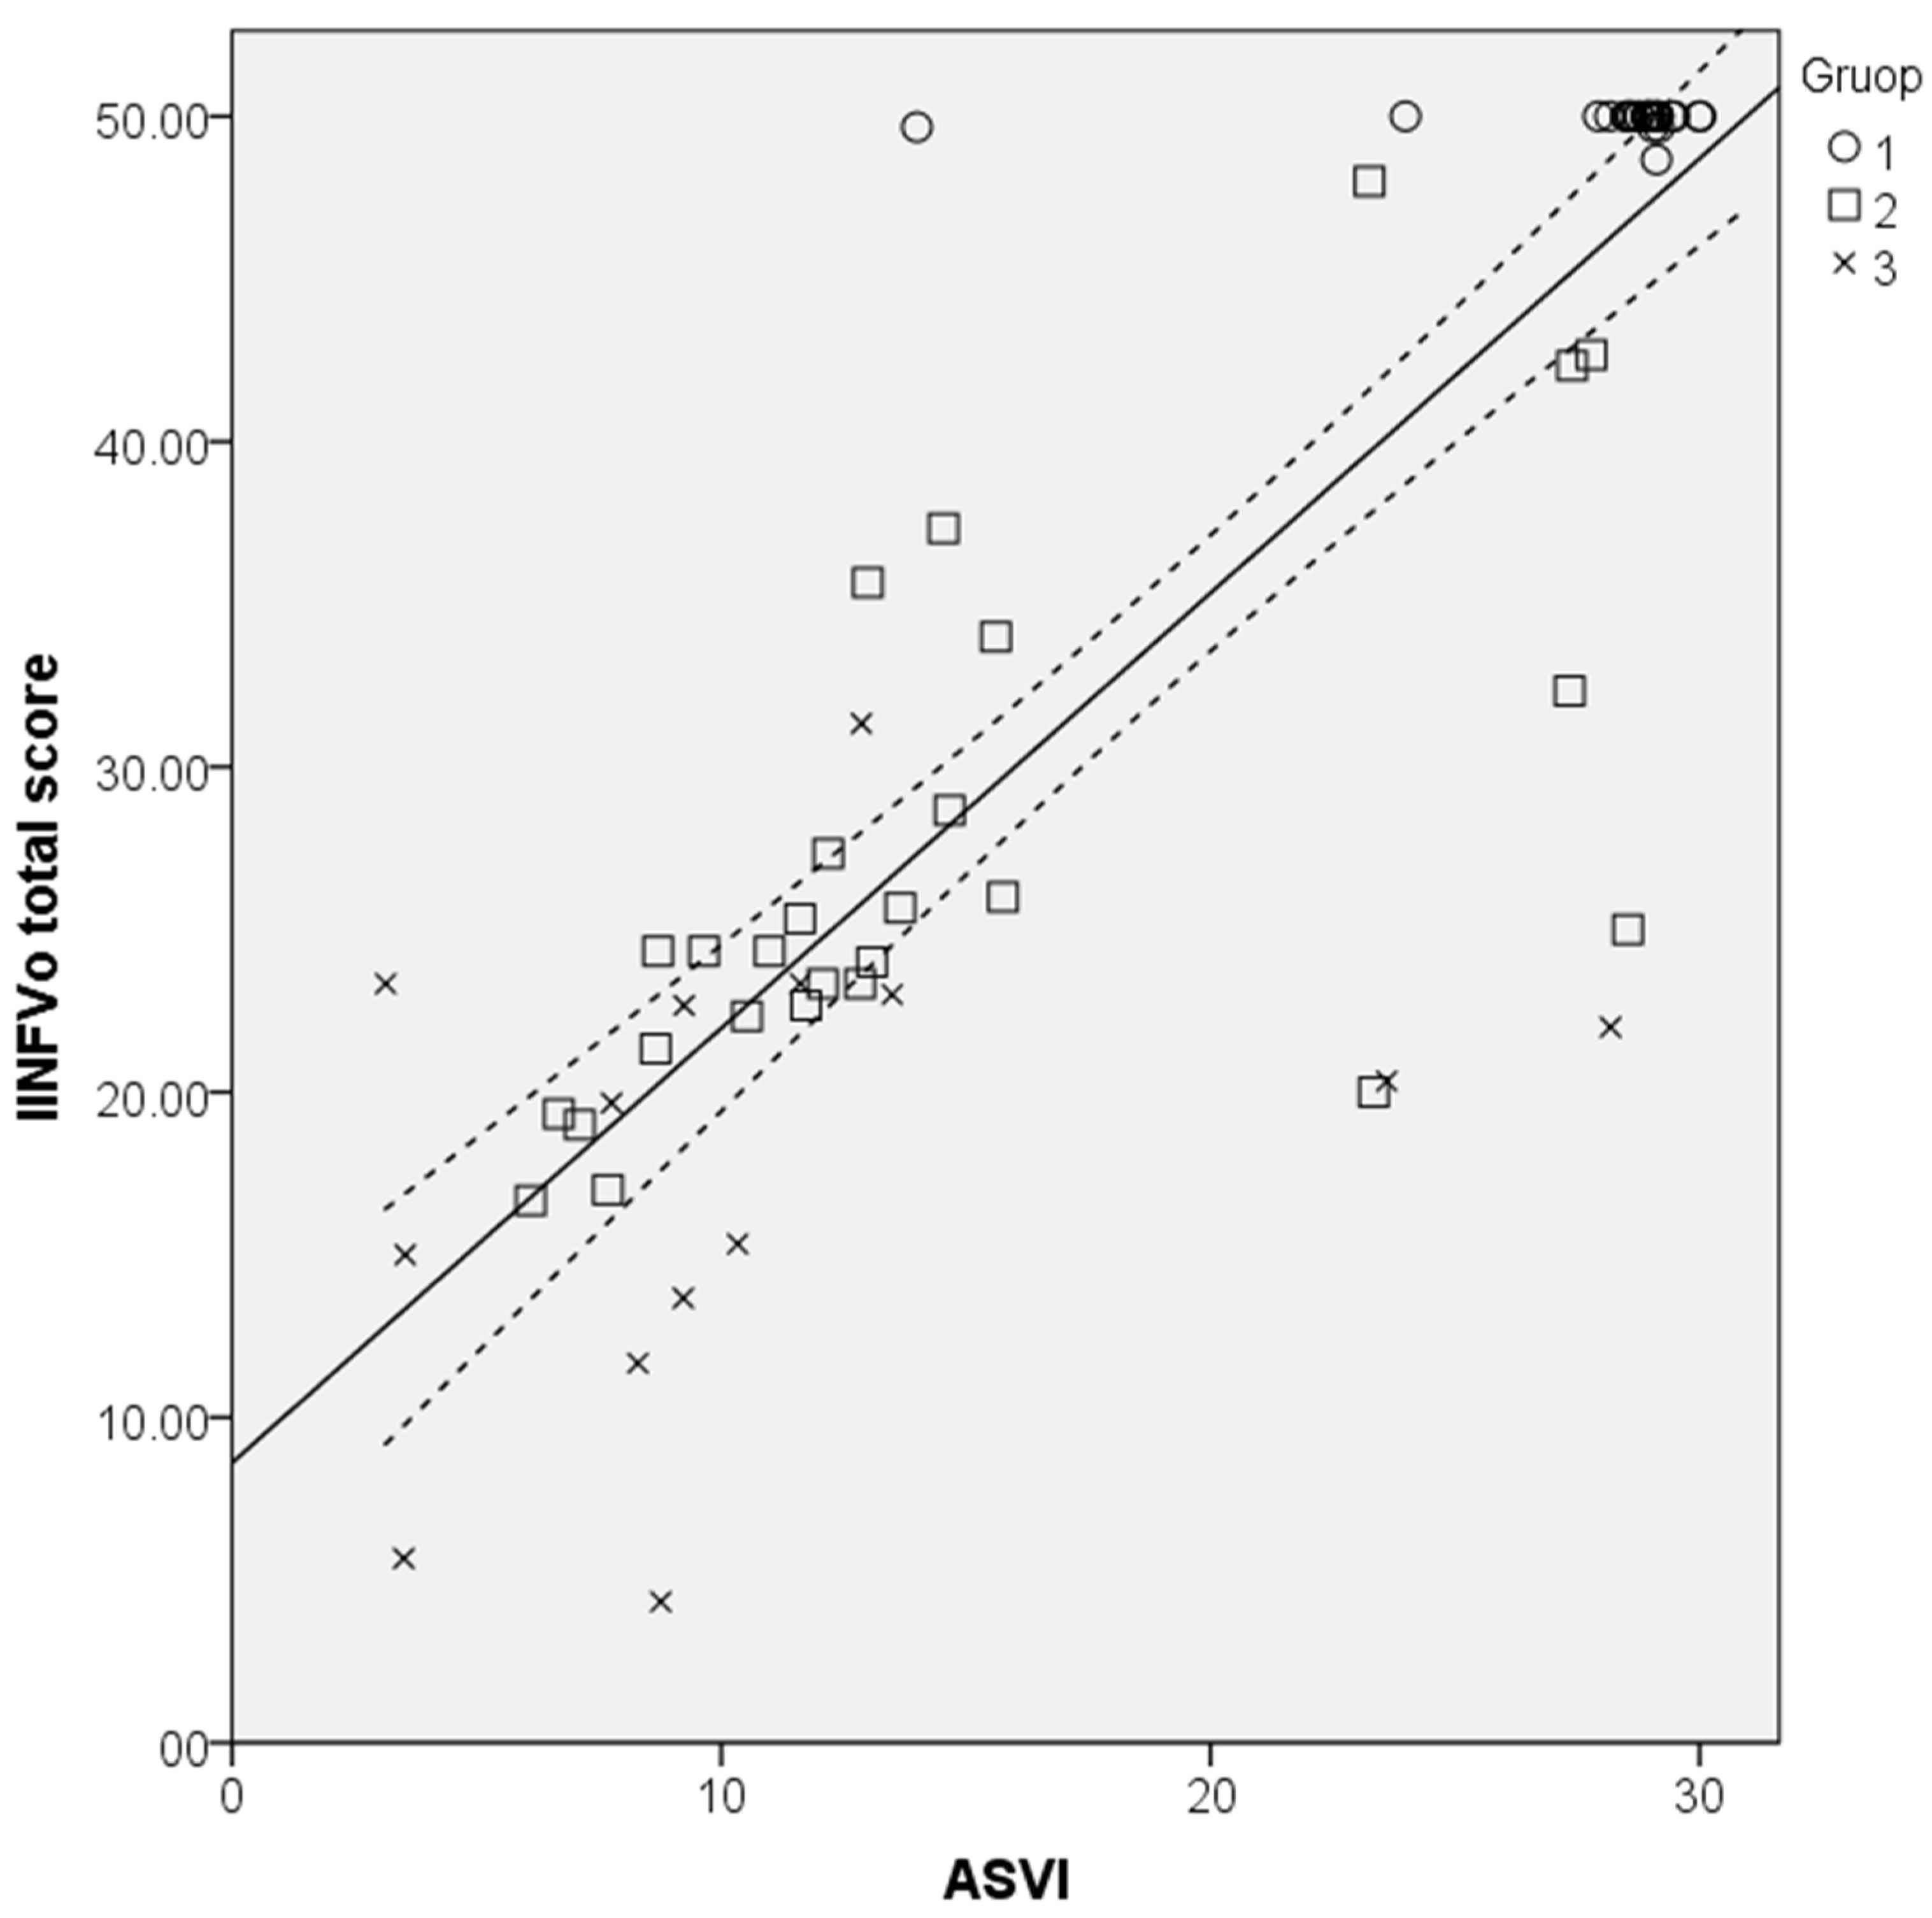
3.3. Testing of the ASVI Performance

The reserved speech recordings of 70 subjects were used to evaluate how the algorithm performed with recordings not used in the training session. This approach demonstrated an overall accuracy of 92.14% when evaluating the previously unknown speech recordings.
Total IINFVo scores of the same 70 recordings were then compared to the ASVI scores given by the developed algorithm. A statistically significant, strong correlation with Spearman’s rho (rs) = 0.863, p = 0.001 was observed between the ASVI and the IINFVo scores provided by the trained physicians (Figure 11). There was no statistically significant difference between model-predicted and observed correlation values (p = 0.284; z = −0.571).
The one-way ANOVA showed statistically significant differences between the ASVI in different study groups F (2, 69) = 60.54, p < 0.001, with the control group having the highest values that corresponded to normal voice quality, followed by the SVI patients’ groups in descending order directly depending on the extent of laryngeal oncosurgery. The mean ASVI scores in different study groups are presented in Table 4.

4. Discussion

The proposed ASVI has the potential to be used in research and clinical practice as an easy-to-use metric for SV and speech changes in patients after laryngeal oncosurgery. This index combines the benefits provided by contemporary AI-based machine learning and conventional acoustic speech assessment approaches. A statistically significant, strong correlation was revealed between the ASVI assessment results and the auditory-perceptual evaluation on the IINFVo scale provided by the trained physicians.
As with any oncological condition, laryngeal cancer patients require continuous follow-up and ongoing care. This may be hindered by several socioeconomic factors, COVID-19 pandemic-related healthcare interruptions among them. After laryngeal oncosurgery, patients, especially those who live in rural areas, are often faced with limited availability of specialized medical care [68]. As a result, there are clear benefits to offering a new framework by employing telecommunication means and artificial intelligence approaches for automated speech analysis in the context of remotely-provided healthcare services [69]. Telehealth consultations have already been shown to be beneficial for various laryngeal pathologies, with diagnostic decision results equivalent to in-patient examination [70]. From a medical standpoint, the ASVI could potentially be useful in detecting and objectively measuring changes in SV. To begin with, this would help patients to seek treatment on time after laryngeal oncosurgery, as changes in voice and speech are usually the first sign of laryngeal cancer recurrence. Consequently, early diagnosis of the recurrence and subsequent intervention results in better 5-year survival rates in most cases. Furthermore, the ability to monitor patients’ speech at home or in non-specialized patient facilities may lead to early detection of faulty tracheoesophageal prosthesis (TEP). Consequently, this would ensure the timely replacement of the TEP and avoid life-threatening complications, such as dislocation of the TEP and asphyxiation [71].
While AI-based machine learning is already a mainstay in early diagnosis in cardiology and pulmonology, it becomes less common when it comes to the assessment of laryngeal pathology, namely SV, after laryngeal oncosurgery [72]. Currently, the AI-based research on this topic is hindered by the small sample sizes in different languages and researchers using different methodologies to evaluate speech, as noted in the systematic review conducted by van Sluis et al. [73]. However, ASVI could be applied retrospectively to already-available speech datasets and provide a simple-to-interpret metric. Additionally, generated acoustic parameters provide a more in-depth look for researchers. The combination of AI-based machine learning and objective acoustic parameters provides a further benefit, as ASVI requires fewer resources for cross-cultural adaptation when compared to routine speech evaluation methods tools, i.e., special questionnaires.
The proposed version of ASVI has the benefit of a lightweight algorithm. This benefits the user in two ways. The rapid response rate allows the SV analysis to be performed in real time instead of using pre-recorded speech samples. Additionally, this approach does not require high-end hardware to run efficiently. This allows ASVI to be seamlessly implemented into smartphones or CPU-based computers which the medical centers already have.
Our team modified well known CNN models used for image categorization. The developed technique feeds a Mel-frequency spectrogram into deep neural network architecture, yielding excellent SV classification results. Our findings show that a deep learning model trained on a diseased and healthy speech database might be utilized to identify and classify speech variations that emerge following laryngeal oncosurgery. This is possible using only speech samples. This is not a replacement for clinical evaluation, but could serve as a supplementary tool when specialized care is scarce or unavailable. It can be employed through telemedicine in locations where primary care facilities lack a qualified practitioner on-site. It might help clinicians pre-screen patients by allowing invasive examinations to be performed only when concerns with automated recognition are paired with clinical findings.
In conclusion, the developed ASVI might be a significant step toward creating a practical and reliable tool for reproducible objective SV evaluation, which would be available to non-experts or professionals to assist clinical decisions in practice or research in patients following laryngeal oncosurgery.

5. Conclusions

Convolutional neural networks were utilized to analyze speech audio signals. A corpus of digitized voice recordings from 309 male individuals was used to train the system. The acoustic substitution voicing index (ASVI) model was developed using regression analysis. This model was then evaluated with an additional 70 speech samples that had not been included in the algorithm’s training, and compared to the auditory-perceptual SV rating supplied by medical practitioners. After laryngeal oncosurgery, the ASVI provided a quick and efficient solution for SV and speech in patients. The ASVI results were equivalent to medical specialists’ auditory-perceptual SV evaluations and may be called cutting-edge. The ASVI and the SV assessment conducted by qualified laryngologists had a statistically significant, strong connection with rs = 0.863 (p = 0.001). ASVI differences in the control, cordectomy and partial laryngectomy, and whole laryngectomy patient groups were statistically significant (p = 0.001). The refined, lightweight ASVI algorithm achieved reaction times of 3.56 ms.
The present study is the first work describing the use of AI-based algorithm and originally elaborated ASVI in patients’ SV and speech evaluation after surgical treatment of laryngeal cancer, and comparing it to auditory-perceptual speech evaluation provided by medical professionals. Moreover, the use of ASVI enables the quantification of SV assessment based on acoustic speech parameters. These features represent the novelty and originality of this work.

Author Contributions

Conceptualization, V.U. and R.M.; methodology, V.U., R.M. and K.P.; investigation, K.P. and S.V.; resources, K.P., A.K. and R.D.; software, R.M., A.K. and R.D.; data curation, K.P.; supervision, V.U. and R.M.; project administration, V.U. and R.M.; funding acquisition, V.U. and R.M. All authors have read and agreed to the published version of the manuscript.

Funding

This project has received funding from European Regional Development Fund (project No. 13.1.1-LMT-K-718-05-0027) under grant agreement with the Research Council of Lithuania (LMTLT). Funded as European Union’s measure in response to COVID-19 pandemic.

Institutional Review Board Statement

The study was conducted according to the guidelines of the Declaration of Helsinki, and approved by the Kaunas Regional Ethics Committee for Biomedical Research (No. BE-2-49 2022 04 20).

Informed Consent Statement

Informed consent was obtained from all subjects involved in the study.

Data Availability Statement

Restrictions apply to the availability of data used in this article. Data was obtained from LUHS and is available through the Lithuanian University of Health Sciences database with permission.

Conflicts of Interest

The authors declare no conflict of interest.

References

  1. Groome, P.A.; O’Sullivan, B.; Irish, J.C.; Rothwell, D.M.; Schulze, K.; Warde, P.R.; Schneider, K.M.; MacKenzie, R.G.; Hodson, D.I.; Hammond, J.A.; et al. Management and Outcome Differences in Supraglottic Cancer Between Ontario, Canada, and the Surveillance, Epidemiology, and End Results Areas of the United States. J. Clin. Oncol. 2003, 21, 496–505. [Google Scholar] [CrossRef]
  2. Siegel, R.L.; Miller, K.D.; Fuchs, H.E.; Jemal, A. Cancer statistics, 2022. CA A Cancer J. Clin. 2022, 72, 7–33. [Google Scholar] [CrossRef] [PubMed]
  3. Thomas, A.; Manchella, S.; Koo, K.; Tiong, A.; Nastri, A.; Wiesenfeld, D. The impact of delayed diagnosis on the outcomes of oral cancer patients: A retrospective cohort study. Int. J. Oral Maxillofac. Surg. 2021, 50, 585–590. [Google Scholar] [CrossRef] [PubMed]
  4. Noel, C.W.; Li, Q.; Sutradhar, R.; Eskander, A. Total Laryngectomy Volume During the COVID-19 Pandemic. JAMA Otolaryngol. Neck Surg. 2021, 147, 909. [Google Scholar] [CrossRef] [PubMed]
  5. Pfister, D.G.; Spencer, S.; Adelstein, D.; Adkins, D.; Anzai, Y.; Brizel, D.M.; Bruce, J.Y.; Busse, P.M.; Caudell, J.J.; Cmelak, A.J.; et al. Head and Neck Cancers, Version 2.2020, NCCN Clinical Practice Guidelines in Oncology. J. Natl. Compr. Cancer Netw. 2020, 18, 873–898. [Google Scholar] [CrossRef]
  6. Moerman, M.; Martens, J.-P.; Dejonckere, P. Multidimensional assessment of strongly irregular voices such as in substitution voicing and spasmodic dysphonia: A compilation of own research. Logop. Phoniatr. Vocology 2014, 40, 24–29. [Google Scholar] [CrossRef] [PubMed]
  7. Mattys, S.L.; Davis, M.H.; Bradlow, A.R.; Scott, S.K. Speech recognition in adverse conditions: A review. Lang. Cogn. Process. 2012, 27, 953–978. [Google Scholar] [CrossRef]
  8. Dejonckere, P.H.; Bradley, P.; Clemente, P.; Cornut, G.; Crevier-Buchman, L.; Friedrich, G.; Van De Heyning, P.; Remacle, M.; Woisard, V. A basic protocol for functional assessment of voice pathology, especially for investigating the efficacy of (phonosurgical) treatments and evaluating new assessment techniques. Eur. Arch. Oto-Rhino-Laryngol. 2001, 258, 77–82. [Google Scholar] [CrossRef]
  9. Moerman, M.B.J.; Martens, J.P.; Van Der Borgt, M.J.; Peleman, M.; Gillis, M.; Dejonckere, P.H. Perceptual evaluation of substitution voices: Development and evaluation of the (I)INFVo rating scale. European Arch. Oto-Rhino-Laryngol. Head Neck 2005, 263, 183–187. [Google Scholar] [CrossRef]
  10. Semple, C.; Parahoo, K.; Norman, A.; McCaughan, E.; Humphris, G.; Mills, M. Psychosocial interventions for patients with head and neck cancer. Cochrane Database Syst. Rev. 2013, CD009441. [Google Scholar] [CrossRef] [Green Version]
  11. Crosetti, E.; Fantini, M.; Arrigoni, G.; Salonia, L.; Lombardo, A.; Atzori, A.; Panetta, V.; Schindler, A.; Bertolin, A.; Rizzotto, G.; et al. Telephonic voice intelligibility after laryngeal cancer treatment: Is therapeutic approach significant? Eur. Arch. Otorhinolaryngol. 2016, 274, 337–346. [Google Scholar] [CrossRef] [PubMed]
  12. Hossain, M.S.; Muhammad, G.; Alamri, A. Smart healthcare monitoring: A voice pathology detection paradigm for smart cities. Multimedia Syst. 2017, 25, 565–575. [Google Scholar] [CrossRef]
  13. Cummins, N.; Baird, A.; Schuller, B.W. Speech analysis for health: Current state-of-the-art and the increasing impact of deep learning. Methods 2018, 151, 41–54. [Google Scholar] [CrossRef] [PubMed]
  14. Lee, J.-Y. Experimental Evaluation of Deep Learning Methods for an Intelligent Pathological Voice Detection System Using the Saarbruecken Voice Database. Appl. Sci. 2021, 11, 7149. [Google Scholar] [CrossRef]
  15. Chinchu, M.S.; Kirubagari, B. An evaluation of deep learning approaches for detection of voice disorders. IOP Conf. Ser. Mater. Sci. Eng. 2021, 1085, 01201. [Google Scholar] [CrossRef]
  16. Maskeliūnas, R.; Kulikajevas, A.; Damaševičius, R.; Pribuišis, K.; Ulozaitė-Stanienė, N.; Uloza, V. Lightweight Deep Learning Model for Assessment of Substitution Voicing and Speech after Laryngeal Carcinoma Surgery. Cancers 2022, 14, 2366. [Google Scholar] [CrossRef]
  17. Barsties, B.; De Bodt, M. Assessment of voice quality: Current state-of-the-art. Auris Nasus Larynx 2015, 42, 183–188. [Google Scholar] [CrossRef]
  18. Awan, S.N.; Roy, N.; Dromey, C. Estimating dysphonia severity in continuous speech: Application of a multi-parameter spectral/cepstral model. Clin. Linguistics Phon. 2009, 23, 825–841. [Google Scholar] [CrossRef]
  19. Maryn, Y.; De Bodt, M.; Roy, N. The Acoustic Voice Quality Index: Toward improved treatment outcomes assessment in voice disorders. J. Commun. Disord. 2010, 43, 161–174. [Google Scholar] [CrossRef]
  20. Latoszek, B.B.V.; Mathmann, P.; Neumann, K. The cepstral spectral index of dysphonia, the acoustic voice quality index and the acoustic breathiness index as novel multiparametric indices for acoustic assessment of voice quality. Curr. Opin. Otolaryngol. Head Neck Surg. 2021, 29, 451–457. [Google Scholar] [CrossRef]
  21. Jnr, B.A. Implications of telehealth and digital care solutions during COVID-19 pandemic: A qualitative literature review. Informatics Heal. Soc. Care 2020, 46, 68–83. [Google Scholar] [CrossRef]
  22. Hu, H.-C.; Chang, S.-Y.; Wang, C.-H.; Li, K.-J.; Cho, H.-Y.; Chen, Y.-T.; Lu, C.-J.; Tsai, T.-P.; Lee, O.K.-S. Deep Learning Application for Vocal Fold Disease Prediction Through Voice Recognition: A Preliminary Development Study (Preprint). J. Med. Internet Res. 2020, 23, e25247. [Google Scholar] [CrossRef] [PubMed]
  23. Raj, J.R.; Jabez, J.; Srinivasulu, S.S.; Gowri, S.; Vimali, J.S. Voice Pathology Detection Based on Deep Neural Network Approach. IOP Conf. Ser. Mater. Sci. Eng. 2021, 1020, 012001. [Google Scholar] [CrossRef]
  24. Hegde, S.; Shetty, S.; Rai, S.; Dodderi, T. A Survey on Machine Learning Approaches for Automatic Detection of Voice Disorders. J. Voice 2019, 33, 947.e11–947.e33. [Google Scholar] [CrossRef] [PubMed]
  25. Zhang, D.; Wu, K. Pathological Voice Analysis; Springer: Singapore, 2020. [Google Scholar]
  26. Chen, L.; Wang, C.; Chen, J.; Xiang, Z.; Hu, X. Voice Disorder Identification by using Hilbert-Huang Transform (HHT) and K Nearest Neighbor (KNN). J. Voice 2020, 35, 932.e1–932.e11. [Google Scholar] [CrossRef]
  27. Zhang, X.; Zhou, C.; Zhu, X.; Tao, Z.; Zhao, H. Class-imbalanced voice pathology classification: Combining hybrid sampling with optimal two-factor random forests. Appl. Acoust. 2022, 190, 108618. [Google Scholar] [CrossRef]
  28. Al-Dhief, F.T.; Latiff, N.M.A.; Baki, M.M.; Malik, N.N.N.A.; Sabri, N.; Albadr, M.A.A. Voice Pathology Detection Using Support Vector Machine Based on Different Number of Voice Signals. In Proceedings of the 2021 26th IEEE Asia-Pacific Conference on Communications (APCC), Kuala Lumpur, Malaysia, 11–13 October 2021; pp. 1–6. [Google Scholar] [CrossRef]
  29. Likhitha, T.; Elizabeth, T.C.; Mary Posonia, A. Discovery and Categorization of Voice Pathology Using Feature Selection Techniques. In Sixth International Conference on Intelligent Computing and Applications. Advances in Intelligent Systems and Computing; Springer: Singapore, 2021; Volume 1369. [Google Scholar] [CrossRef]
  30. Sharifi, M.; Asadi-Pooya, A.A.; Mousavi-Roknabadi, R.S. Burnout among Healthcare Providers of COVID-19; a Systematic Review of Epidemiology and Recommendations. Arch. Acad. Emerg. Med. 2020, 9, e7. [Google Scholar] [CrossRef]
  31. Uloza, V.; Padervinskis, E.; Vegiene, A.; Pribuisiene, R.; Saferis, V.; Vaiciukynas, E.; Gelzinis, A.; Verikas, A. Exploring the feasibility of smart phone microphone for measurement of acoustic voice parameters and voice pathology screening. Eur. Arch. Otorhinolaryngol. 2015, 272, 3391–3399. [Google Scholar] [CrossRef]
  32. Amami, R.; Smiti, A. An incremental method combining density clustering and support vector machines for voice pathology detection. Comput. Electr. Eng. 2017, 57, 257–265. [Google Scholar] [CrossRef]
  33. Lee, J.Y. A two-stage approach using Gaussian mixture models and higher-order statistics for a classification of normal and pathological voices. EURASIP J. Adv. Signal. Process. 2012, 2012, 252. [Google Scholar] [CrossRef]
  34. Wu, H.; Soraghan, J.; Lowit, A.; Di Caterina, G. Convolutional Neural Networks for Pathological Voice Detection. Annu. Int. Conf. IEEE Eng. Med. Biol. Soc. 2018, 2018, 1–4. [Google Scholar] [CrossRef] [PubMed]
  35. Areiza-Laverde, H.J.; Castro-Ospina, A.E.; Peluffo-Ordóñez, D.H. Voice Pathology Detection Using Artificial Neural Networks and Support Vector Machines Powered by a Multicriteria Optimization Algorithm. In Applied Computer Sciences in Engineering; Figueroa-García, J., López-Santana, E., Rodriguez-Molano, J., Eds.; Springer International Publishing: Berlin/Heidelberg, Germany, 2018; Volume 915, pp. 148–159. [Google Scholar] [CrossRef]
  36. Chen, L.; Chen, J. Deep Neural Network for Automatic Classification of Pathological Voice Signals. J. Voice 2022, 36, 288.e15–288.e24. [Google Scholar] [CrossRef] [PubMed]
  37. Fang, S.-H.; Tsao, Y.; Hsiao, M.-J.; Chen, J.-Y.; Lai, Y.-H.; Lin, F.-C.; Wang, C.-T. Detection of Pathological Voice Using Cepstrum Vectors: A Deep Learning Approach. J. Voice 2018, 33, 634–641. [Google Scholar] [CrossRef] [PubMed]
  38. Zakariah, M.; Ajmi Alothaibi, Y.; Guo, Y.; Tran-Trung, K.; Elahi, M.M. An Analytical Study of Speech Pathology Detection Based on MFCC and Deep Neural Networks. Comput. Math. Methods Med. 2022, 2022, 1–15. [Google Scholar] [CrossRef]
  39. Miliaresi, I.; Poutos, K.; Pikrakis, A. Combining acoustic features and medical data in deep learning networks for voice pathology classification. In Proceedings of the 2020 28th European Signal Processing Conference (EUSIPCO), Amsterdam, The Netherlands, 18–22 January 2021; pp. 1190–1194. [Google Scholar] [CrossRef]
  40. Syed, S.A.; Rashid, M.; Hussain, S.; Zahid, H. Comparative Analysis of CNN and RNN for Voice Pathology Detection. BioMed Res. Int. 2021, 2021, 1–8. [Google Scholar] [CrossRef]
  41. Kim, H.; Jeon, J.; Han, Y.J.; Joo, Y.; Lee, J.; Lee, S.; Im, S. Convolutional Neural Network Classifies Pathological Voice Change in Laryngeal Cancer with High Accuracy. J. Clin. Med. 2020, 9, 3415. [Google Scholar] [CrossRef] [PubMed]
  42. Ankışhan, H.; Inam, S. Voice pathology detection by using the deep network architecture. Appl. Soft Comput. 2021, 106, 107310. [Google Scholar] [CrossRef]
  43. Mittal, V.; Sharma, R.K. Deep Learning Approach for Voice Pathology Detection and Classification. Int. J. Heal. Inf. Syst. Informatics 2021, 16, 1–30. [Google Scholar] [CrossRef]
  44. Chaiani, M.; Selouani, S.A.; Boudraa, M.; Yakoub, M.S. Voice disorder classification using speech enhancement and deep learning models. Biocybern. Biomed. Eng. 2022, 42, 463–480. [Google Scholar] [CrossRef]
  45. Fan, Z.; Wu, Y.; Zhou, C.; Zhang, X.; Tao, Z. Class-Imbalanced Voice Pathology Detection and Classification Using Fuzzy Cluster Oversampling Method. Appl. Sci. 2021, 11, 3450. [Google Scholar] [CrossRef]
  46. Wahengbam, K.; Singh, M.P.; Nongmeikapam, K.; Singh, A.D. A Group Decision Optimization Analogy-Based Deep Learning Architecture for Multiclass Pathology Classification in a Voice Signal. IEEE Sens. J. 2021, 21, 8100–8116. [Google Scholar] [CrossRef]
  47. Muhammad, G.; Alhussein, M. Convergence of Artificial Intelligence and Internet of Things in Smart Healthcare: A Case Study of Voice Pathology Detection. IEEE Access 2021, 9, 89198–89209. [Google Scholar] [CrossRef]
  48. Omeroglu, A.N.; Mohammed, H.M.; Oral, E.A. Multi-modal voice pathology detection architecture based on deep and handcrafted feature fusion. Eng. Sci. Technol. Int. J. 2022, 36, 101148. [Google Scholar] [CrossRef]
  49. Abdulmajeed, N.Q.; Al-Khateeb, B.; Mohammed, M.A. A review on voice pathology: Taxonomy, diagnosis, medical procedures and detection techniques, open challenges, limitations, and recommendations for future directions. J. Intell. Syst. 2022, 31, 855–875. [Google Scholar] [CrossRef]
  50. Remacle, M.; Eckel, H.E.; Antonelli, A.; Brasnu, D.; Chevalier, D.; Friedrich, G.; Olofsson, J.; Rudert, H.H.; Thumfart, W.; De Vincentiis, M.; et al. Endoscopic cordectomy. A proposal for a classification by the Working Committee, European Laryngological Society. Eur. Arch. Otorhinolaryngol. 2000, 257, 227–231. [Google Scholar] [CrossRef]
  51. Succo, G.; Peretti, G.; Piazza, C.; Remacle, M.; Eckel, H.E.; Chevalier, D.; Simo, R.; Hantzakos, A.G.; Rizzotto, G.; Lucioni, M.; et al. Open partial horizontal laryngectomies: A proposal for classification by the working committee on nomenclature of the European Laryngological Society. Eur. Arch. Otorhinolaryngol. 2014, 271, 2489–2496. [Google Scholar] [CrossRef]
  52. Boersma, P.; Weenink, D. PRAAT, a system for doing phonetics by computer. Glot Int. 2001, 5, 341–345. [Google Scholar]
  53. Barry, B. Saarbruecken Voice Database; Institute of Phonetics, Saarland University: Saarbrücken, Germany, 2022; Available online: http://stimmdb.coli.uni-saarland.de/ (accessed on 9 September 2022).
  54. Dimauro, G.; Girardi, F. Italian Parkinson’s Voice and Speech. Available online: https://ieee-dataport.org/open-access/italian-parkinsons-voice-and-speech (accessed on 16 August 2022).
  55. Sharan, R.V.; Moir, T.J. Cochleagram image feature for improved robustness in sound recognition. In Proceedings of the 2015 IEEE International Conference on Digital Signal Processing, South Brisbane, Australia, 21–24 July 2015; pp. 441–444. [Google Scholar] [CrossRef]
  56. Arias-Vergara, T.; Klumpp, P.; Vasquez-Correa, J.C.; Nöth, E.; Orozco-Arroyave, J.R.; Schuster, M. Multi-channel spectrograms for speech processing applications using deep learning methods. Pattern Anal. Appl. 2020, 24, 423–431. [Google Scholar] [CrossRef]
  57. Das, S.; Pal, S.; Mitra, M. Supervised model for Cochleagram feature based fundamental heart sound identification. Biomed. Signal Process. Control 2019, 52, 32–40. [Google Scholar] [CrossRef]
  58. Ingale, P.P.; Nalbalwar, S.L. Deep neural network based speech enhancement using mono channel mask. Int. J. Speech Technol. 2019, 22, 841–850. [Google Scholar] [CrossRef]
  59. Jiang, J.; Li, Y. Review of active noise control techniques with emphasis on sound quality enhancement. Appl. Acoust. 2018, 136, 139–148. [Google Scholar] [CrossRef]
  60. Avila, A.R.; Gamper, H.; Reddy, C.; Cutler, R.; Tashev, I.; Gehrke, J. Non-intrusive Speech Quality Assessment Using Neural Networks. In Proceedings of the ICASSP 2019—2019 IEEE International Conference on Acoustics, Speech and Signal Processing (ICASSP), Brighton, UK, 12–17 May 2019; pp. 631–635. [Google Scholar] [CrossRef]
  61. Gamper, H.; Reddy, C.K.A.; Cutler, R.; Tashev, I.J.; Gehrke, J. Intrusive and Non-Intrusive Perceptual Speech Quality Assessment Using a Convolutional Neural Network. In Proceedings of the 2019 IEEE Workshop on Applications of Signal Processing to Audio and Acoustics (WASPAA), New Paltz, NY, USA, 20–23 October 2019; pp. 85–89. [Google Scholar] [CrossRef]
  62. Latoszek, B.B.V.; Maryn, Y.; Gerrits, E.; De Bodt, M. A Meta-Analysis: Acoustic Measurement of Roughness and Breathiness. J. Speech Lang. Hear. Res. 2018, 61, 298–323. [Google Scholar] [CrossRef] [PubMed]
  63. Zoughi, T.; Homayounpour, M.M.; Deypir, M. Adaptive windows multiple deep residual networks for speech recognition. Expert Syst. Appl. 2019, 139, 112840. [Google Scholar] [CrossRef]
  64. Zhang, K.; Zuo, W.; Chen, Y.; Meng, D.; Zhang, L. Beyond a Gaussian Denoiser: Residual Learning of Deep CNN for Image Denoising. IEEE Trans. Image Process. 2017, 26, 3142–3155. [Google Scholar] [CrossRef] [PubMed] [Green Version]
  65. Nair, V.; Hinton, E.G. Rectified linear units improve restricted boltzmann machines. In Proceedings of the 27th International Conference on International Conference on Machine Learning (ICML’10), Haifa, Israel, 21–24 June 2010; Omnipress: Madison, WI, USA, 2010; pp. 807–814. [Google Scholar]
  66. Nakashika, T.; Takaki, S.; Yamagishi, J. Complex-Valued Restricted Boltzmann Machine for Speaker-Dependent Speech Parameterization from Complex Spectra. IEEE/ACM Trans. Audio Speech Lang. Process. 2018, 27, 244–254. [Google Scholar] [CrossRef]
  67. Van Immerseel, L.M.; Martens, J. Pitch and voiced/unvoiced determination with an auditory model. J. Acoust. Soc. Am. 1992, 91, 3511–3526. [Google Scholar] [CrossRef]
  68. Entezami, P.; Bs, B.T.; Mansour, J.; Asarkar, A.; Nathan, C.; Pang, J. Targets for improving disparate head and neck cancer outcomes in the low-income population. Laryngoscope 2021, 6, 1481–1488. [Google Scholar] [CrossRef]
  69. Vanagas, G.; Engelbrecht, R.; Damaševičius, R.; Suomi, R.; Solanas, A. eHealth Solutions for the Integrated Healthcare. J. Health Eng. 2018, 2018, 3846892. [Google Scholar] [CrossRef]
  70. Payten, C.L.; Nguyen, D.D.; Novakovic, D.; O’Neill, J.; Chacon, A.M.; Weir, K.A.; Madill, C.J. Telehealth voice assessment by speech language pathologists during a global pandemic using principles of a primary contact model: An observational cohort study protocol. BMJ Open 2022, 12, e052518. [Google Scholar] [CrossRef]
  71. Abia-Trujillo, D.; Tatari, M.M.; Venegas-Borsellino, C.P.; Hoffman, R.J.; Fox, H.T.; Fernandez-Bussy, I.; Guru, P.K. Misplaced tracheoesophageal voice prosthesis: A case of foreign body aspiration. Am. J. Emerg. Med. 2020, 41, 266.e1–266.e2. [Google Scholar] [CrossRef]
  72. Al-Dhief, F.T.; Latiff, N.M.A.; Malik, N.N.N.A.; Salim, N.S.; Baki, M.M.; Albadr, M.A.A.; Mohammed, M.A. A Survey of Voice Pathology Surveillance Systems Based on Internet of Things and Machine Learning Algorithms. IEEE Access 2020, 8, 64514–64533. [Google Scholar] [CrossRef]
  73. van Sluis, K.E.; van der Molen, L.; van Son, R.J.J.H.; Hilgers, F.J.M.; Bhairosing, P.A.; Brekel, M.W.M.V.D. Objective and subjective voice outcomes after total laryngectomy: A systematic review. Eur. Arch. Otorhinolaryngol. 2018, 275, 11–26. [Google Scholar] [CrossRef] [PubMed] [Green Version]
Figure 1. Histograms of voice signal energy in datasets.
Applsci 12 09748 g001
Figure 2. Histograms of voice signal power in datasets.
Applsci 12 09748 g002
Figure 3. Histograms of voice signal SNR in datasets.
Applsci 12 09748 g003
Figure 4. Statistical distribution of voice signal energy in datasets. The difference between the German and Italian datasets is statistically significant (p < 0.001). The difference between the German and Lithuanian datasets is statistically significant (p < 0.001). The difference between the Italian and Lithuanian datasets is statistically significant (p < 0.001).
Applsci 12 09748 g004
Figure 5. Statistical distribution of voice signal power in datasets. The difference between the German and Italian datasets is statistically significant (p < 0.001). The difference between the German and Lithuanian datasets is statistically significant (p < 0.01). The difference between the Italian and Lithuanian datasets is statistically significant (p < 0.001).
Applsci 12 09748 g005
Figure 6. Statistical distribution of voice signal SNR in datasets. The difference between the German and Italian datasets is statistically significant (p < 0.001). The difference between the German and Lithuanian datasets is statistically significant (p < 0.01). The difference between the Italian and Lithuanian datasets is statistically significant (p < 0.001).
Applsci 12 09748 g006
Figure 7. Cochleagrams of normal speech samples. Minimal frequency shifts and no aperiodicity or unintended phonatory breaks can be observed. Pauses between separate words are easily distinguishable.
Applsci 12 09748 g007
Figure 8. Cochleagrams of substitution voicing speech samples in patients after total laryngectomy with tracheoesophageal prosthesis. Multiple frequency shifts, unintended phonatory breaks, and additional noises can be observed.
Applsci 12 09748 g008
Figure 9. The architecture of the hybrid deep neural network used for classification.
Applsci 12 09748 g009
Figure 10. Activity UML diagram explaining the principle of implementation. Tasks performed by the neural network are highlighted in green.
Applsci 12 09748 g010
Figure 11. Scatterplot illustrating the correlation between the Impression, Intelligibility, Noise, Fluency, and Voicing perceptual rating scale (IINFVo) and the acoustic substitution voicing index (ASVI) with a 95% confidence interval.
Applsci 12 09748 g011
Table 1. Arrangement of the groups in the study.
GroupTeachingTestingTotal
Control (class 0)25029279
Cordectomy and partial laryngectomy (class 1)412970
Total laryngectomy (class 2)181230
Table 2. Acoustic speech features captured in the dataset.
FeatureDescription
F0Fundamental frequency
PVFPercentage of voiced frames
PVSPercentage of voiced speech frames
AVEMean voicing evidence of voiced frames (proportion)
PVFUPercentage of voiced frames with unreliable F0
MDAverage F0 modulation
MDcMD only in frames with a “reliable” F0 estimate. Vocal frequency estimate F0 is considered reliable if it deviates less than 25% from the average over all voiced frames.
JitterF0-jitter in all voiced frame pairs (=2 consecutive frames)
Table 3. Results of auditory-perceptual speech evaluation.
GroupTeaching Group IINFVo Total Score (SD)Testing Group IINFVo Total Score (SD)p
Control (class 0)48.01 (2.88)49.02 (2.62)0.0724
Cordectomy and partial laryngectomy (class 1)22.52 (9.98)26.62 (8.09)0.0721
Total laryngectomy (class 2)16.92 (10.71)17.95 (7.44)0.7746
Table 4. The mean acoustic substitution voicing index (ASVI) scores in control and patients’ groups.
GroupnASVI (SD)p
Control (class 0)2928.28 (2.93)0.001
Cordectomy and partial laryngectomy (class 1)2915.39 (7.31)0.001
Total laryngectomy (class 2)128.48 (3.53)0.001
Publisher’s Note: MDPI stays neutral with regard to jurisdictional claims in published maps and institutional affiliations.

