Article

Optimal Longitudinal Texture on Concrete Pavement to Reduce Lateral Vibration of Vehicles

1
Korea Expressway Corporation Research Institute, 208-96, Dongbu-daero 922 Beon-gil, Dongtan-myeon, Hwaseong-si 18489, Korea
2
Roadtech Inc., 705, Haean-ro, Sangrok-gu, Ansan-si 15588, Korea
3
Total Pave System, 42, Changeop-ro, Sujeong-gu, Seongnam-si 18489, Korea
*
Author to whom correspondence should be addressed.
Appl. Sci. 2022, 12(19), 9661; https://doi.org/10.3390/app12199661
Submission received: 18 August 2022 / Revised: 19 September 2022 / Accepted: 19 September 2022 / Published: 26 September 2022
(This article belongs to the Special Issue Fatigue, Performance, and Damage Assessment of Concrete)

Abstract

:
Since the mid-2000 s, longitudinal tinning has been applied to concrete pavements of expressways to improve the comfort and safety of road vehicle users. However, in certain longitudinal tinning sections, lateral vibrations occur during driving, which poses a safety hazard. This paper analyzes the cause behind this problem and proposes a longitudinal texturing specification that can minimize lateral vibration. To perform this analysis, the accelerations of driving vehicles and the degree of lateral vibration transmitted to panels in the vehicles were evaluated for each longitudinal texture applied in South Korea. Structural analysis was also conducted for the lateral force and moment according to the tire tread profile and longitudinal texturing specifications using the finite element method. In addition, field investigation, indoor drivability evaluation, and field application were performed to evaluate the optimal longitudinal texturing specification. The results indicate that the texture designated as 2 × 3 × 19 mm is the optimal longitudinal texture on hardened concrete pavement. However, because this specification is difficult to apply to fresh concrete, 3 × 3 × 16 mm is proposed as the optimal longitudinal texture owing to its excellent performance in the panel survey and in structural analysis.

1. Introduction

In 2006, a survey was conducted in South Korea on the importance of road services and the problems related to pavement by expressway users [1]. The survey showed that road surface condition is the most important factor; in particular, drivability according to surface conditions such as the likelihood of skid resistance and noise accounted for more than 50% of the survey result. Subsequently, the Korea Expressway Corporation (KEC) introduced and has been applying longitudinal tinning as a surface texturing method to improve driving comfort and reduce noise [2]. Longitudinal tinning has a slightly lower skid resistance than lateral tinning, but it surpasses the minimum coefficient of friction standard. Moreover, it has a higher noise reduction and drivability than lateral tinning, thereby increasing comfort for road users. Recently, however, users have raised complaints of lateral vibrations while driving in longitudinal tinning sections. Although KEC has improved the longitudinal tinning specifications, complaints have nonetheless been raised intermittently in certain sections even after the improvement [3].
Representative factors of lateral vibrations in longitudinal texturing sections include the texture specifications of pavement surfaces and the tire specifications of vehicles, and the degree of vibrations depends on the combination of these factors. In South Korea, during the early stage of the introduction of longitudinal tinning, coarse aggregates used to get detached due to tinning specifications being narrower than the maximum coarse aggregate size (25 mm or 32 mm) of concrete pavement [4]. Hence, the method of arbitrarily increasing or decreasing the center-to-center interval of longitudinal tinning was used at the construction site. However, even still, lateral vibrations have continuously been reported. Consequently, longitudinal tinning was removed through diamond grinding in more than half of the sections in which it was previously applied. Subsequently, a study was conducted to address this problem, and it found that the larger the tinning width, the higher the probability of lateral vibrations, and that a tinning width of 2 mm could help avoid lateral vibrations in all vehicle types [5]. For the tinning center-to-center interval, initially, a distance of 21 mm had been applied; however, now 19 mm is being applied, which is the same as in the U.S. However, it was found that test sections of 16 mm generated fewer lateral vibrations than the 19 mm sections, although the tinning width and center-to-center intervals need to be finalized after reviewing the practicality of field application. Kang investigated the effects of tire patterns and pavement surface on groove wandering and found that the lateral stress in the equal-interval grooving section decreased as the center interval became larger and it increased with the groove width [6]. It was confirmed that the center-to-center groove interval had a greater effect than the groove width. Recently in South Korea, Next Generation Concrete Surface (NGCS) with a width of 3–4 mm, depth of 3–5 mm, and center-to-center interval of 13–16 mm has been applied to improve driving comfort and safety of drivers in tunnels [7]. However, lateral vibrations were reported in these sections as well. The California Department of Transportation (USA) is also limiting the groove width to 3.2 mm and the center-to-center interval to 19 mm due to the occurrence of lateral vibrations in NGCS sections [8].
Lateral vibrations in tires are caused by the imbalance among lateral forces when the pavement texture and tire tread are in contact. Grooves and tread blocks, which are in direct contact with the pavement texture, have a high correlation with lateral vibration [6]. Furthermore, the influence factor of the tire part has the closest relationship with the groove because the imbalance of lateral stress increases if the interface between the block and groove is caught in the tinning groove of pavement [9]. The Cooper Tire and Rubber Company research team investigated various tire patterns by applying a new lateral stress theory [10]. According to this theory, lateral vibration occurs when the lateral forces—which occur when the pavement tinning comes in contact with the tire groove—are unbalanced. Han studied the vibrations induced according to tire patterns in longitudinal tinning sections [9]. The study showed that lateral vibrations decreased as the distance between the tire groove and tinning groove increased, and they suggested that rather than the groove position of tires, their width, shape, and edge shape should be modified. Uniroyal Tire published the Tread Element Trapping theory about lateral vibrations on pavement textures [11]. They also estimated that lateral vibrations were caused by the interaction between the tire groove and pavement texture and presented a prediction model for lateral vibration by plotting the number of times when the tire groove and tinning coincide with each other (coincidence index). In 2010, Yukio proposed a prediction model for lateral vibrations on pavement surfaces for complex tire patterns [12]. The study discovered that the size and frequency of reaction force change with the relative position of tire grooves when they come in contact with the pavement texture. Thus, they claimed that lateral vibrations can be reduced by creating different tire grooves according to the groove width and depth on the surface. In their study, the issue of lateral vibrations showed a high correlation with straight-grooved tires and a low correlation with zigzag-patterned tires. Other studies have been conducted on lateral vibration caused by tire and pavement texture [13,14,15]. However, there is not much literature on lateral vibration between longitudinal texture and tire. In a lot of literatures, only individual studies on tire treads or textures have been conducted.
The above discussion indicates that the lateral vibrations experienced by vehicles vary according to their tire tread profile and the longitudinal texturing specifications. Therefore, the present study was conducted to derive a longitudinal texturing specification that can minimize the lateral vibrations in vehicles resulting from expressways with longitudinal texture. To that end, the degree of lateral vibrations was evaluated by driving vehicles with tires widely used in domestic vehicles on the sections with longitudinal tinning sections where complaints were raised or field tests were performed. The results were revalidated using laboratory testing equipment for driving simulation and by performing finite element analysis under the same conditions. Finally, a longitudinal texturing specification that can minimize lateral vibrations and can be practically applied in the field is proposed.

2. Evaluation of Lateral Vibration of Driving Vehicles

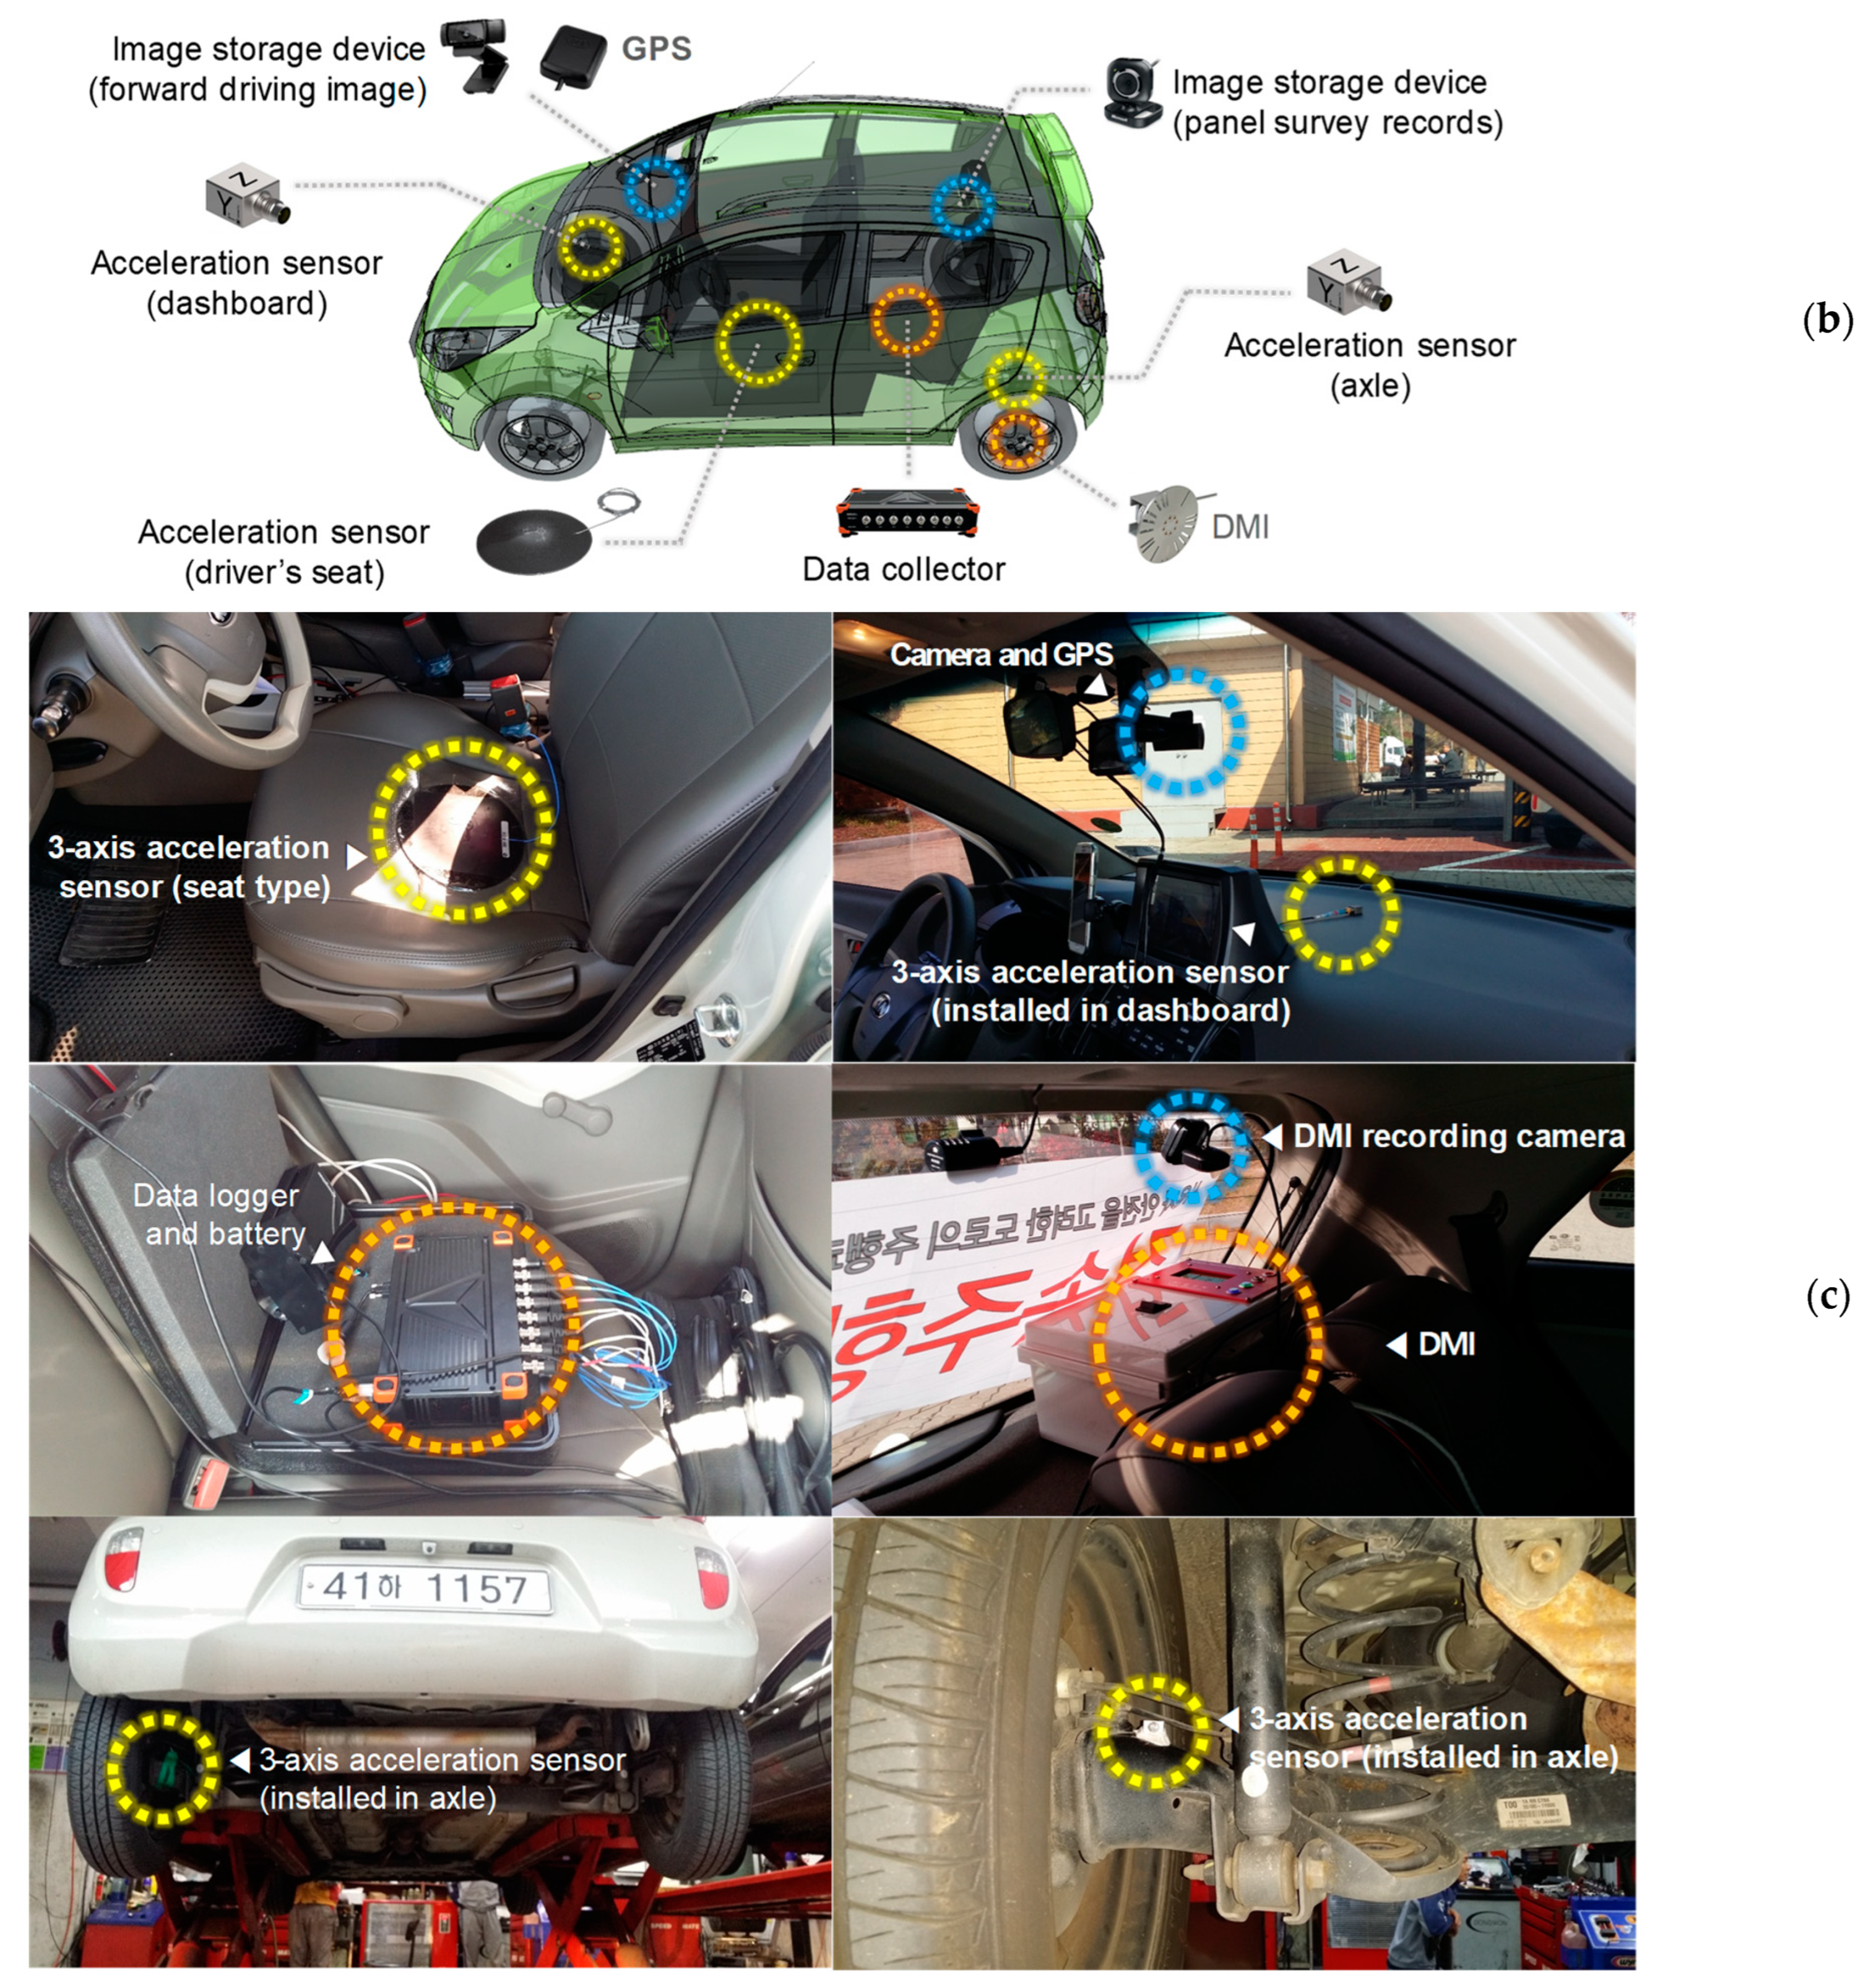
2.1. Selection of Test Section and Method

Test sections are selected among the sections that have reported a large number of public complaints related to lateral vibrations due to longitudinal texture over the last three years. Table 1 lists the selected sections for field investigation. The longitudinal texturing specification that is currently used by KEC is 3 × 3 × 19 mm (width × depth × center-to-center interval). 3 × 3 × 16 mm is a specification of pilot test for unhardened concrete developed to prevent lateral vibrations, whereas 4 × 4 × 14 mm (NGCS) has been developed to improve the diamond grinding method for hardened concrete. The 2 × 3 × 19 mm and 2 × 3 × 16 mm specifications were for the pilot test using a groove designed to reduce the lateral vibrations in the existing texturing method. 3 × 3 × Random is the longitudinal tinning, which many complaints were reported about.
It is difficult to review all vehicle types and tires in this study; therefore, a preliminary investigation was performed to select test vehicle types before evaluating the effects of tires. To select vehicles that generated the most amount of lateral vibrations, driving tests were performed in the Yeoju-Yangpyeong section with small, medium, and large vehicles, SUVs, vans, and freight vehicles. The test results showed that small vehicles generated the largest number of lateral vibrations, followed by medium vehicles and SUVs. To consider the tire parameter, tire products for small and medium vehicles and SUVs were examined, and the results showed that SUVs and medium vehicles had similar tire dimensions. However, SUVs showed advantages in dimensions and tire parameters over medium cars as their body size is larger and the large-sized tires can be installed. Therefore, small vehicles and SUVs were finally selected as the test vehicles. Table 2 summarizes the tire types selected for the driving tests.
Lateral vibrations were evaluated by a panel rating survey that determined whether passengers felt lateral vibration while the vehicle was driving on a longitudinal texturing section and by the degree of acceleration change at the time of lateral vibration using an acceleration sensor installed in the vehicle. First, the panel rating survey investigated the degree of discomfort felt by passengers in the vehicle; this was a subjective judgment of the passengers. It was conducted repeatedly for greater accuracy. Tarpinian and Lee also used panel rating results for the verification of measurements [11,16]. In this study, the grades were recorded in each section by classifying the number of times when lateral vibrations were felt by panel riding in the vehicle and the average degree of perceived lateral vibration on five levels from “none” to “very severe”.
Lateral vibrations constitute lateral force generated by the vehicle’s tires that is transmitted to passengers through the body frame. Hence, data were collected by installing an acceleration sensor in the seat. When the acceleration was measured, as shown in Figure 1a, the road roughness was mainly reflected in the Z-axis acceleration, and the changes in acceleration due to acceleration/deceleration were mainly reflected in the X-axis. Hence, it was presumed that lateral vibrations would be reflected in the Y-axis acceleration, which is perpendicular to the direction of vehicle movement. Therefore, the lateral vibration was quantified by correcting and filtering the Y-axis acceleration value excluding the sections where the Z- and X-axes were dominant among the three axes. To measure the lateral vibrations, an onboard data-collection system was installed, which used a three-axis acceleration sensor as shown in Figure 1b. The detailed installation of the sensors is shown in Figure 1c.
In this study, considering the abovementioned dominant behavior factor for each axis, the following two cases were established as the criteria for determining the lateral vibration of acceleration data:
  • Movement was determined as lateral vibration regardless of X- and Z-axis movement if that along the Y-axis was considerably larger.
  • Movement was determined as lateral vibration if the Y-axis movement was relatively large (though not as large as in 1), and the X- and Z-axis movements were not larger than that along the Y-axis.
In these two cases, there is no fixed value for the degree of “large”. Thus, it was calculated by changing the internal parameter in the logic of the program developed by the research team for counting lateral vibrations. The field investigation data were collected and the lateral vibration result of the acceleration data analysis was compared with the lateral vibration result of the panel rating survey. Then, the parameter value was estimated by changing it until the coefficient of determination (R2) was higher than 0.6, which is the statistically significant level.

2.2. Evaluation Result

Driving tests of vehicles were conducted for the longitudinal texturing sections listed in Table 3. For field investigation data analysis, the occurrence of lateral vibrations was checked every 1 m through the aforementioned process, and the total number of occurrences was divided by the total length to determine the occurrence rate in percent. The parameter was corrected until the occurrence rate reached a statistically significant level (R2 > 0.6) by comparing it with the occurrence rate calculated in the panel rating survey (number of occurrences/total length). As a result of applying the parameter for the determination of the lateral vibration tolerance to the total field investigation data, the R2 value was significant, as shown in Table 3. This confirmed that the parameter value for the lateral vibration tolerance was appropriately set.
Table 4 and Table 5 summarize the panel survey results and analysis results of acceleration data by longitudinal texture and tire type for all field investigation data. The result of the panel rating survey shows that participants reported a large number of lateral vibrations in sections with 3 × 3 × Random. Excluding the 3 × 3 × Random, the lateral vibration occurrence rate was the highest in 4 × 4 × 14 mm of the NGCS. This seems to be because the lateral vibration is also affected by the tinning width and depth. In other sections, the results of the panel rating survey were generally good, and the 3 × 3 × 16 mm and 2 × 3 × 19 mm showed the lowest occurrences of lateral vibrations. The result of acceleration analysis also showed that 3 × 3 × Random had the poorest result. The result of the 3 × 3 × 16 mm was slightly high, and the result of the NGCS was relatively low. This suggests that although the significance level of the parameter was higher than 0.6, it did not satisfy every condition.

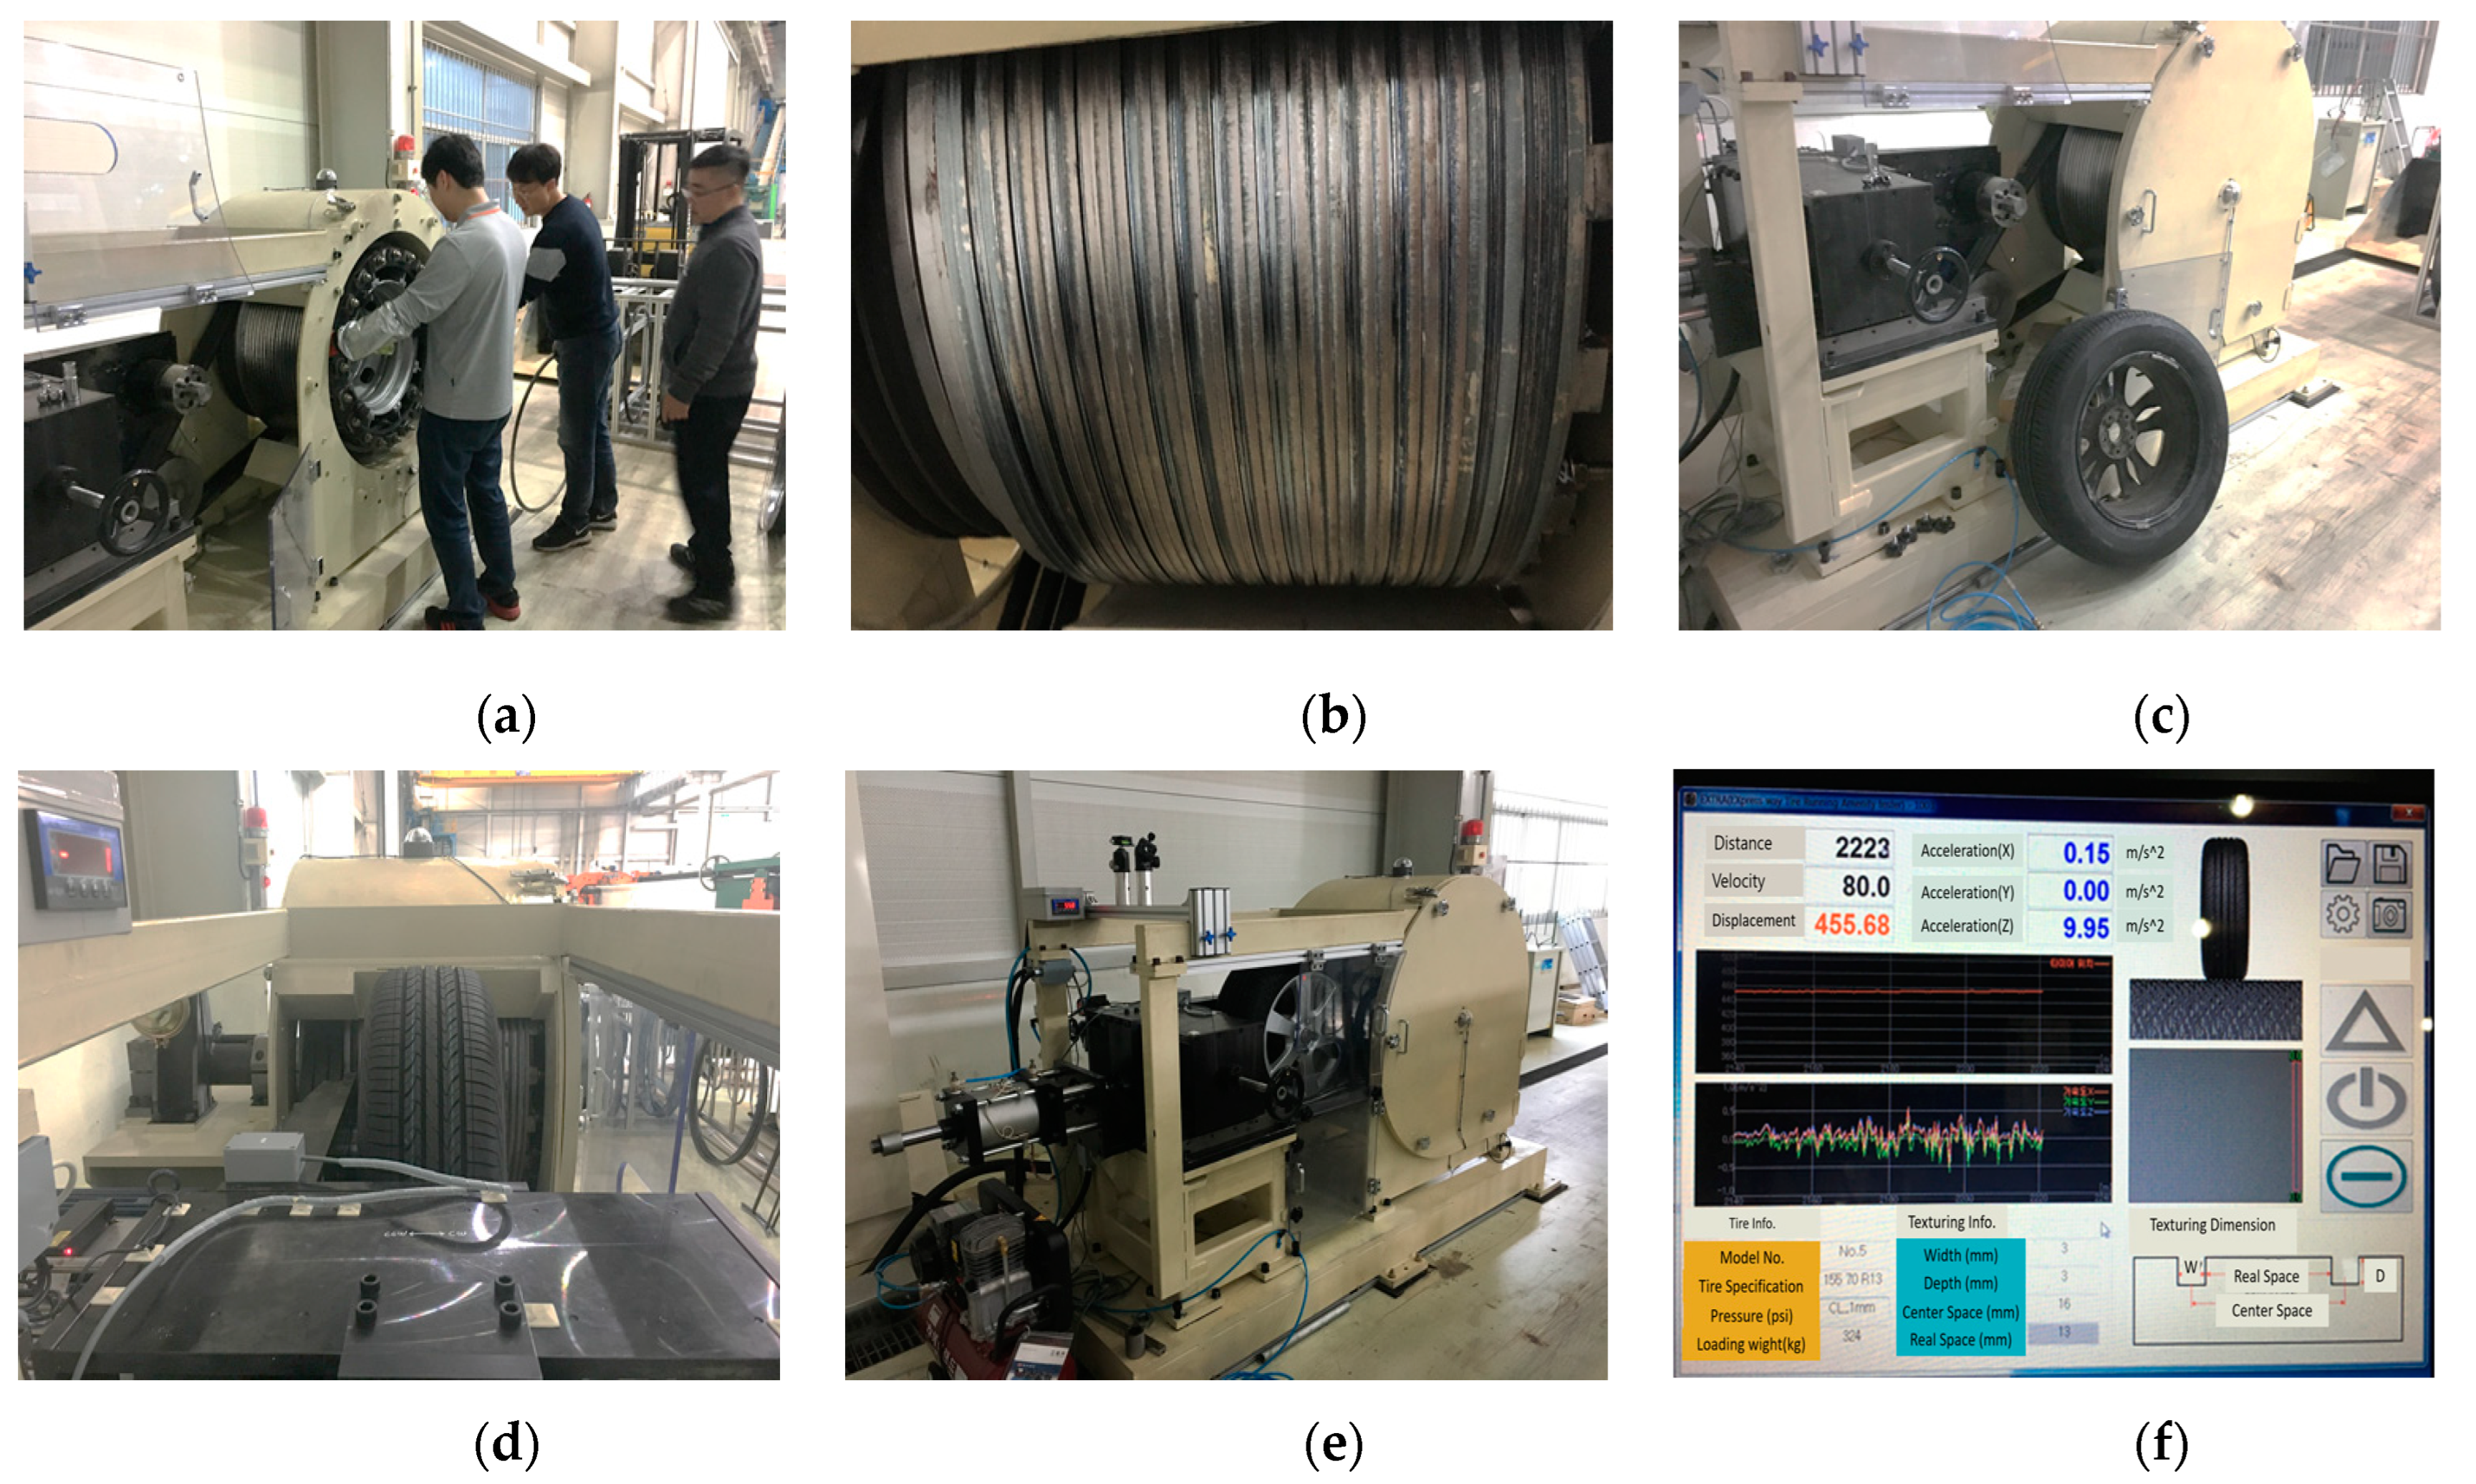
3. Driving Simulation Test

The driving simulation testing equipment has the advantage of enabling testing by combining tire and longitudinal texture as desired. This study used a self-manufactured and validated testing equipment, and the test process is shown in Figure 2. First, the longitudinal texturing specification to be tested was generated on the drum using steel rings. When the texture was generated, the tire to be tested was installed on the wheel. When the texture and tire installation was completed, the tire was moved to the initial position and the desired contact pressure was implemented. In this study, considering the vehicle type and the number of passengers, 2.96 KN was applied for 13-inch tires and 5.34 KN for 18-inch tires. Then, the vibrations and displacements of the tires were measured while the driving speed was maintained at 80 km/h and the tire was moved transversely in small increments.
The evaluation method of the testing equipment was as follows: data were measured in each step while moving by 1 mm units in the lateral direction as data was obtained after 500 m pre-driving. The test was completed after measuring a length twice the center-to-center interval of the longitudinal tinning or groove. The Min-Max value was determined for the displacement data collected from each step. If the value was larger than the criteria value, it was evaluated that there is a high probability of lateral vibration at that step. Because there was no displacement criteria value for determining lateral vibrations and this was a relative evaluation, this study determined 1 mm as the lateral vibration criteria. For example, because the center-to-center interval of the 3 × 3 × 19 mm was 19 mm, the test was conducted 38 times by moving the tire along the simulated texture up to 38 mm, which is twice the center-to-center interval. The Min-Max was calculated for each test data sample. In 18 cases where this value was larger than 1 mm, it was determined that the probability of lateral vibration was 18/38 × 100 = 46.2%. Tests were performed for 48 cases of test parameters in total, including the tire and longitudinal textures examined during the field investigation.
Table 6 shows the test results. First of all, the test results for each texture showed very clear patterns. For the tinning widths, 3 × 3 × 19 mm and 2 × 3 × 19 mm, 3 × 3 × 16 mm and 2 × 3 × 16 mm showed similar values. The order of lateral vibration of the center-to-center intervals was 3 × 3 × 16 mm < 3 × 3 × 19 mm < 3 × 3 × Random. The driving simulation test results showed that fewer lateral vibrations occurred with smaller center-to-center intervals. When the probability of lateral vibration was examined with respect to tires, small vehicles showed a better result than SUVs. By vehicle type, Tire1 among the small vehicle tires and Tire8 among the SUV tires showed higher possibilities of lateral vibration.

4. Finite Element Analysis

Finite element analysis was performed to verify the result of the field and driving simulation test. The finite element analysis of the lateral vibration for tires and longitudinal textures was performed by measurement of tire profile, preparation of tire sample cut, layout drawing, modeling of two-dimensional and three-dimensional, generation of concrete textures with grooves, and analysis for wheel load application. Using the modeled tires and textures, structural analysis was performed through the four-step process of rim fitting, inflation, relocation of road surface, and loading, as shown in Figure 3.
The result of the structural analysis was obtained by calculating the lateral reaction force (RF) generated from the tire through loading using Equation (1). The lateral RF result was obtained by conducting analysis while moving the tire in 1 mm increments in the lateral direction, applying the General Motors Uniform Test Standard (GMUTS) for each case, and indirectly comparing the lateral vibration level for each texture and tire type [17]. GMUTS is calculated using the Max-Min difference of the lateral force that causes lateral vibration and the standard deviation. A larger value of GMUTS indicates better driving performance with fewer lateral vibrations. The specific calculation process cannot be described in this work because the information is confidential and proprietary to General Motors. Thus, only the evaluation results are shown.
RF = Fm + Fs
  • Fm: A lateral force is generated by a moment caused by the vertical load when the tire block contacts the pavement texture. The lateral force may not occur symmetrically and a greater lateral force may occur in one direction depending on the specification of the tinning groove and the lateral shifting distance. Fm represents the total lateral forces caused by a moment.
  • Fs: When the tire contacts the pavement texture by load, a contact shear stress is generated depending on the specification of the tinning groove and the position of the tire. Fs denotes the total contact shear stress generated when the tire contacts the pavement texture.
Finite element analysis was performed for a total of 48 parameter combinations, including 8 tire types and 6 longitudinal texturing types, which are the same as in the field test. Figure 4 shows an example of the finite element analysis result for the 2 × 3 × 19 mm. The results of structural analysis are summarized in Table 7 by longitudinal texture specification and tire type. First of all, in the comparison by longitudinal texturing specification, the 2 × 3 × 19 mm showed the lowest probability of lateral vibration. The 2 × 3 × 16 mm and 3 × 3 × 16 mm also showed relatively low possibilities, while the 3 × 3 × Random showed the highest probability of lateral vibration. When the center-to-center interval was examined, the specifications in ascending order of probabilities were 3 × 3 × 16 mm < 3 × 3 × 19 mm < 3 × 3 × Random. Furthermore, the result for the surface with a 2 mm width was 2 × 3 × 16 mm < 2 × 3 × 19 mm. Thus, it is difficult to claim that fewer lateral vibrations occurred based on the center-to-center interval. However, it was found that the longitudinal texturing specification with the smallest lateral vibrations at the 3 mm width was 3 × 3 × 16 mm and that at the 2 mm width was 2 × 3 × 19 mm, relatively. Regarding the correlation of the longitudinal texturing specifications with the tire type, Tire2 showed the lowest probability of lateral vibration among the small vehicle tires as well as Tire7 among the SUV tires. In contrast, Tire3 showed the highest probability of lateral vibration among the small car tires, as did Tire8 among the SUV tires.

5. Proposal for Optimal Longitudinal Texturing Specification

The optimal specification for longitudinal texture for reduction of lateral vibrations was determined based on the field test, driving simulation test, and finite element analysis. Table 8 summarizes the test results. First, when using hardened concrete, the 2 × 3 × 19 mm showed higher performance than other specifications in all tests except the laboratory driving test. The 2 × 3 × 19 mm is excellent, but it is only applicable to hardened concrete. For unhardened concrete, 3 × 3 × 16 mm is proposed as the optimal longitudinal texturing specification because it showed excellent performance in the panel survey, finite element analysis, as well as the driving simulation test.

6. Conclusions

This study aimed to investigate the causes of lateral vibrations of vehicle driving over longitudinal texturing sections and develop an optimal longitudinal texturing specification to prevent lateral vibrations, an issue that has been reported intermittently on concrete pavement. To that end, the causes and evaluation methods for lateral vibration were established through an analysis of previous studies, laboratory and field tests, and finite element analysis. The major findings of this study are as follows:
  • In the field test, the panel rating survey and acceleration investigation were performed in parallel. This showed that many lateral vibrations occurred in the 3 × 3 × Random section. Among the longitudinal texture applied in unhardened concrete sections, 3 × 3 × 16 mm and 3 × 3 × 19 mm showed the best results in the panel survey and acceleration data, respectively. When grooving patterns were applied to hardened concrete, the 2 × 3 × 19 mm showed higher performance than other specifications in all tests. It was found that the NGCS specifications require further improvement in the future.
  • As a result of the driving simulation test, it was analyzed that the occurrence of lateral vibration was less on the 2 × 3 × 16 mm and the 3 × 3 × 16 mm. It was found that it was clearly unfavorable to have lateral vibration in the 3 × 3 × Random section. There was no significant difference in the tinning width, but it was evaluated that a section with a 2 mm tinning width was a little advantageous for lateral vibration.
  • As a result of finite element analysis, it was found that 3 × 3 × 16 mm in the case of a 3 mm tinning width and 2 × 3 × 19 mm in the case of 2 mm are most advantageous for lateral vibration. Overall, it was evaluated that the narrower the tinning width, the less the lateral vibration. It was found that the possibility of lateral vibration was high on the specifications with a wide center-to-center interval and on the random.
As the result of reviewing the optimal longitudinal texturing specification based on the field test, finite element analysis, and driving simulation test, 3 × 3 × 16 mm and 2 × 3 × 19 mm were found to be the most effective in reducing lateral vibration. In the future, the authors intend to improve the longitudinal texture and grooving intervals applied to pavement construction based on the findings of this study. In addition, the NGCS interval used for long-life and high-performance surfaces will be also improved through test application and evaluations with various specifications.

Author Contributions

Conceptualization, J.K.; Investigation, S.B.; Supervision, D.S.; Writing—original draft, S.R.; Writing—review & editing, J.K. All authors have read and agreed to the published version of the manuscript.

Funding

In-site quality management system of pavement using IoT technologies (Project ID: 19 POQW-B152690-01) funded by the Ministry of Land, Infrastructure, and Transport and the Korea Agency for Infrastructure Technology Advancement since 2019.

Institutional Review Board Statement

Not applicable.

Informed Consent Statement

Not applicable.

Conflicts of Interest

The authors declare no conflict of interest.

References

  1. Korea Expressway Corporation. Plan for Efficient Pavement Management; Korea Expressway Corporation: Gimcheon-si, Korea, 2006. [Google Scholar]
  2. Korea Expressway Corporation. Method to Reduce Noise on Concrete Pavement; Korea Expressway Corporation: Gimcheon-si, Korea, 2008. [Google Scholar]
  3. Korea Expressway Corporation. Expressway Construction Guide Specification; Korea Expressway Corporation: Gimcheon-si, Korea, 2012. [Google Scholar]
  4. Korea Expressway Corporation. Analysis of Causes of Lateral Vibration on Longitudinal Tinning Section; Korea Expressway Corporation: Gimcheon-si, Korea, 2011. [Google Scholar]
  5. Korea Expressway Corporation. Measure to Improve Lateral Vibration in The Longitudinal Tinning Section of Expressway Concrete Pavement; Korea Expressway Corporation: Gimcheon-si, Korea, 2016. [Google Scholar]
  6. Kang, S.J.; Jung, K.M.; Kim, K.H. The Effect of Tire Tread Pattern and Road Designs on Groove Wander. In Proceedings of the Annual Autumn Conference and Exhibition, Korea, 24–27 November 2010. [Google Scholar]
  7. Korea Expressway Corporation. Guidelines for Design and Construction of Joint Concrete Pavement in Tunnels; Korea Expressway Corporation: Gimcheon-si, Korea, 2014. [Google Scholar]
  8. Caltrans Division of Maintenance. Diamond Grinding and Grooving. In Maintenance Technical Advisory Guide-Rigid Pavement Preservation, 2nd ed.; State of California Department of Transportation: Sacramento, CA, USA, 2007; Volume II, pp. 5-1–5-23. [Google Scholar]
  9. Han, J.H.; Hwang, S.W.; Kang, Y.G.; Han, M.H. The Study on the Characteristics of Groove Wandering and Noise Caused by the Design Parameter of Longitudinal Groove on the Tire’s Pattern. J. Korean Soc. Manuf. Process Eng. 2011, 10, 110–116. [Google Scholar]
  10. Peters, J.M. Application of the Lateral Stress Theory for Groove Wander Prediction Using Finite Element Analysis. Tire Sci. Technol. 2001, 29, 244–257. [Google Scholar] [CrossRef]
  11. Tarpinian, H.D.; Culp, E.H. The Effect of Pavement Grooves on the Ride of Passenger Cars—The Role of Tires. SAE Trans. 1977, 86, 2977–2985. [Google Scholar]
  12. Yukio, N. Prediction of Rain Groove Wandering. Vehicle System Dynamics. Int. J. Veh. Mech. Mobil. 2010, 40, 401–418. [Google Scholar]
  13. Doi, T.; Ikeda, K. Effect of Tire Tread Pattern on Groove Wander of Motorcycles. Tire Sci. Technol. 1985, 13, 147–153. [Google Scholar] [CrossRef]
  14. Oblizajek, K.L.; Lauer, N. A Laboratory Procedure for Evaluation and Diagnosis of the Interaction of Tires with Longitudinally Grooved Pavements; SAE Technical Paper Series No. 840070; SAE International: Warrendale, PA, USA, 1984. [Google Scholar]
  15. Robert, V.R.; Michael, A.M. Lateral Vehicle Acceleration due to Longitudinally Tined Portland Cement Concrete Pavement; CDOT-2009-13 Technical Report; Colorado Department of Transportation: Denver, CO, USA, 2019.
  16. Lee, D.H.; Kim, J.W.; Moon, S.H.; Jeong, W.S. Study about the Evaluation of Driving Stability Using 3-axis Accelerometer Test. J. Korean Soc. Road Eng. 2012, 14, 141–149. [Google Scholar] [CrossRef]
  17. Jeong, K.M.; Kang, S.J.; Kim, H.S.; Kim, K.W. Finite Element Analysis for Groove Wander Prediction of Passenger Car Tires with the Longitudinal Tread Grooves. J. Eng. 2016, 8, 11–20. [Google Scholar] [CrossRef] [Green Version]
Figure 1. Evaluation system for lateral vibration. (a) Acceleration data collection direction. (b) Data-collection system. (c) Mounting of sensors.
Applsci 12 09661 g001aApplsci 12 09661 g001b
Figure 2. The procedure of the driving simulation test. (a) Install surface ring. (b) Complete texture. (c) Install the tire. (d) Move tire to the initial position. (e) Driving test and measurement. (f) Measurement result monitoring.
Applsci 12 09661 g002
Figure 3. Steps of finite element analysis for tire-surface. (a) Rim Fitting. (b) Inflation. (c) Relocation of Road Surface. (d) Loading.
Applsci 12 09661 g003
Figure 4. Result of finite element analysis for the 2 × 3 × 19 mm.
Applsci 12 09661 g004
Table 1. Sections selected for field investigation.
Texturing Specification
(mm)
ExpresswaySectionLength
(m)
Remarks
Applied Time
(Before/After Concrete Hardening)
Others
3 × 3 × 19DonghaeSokcho-Yangyang1200Before hardeningKEC standard section
3 × 3 × 16Dangjin-YeongdeokTest 2-2930Before hardeningTest section
4 × 4 × 14
(NGCS)
Pyeongtaek-JecheonGeumseong Tunnel4445After hardeningComplaints raised
Dangjin-YeongdeokSailsan Tunnel2562
Seoul-YangyangHwacheon 9 Tunnel3705
Seoseok Tunnel3061
Girin 6 Tunnel2665
Inje-Yangyang Tunnel10,962
GyeongbuEonyang-Yeongcheon4400
Busan OutskirtsBusan Outskirts1400
2 × 3 × 19Dangjin-YeongdeokTest 1940After hardeningTest section
2 × 3 × 16Dangjin-YeongdeokTest 2-1940After hardeningTest section
3 × 3 × RandomCentral InlandYeoju-Yangpyeong1000Before hardeningComplaints raised
Table 2. Tire dimensions selected for driving simulation test.
NameSpecificationWheel SizeTest
Vehicles
Manufacture
Company
Tread Profile
Tire1155/80 R1313 inchesSmallAApplsci 12 09661 i001
Tire2155/65 R13BApplsci 12 09661 i002
Tire3155/70 R13BApplsci 12 09661 i003
Tire4155/70 R13CApplsci 12 09661 i004
Tire5155/70 R13CApplsci 12 09661 i005
Tire6235/60 R1818 inchesSUVAApplsci 12 09661 i006
Tire7235/60 R18BApplsci 12 09661 i007
Tire8235/60 R18CApplsci 12 09661 i008
Table 3. Total field investigation sections and data statistics.
Texturing Specification
(mm)
ExpresswaySectionNumber of DataResult of Applying the Lateral Vibration Tolerance
3 × 3 × 19DonghaeSokcho-Yangyang22Applsci 12 09661 i009
3 × 3 × 16Dangjin-YeongdeokTest 2-236
4 × 4 × 14
(NGCS)
Pyeongtaek-JecheonGeumseong Tunnel71
Dangjin-YeongdeokSailsan Tunnel76
Seoul-YangyangHwacheon 9 Tunnel4
Seoseok Tunnel4
Girin 6 Tunnel4
Inje-Yangyang Tunnel24
Gyeongbu LineEonyang-Yeongcheon4
Busan OutskirtsBusan Outskirts12
2 × 3 × 19Dangjin-YeongdeokTest 136
2 × 3 × 16Dangjin-YeongdeokTest 2-136
3 × 3 × RandomCentral InlandYeoju-Yangpyeong70
Total399
Table 4. Lateral vibration occurrence rate (panel rating survey).
ClassificationTexturing Specifications
3 × 3 × 193 × 3 × 164 × 4 × 142 × 3 × 192 × 3 × 163 × 3 × RAverage
Tire typeTire10.0000.0130.0660.0000.0000.2730.352
Tire20.0000.0000.1220.0000.0180.1640.304
Tire30.0000.0170.1090.0070.0080.1720.313
Tire40.0000.0000.2870.0000.0000.1410.428
Tire50.0000.0000.0700.0290.0370.4960.632
Tire60.0000.0000.0430.0000.0000.0000.043
Tire70.0000.0000.2100.0000.0000.1150.325
Tire80.0410.0000.1780.0000.0760.0260.321
Average0.0070.0040.1360.0040.0170.173
Table 5. Lateral vibration occurrence rate (acceleration result).
ClassificationTexturing Specifications
3 × 3 × 193 × 3 × 164 × 4 × 142 × 3 × 192 × 3 × 163 × 3 × RAverage
Tire typeTire10.0040.0430.0630.0790.0430.2220.454
Tire20.0080.0620.0530.0320.0450.1350.335
Tire30.0160.0240.0530.0140.0220.2350.364
Tire40.0110.0670.1770.0210.0530.1430.472
Tire50.0460.0960.0320.0290.0400.1670.410
Tire60.0280.1640.0410.0640.0380.0750.410
Tire70.0120.2030.1720.0330.0700.1580.648
Tire80.0830.1890.0790.0470.0510.1060.555
Average0.0320.1060.0840.0400.0450.155
Table 6. The evaluation result of the driving simulation test.
ClassificationTexturing Specifications
3 × 3 × 193 × 3 × 164 × 4 × 142 × 3 × 192 × 3 × 163 × 3 × RAverage
Tire typeTire146.224.248.343.612.183.240.8
Tire243.621.237.933.312.182.435.5
Tire343.615.234.541.012.182.833.8
Tire451.327.324.138.512.182.835.4
Tire548.727.334.541.012.182.435.2
Tire646.218.248.351.324.283.643.6
Tire743.621.248.356.430.387.444.8
Tire843.651.544.853.824.284.547.7
Average45.825.840.144.917.483.6
Table 7. Result of finite element analysis.
ClassificationTexturing Specifications
3 × 3 × 193 × 3 × 164 × 4 × 142 × 3 × 192 × 3 × 163 × 3 × RAverage
Tire typeTire123.025.815.47.810.418.016.73
Tire213.08.49.215.614.411.712.05
Tire334.48.433.812.019.820.821.53
Tire410.010.418.612.82.820.712.55
Tire521.822.412.69.014.426.317.75
Tire68.417.021.46.211.621.114.28
Tire725.08.215.26.84.223.713.85
Tire812.425.412.28.611.617.414.60
Average18.515.817.39.911.220.0
Table 8. Test results of longitudinal texturing specification.
Surface
Specification
Panel Survey
(Occurrence Rate, %)
Acceleration Data
(Occurrence Rate, %)
Structural Analysis
(Max Range)
Laboratory
Driving Test
(Probability, %)
Applied Time
(Before/After Concrete Hardening)
3 × 3 × 190.007 (1)0.032 (1)18.545.8Before hardening
3 × 3 × 160.004 (2)0.10615.8 (3)25.8 (3)Before hardening
4 × 4 × 140.1360.08417.340.1 (2)After hardening
2 × 3 × 190.004 (2)0.040 (2)9.9 (1)44.9After hardening
2 × 3 × 160.0170.045 (3)11.2 (2)17.4 (1)After hardening
3 × 3 × Random0.1730.15520.083.6Before hardening
Publisher’s Note: MDPI stays neutral with regard to jurisdictional claims in published maps and institutional affiliations.

