Article

A Feasibility Study for the Prediction of Concrete Pavement Condition Index (CPCI) Based on Machine Learning

1
Department of Structural Engineering Research, Korea Institute of Civil Engineering and Building Technology, Goyang-daero 283, Ilsanseo-gu, Goyang-si 10223, Gyeonggi-do, Korea
2
Department of Highway & Transportation Research, Korea Institute of Civil Engineering and Building Technology, Goyang-daero 283, Ilsanseo-gu, Goyang-si 10223, Gyeonggi-do, Korea
3
Department of Integrated Road Management Research Cluster, Korea Institute of Civil Engineering and Building Technology, Goyang-daero 283, Ilsanseo-gu, Goyang-si 10223, Gyeonggi-do, Korea
*
Author to whom correspondence should be addressed.
Appl. Sci. 2022, 12(17), 8731; https://doi.org/10.3390/app12178731
Submission received: 22 July 2022 / Revised: 27 August 2022 / Accepted: 29 August 2022 / Published: 31 August 2022
(This article belongs to the Special Issue Fatigue, Performance, and Damage Assessment of Concrete)

Abstract

:
In South Korea, various attempts have been made to utilize the Pavement Management System database (PMS DB) more efficiently as a basis for preventive maintenance. Data for the PMS DB is extensively collected every year. This study aims to predict future pavement conditions by introducing the concept of machine learning instead of regression modeling. We selected 469 sections that satisfied the analysis conditions and used them for analysis. We used particle filtering, a machine learning technique, to predict future pavement conditions. We found that the function of the particle filtering technique itself increases the prediction accuracy for the target section analyzed as the number of particles increases. Furthermore, the number of time series points in one section had a higher impact on the improvement of prediction accuracy than the number of sections analyzed. Finally, the relative error by each predicted age for the same section decreased as the number of time series points increased. These findings indicate that the rate of decrease in the performance index can be quantitatively presented in the future, and the method developed in this study could be used by pavement managers during the decision-making process.

1. Introduction

Roadways in South Korea are generally classified into seven types: express highways, national highways, special metropolitan city roads, local highways, city roadways, county roadways, and district roadways. In particular, express highways and national highways play a fundamental role in the economy and transportation of South Korea. As of 2021, while express highways only account for 4865 km (4.3%) and national highways for 14,174 km (12.5%) of the 113,404 km of total roadways, their repair costs account for 39.1% of the total [1]. Analyzing the quantity and cost of each management method for road pavement revealed that the increase in the amount of overlay and reconstruction methods was the largest compared to that in 2013 [1], and the proportion of the cost for the two methods to the total cost increased from 67.4% to 77.7%, suggesting an increase in the importance of managing aged pavement.
The earnest construction of concrete pavements in South Korea started in the 1980s. As of 2020, approximately 12,956 km of lanes are in operation as express highways and national highways, and among them, 2528 km have exceeded the design lifespan of 20 years and are classified as aged concrete pavement subject to intensive management [2]. Recently, with the rapid increase in lifespan-exceeding sections with reduced structural and functional performance due to the aging of the concrete pavement, the inconvenience of road users caused by the maintenance of old sections is also increasing. Rather than the current application of partial depth repair, the need for a method to develop roads that perform as newly constructed roads, including full road rehabilitation, and the need for preventive maintenance are gradually increasing [3].
Therefore, most concrete pavements have been systematically managed through the pavement management system (PMS) since 2006. To understand the pavement condition at the network level of policy makers and road managers and to determine the repair method, the highway pavement condition index and the national highway pavement condition index have been established and operated for express highways and national highways, respectively. In particular, as the necessity and effectiveness of management through PMS have been proven recently, both express highways and national highways are being investigated annually as of 2021.
However, in the operation of the current PMS of express highways and national highways in South Korea, the investigation results of the current year are generally reported after March of the following year. Accordingly, using the results as the basis for preventive maintenance to efficiently operate the pavement condition and budget has a practical limit. In addition, the PMS, where a database for a vast network is built every year, is mostly operated for managing the current pavement status. Thus, policy decisions such as preventive maintenance and budget requirements for future pavement conditions are still being made based on the subjective judgment of experts.
Because most research related to the prediction for pavement management thus far has mostly been based on the regression modeling technique, which is used for decision-making at the network level rather than at the project level, modeling that satisfies all cases has been impossible. When establishing the pavement rehabilitation strategy, using an inaccurate result value as the public state expression for the corresponding section affects only the relevant section under the management at the network level; however, there is also an evident limitation that it is difficult to use under the management at the project level. Therefore, this study attempted to develop a predictive model for a data learning-based performance index that can be used at both the network and project levels for concrete pavements in South Korea. Our aim is to allow more effective road pavement management by identifying the rate of decline in the quantitative performance using the current condition index.

2. Literature Review

2.1. Research on Predictive Model Development Using Pavement Performance Database

Road pavement is one of the most easily and frequently encountered infrastructures in modern society, and the budget for managing its vast extension at a satisfactory level for users has always been insufficient. As one of the efforts for more effective and long-term systematic management, several revisions have been made to secure and predict pavement performance since the 1959 American Association of State Highway Officials (AASHO) road test in the United States.
Several Departments of Transportation in the United States have attempted to identify the functional and structural status of road pavements and help with the decision-making of maintenance at the network level through the pavement condition rating (PCR) index, developed based on a mechanistic-empirical design in the 1970s–1980s [4]. PCR was constructed using time series data collected over two years, and the R2 value of the final regression equation was derived in the range of 0.70–0.76. As a result of managing road pavement in the United States using PCR, a slow deterioration rate was observed in the initial life section, suggesting that the deterioration rate would increase rapidly after 15 years, resulting in higher maintenance costs.
As the use of PCR began in earnest, the importance of a performance prediction model increased in PMS, and it started being considered essential for technical and economic management at the network and project levels. In particular, carefully determining the optimal decision-making and management strategy application timing was necessary as the prediction results for road pavement performance may lead to astronomical costs. As a result of more detailed classification of factors affecting the deterioration of the pavement condition index compared to PCR, non-linear regression modeling could be performed using the distress index, structural index, and roughness index as variables [5]. In particular, an index that considered both the new and rehabilitated pavements was developed.
In the 2000s, along with the rapid development of computing technology and the Internet of Things, especially the development of road pavement condition survey equipment linked with the geographic information system (GIS) and the global positioning system (GPS), predictive models were developed using more extensive and complex data research. With increased computing speed, predictive models that could consider several cases began to be developed. Among them, Markovian prediction was one of the methods employed to predict the degree of deterioration of the pavement that could be used for decision-making on future management or rehabilitation [6]. In addition, GIS and GPS have been linked to the existing ARAN equipment, and future pavement management methods using imaging, scanning, and automatic interpretation technologies and the development direction of the mobile mapping system (MMS) have been suggested [7].
Since approximately 10 years ago, various studies using a sizable database covering all factors affecting pavement other than road pavement have been conducted for more systematic management of the ever-growing amount of pavement. In addition to distress, roughness, and structural number (SN), which are representative variables used for road pavement management thus far, the amount of change in the pavement condition index has been analyzed by introducing the concept of change amount for each element [8]. In addition to the management aspect of road pavement, management measures, including road user safety, have been proposed [9], and skid variables other than distress, roughness, and SN have been added. Furthermore, unlike the generally applied regression modeling, the condition index was created by linking the analytical hierarchy process, an expert questionnaire method, and regression modeling based on the road photos and analysis results collected through the MMS equipment [10].

2.2. Infrastructure Management Related Database Based on Machine/Deep Learning Research

As in Section 2.1 above, most of the studies related to the performance prediction of road pavements used regression. Recently, artificial intelligence (AI) techniques for detecting defects (especially cracks) based on road surface photographs collected through MMS equipment have been introduced. Representative studies include crack detection using deep learning techniques such as convolutional neural network (CNN) and “You Only Look Once (YOLO)” [11], future flatness prediction using the support vector machine model [12], and auto porthole detection using CNN [13]. There are cases of research using various image-based AI technologies such as fuzzy C-means, holistically nested edge detection, multi-layer perception, random forest classifier, support vector classifier, recurrent neural network (RNN), histogram of oriented gradients (HOG), and grayscale-weighted HOG [14,15,16,17,18,19,20,21,22]. Image-based research is also essential for automatic analysis processing; however, there were few cases of introducing the AI method for predicting the road pavement condition index used in decision-making.
As a result of examining the representative research cases where the AI technique was applied to other facilities, the majority of studies were found to focus on bridges as target facilities. First, since the 1970s, various studies have been conducted to develop a bridge performance prediction model using condition rating data from the national bridge inventory in the United States, primarily using the classification and regression tree and Monte Carlo simulation techniques [23,24].
In the 2000s, studies were conducted to predict the future performance and remaining life of bridges using the artificial neural network technique [25,26,27]. Furthermore, research on building a life cycle prediction model for a bridge using the long short-term memory (LSTM) algorithm based on bridge inspection history data on national roads has been conducted [28]. LSTM is an updated algorithm of RNN, compensating for the shortcomings of RNN with a long-term dependency problem that makes it challenging to preserve past data.
However, as a type of AI machine learning technique, studies using the particle filtering technique, which can be applied to bridges or road pavements that change state in time series, have been conducted [29,30,31]. Particle filtering is a technique applicable when predicting non-linear and non-Gaussian distributions, which is known to be applied even when the information on the initial distribution is relatively unclear compared to the existing Bayesian method [32,33]. Accordingly, this study intends to predict the pavement condition index through data-based research, not image-based research.
Based on studies in which AI techniques have been applied to various road infrastructures thus far, we used particle filtering, a machine learning technique, in this study. The purpose and application scope of particle filtering have been discussed in Section 3.

3. Methodology

As mentioned in Section 2.2, particle filtering is a type of particle-based Kalman filter and can be applied to a predictive model with high nonlinearity. In addition, particle filtering is known as an advanced technique for supplementing the prediction accuracy of the Bayesian method. In particular, considering the characteristics of particle filtering based on Bayesian probability theory, model variables with high probability are resampled with weights, and model variables with low probability are relatively resampled through an update process that reflects the actual measured data. In other words, the variables with higher probability among the model variables are resampled through the update process, and accordingly, the prediction accuracy is improved for the target data (or model) with higher reliability of the measured data. Due to these characteristics, the particle filtering technique is also called “Sequential Monte Carlo” [33].
In this study, the regression analysis parameters, “a” and “b”, as states, were used in the “augmented particle filter” [30,31,32]. Furthermore, in our problem, all equations were prepared based on a previous study [33]. Based on the concrete pavement condition index (CPCI), which is one of the various condition indices of concrete pavement, the following equations were established as the first step to utilize particle filtering:
C P C I k = C P C I k 1 + a k t + b k ,
a k + 1 = a k + w a k ,
b k + 1 = b k + w b k ,
y k = C P C I k m e a s u r e d C P C I k ~ C P C I 0 , σ C P C I 2 .
In Equations (1) to (4), a k and b k are regression coefficients. In this study, “a” and “b” are uniform distributions, set in the range considering (a) the slope of the regression analysis of the actual detection data and (b) the uncertainty of the initial CPCI. w a k and w b k are white noise vectors of a Gaussian distribution with a mean of 0. In addition, C P C I k represents the future CPCI and is set as an objective function of k corresponding to a time variable. t denotes the age of concrete pavement, and C P C I k m e a s u r e d denotes the measured CPCI. Therefore, y k is a concrete pavement condition exponential function, which can be expressed as C P C I 0 , σ C P C I 2 . Consequently, the relative likelihood can be expressed as Equation (5). The relative likelihood is given as follows [33]:
q = P C P C I k m e a s u r e d C P C I k ~ 1 2 π σ C P C I e x p 1 2 C P C I k m e a s u r e d C P C I k σ C P C I 2 ,
So far, no case has been found regarding the quantitative error rate that occurs during PMS pavement surface scanning image analysis. Therefore, 5–10% of the error rate that is commonly recognized in the PMS field of Korea was used as a measure of data validity for the application of particle filter; thus, σ C P C I was assumed to be 0.1 (10%). In addition, the relative likelihood can be normalized as expressed in Equation (6).
q i = q i j = 1 N q j .
In Equation (6), N denotes the number of particles, indicating that the sum of the relative likelihoods equals 1. New particles can be calculated based on the relative likelihoods q i . This procedure can be performed using several different methods. In this study, we applied [34]. To prevent the situation where the initial CPCI is biased toward a specific distribution, a random number (r) was set to a uniform probability distribution between 0 and 1.
i = 1 j 1 q i < r i = 1 j q i .
Through the process of Equation (7), a j and b j can be reselected. q denotes the measurement data. At this time, the probability value increases as the CPCI approaches the mean, and the probability decreases toward the tail of the normal distribution. In other words, using this procedure allows the reproduction of data with a high probability value in the normal distribution, and these data are preferentially selected. Conversely, data with low probability are gradually removed. Further, old particles are replaced with new ones in the next step (N times repetition). Figure 1 shows an intuitive conceptual explanation for this.
As shown in Figure 1, it can be verified that the particle filtering technique used in this study has a completely different algorithm from the general regression modeling. Therefore, although direct comparison between the two techniques can help understand this study in certain aspects, this study rather focuses on the prediction of the index itself. Hence, regression modeling is not covered in this study because of the distinction between the two techniques, where regression modeling focuses on the correlation between independent variables.

4. Prediction of Concrete Pavement Performance Based on Particle Filtering

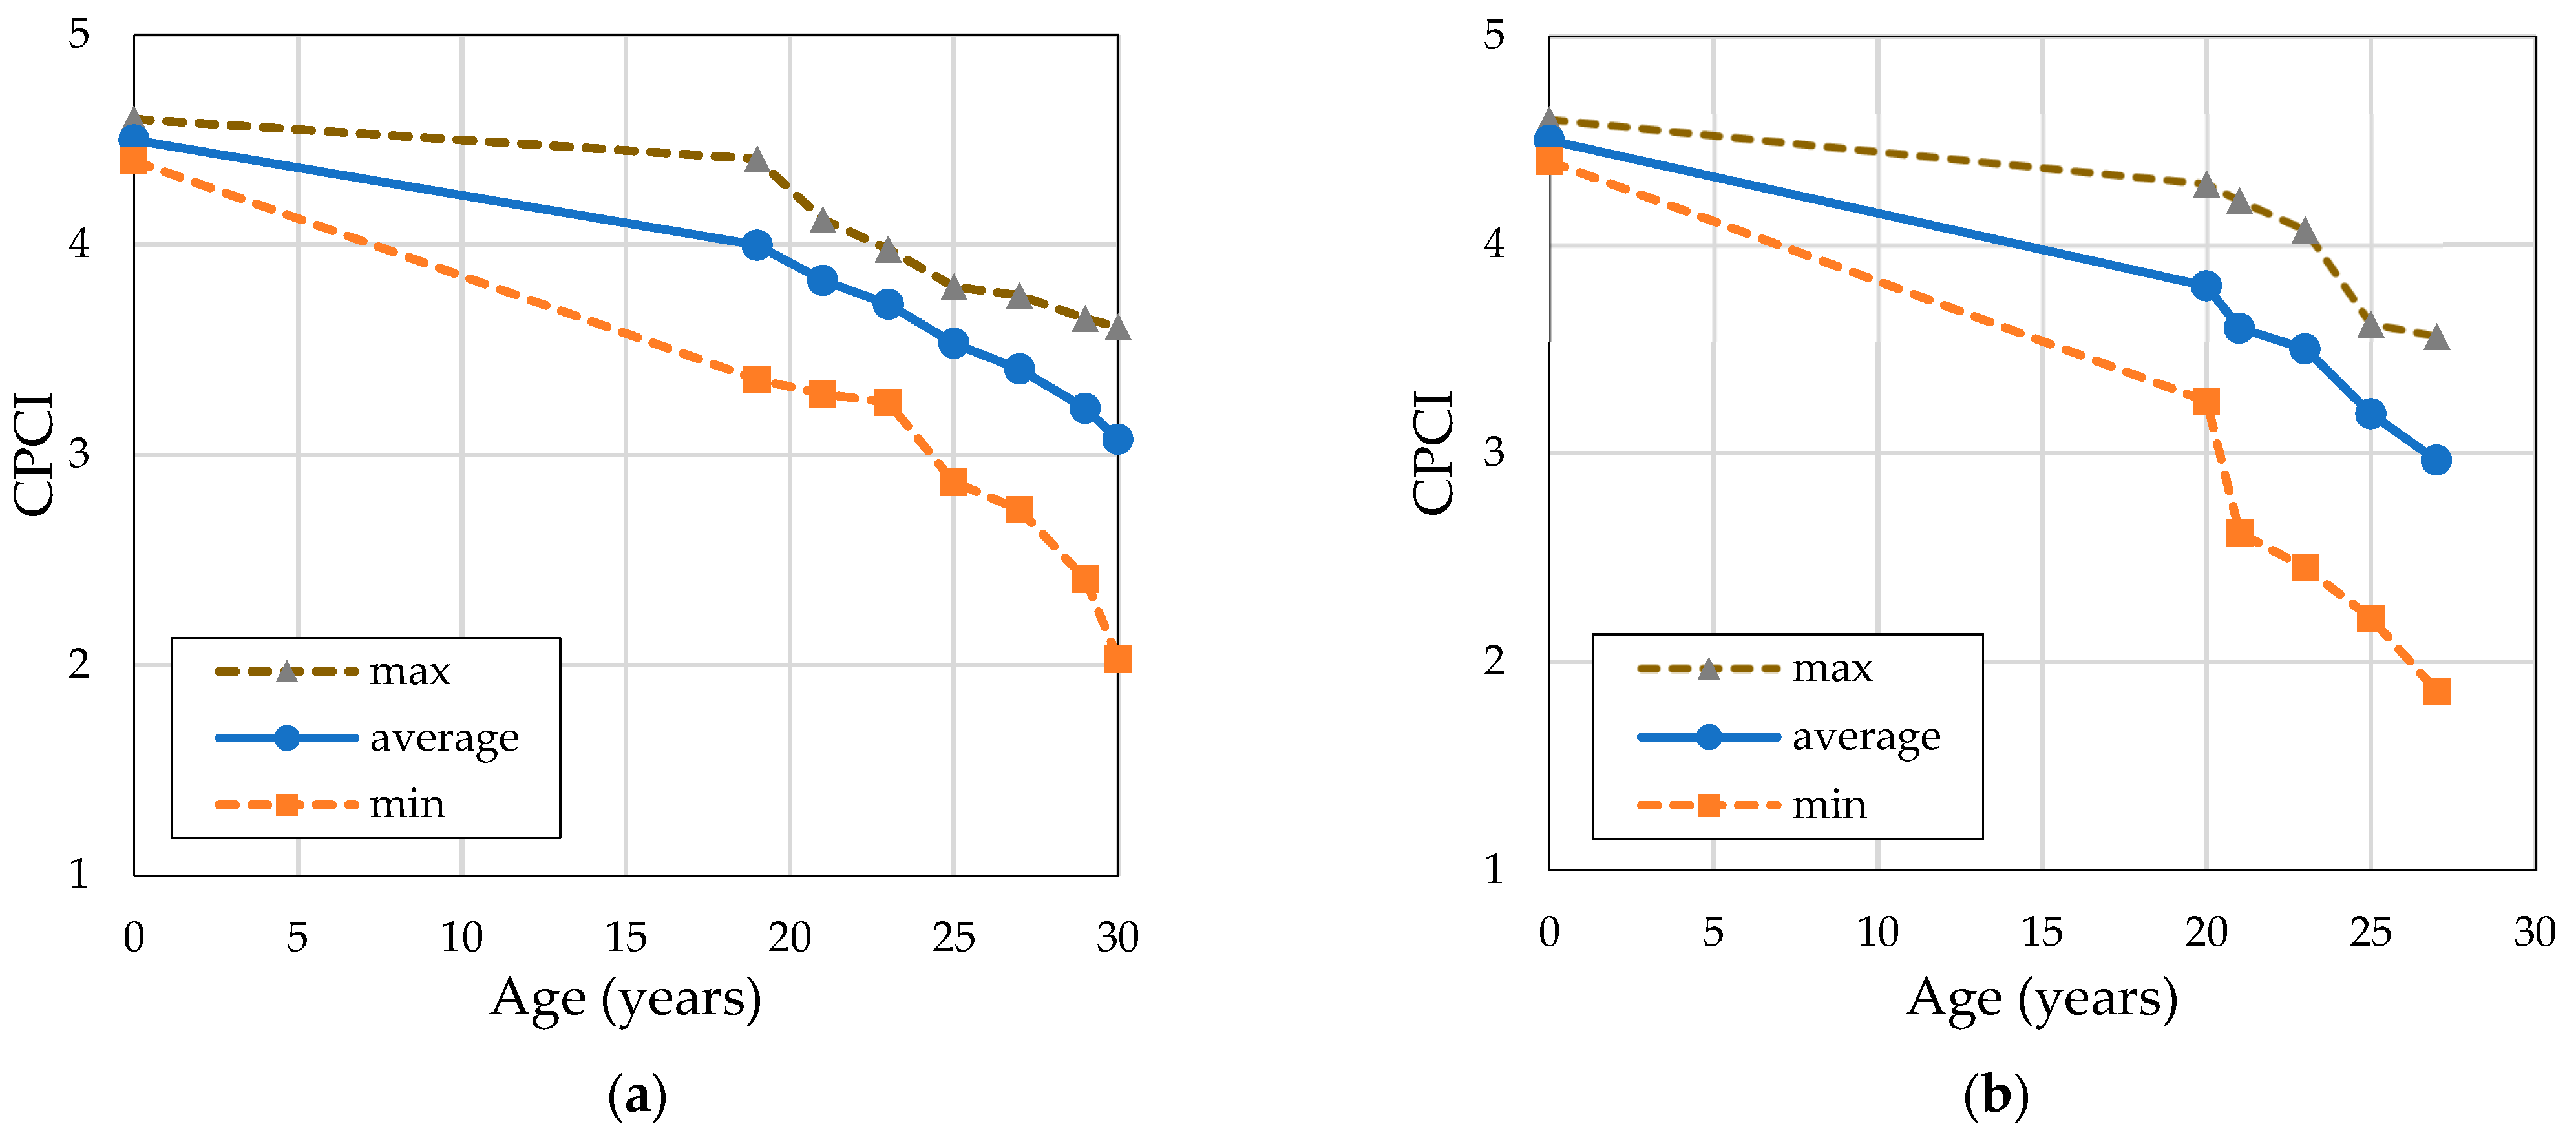
4.1. Data Preparation

The CPCI data used in this study were collected from the PMS DB in South Korea. The CPCI includes a function of the amount of surface distress and the international roughness index (IRI), as shown in Equation (8).
CPCI = f(SD,IRI)
The 10 m-unit section of this data included the contents of roads, routes, lanes, starting and ending points, flatness (IRI), surface distress, and CPCI. The data were collected every two years (Table 1).
In particular, to maximize the effect of this study on concrete pavements in South Korea designed and constructed with a design life of 20 years, we attempted to establish a dataset for the sections where PMS was used in earnest, pavement performance changed rapidly, and rehabilitation was applied. Therefore, we used the data from the roadways of 19 to 30 years of age from the time of construction and derived the approximate distribution of the dataset by the number of time series points collected, as shown in Figure 2.

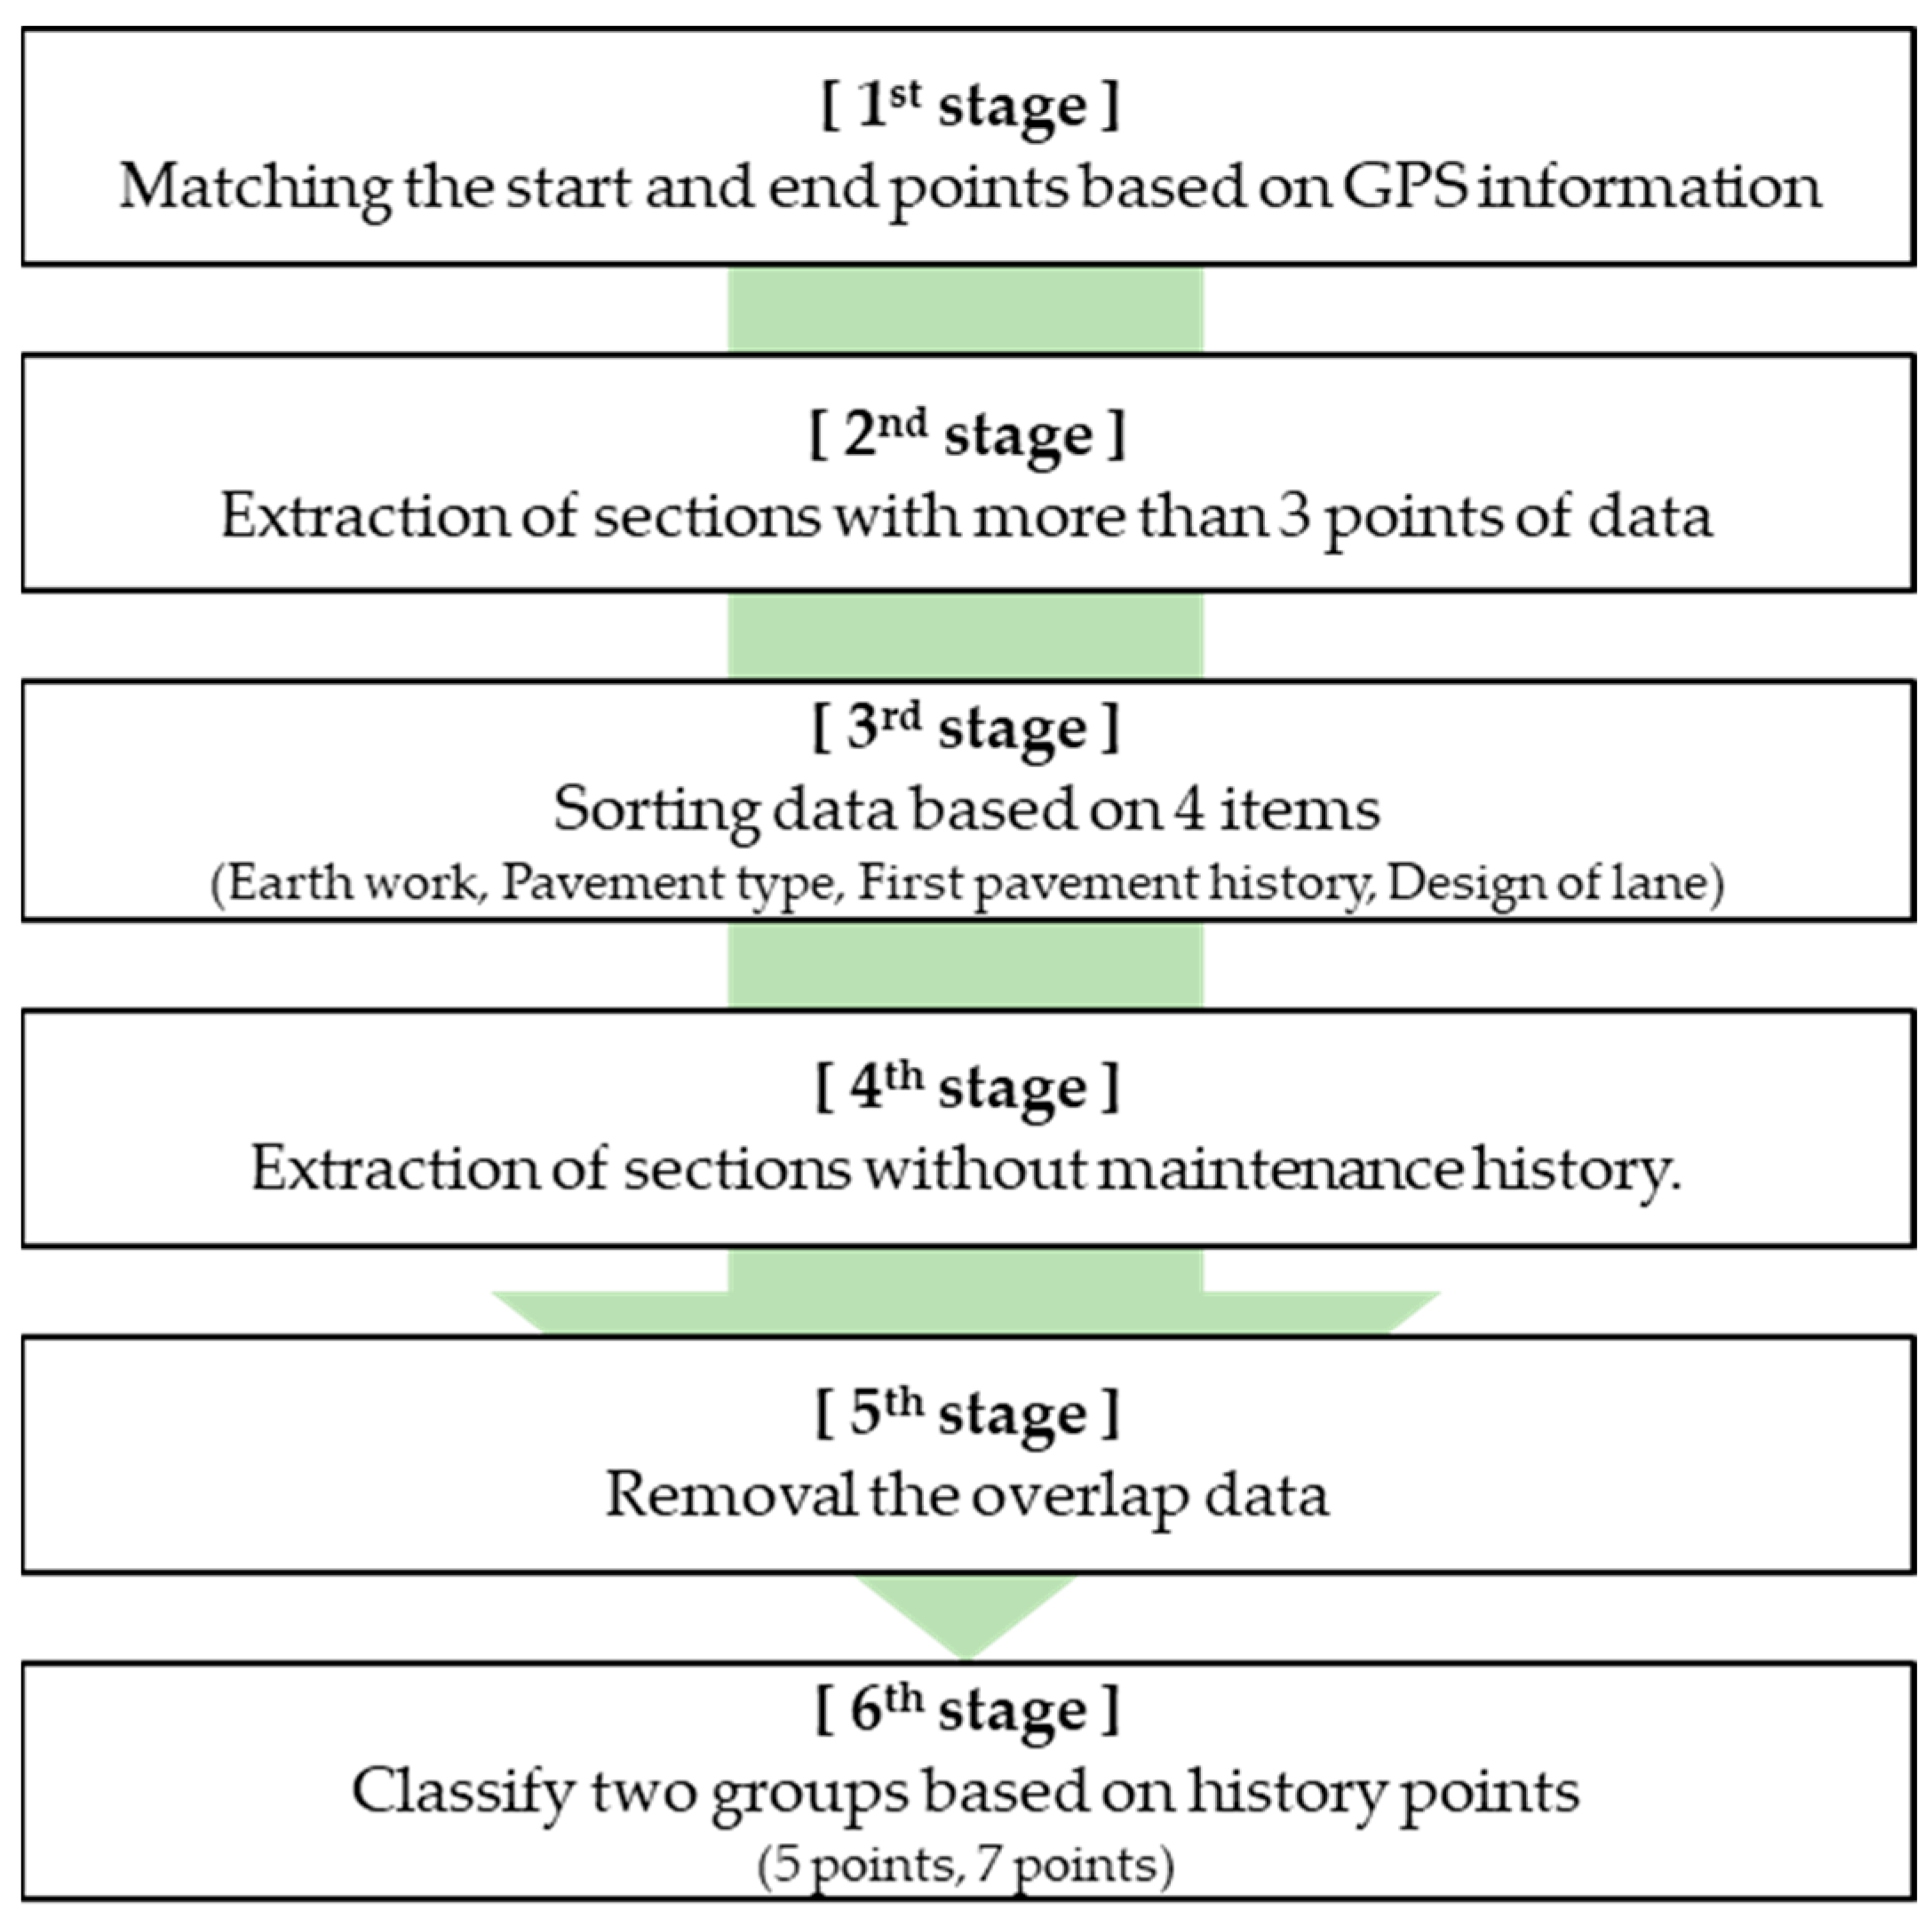
4.2. Data Pre-Processing

When the constructed data set mentioned in Section 4.1 was prepared, the format was built in the following order:
  • The start and end points were matched using the GPS values for each age of concrete pavement and each 10 m section.
  • Time-series sections collected over three consecutive points simultaneously and the endpoint section in the PMS DB are extracted.
  • Data were sorted and filtered based on four items: earthworks, pavement type, first pavement history, and design lane (38,208 sections = 38.208 km).
  • Data clusters that do not have a maintenance history after initial packaging were extracted (576 sections = 5.76 km).
  • Redundantly written historical data were removed to improve data reliability (prediction accuracy) (469 sections = 4.69 km)
  • Data sets were classified into two clusters based on consecutively collected time-series data points within the same time and endpoint interval (7 points = 208 sections; 5 points = 261 sections; a total of 469 intervals).

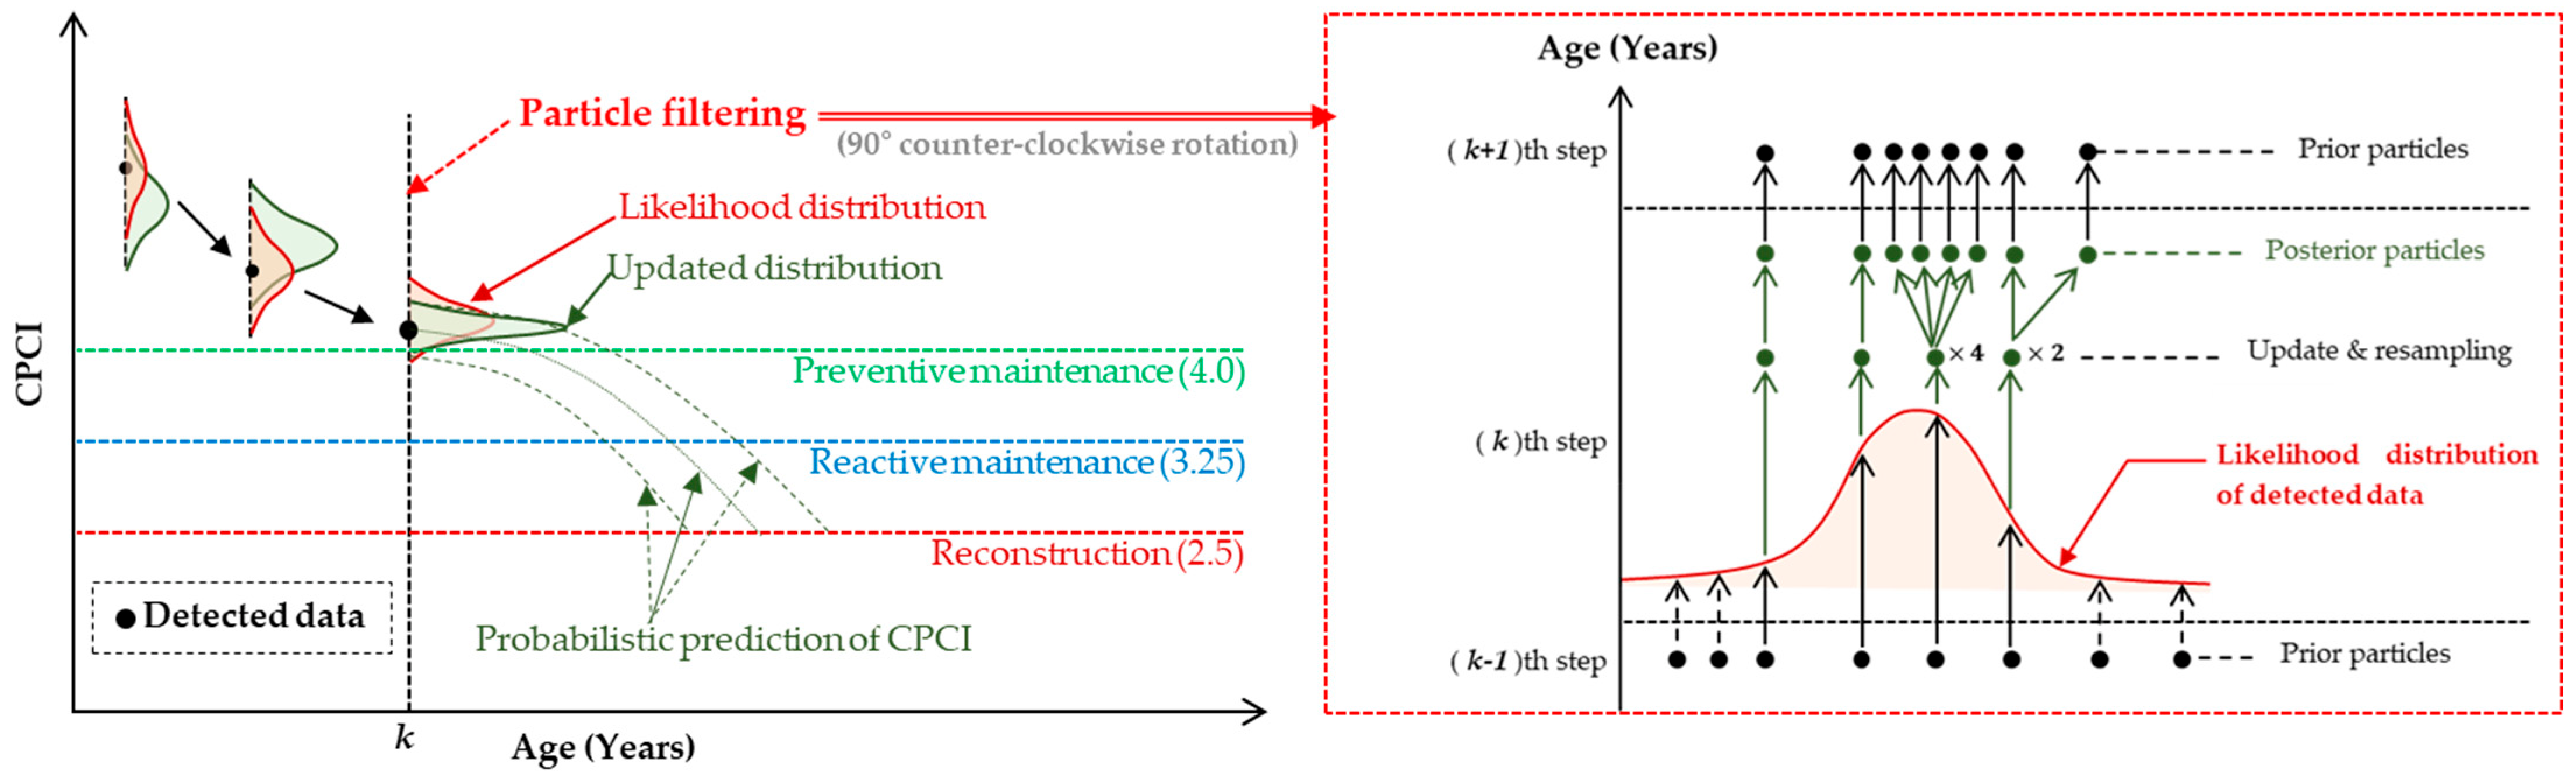
4.3. Particle Filter Model for CPCI Prediction

Based on the DB calculated through the six stages of data pre-processing introduced in Section 4.2, a basic model that can intuitively check the time-series changes of the concrete pavement was derived. Using the basic model, identifying the approximate state change of the analyzed section by age was possible. Figure 3 shows the fundamental model trend curve obtained by dividing by the number of time-series points (5, 7) in the same section of the 4.69 km analyzed. As for the basic model, there is no case where the state index increases with time because removing outliers is performed through the process in Section 4.2 above. However, particle filtering application seemed necessary as it did not show a continuous decreasing trend such as a general regression model.

5. Results

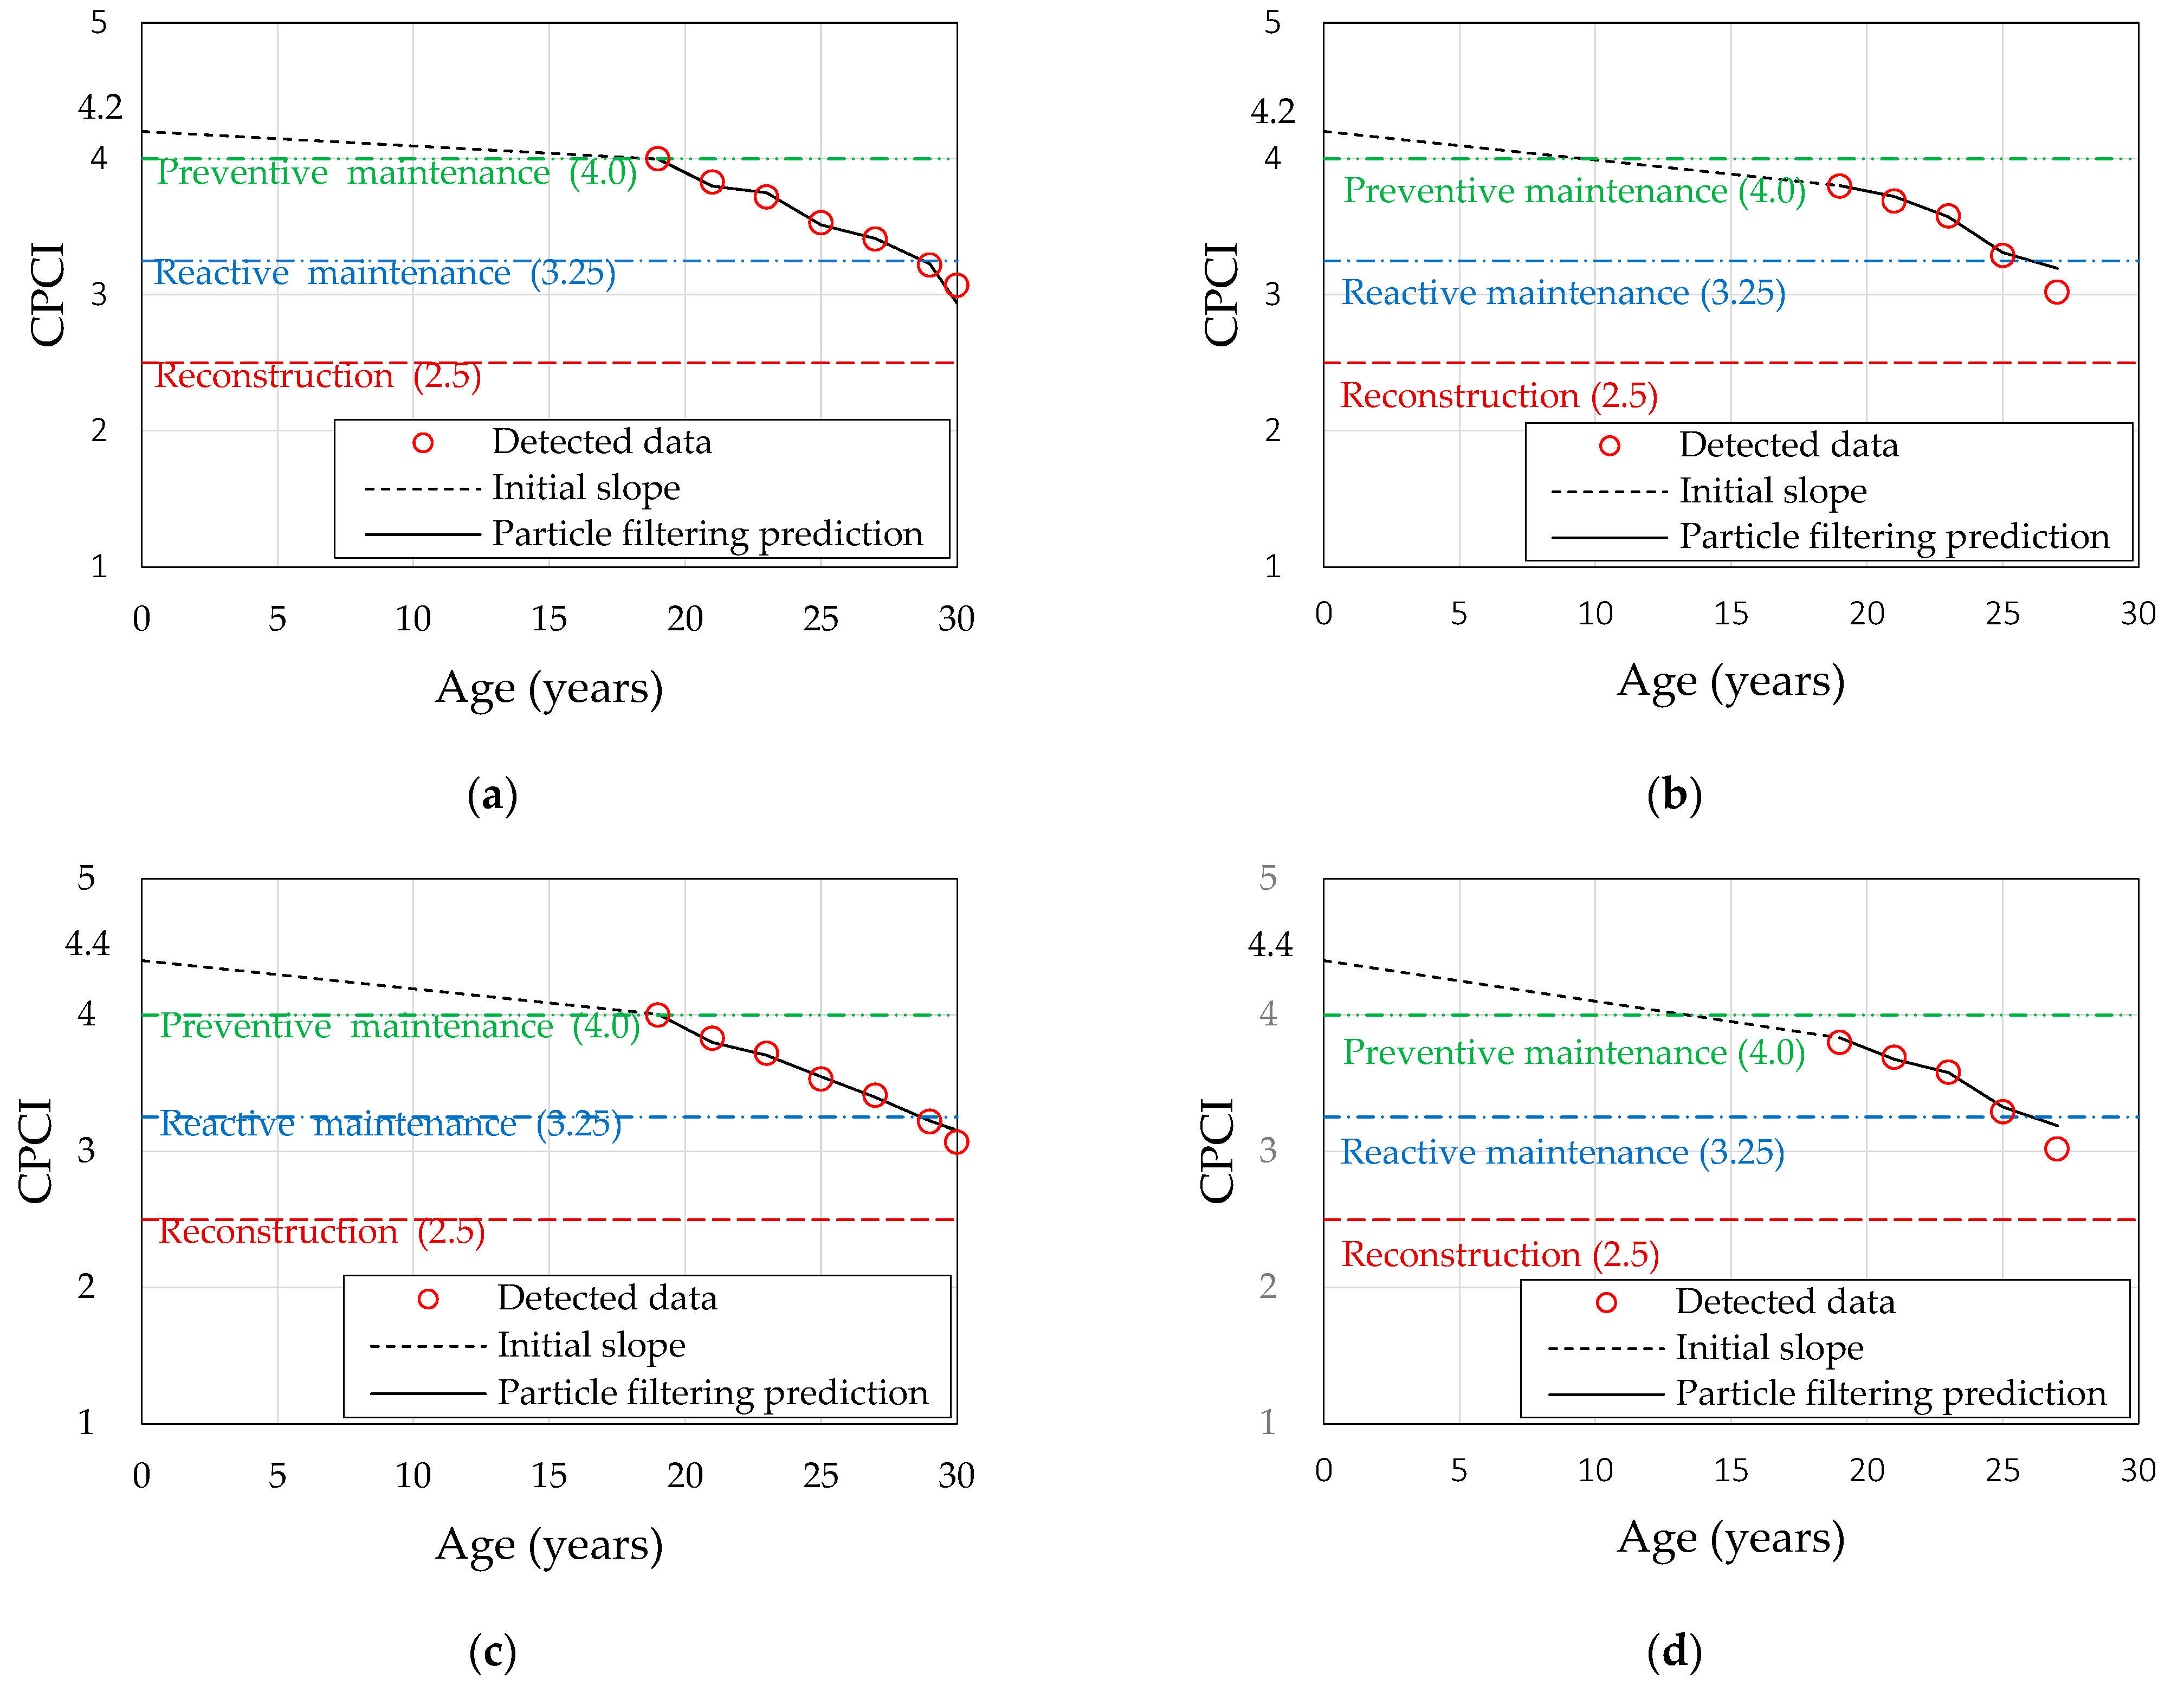
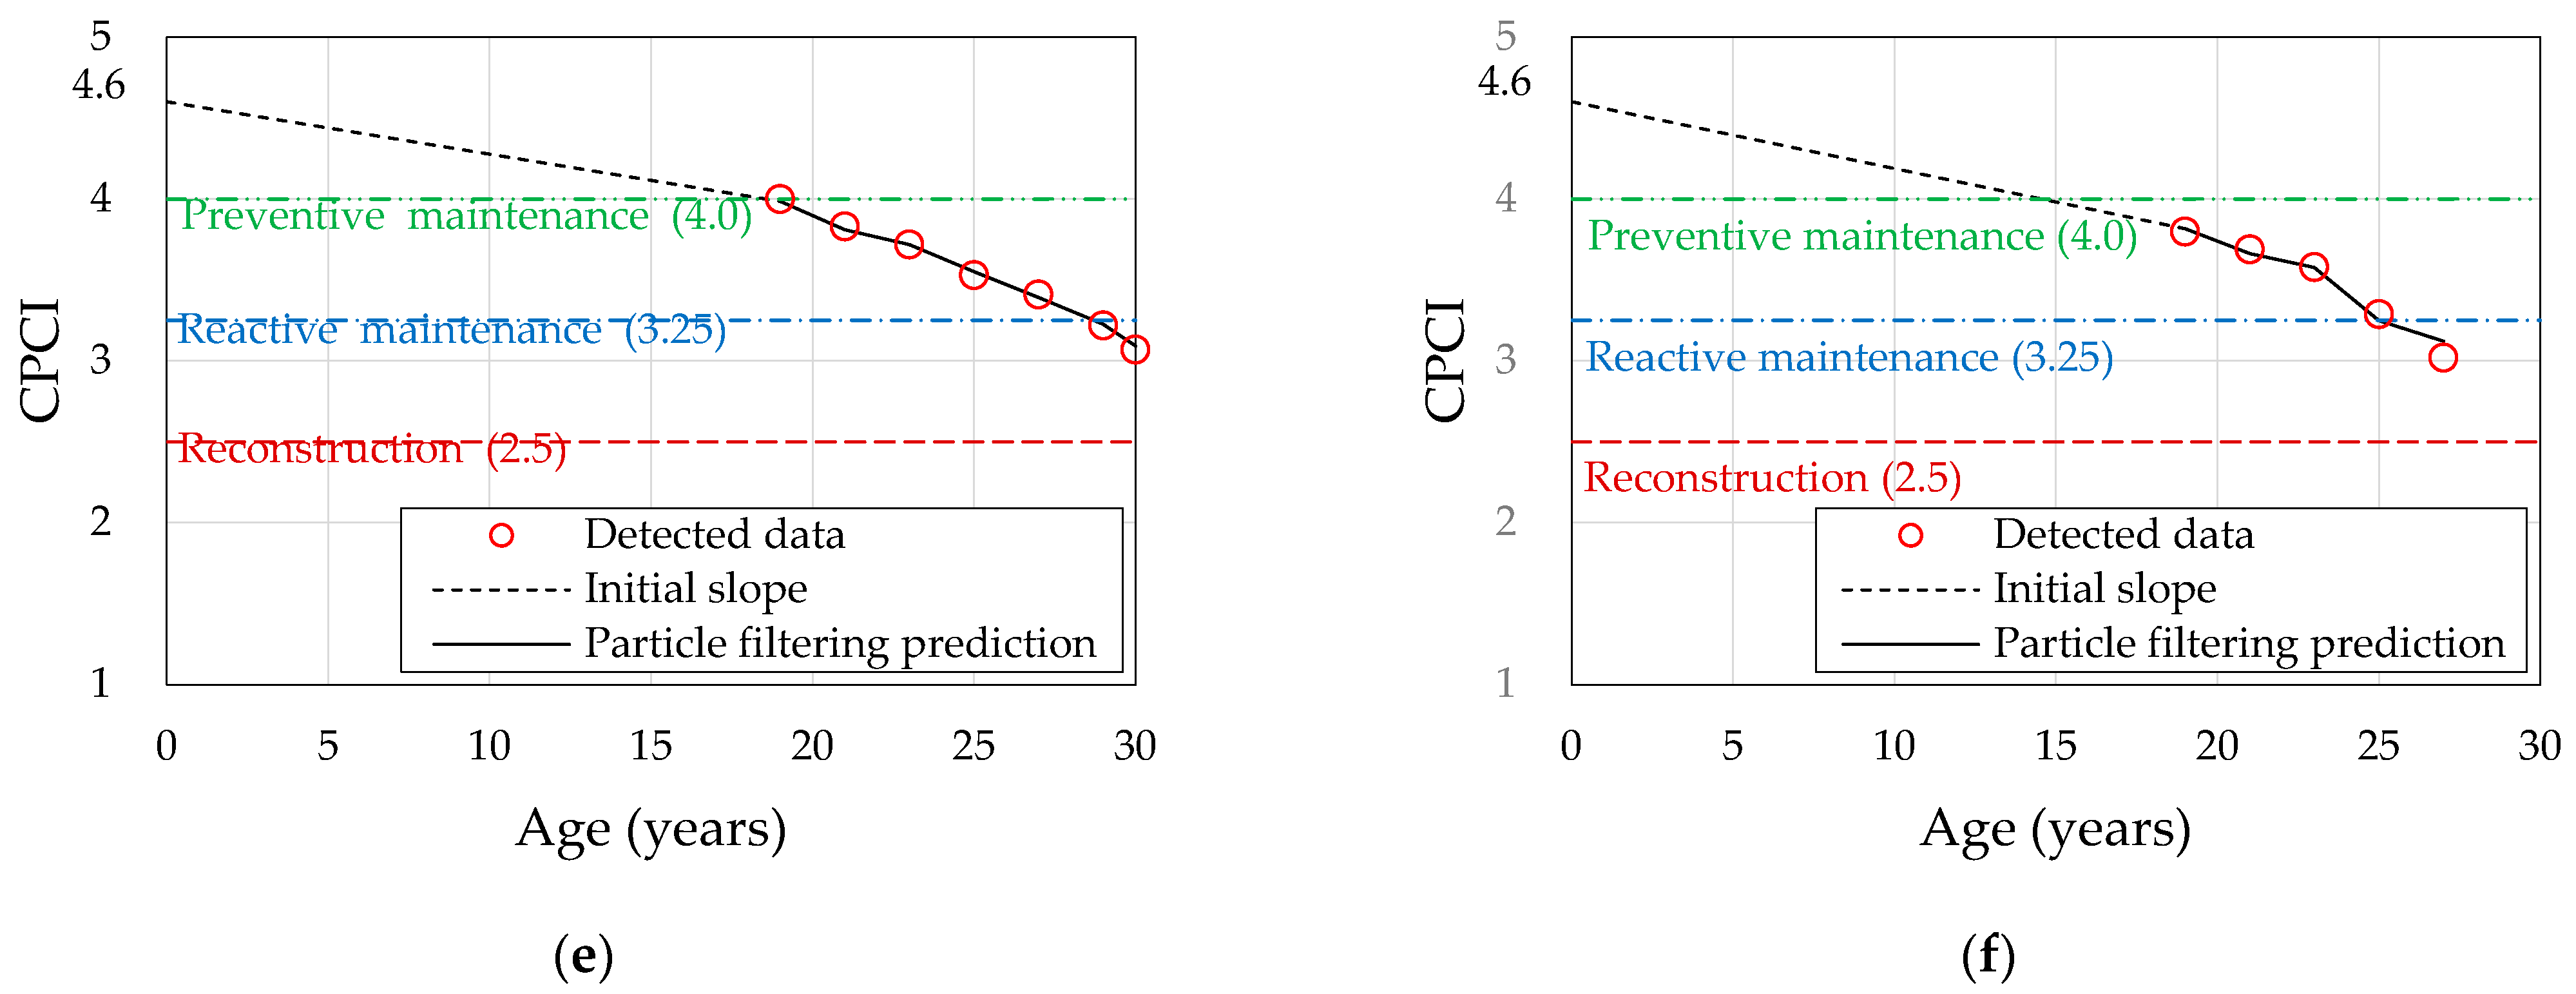
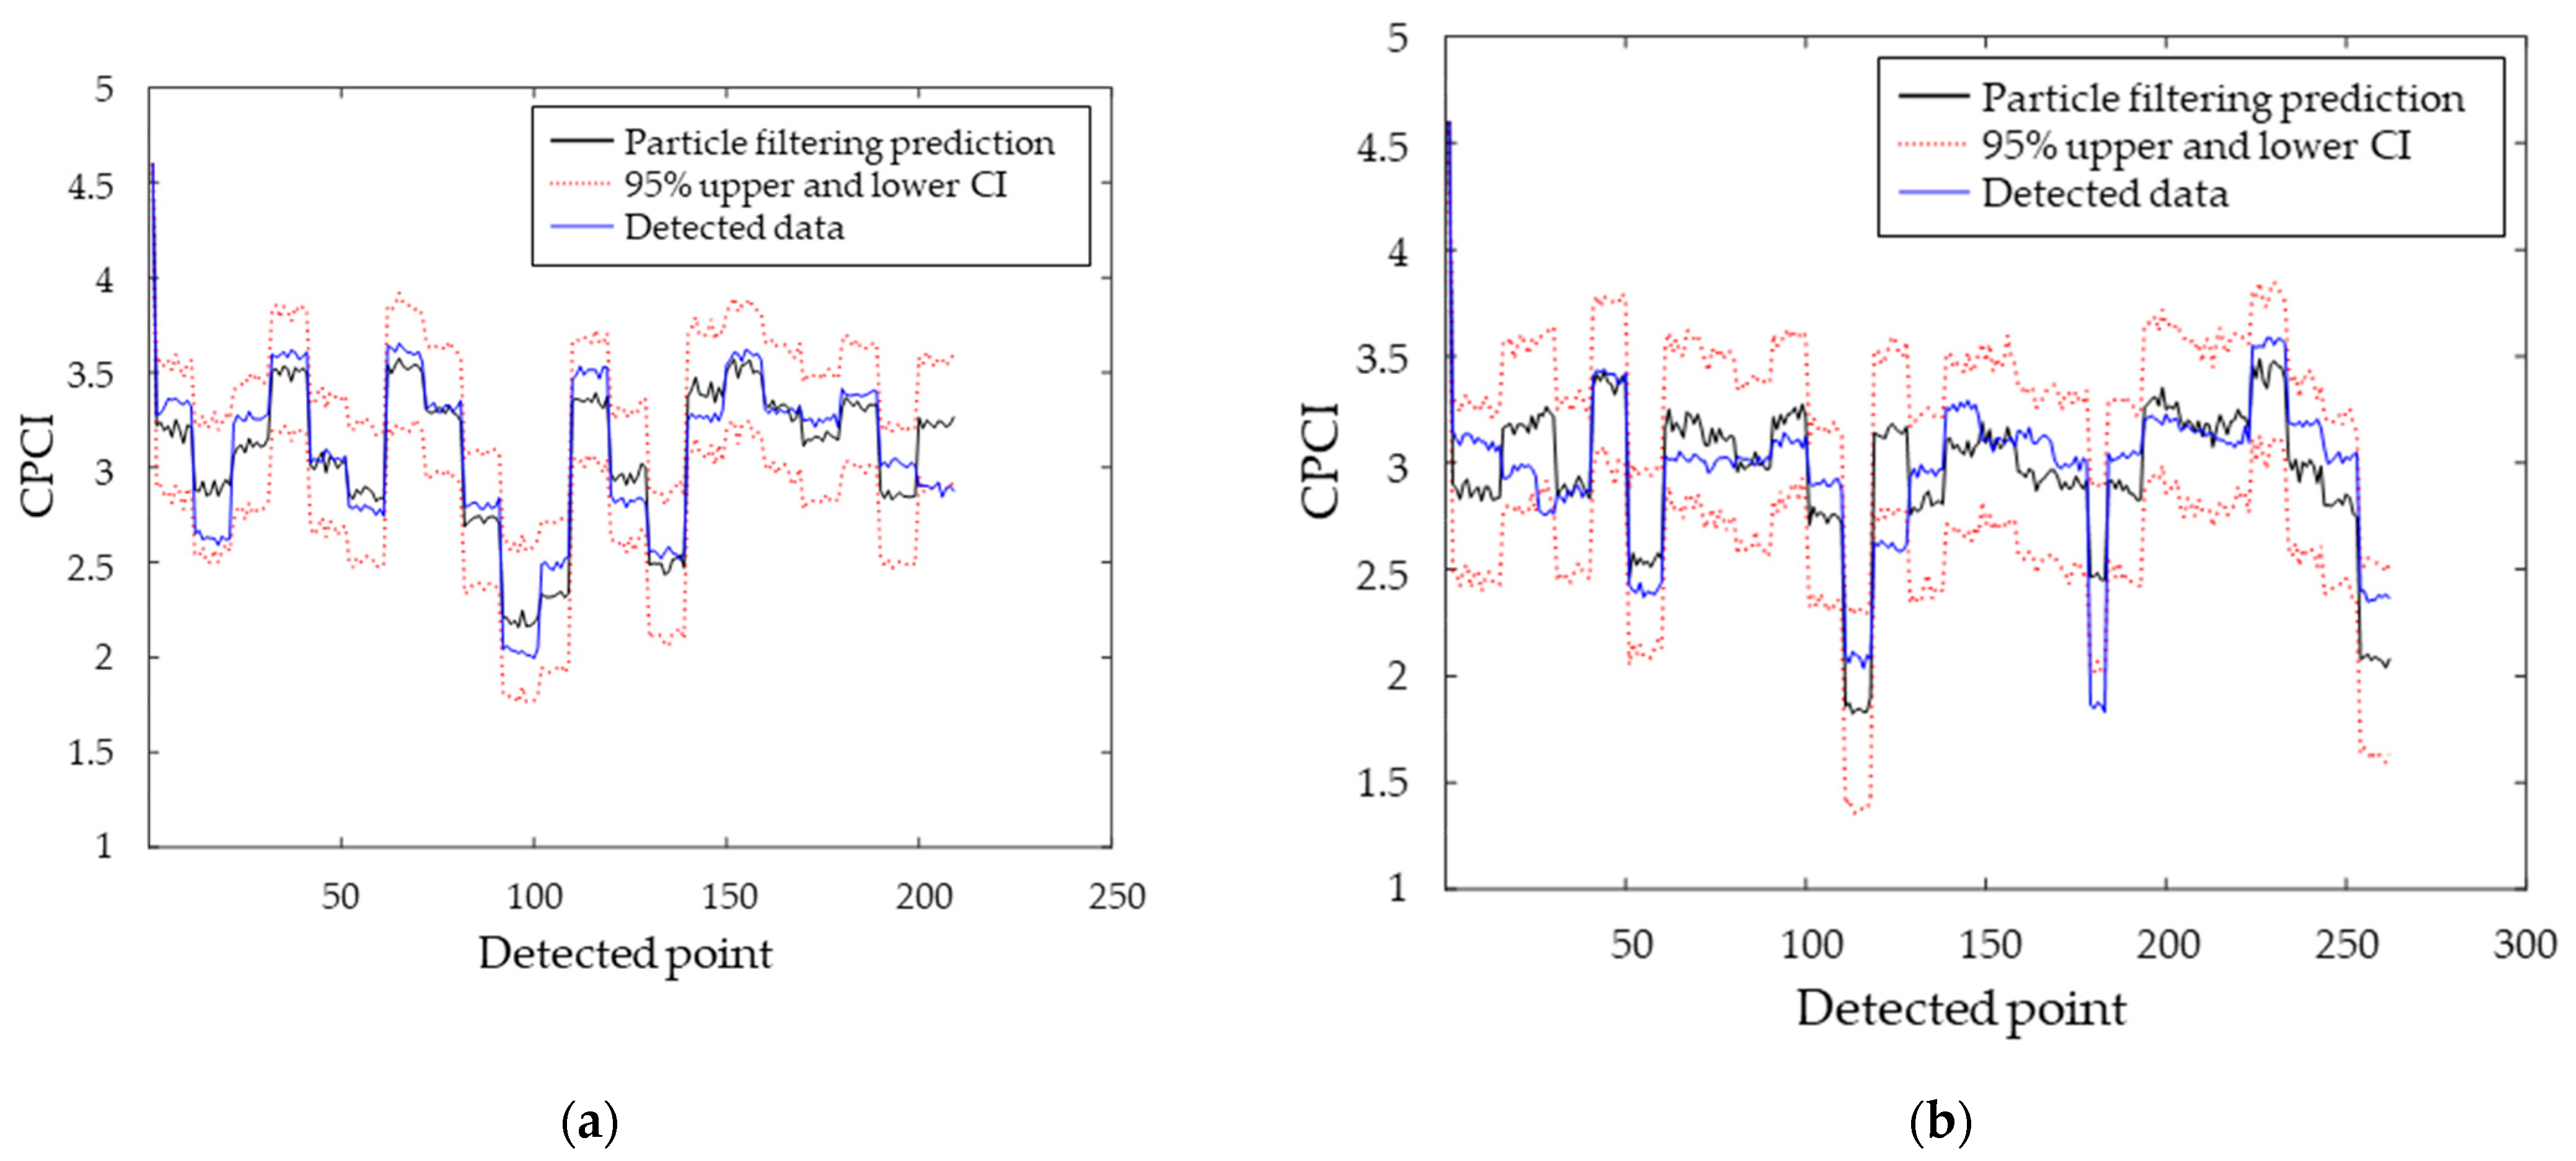
5.1. Application of Particle Filtering

Changes in CPCI can be predicted by updating the time-series regression analysis model using the particle filtering technique. The measured data collected by section and age are used to update the prediction model used in this study. Figure 4 shows the prediction curves for each age across 208 sections (2.08 km) with 7 points and 261 sections (2.61 km) with 5 points, where CPCI prediction ranges at the time of completion were assumed for the three cases of CPCI (4.2, 4.4, and 4.6) as follows: 4.2–5.0 for 4.2, 4.4–5.0 for 4.4, and 4.6–5.0 for 4.6, where, to clarify the meaning of the prediction curve of CPCI, the baseline for maintenance application was indicated as well (4.0 for preventive maintenance, 3.25 for reactive maintenance, and 2.5 for reconstruction). As a result of the analysis, the narrower the setting range for the initial CPCI prediction value (the uncertainty section), the higher the prediction accuracy for the predicted points (30 years old and 27 years old) for both 7-point and 5-point sections.
Table 2 presents the prediction accuracy for the six cases shown in Figure 4. Prediction accuracy can be expressed along with the concept of relative error. Please refer to Equation (8). ε R . E denotes the relative error rate between the actual data and the predicted data, and C P C I p r e d i c t e d and C P C I d e t e c t e d denote CPCI predicted through particle filtering and actual CPCI, respectively.
Prediction   accuracy   ( % )     = 1 ε R . E = 1 C P C I p r e d i c t e d C P C I d e t e c t e d C P C I d e t e c t e d  

5.2. Verification of the CPCI Prediction Model

In this study, to verify the CPCI prediction model, the prediction reliability of the predicted data compared to actual data (30 years old and 27 years old) was analyzed while changing the number of particles for all data points in 206 and 261 sections. Table 3 presents the analysis results.
As a result of the analysis, using 15 000 particles was the most efficient, as confirmed in Figure 5.
Among the 467 sections included in this analysis, the data that comes in the 95% confidence interval for the 2.06 km section that predicts the age of 30 years is 204 out of the 208 sections, accounting for 98.1% of the total, leaving only 4 points (1.9%) counted as sections not included. The data that comes in the 95% confidence interval for the 2.61 km section that predicts the age of 27 years is 241 out of the 261 sections, accounting for 92.3% of the total, leaving 20 points (7.7%) counted as sections not included.
In this study, we analyzed the change in prediction accuracy by increasing the number of data points in the order of 3, 4, 5, and 6 (except for the initial CPCI) for the 2.06 km section with a total of 7 points. In Table 4, the results predicted through actual data are indicated in blue. Considering the analytic characteristics of particle filtering, the learning results and prediction accuracy of the actual data were at least 99.4%. Furthermore, as the length of the prediction period increased, the prediction accuracy gradually decreased.
The relative error by the number of time-series points for the same section decreased as the number of points increased, as shown in Figure 6.

6. Conclusions

This study is the first of various steps to predict the future pavement condition index based on machine learning using the PMS database, and it can be considered pioneering work. This study, in particular, used the CPCI to establish a process for predicting the future pavement condition. The conclusions of this study are as follows.
  • This study applied particle filtering on time-series data of the concrete pavement condition of a specific section, which were collected for research, to predict pavement conditions. As a result of reviewing 22 different cases, the particle filtering technique showed a prediction accuracy between 86.09 and 99.33%, indicating its applicability in predicting the road pavement condition index. As national investigations are conducted for both express highways and national highways every year, unlike in the past, the utilization of PMS can be further increased for project level management, where it was difficult to use in the past, through more accurate predictions.
  • The results of this study can be more easily utilized by the road pavement maintenance management team for making decisions in the future by presenting the deterioration model in the form of a category according to the performance index obtained at the time of the actual completion of the new section. In particular, modeling through future research is expected to allow practitioners to easily use it without further concerns by presenting the y-intercept value, CPCI at the time of completion, in a graph format for a more subdivided performance index, in addition to 4.2, 4.4, and 4.6.
  • The function of the particle filtering technique itself increases the prediction accuracy for the analysis target section as the number of particles increases; however, the accuracy for other sections (routes) can be lowered by specifying the corresponding section. Therefore, as a result of analyzing the accuracy of cases using 1000, 5000, 10,000, 15,000, and 20,000 particles, the use of 15,000 particles was found to be the most efficient.
  • We found that the number of time series points in one section had a higher impact on the improvement of prediction accuracy than the number of sections analyzed. The prediction accuracy was 92.3% when using the section with 5 points (261), whereas it was 98.1% when using the section with 7 points (208) (when 15,000 particles were used).
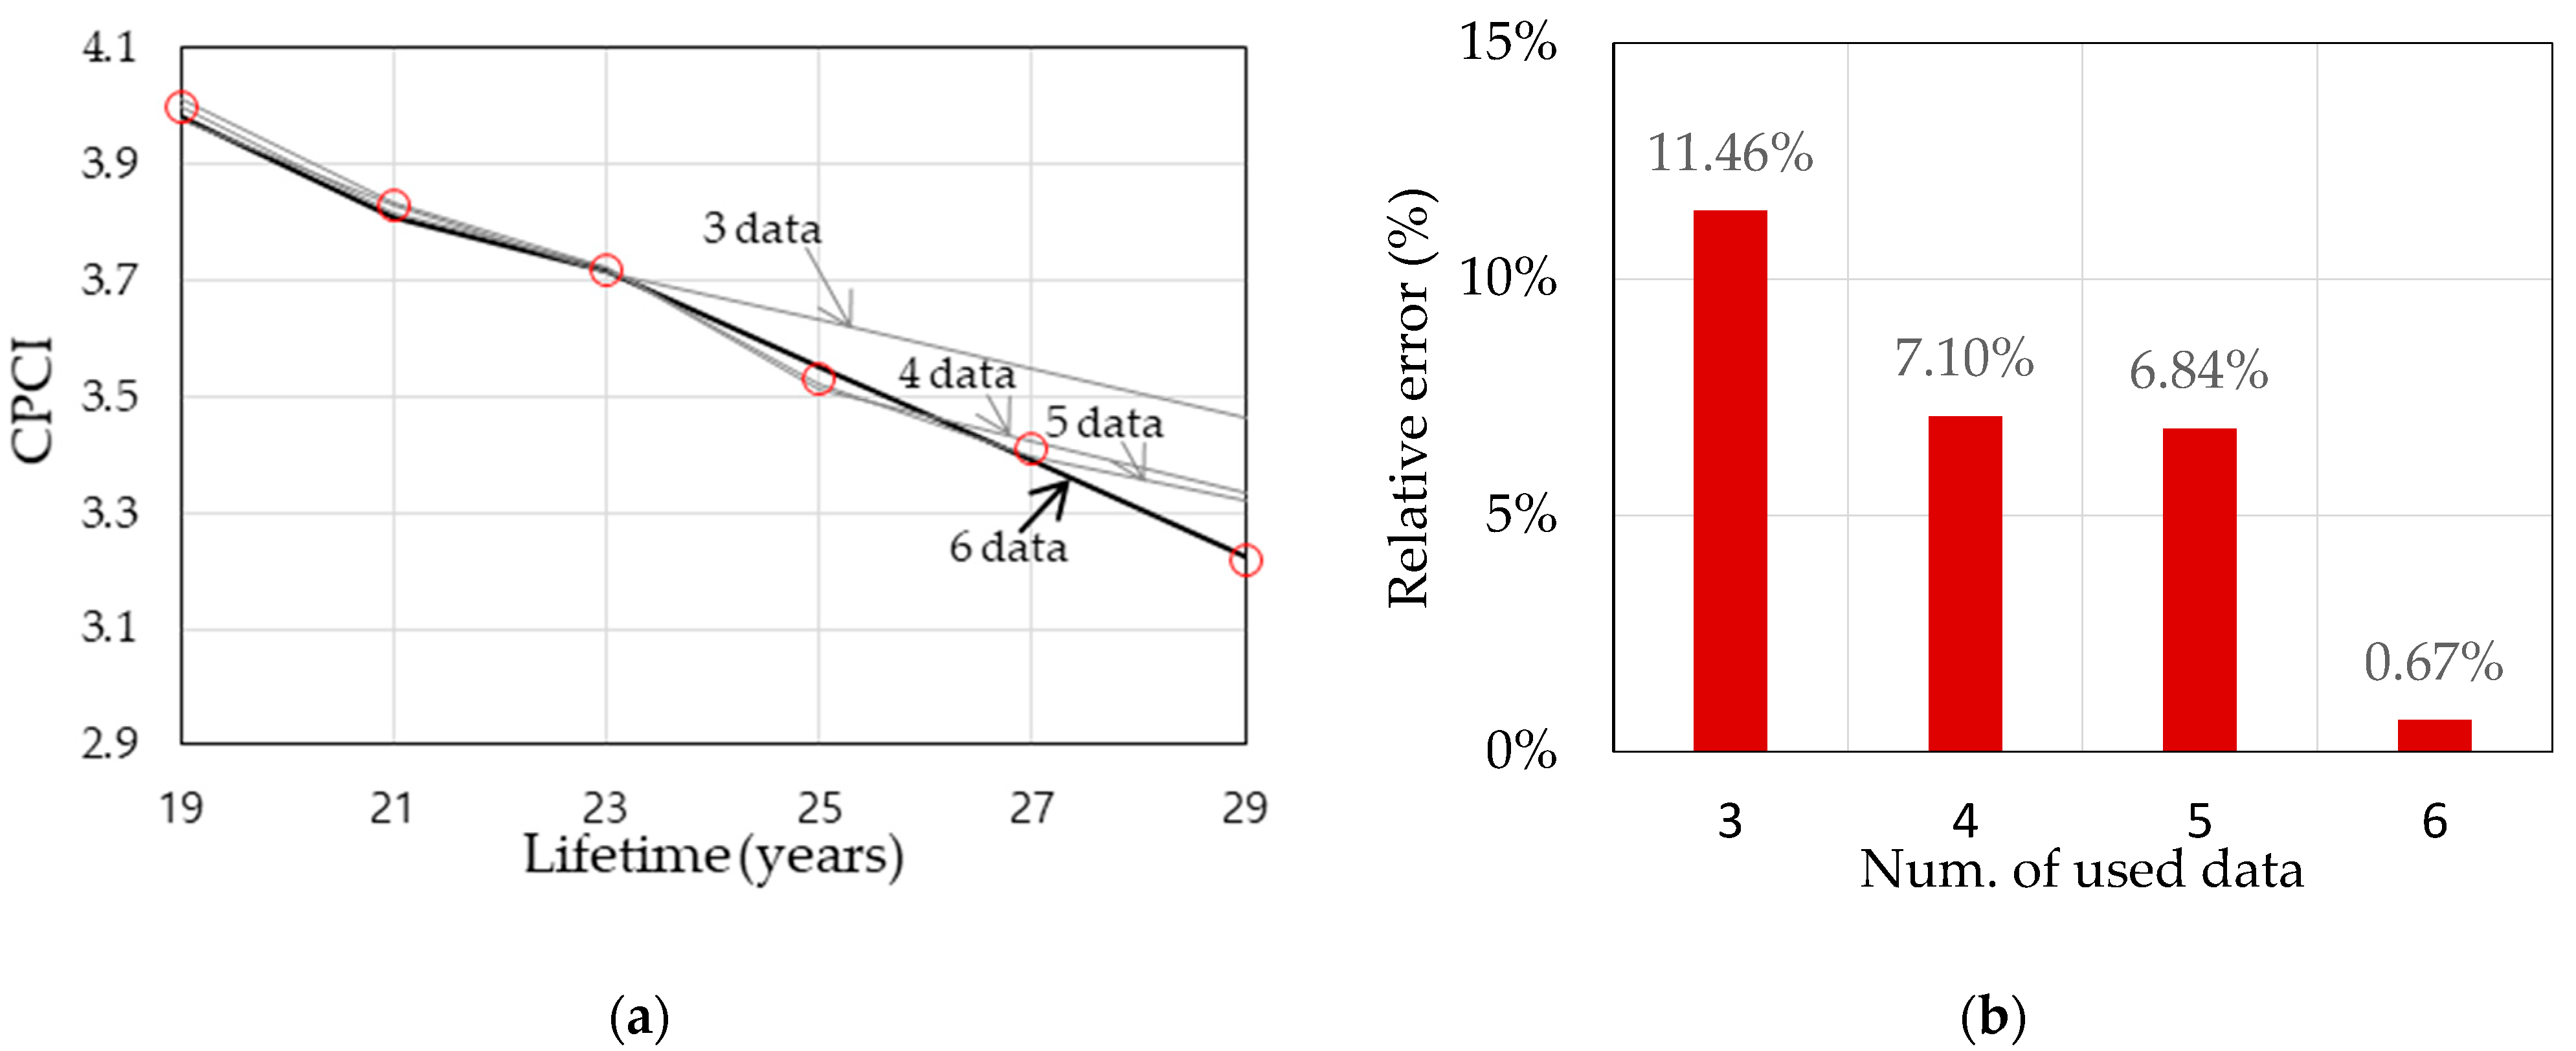
  • As a result of analyzing the prediction accuracy by increasing the number of points to 3, 4, 5, and 6 in the section with 7 points, the prediction accuracy was 88.5%, 92.9%, 93.2%, and 99.3%, respectively. Accordingly, we determined that a section with at least six consecutive data points should be selected to secure a prediction accuracy of 95% or more in a study related to the prediction of the road pavement condition index, thereby obtaining the reliability of data and results.
  • The relative error by each predicted age for the same section decreased as the number of time series points increased. Meanwhile, prediction accuracy decreased when farther future was predicted in the section. Accordingly, the particle filtering technique is deemed to be effective to predict up to two years of future road pavement conditions.

Author Contributions

Conceptualization, D.-H.J.; methodology, D.-H.J. and J.-H.L.; software, J.-H.L.; validation, D.-H.J. and J.-H.L.; formal analysis, J.-H.L.; investigation, D.-H.J.; resources, M.-S.L. and S.-I.J.; data curation, D.-H.J.; writing—original draft preparation, D.-H.J. and J.-H.L.; writing—review and editing, D.-H.J., M.-S.L., and S.-I.J.; visualization, J.-H.L.; supervision, D.-H.J.; project administration, D.-H.J.; funding acquisition, M.-S.L. All authors have read and agreed to the published version of the manuscript.

Funding

This research was funded by MoLIT, “Operation and Improvement of the Road Pavement Management System (PMS)”.

Data Availability Statement

Not applicable.

Acknowledgments

We conducted this study with research support from the Ministry of Land Infrastructure and Transport and distribution project “Operation and Improvement of the Road Pavement Management System (PMS)”. We express our gratitude to everyone involved.

Conflicts of Interest

The authors declare no conflict of interest.

References

  1. MoLIT. 2013~2021 Status of Road Repair by Road Infrastructure (only Pavement Section); MoLIT: Seoul, Korea, 2021. [Google Scholar]
  2. MoLIT. Roadway Status Survey; MoLIT: Seoul, Korea, 2020. [Google Scholar]
  3. Jung, D.H.; Suh, Y.C.; Nam, J.H. Life of Asphalt Overlay over Old Concrete Pavements according to Time of Overlay. Int. J. Highw. Eng. 2019, 21, 69–76. [Google Scholar] [CrossRef]
  4. George, K.P.; Rajagopal, L.S.; Lim, L.K. Models for Predicting Pavement Deterioration. Trans. Res. Rec. 1989, 1215, 1–7. [Google Scholar]
  5. Johnson, K.D.; Cation, K.A. Performance Prediction Development Using Three Indexes for North Dakota Pavement Management System. Trans. Res. Rec. 1992, 1344, 22–30. [Google Scholar]
  6. Abaza, K.; Ashur, S.A.; Al-Khatib, I.A. Integrated Pavement Management System with a Markovian Prediction Model. J. Transp. Eng. 2004, 130, 24–33. [Google Scholar] [CrossRef]
  7. Kulkarni, R.B.; Miler, R.W. Pavement Management System: Past, present, and future. Trans. Res. Rec. 2003, 1853, 65–71. [Google Scholar] [CrossRef]
  8. Suh, Y.C.; Kwon, S.H.; Jung, D.H.; Jeon, J.H.; Kang, M.S. Development of HPCI Prediction Model for Concrete Pavement Using Expressway PMS Database. Int. J. Highw. Eng. 2017, 19, 83–95. [Google Scholar] [CrossRef]
  9. Shah, Y.U.; Jain, S.S.; Tiwari, D.; Jain, M.K. Development of Overall Pavement Condition Index for Urban Road Network. Procedia Soc. Behav. Sc. 2013, 104, 332–341. [Google Scholar] [CrossRef]
  10. Kim, J.R.; Park, D.G.; Suh, Y.C.; Jung, D.H. Development of Sidewalk Block Pavement Condition Index (SBPCI) using Analytical Hierarchy Process. Sustainability 2019, 11, 7086. [Google Scholar] [CrossRef]
  11. Choi, S.H.; Do, M.S.; You, S.H.; Cho, C.S. Determination of Visual Based Asphalt Pavement Crack Condition Using Deep Learning. Int. J. Highw. Eng. 2018, 20, 75–83. [Google Scholar] [CrossRef]
  12. Lee, Y.J.; Jeon, S.I.; Kim, R.E. A Computer-Vision-Based Classification of Road Surface Roughness Grade Using Machine Learning Techniques. Int. J. Highw. Eng. 2021, 23, 75–81. [Google Scholar] [CrossRef]
  13. Lee, J.S.; Kim, J.H.; Kim, J.R. Use of Deep Learning Image Classification Models and Vehicle Mounted Cameras for Automatic Pavement Pothole Detection. Int. J. Highw. Eng. 2021, 23, 25–34. [Google Scholar] [CrossRef]
  14. Wang, W.; Wang, M.; Li, H.; Zhao, H.; Wang, K.; He, C.; Wang, J.; Zheng, S.; Chen, J. Pavement Crack Image Acquisition Methods and Crack Extraction Algorithms. J. Traffic Transp. Eng. 2021, 6, 535–556. [Google Scholar]
  15. Abdellatif, M.; Peel, H.; Vohn, A.G.; Fuentes, R. Combining Block-Based and Pixel-Based Approaches to Improve Crack Detection and Localization. Autom. Constr. 2021, 122, 103492. [Google Scholar] [CrossRef]
  16. Practico, F.G.; Fedele, R.; Naumov, V.; Sauer, T. Detection and Monitoring of Bottom-up Cracks in Road Pavement Using a Machine-Learning Approach. Algorithms 2020, 13, 81. [Google Scholar] [CrossRef]
  17. Riid, A.; Louk, R.; Pihlak, R.; Tepljakov, A.; Vassiljeva, K. Pavement Distress Detection with Deep Learning Using the Orthofracmes Acquired by a Mobile Mapping System. Appl. Sci. 2019, 9, 4829. [Google Scholar] [CrossRef]
  18. Fan, Z.; Li, C.; Chen, Y.; Mascio, P.D.; Chen, X.; Zhu, G.; Loprencipe, C. Ensemble of Deep Convolutional Neural Networks for Automatic Pavement Crack Detection and Measurement. Coatings 2020, 10, 152. [Google Scholar] [CrossRef]
  19. Choi, S.H.; Do, M.S. Development of the Road Pavement Deterioration Model Based on the Deep Learning Method. Electronics 2020, 9, 3. [Google Scholar] [CrossRef]
  20. Chun, C.J.; Ryu, S.K. Road Surface Damage Detection Using Fully Convolutional Neural Networks and Semi-Supervised Learning. Sensors 2019, 19, 5501. [Google Scholar] [CrossRef]
  21. Xu, X.; Zhao, M.; Shi, P.; Ren, R.; He, X.; Wei, X.; Yang, H. Crack Detection and Comparison Study Based on Faster R-CNN and Mask R-CNN. Sensors 2022, 22, 1215. [Google Scholar] [CrossRef]
  22. Chen, G.H.; Chen, Z.; Huang, H.; Sun, Y.L.; Ip, W.H.; Yung, K.L. Detection of Highway Pavement Damage Based on a CNN Using Grayscale and HOG Features. Sensors 2022, 22, 2455. [Google Scholar] [CrossRef]
  23. Bektas, B.A.; Carriquiry, A.; Smadi, O. Using Classification Trees for Predicting National Bridge Inventory Condition Ratings. J. Infrastruct. Syst. 2013, 19, 425–433. [Google Scholar] [CrossRef]
  24. Hasan, S.; Elwakil, E. Stochastic Regression Deterioration Models for Superstructure of Prestressed Concrete Bridges in California. J. Struct. Integr. Maint. 2019, 4, 97–108. [Google Scholar] [CrossRef]
  25. Huang, Y.H. Artificial Neural Network Model of Bridge Deterioration. J. Perform. Constr. Facil. 2010, 24, 597–602. [Google Scholar] [CrossRef]
  26. Fathalla, E.; Tanaka, Y.; Maekawa, K. Remaining Fatigue Life Assessment of In-Service Road Bridge Decks Based Upon Artificial Neural Networks. Eng. Struct. 2018, 171, 602–616. [Google Scholar] [CrossRef]
  27. Ali, G.; Elsayegh, A.; Assaad, R.; El-adaway, I.H.; Abotaleb, I.S. Artificial Neural Network Model for Bridge Deterioration and Assessment. In Proceedings of the Canadian Society for Civil Engineering Conference 2019, Montreal, QC, Canada, 12–15 June 2019. [Google Scholar]
  28. Choi, Y.J.; Lee, J.H.; Kong, J.S. Performance Degradation Model for Concrete Deck of Bridge Using Pseudo-LSTM. Sustainability 2020, 12, 3848. [Google Scholar] [CrossRef]
  29. Lee, J.H.; Choi, Y.; Ann, H.; Jin, S.Y.; Lee, S.J.; Kong, J.S. Maintenance Cost Estimation in PSCI Girder Bridges Using Updating Probabilistic Deterioration Model. Sustainability 2019, 11, 6593. [Google Scholar]
  30. Jeong, M.C.; Lee, S.J.; Cha, K.; Zi, G.; Kong, J.S. Probabilistic Model Forecasting for Rail Wear in Seoul Metro Based on Bayesian Theory. Eng. Fail. Anal. 2019, 96, 202–210. [Google Scholar] [CrossRef]
  31. Lee, S.J.; Zi, G.; Mun, S.; Kong, J.S.; Choi, J.H. Probabilistic Prognosis of Fatigue Crack Growth for Asphalt Concretes. Eng. Fract. Mech. 2015, 141, 212–229. [Google Scholar] [CrossRef]
  32. Dowd, M.; Joy, R. Estimating Behavioral Parameters in Animal Movement Models Using a State-Augmented Particle Filter. Ecology 2011, 92, 568–575. [Google Scholar] [CrossRef] [Green Version]
  33. Simon, D. Optimal State Estimation: Kalman, H-Infinity, and Nonlinear Approaches; John Willey & Sons: Hoboken, NJ, USA, 2006; pp. 461–483. [Google Scholar]
  34. Ristic, B.; Arulampalam, S.; Gordon, N. Beyond the Kalman Filter: Particle Filters for Tracking Applications; Artech House Publishers: Boston, MA, USA; London, UK, 2004. [Google Scholar]
Figure 1. Intuitive schematic diagram of the particle filtering (for example).
Applsci 12 08731 g001
Figure 2. Flow chart of data pre-processing in six stages.
Applsci 12 08731 g002
Figure 3. Basic prediction curve by condition history for concrete pavement. (a) CPCI prediction, basic model (using 7 points); (b) CPCI prediction, basic model (using 5 points).
Applsci 12 08731 g003
Figure 4. Comparison of detected data and particle filtering prediction. (a) Initial CPCI 4.2 (prediction curve using 7 points); (b) initial CPCI 4.2 (prediction curve using 5 points); (c) initial CPCI 4.4 (prediction curve using 7 points); (d) initial CPCI 4.4 (prediction curve using 5 points); (e) initial CPCI 4.6 (prediction curve using 7 points); (f) initial CPCI 4.6 (prediction curve using 5 points).
Applsci 12 08731 g004aApplsci 12 08731 g004b
Figure 5. Particle filtering prediction of CPCI and 95% confidential interval by 15,000 particles. (a) 208 sections (2.08 km). (b) 261 sections (2.61 km).
Applsci 12 08731 g005
Figure 6. Results of prediction accuracy according to the change in the number of time-series points in the same section. (a) Influence of the number of actual data used for updating on the prediction of CPCI by the particle filtering; the lines are the mean values; (b) relative errors according to amount of data used for updating.
Applsci 12 08731 g006
Table 1. Part of PMS DB in South Korea.
LatitudeLongitudeRouteStartEndBoundLaneTypeAge 25Age 27
IRISDCPCIIRISDCPCI
37.2084127.4418A00.01South bound1JPCP0.8104.310.730.513.39
37.2088127.4415A0.010.02South bound1JPCP0.7104.371.290.243.33
37.2092127.4413A0.020.03South bound1JPCP0.6804.390.690.083.97
Applsci 12 08731 i001Applsci 12 08731 i001Applsci 12 08731 i001Applsci 12 08731 i001Applsci 12 08731 i001Applsci 12 08731 i001Applsci 12 08731 i001Applsci 12 08731 i001Applsci 12 08731 i001Applsci 12 08731 i001Applsci 12 08731 i001Applsci 12 08731 i001Applsci 12 08731 i001Applsci 12 08731 i001Applsci 12 08731 i001
Table 2. Comparison of prediction accuracy for each section according to changes in initial CPCI (4.2, 4.4, and 4.6).
Division206 Sections (in 30 Years)261 Sections (in 27 Years)
Detected CPCIPredicted CPCIAccuracy (%)Detected CPCIPredicted CPCIAccuracy (%)
4.2 (a),(b)3.072.93895.713.023.19594.21
4.4 (c),(d)3.15497.273.18794.48
4.6 (e),(f)3.09199.333.12196.66
Table 3. Comparison and verification of prediction accuracy for each section according to the change in the number of particles.
No. of Particles206 Sections (in 30 Years)261 Sections (in 27 Years)
95% Confidential Interval
IncludedNot IncludedValidation Accuracy (%)IncludedNot IncludedValidation Accuracy (%)
1000200896.152362590.42
5000199995.672412092.34
10,000202697.122412092.34
15,000204498.082412092.34
20,000201796.632412092.34
Table 4. Estimation of prediction accuracy according to the change in the number of time-series points in the same section.
Age
(Year)
Actual CPCI3 Data4 Data5 Data6 Data
PF * CPCIPrediction Accuracy (%)PF * CPCIPrediction Accuracy (%)PF * CPCIPrediction Accuracy (%)PF * CPCIPrediction Accuracy (%)
194.003.9899.454.0199.734.0099.983.9899.61
213.833.8399.983.8399.943.8299.623.8199.43
233.723.7299.883.7299.923.7299.953.7299.95
253.533.6397.123.5199.503.5299.803.5599.42
273.413.5595.973.4299.633.4099.653.3999.43
293.223.4692.433.3396.493.3296.913.2299.86
303.073.4288.543.2992.903.2893.163.0999.33
* Note: PF is particle filtering.
Publisher’s Note: MDPI stays neutral with regard to jurisdictional claims in published maps and institutional affiliations.

