1. Introduction
Honey is considered a superfood due to its highly nutritious composition, its medicinal proprieties, and its natural and unprocessed sweetener. Generally, monofloral honey has a higher demand and market value because of its limited production and availability. Thus, due to the high interest in some monofloral honey types, these became susceptible to falsification [
1,
2]. As compared to other food commodities, for which ensuring the monovarietal feature can be fully controlled by producers, in the case of honey, this aspect is more difficult to be commanded. This is because the bees are collecting pollen from an area having a radius of about 5 km and the plant distribution homogeneity is not easy to be found. Apart of this, honey is one of the most falsified food commodities in the world and the pollution issues and environmental factors contribute to the diminishing of the produced honey quantities in more and more geographical areas. At the same time, the market demand for natural products is nowadays in a continuous expansion and in these conditions, the occurrence of falsified products could appear. Therefore, there is an increased interest among researchers to develop new and reliable analytical approaches that can differentiate between distinct honey varieties as this fact has an important practical application.
The most used method to determine honey botanical origin is melissopalynology analysis, which studies the pollen type [
3]. However, this technique has the limitation of being destructive, time-consuming, and requires experienced personnel. In the last years, important efforts were made for the development of new analytical approaches able to assure a faster assessment of food and beverage authenticity, based on distinct types of spectroscopy such as
1H NMR [
4,
5], vibrational spectroscopies [
6,
7], and fluorescence [
8]. All this is in the context of the progress that has been made in the evolution of analytical equipment with a special accent of the portable ones that allow rapid monitoring of the followed characteristic and at the same time, a less experimented user being more easily able to operate as compared to the equipment that is usually used for research activities. The costs of the analysis and the characteristic of being a green analytical technique that does not require the use of solvents are also important features based on which the economical and environmental efficiency can be assessed. In this light, vibrational spectroscopy is a good candidate for the development of reliable tools based on which new approaches for food and beverages differentiation can be made. Among the vibrational spectroscopy techniques, one of the faster and more practical methods proved to be attenuated total reflection Fourier transform infrared (ATR-FTIR) spectroscopy. For the successful application of this method for the detection of such subtle changes that can occur among distinct honey varieties among the IR spectra, either supervised statistical methods or artificial intelligence is used.
ATR-FTIR in combination with principal component analysis (PCA) or linear discriminant analysis (LDA) was successfully adopted to identify the botanical origins of some honey types [
3,
9,
10,
11]. It has also been proved that partial least squares discriminant analysis (PLS-DA) gives reliable classification models, with high accuracy in the cross-validation technique [
12]. In a study, PLS-DA was used for developing a model capable to predict the chestnut and polyfloral honeys [
11].
Support vector machines (SVM) represent supervised machine learning methods that build a hyperplane or a group of hyperplanes corresponding to a high-dimensional space, which may be used as a classifier for regression problems or for other applications [
10,
13,
14]. In the literature, there are also reports that have used artificial intelligence (e.g., machine learning algorithms) in order to process the infrared spectral data to obtain a differentiation model capable to discriminate between five Chinese kinds of honey [
11] or samples having a protected geographical indication [
15].
An application for honey authentication using PLS-DA was realized for botanical differentiation of four varieties of honey by using the isotopic and elemental content data [
16]. It was proved that the discrimination potential of the approach can be increased by applying an advanced pre-processing step. The selection of the most appropriate data pre-processing has been realized by comparison between two methods, namely, principal component analysis (PCA) (unsupervised) and partial least squares-discriminant analysis (PLS-DA) (supervised). Thus, considering the final models’ prediction rate, it was shown that an efficient data pre-processing can be realized by using the most relevant features selected by PLD-DA. In these conditions, percentages between 82% and 100% can be obtained for discrimination of individual classes by using the statistical models (model accuracies for each honey category was: 82%—linden, 90%—colza, 92%—acacia, and 100%—sunflower).
Artificial neural networks (ANNs) were also applied for food authentication investigation [
17]. In this study, it was tested the possibility to use isotopic and elemental data and ANNs models for discriminations of various honey types (acacia, linden, honeydew, colza, allium verum, coriander, sunflower, thyme, raspberry, lavender, and chestnut) from Romania (50 samples) and France (46 samples). It was proved that by involving this approach, a prediction model for geographical recognition can be developed with an accuracy of 96%.
The potential of ATR-FTIR diamond in discrimination of the geographical and botanical origins of different honey types from Romania and France has been also tested in correlation with a supervised classification method, namely, soft independent modeling class analogy (SIMCA) [
18]. In this work, it was proved that a spectral range between 880 and 1600 cm
−1 can be successfully used for botanical and geographical investigations if pre-processing data treatment (second derivative) and “autoscale” processing are applied to experimental spectra before the statistical classification. It was also shown that despite the most significant discriminators for both investigations are from the same spectral region, the discrimination power is 10 times lower for geographical recognition than for the floral origin identification. These results are also sustained by the interclass distances, which are quite modest for geographical classification, suggesting the reliability of this approach for honey floral discrimination. However, it was also demonstrated that the geographical differentiation inside a single class of honey variety is possible by using this approach due to the fact that a correct classification with a significant interclass distance was obtained. A prediction model based on ATR-FTIR spectral data and PLS-DA statistical method has been recently developed for botanical and geographical origin differentiation, and also for harvesting year discrimination [
10]. Thus, considering this approach, 83% of the investigated samples have been correctly assigned in relation to their botanical origin when four honey varieties were employed, while, for geographical discrimination, 91% of the Transylvanian samples and 85% of the samples produced in other regions were successfully identified. Moreover, for harvest recognition, true positive rates of 95% and 97% have been obtained for the 2020 and 2021 harvesting years, allowing a correct assignment of 105 out of 109 honey samples [
19].
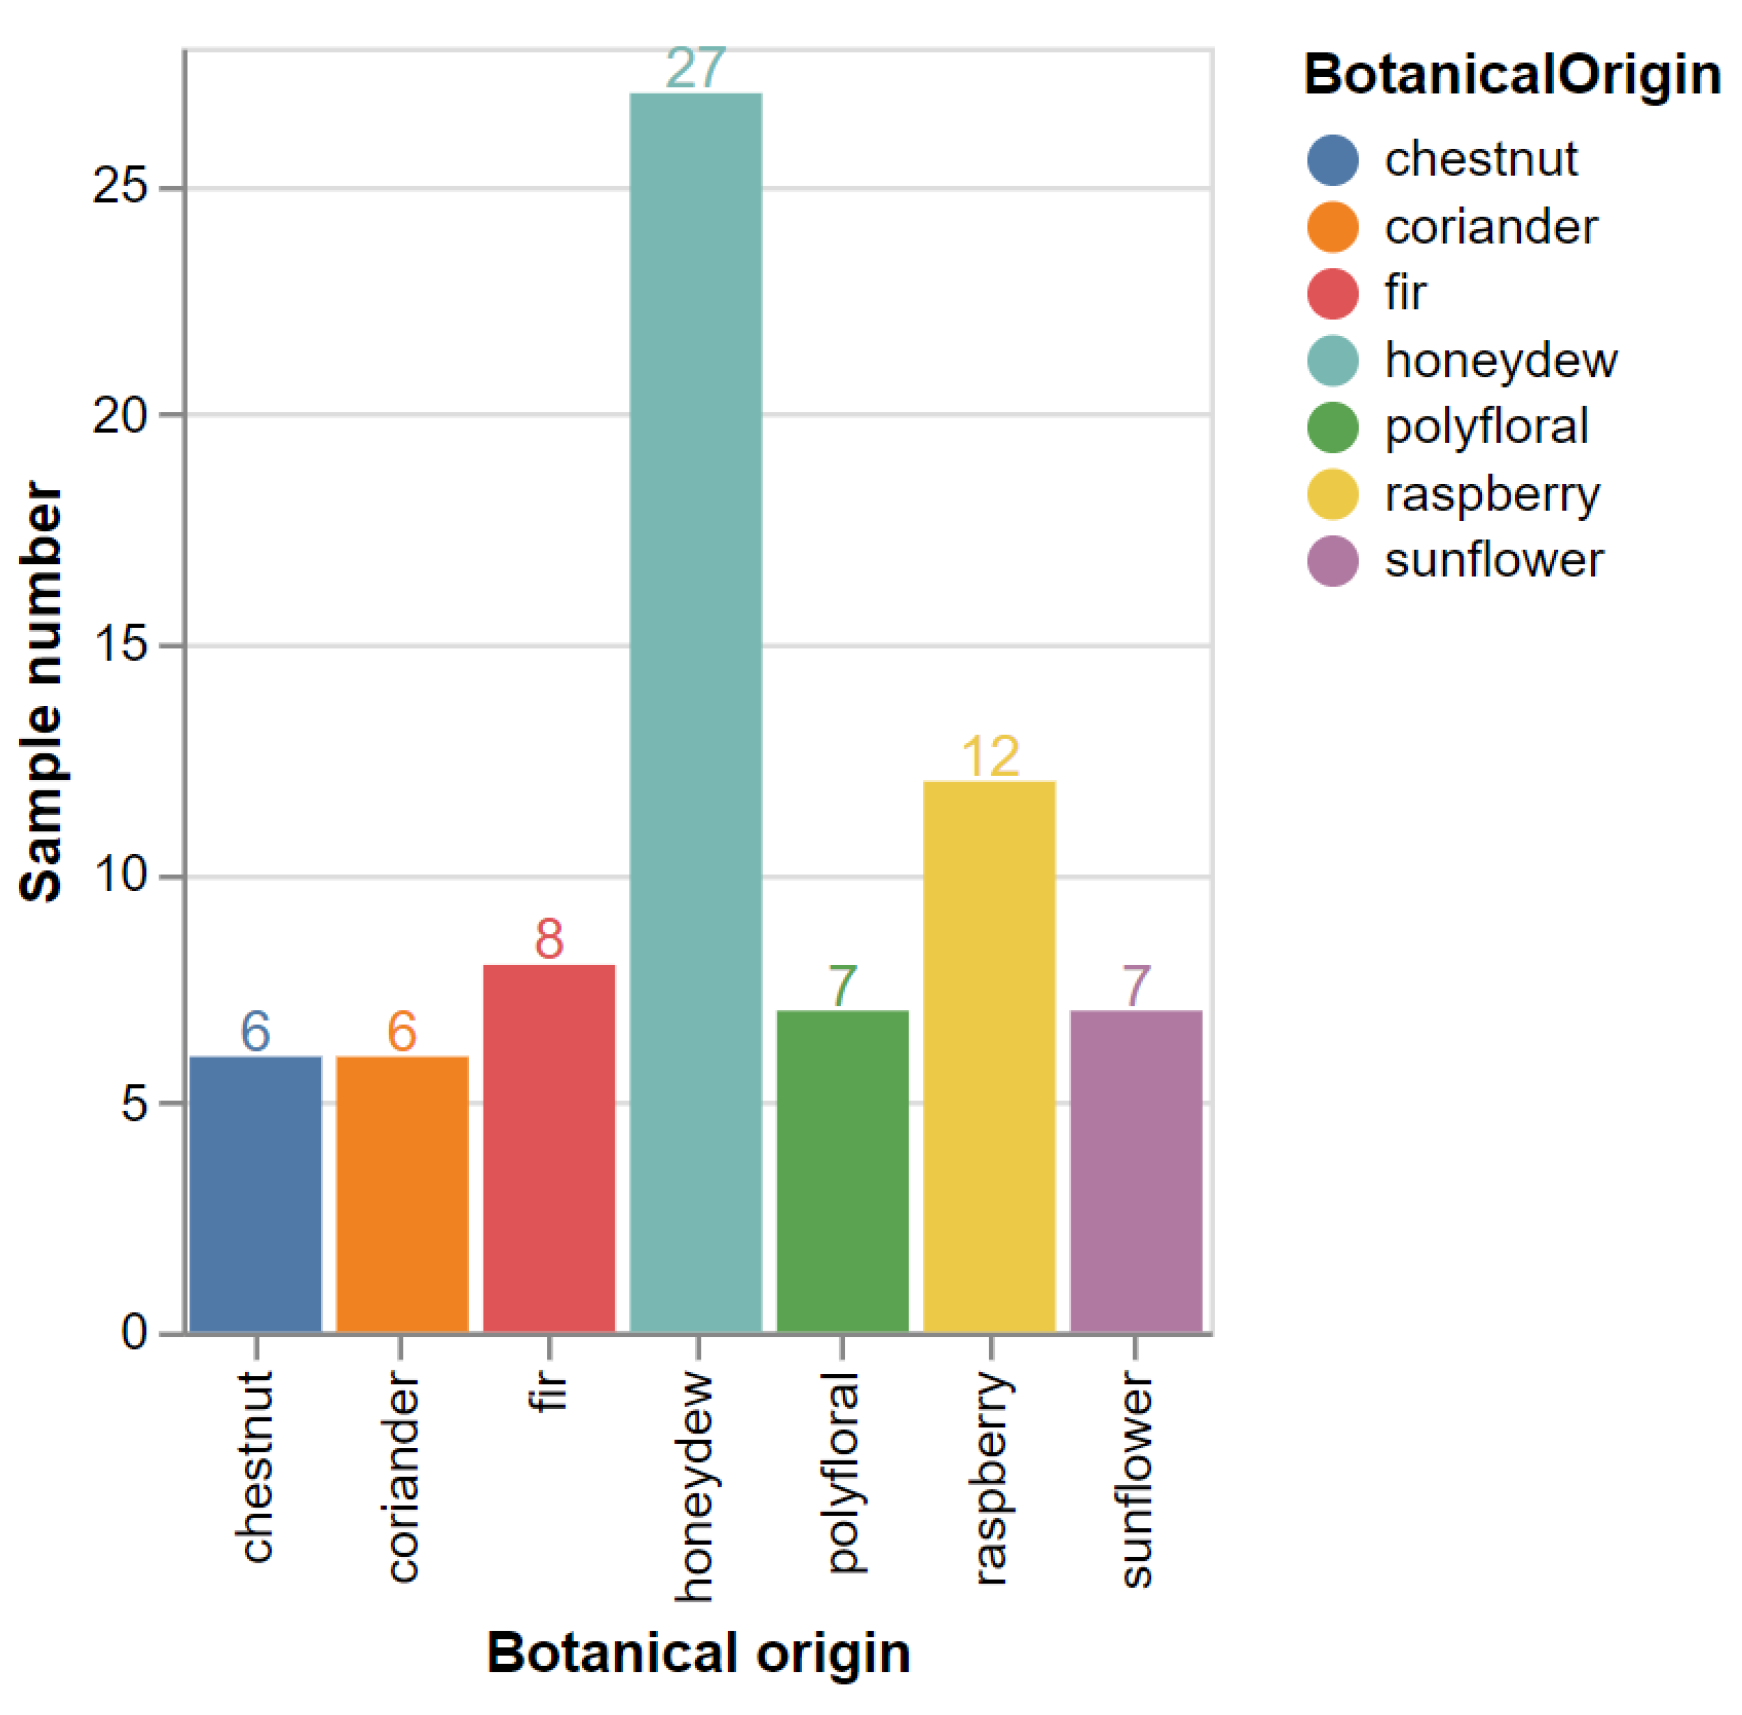
This study proposes a new approach for the development of prediction models able to classify 73 honey samples belonging to seven different botanical origins. The present study aims to compare the prediction models that were obtained either by using a supervised method (PLS-DA) or artificial intelligence (SVM). In this regard, the classification power of the developed models was assessed by means of the ten-fold cross-validation evaluation procedure and then the obtained values were compared.
3. Results
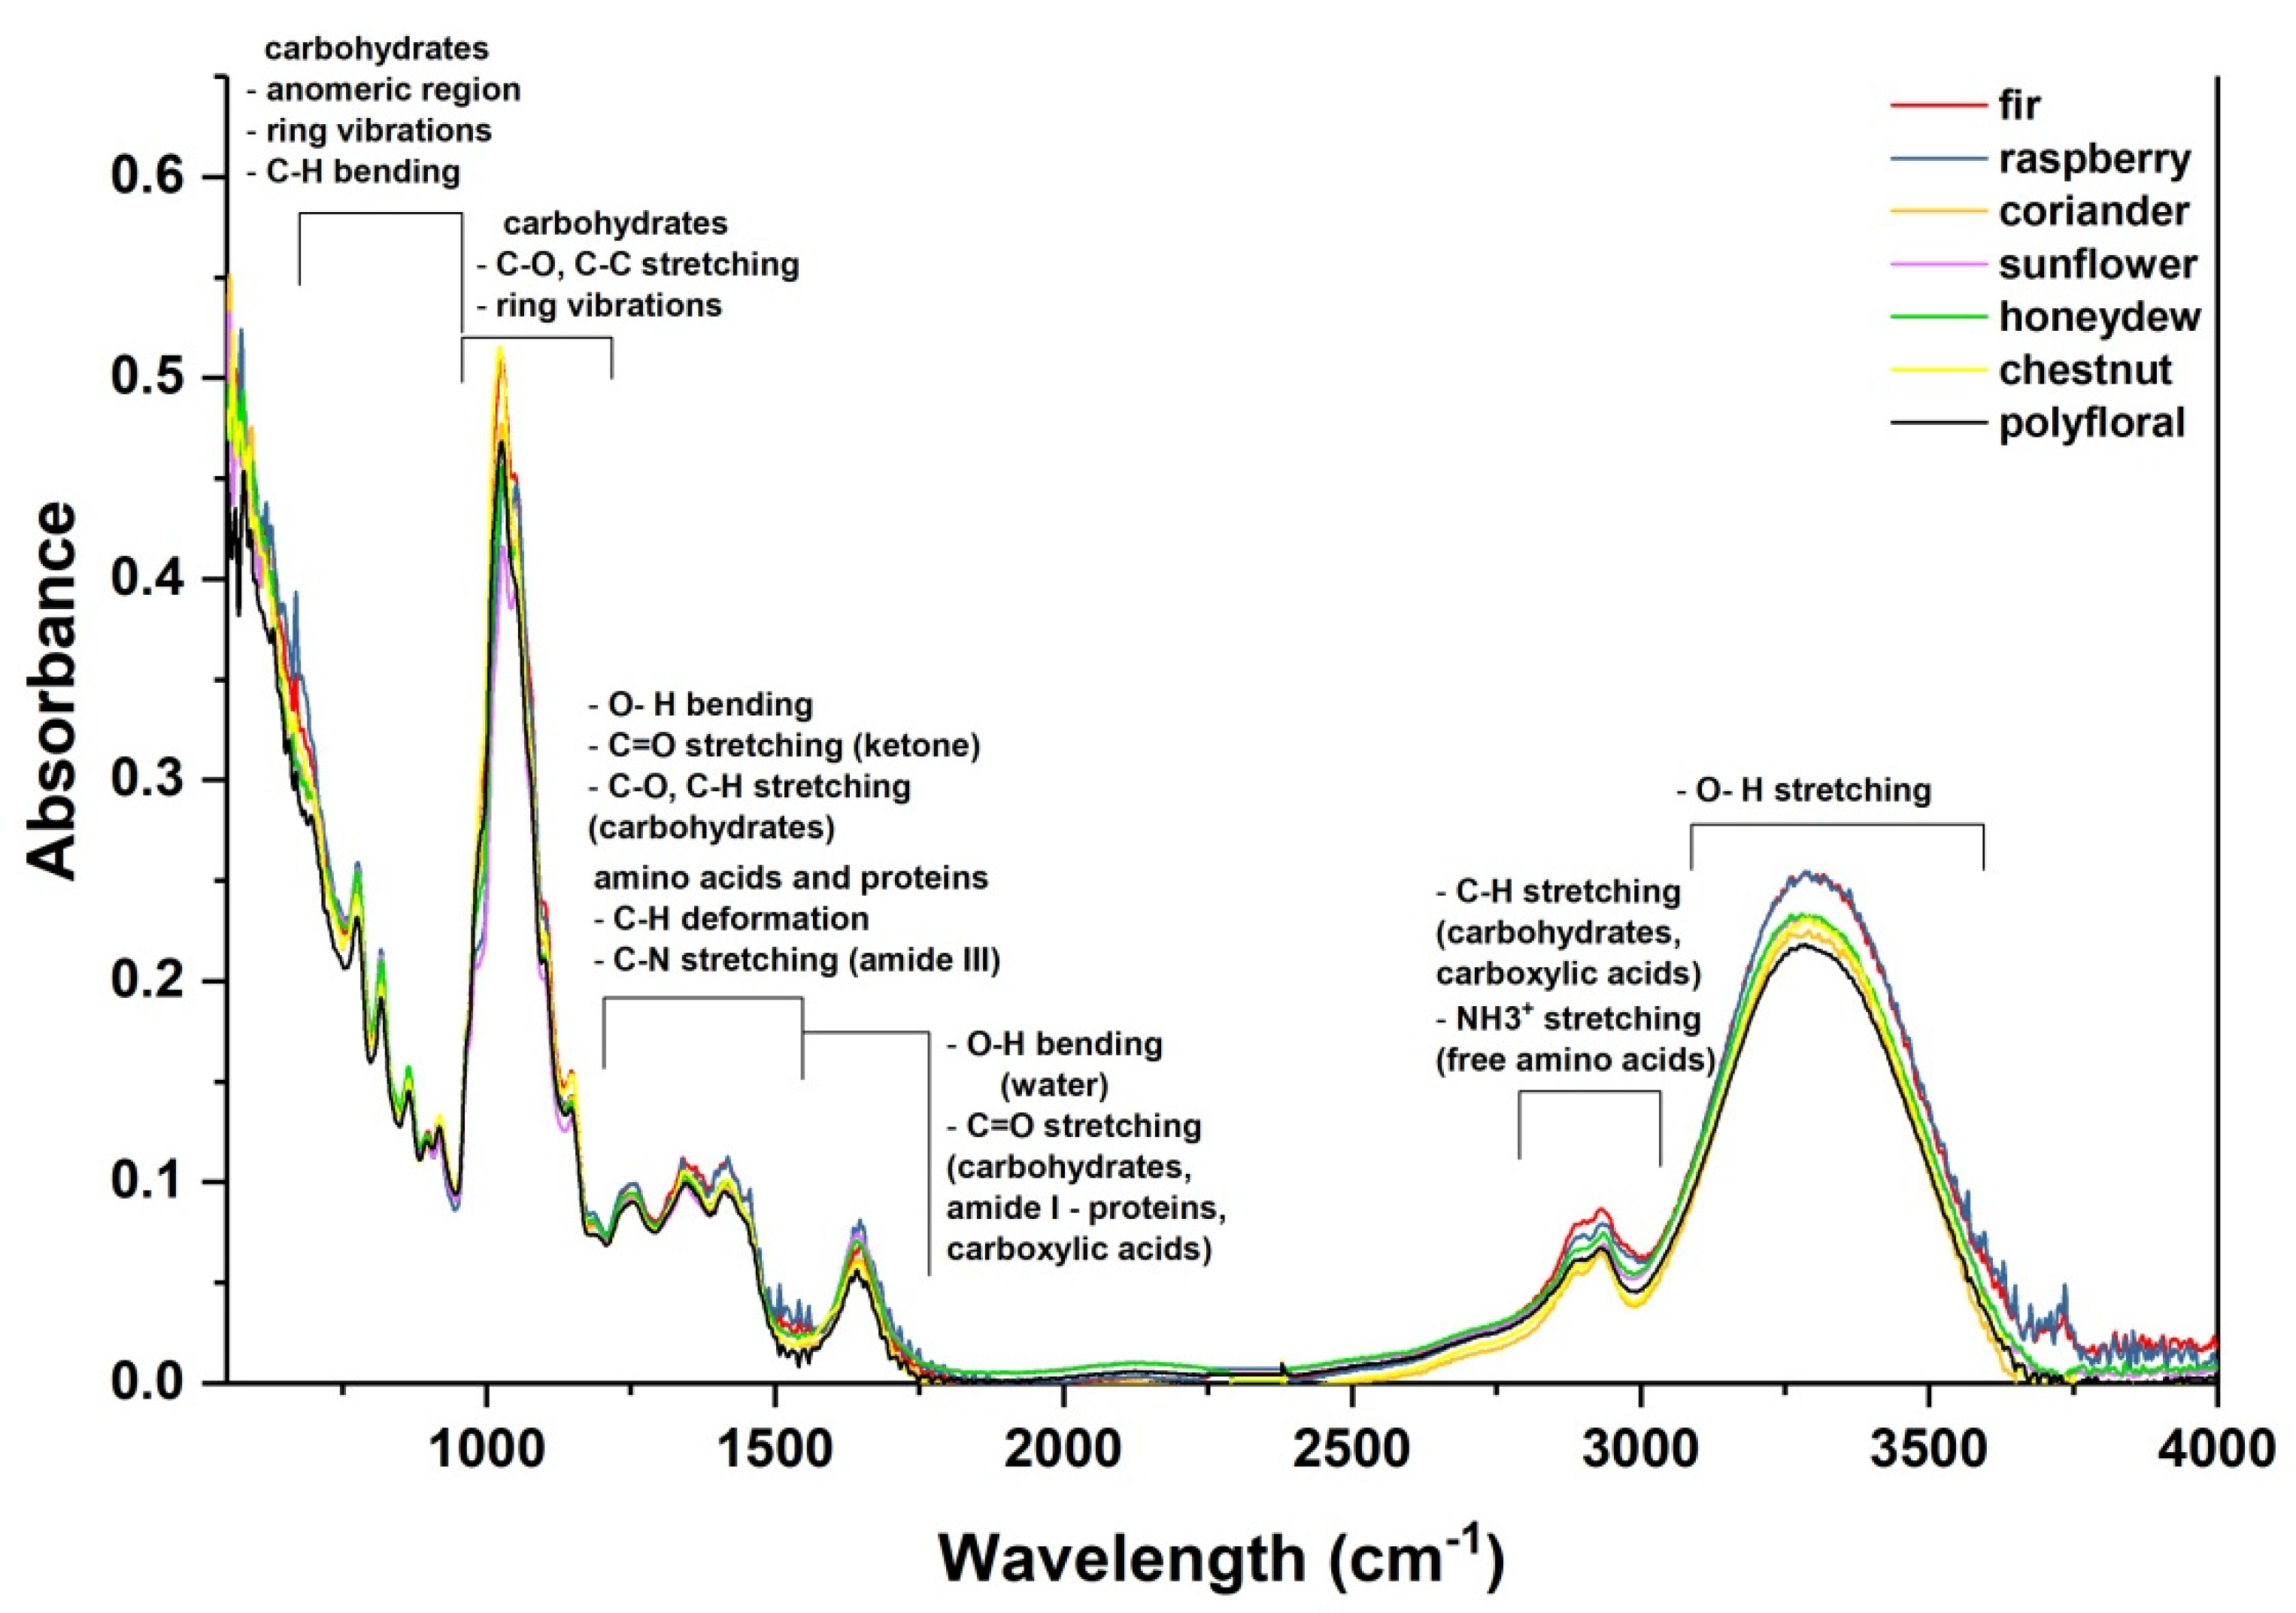
All honey spectra were recorded in the spectral range 550–4000 cm
−1.
Figure 2 presents the FTIR spectra of fir, chestnut, coriander, sunflower, honeydew, polyfloral, and raspberry honey species for better visualization of the samples’ characteristics.
As it was previously discussed in the literature [
3,
9], six representative regions can be emphasized in the ART-FTIR spectra of honey (
Figure 2). The large band at 3000–3600 cm
−1 is associated with the carbohydrates and O-H stretching vibrations. The peaks in some spectral ranges (i.e., 2800 to 3000 cm
−1; 1170–1750 cm
−1) can be attributed to minor compounds such as amino acids, proteins, and organic acids.
The most visible differences can be observed in the fingerprint region between 550 and 1775 cm−1 which are attributed to the carbohydrates and O-H stretching vibrations from water, but there are also overlapping bands that correspond to the minor constituents of the honey, both organic and inorganic, which are characteristic to the botanical origin of the honey samples. For this study, only this region was considered for the classification model because it contains the most significant features that differentiate the chemical composition of the honey varieties and reduces the data dimensionality.
4. Discussion
4.1. Models Based on Statistical Methods
In this work, the possibility of developing classification models able to detect subtle differences between very similar honey classes (i.e., fir and honeydew honey) has been prospected. In this regard, new recognition models for the individual differentiation of fir, chestnut, coriander, sunflower, honeydew, and raspberry honey samples were developed using the PLS-DA statistical method.
For the development of the botanical differentiation models, a pre-processing treatment consisting in the application of the 1st derivative followed by an autoscale step was performed on the raw experimental data. For each individual botanical differentiation of the honey samples, a first classification model was conducted by applying PLS-DA on the entire FTIR fingerprint range. Then, a model-based variable selection using PLS was performed with the aim of identifying the spectral points that have the highest discrimination potential. Taking into consideration only those features, a final PLS-DA model was built with respect to each desired botanical origin assessment.
The first discrimination model was developed to differentiate the chestnut honey from the rest of the samples. In this regard, two groups were compared, one formed by six chestnut samples while the second one contained the remaining honey samples (fir, polyfloral, coriander, sunflower, honeydew, and raspberry). The constructed PLS-DA model conducted to the correct assessment of 98.7% of the chestnut samples when the entire spectral range was used; only one honeydew sample was misclassified and wrongly attributed to the chestnut group. The variable reduction step had as result a diminishing of data dimension from 1246 variables to 377. In this case, this step did not have any effect on the further improvement of the model prediction, with the model accuracy remaining the same (98.6%).
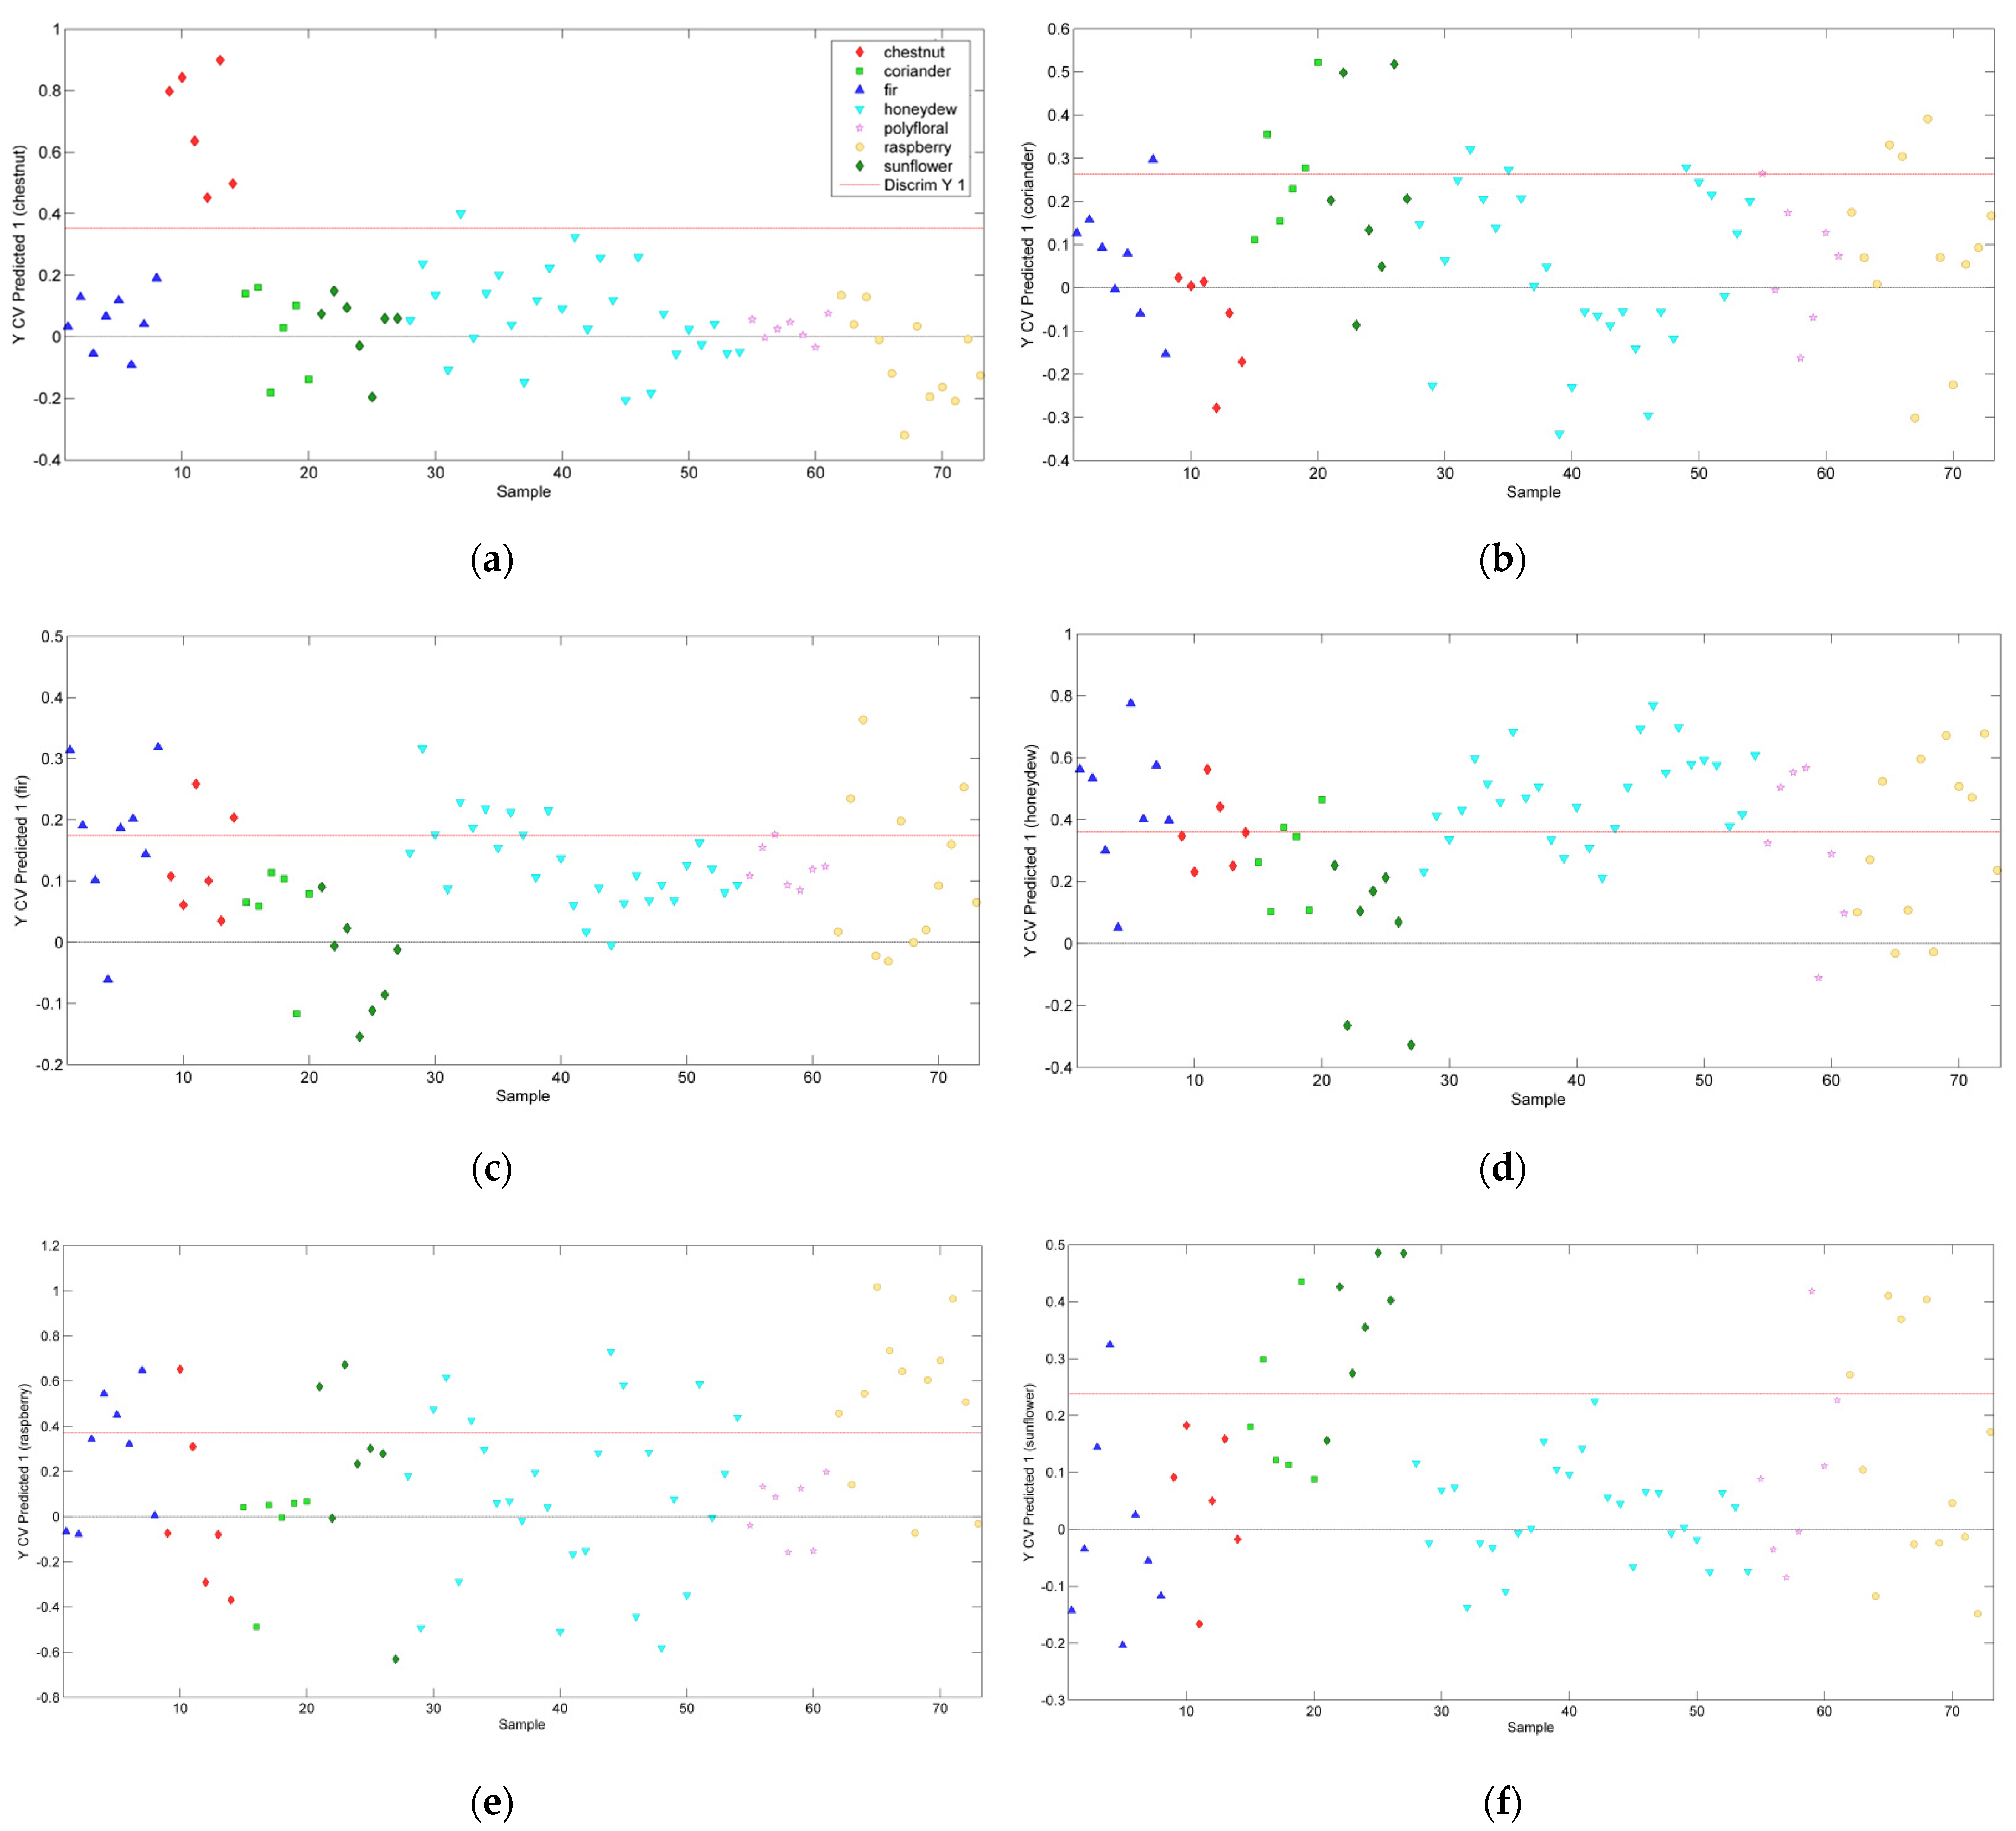
The model built to discriminate coriander honey from the rest of the samples conducted to the correct classification of 82% of the samples when the entire fingerprint region was taken into account. When the model-based feature selection was applied, it was observed that there are 377 significant variables that mainly contributed to the coriander honey classification. Therefore, a second model for the coriander honey differentiation was conducted only on these markers, though the data dimensionality reduction did not conduct to an improvement of the model prediction. In this case, just three coriander samples were correctly classified, while one fir, three honeydew, one polyfloral, and three raspberry samples were wrongly assigned to the coriander botanical class (
Figure 3c).
The PLS-DA model developed for the fir honey discrimination had a correct prediction rate of 72.6% when the entire fingerprint spectral range was employed for the model construction. The variable selection step allowed a drastic decrease in the dimensionality of the input data, namely out of 1246, 35 were selected as meaningful features. The subsequent model built only on this reduced data set had an accuracy of 75.3%. In this case, from 8 fir samples, 5 were correctly attributed, while the other 15 samples from the remaining group were wrongly assigned to the fir group. Misassignments were expected in this classification taking into account the existing similarities between fir and honeydew samples. Thus, the 15 misclassified samples attributed to the fir group had the following distribution: honeydew (8), raspberry (4), chestnut (2), and polyfloral (1).
The PLS-DA model developed for discriminating the honeydew class from the rest of the botanical origins conducted to a correct assignment of 65% of the honeydew samples when the total number of spectral points was used as input data. After the dimensionality reduction step, 387 markers were observed to have a higher discrimination potential, and the PLS-DA model constructed on these markers led to the same performance of the model. The obtained classification percentage was due to the fact that 6 honeydew samples were misclassified, and the other 17 samples (6 fir, 2 coriander, 3 polyfloral, and 6 raspberry) were predicted as honeydew (
Figure 3d).
The model created for the raspberry honey differentiation had a correct prediction rate of 76% when the entire fingerprint spectral range was used for model construction. The variable selection step illustrated a decrease in the dimensionality of the input data, namely 144 points were selected as meaningful features. The model built only on the reduced data set had a prediction of 78%. As shown in
Figure 3e, from 12 raspberry samples, 9 were correctly attributed, and 13 other samples were attributed to the raspberry class as follows: fir (3), chestnut (1), sunflower (2), and honeydew (7).
The sunflower honey differentiation model led to an 85% accuracy when the entire fingerprint region was considered. When the feature selection tool was applied, 377 meaningful markers were obtained and further used for the model that gave an accuracy of 87.6%. In this case, one sunflower sample was misclassified and one fir, two coriander, one polyfloral, and four raspberry were predicted as sunflower (
Figure 3f).
4.2. Machine Learning Based Models
For the models obtained by the application of artificial intelligence, the data set was firstly pre-processed through the 1st derivative and then by the autoscale method. In accordance with the PLS-DA models, for each individual botanical differentiation, a first SVM classifier was conducted based on the entire FTIR fingerprint range. Subsequently, with the aim of improving the classification accuracy, another SVM model was developed using only the significant markers obtained from model-based feature selection.
The SVM model for chestnut honey differentiation conducted to the correct assessment of 97% of the samples in the cross-validation evaluation technique when the entire spectral range was used as input data. The performance of the SVM classifier increased to a 98% accuracy when only the significant markers were considered for the development of the prediction model.
Reliable classification results were also obtained in the case of the SVM models built for fir honey differentiation. Therefore, 89% of the samples were correctly attributed when the entire fingerprint was taken into account. Once again, the prediction ability of the SVM model increased when the input data corresponded only to the significant attributes (i.e., spectral points), namely a 90% accuracy was obtained during the cross-validation technique.
The SVM model capable to differentiate the coriander honey from the rest gave a correct prediction of 92%. When the input data was reduced to the significant spectral points, no improvement was observed.
When the honeydew botanical source aimed to be discriminated from the rest of the classes using the entire fingerprint range, an accuracy of 65% was obtained through the investigated machine learning technique. The SVM models constructed on the markers that have a higher discrimination power, and 66% of the samples were correctly assigned to their botanical group.
The differentiation model for raspberry honey that used all the spectral data led to an accuracy of 85%. By applying the SVM algorithm on the data illustrating only the identified meaningful markers, the model’s accuracy raised to 92%.
Lastly, for the sunflower honey discrimination, the SVM model that was developed on the entire fingerprint region conducted to a 92% accuracy. When the input space was reduced to the most relevant features, 93% of the samples were correctly classified.
The SVM models previously described correspond to the most efficient classifiers, as resulted from the grid search approach. Their configurations are presented in
Table 1.
5. Conclusions
This study proposes the development of new honey botanical recognition models based on the corroboration between ATR-FTIR spectroscopy and either supervised chemometric method or artificial intelligence. In this way, it was possible to perform a comparison between the efficiency of the recognition models built using advanced statistical methods and those performed based on artificial intelligence. For the models based on the supervised method PLS-DA, the dimensionality reduction step led in some cases to an improvement of the classification rate. The comparison of the models’ performances developed on PLS-DA with those based on SVM clearly resulted in a better classification rate of three out of five developed models. Thus, for fir differentiation model using SVM an increased performance of 15% (from 75% using PLS-DA to 90%), for coriander a 10% increase, for raspberry an increase of 78% to 92%, and for sunflower an increase from 87% to 93% was observed. In contrast, in the other discrimination classes chestnut and honeydew the performances remained the same. Overall, the developed differentiation models can be considered to be effective for the assumed purpose taking into account that we tried to emphasize differences between very similar honey varieties (i.e., fir and honeydew samples). By including into investigations of the polyfloral honey types, it was expected to get a lower classification of the developed models by considering that in these honey varieties, a mixture of several floral contributions in distinct percentages can be found.


 ,
, 
