Article

Evaluation of Mushrooms Based on FT-IR Fingerprint and Chemometrics

by
Ioana Feher
1,
Cornelia Veronica Floare-Avram
1,*,
Florina-Dorina Covaciu
1,
Olivian Marincas
1,
Romulus Puscas
1,
Dana Alina Magdas
1 and
Costel Sârbu
2
1
National Institute for Research and Development of Isotopic and Molecular Technologies, 67-103 Donat Street, 400293 Cluj-Napoca, Romania
2
Faculty of Chemistry and Chemical Engineering, Babeș-Bolyai University, 11 Arany János, 400028 Cluj-Napoca, Romania
*
Author to whom correspondence should be addressed.
Appl. Sci. 2021, 11(20), 9577; https://doi.org/10.3390/app11209577
Submission received: 24 September 2021 / Revised: 12 October 2021 / Accepted: 13 October 2021 / Published: 14 October 2021
(This article belongs to the Special Issue Emerging Technologies in Food and Beverages Authentication)

Abstract

:
Edible mushrooms have been recognized as a highly nutritional food for a long time, thanks to their specific flavor and texture, as well as their therapeutic effects. This study proposes a new, simple approach based on FT-IR analysis, followed by statistical methods, in order to differentiate three wild mushroom species from Romanian spontaneous flora, namely, Armillaria mellea, Boletus edulis, and Cantharellus cibarius. The preliminary data treatment consisted of data set reduction with principal component analysis (PCA), which provided scores for the next methods. Linear discriminant analysis (LDA) managed to classify 100% of the three species, and the cross-validation step of the method returned 97.4% of correctly classified samples. Only one A. mellea sample overlapped on the B. edulis group. When kNN was used in the same manner as LDA, the overall percent of correctly classified samples from the training step was 86.21%, while for the holdout set, the percent rose to 94.74%. The lower values obtained for the training set were due to one C. cibarius sample, two B. edulis, and five A. mellea, which were placed to other species. In any case, for the holdout sample set, only one sample from B. edulis was misclassified. The fuzzy c-means clustering (FCM) analysis successfully classified the investigated mushroom samples according to their species, meaning that, in every partition, the predominant species had the biggest DOMs, while samples belonging to other species had lower DOMs.

1. Introduction

Edible mushrooms have been recognized as a highly nutritional food for a long time, thanks to their specific flavor and texture, as well as their therapeutic effects. From the nutritional point of view, mushrooms represent an important source of proteins, fibers, minerals, and polyunsaturated fatty acids, with large variations in their proportions among different species. Regarding vitamin content, it represents the only vegetarian source of vitamin D [1] as well as an important source of B group vitamins [2]. Moreover, mushrooms serve also as a vegetarian source of protein [3]. On the other hand, wild mushrooms are thought to be richer in flavor, taste, texture, nutrition, and medical effects [4].
Thanks to their beneficial effects on human health, their demand is continuously growing and is expected to grow even more in the future. It is well known that, because of their soft texture, mushrooms have a short lifetime, around five days, and different types of post-harvest procedures are usually applied in order to preserve their availability as long as possible [5]. There are three main classes of preservation procedures: thermal (drying/freezing), chemical (edible coatings, film, washing solutions), and physical (packing, irradiation, pulse electric field, ultrasound) [6]. Another reason for applying conservation steps in mushrooms’ preparation is the seasonal variability of some wild species. All these conservation methods also contribute to the preservation of their nutritional and nutraceutical values. Every procedure has advantages and drawbacks; for example, the drying process, which is the first method of choice [7], offers a more flavorful taste of dried mushrooms compared with fresh ones, but modifies the content of bioactive compounds and nutrients [8].
In Romania, for the fifth consecutive year, the market recorded an increase in the quantities of exported wild mushrooms. The main destination countries were Italy, followed by Hungary and Spain. China is the main producer of cultivated, edible mushrooms. Collecting wild edible mushrooms for consumption is widely practiced in many countries, including Romania [9,10]. The consumption of mushrooms is expected to increase, as consumers are becoming aware of the helpful benefits when incorporated into the diet [11].
Among all available analytical techniques able to evaluate different types of compounds in food matrices, such as nuclear magnetic resonance (NMR) and high-performance liquid chromatography (HPLC) [12], Fourier-transform infrared spectroscopy (FT-IR) is one of the most widely used methods to identify chemical compounds and elucidate chemical structure, displaying, as main its advantages, rapid, reagent-less, and high-throughput operation within a wide range of matrices [13]. It allows rapid and simultaneous characterization of different functional groups, such as lipids, proteins, and polysaccharides [14]. For food quality and control field, FT-IR spectroscopy is an important tool, owing to low operating costs and good performance [15]. The record FT-IR spectra represent a global assessment of a specific matrix, more precisely, a molecular fingerprint, which is very suitable for the characterization, differentiation, or identification of different matrices, including mushrooms [16]. Moreover, the complexity of experimental data obtained through this technique requires special treatment in order to extract meaningful results. The corroboration between a rapid analytical technique and chemometric methods offers the advantage of providing a more comprehensive characterization of the food matrix and could highlight novel insights, which otherwise could not have been identified.
In the food field, for authentication and traceability purposes, a large number of samples are needed. It is important to assure the representativeness of each type/category of data in the discussion, which sometimes might be difficult to reach. One limitation of this aim is represented by the availability and perishability of investigated matrices, as in the case herein.
The aim of the present study was the differentiation of the three investigated mushroom species (Armillaria mellea, Boletus edulis, and Cantharellus cibarius) through the development of a differentiation tool, made up of a fast and efficient analytical technique coupled with different chemometric methods. The novelty of this approach lies in the application, besides other chemometric methods, of a data mining method, that is, the fuzzy c-means algorithm, for the differentiation of three types of wild mushrooms.

2. Materials and Methods

2.1. Sample Collection

To fulfill the aim of this study, 77 wild-grown mushroom samples, belonging to three different species—namely, Armillaria mellea, Boletus edulis, and Cantharellus cibarius—were collected and analyzed. The samples were collected during summer, in 2019, from different geographical areas located mainly near Cluj County, Romania. The distribution of samples according to their species was as follows: 12 samples of Armillaria mellea, 31 samples of Boletus edulis, and 34 samples of Cantharellus cibarius.

2.2. Sample Preparation and Analysis

In the laboratory, the samples were dried in an oven at 60 °C until constant weight. Subsequently, the dried samples were grounded into a fine powder and stored at 4 °C for further analysis. The powder of each sample was mixed uniformly with KBr and then pressed into a tablet using a tablet press.
The FT-IR spectrometer (PerkinElmer, Waltham, MA, USA) used to perform the analysis of mushrooms was equipped with a thermal deuterated triglycine sulfate (DTGS) detector. The spectral range was 4000–400 cm−1, with a resolution of 4 cm−1. For each sample, the spectrum consisted of 64 scans, which were performed intriplicate and averaged. After recording the spectra, and prior to other chemometric processing, all spectra were smoothed by Savitzky–Golay algorithms andthe linear baseline was corrected. The spectra were further imported into Origin Pro 2017 (Origin Lab, Northampton, MA, USA) and subjected to [0, 1] normalization.

2.3. Chemometrics Methods

All chemometric methods were carried out using SPSS Statistics version 24 (IBM, New York, NY, USA) software. The first method applied to normalized spectra was principal component analysis (PCA). This method is one of the most used unsupervised pattern techniques, and is able to divide a large data set into smaller components, called principal components (PC) or factors, minimizing the loss of original information. This analysis removes the multicollinearity among features, and combines the highly correlated variables into a set of uncorrelated variables (PCs).The obtained PCs appear in decreasing order of importance, with their eigenvalues, which are a measure of a component’s significance to the data set variance, being an important aspect. Usually, the first two or three components retain a high percent of data variance. In this work, PCA was applied for reduction of the experimental data matrix, obtained after processing the FT-IR spectra. In this way, the obtained results were more efficiently processed further.
A widely employed supervised chemometric method used for classification purposes is linear discriminant analysis (LDA). Being a supervised method, a new variable must be created, and every sample receives a code corresponding to a different discrimination criterion. LDA will find linear combinations of variables, called discriminant functions (DFs), creating a predictive model. While constructing the model, the method tries to maximize the distance among classes and to minimize the distance within the same class, thus providing a robust classification model, which consists only of representative features. A validation step is also carried out, using “leave-one-out cross validation”, which implies the testing of each sample as a new one, using a model obtained without that sample [17].The model performances are evaluated through the percent of correctly classified samples, with a higher percent suggesting a stronger model. In this specific case, the LDA was applied for discovering the specific FT-IR bands, which can discriminate the three investigated mushroom species. By running LDA, a discrimination model was obtained, which was able to differentiate and classify the three analyzed classes of mushrooms, emphasizing the most representative FT-IR bands (fingerprint).
Apart from LDA, another widely used classification method is k nearest neighbor (kNN), which is one of the simplest machine learning algorithms. This method is based on similarities between new samples and available data, and puts the new sample within category that is most similar. An important aspect of this algorithm is that it does not need training (lazy algorithm), finds the neighbors nearest to the sample, and divides them into categories. Thus, kNN is suitable for multivariate classification and has high classification accuracy when the category boundary is obvious [18]. For prediction purposes of new mushroom samples, the kNN algorithm was chosen, because of its non-parametric nature, which implies the model structure determination from the dataset. This characteristic proved to be very helpful when working with real world datasets. For each sample that needs to be tested, the algorithm computes an Euclidian distance, finds the nearest neighbors (k neighbors), and returns the corresponding label.
Clustering is an unsupervised machine learning technique that implies the grouping of samples into different clusters; samples from the same cluster have a high degree of similarity, while samples from different clusters have a low degree of similarity. In fuzzy clustering, each point (sample) has a probability of belonging to each cluster, rather than completely belonging to just one cluster, as is the case in the traditional k-means method. Clustering and classification methods are useful for big data visualization, because they allow meaningful generalizations to be made by recognizing general patterns among them [19,20]. In fuzzy c-means clustering, each point has a weighting associated with a particular cluster, so a point does not lie “in a cluster” as long as the association to the cluster is weak. The fuzzy c-means algorithm, a method of fuzzy clustering, is an efficient algorithm for extracting rules and mining data from a dataset in which the fuzzy properties are highly common [21,22]. For this study, the main purpose of using c-means clustering is the partition of experimental datasets into a collection of clusters (mushrooms species), where, for each data point, a membership value is assigned for each class. Fuzzy c-means clustering implies two steps: the calculation of the cluster center, and the assignment of the sample to this center using a form of Euclidian distance. These two steps are repeated until the center of each cluster is stable, which means that every sample belongs to the correct cluster.

3. Results and Discussion

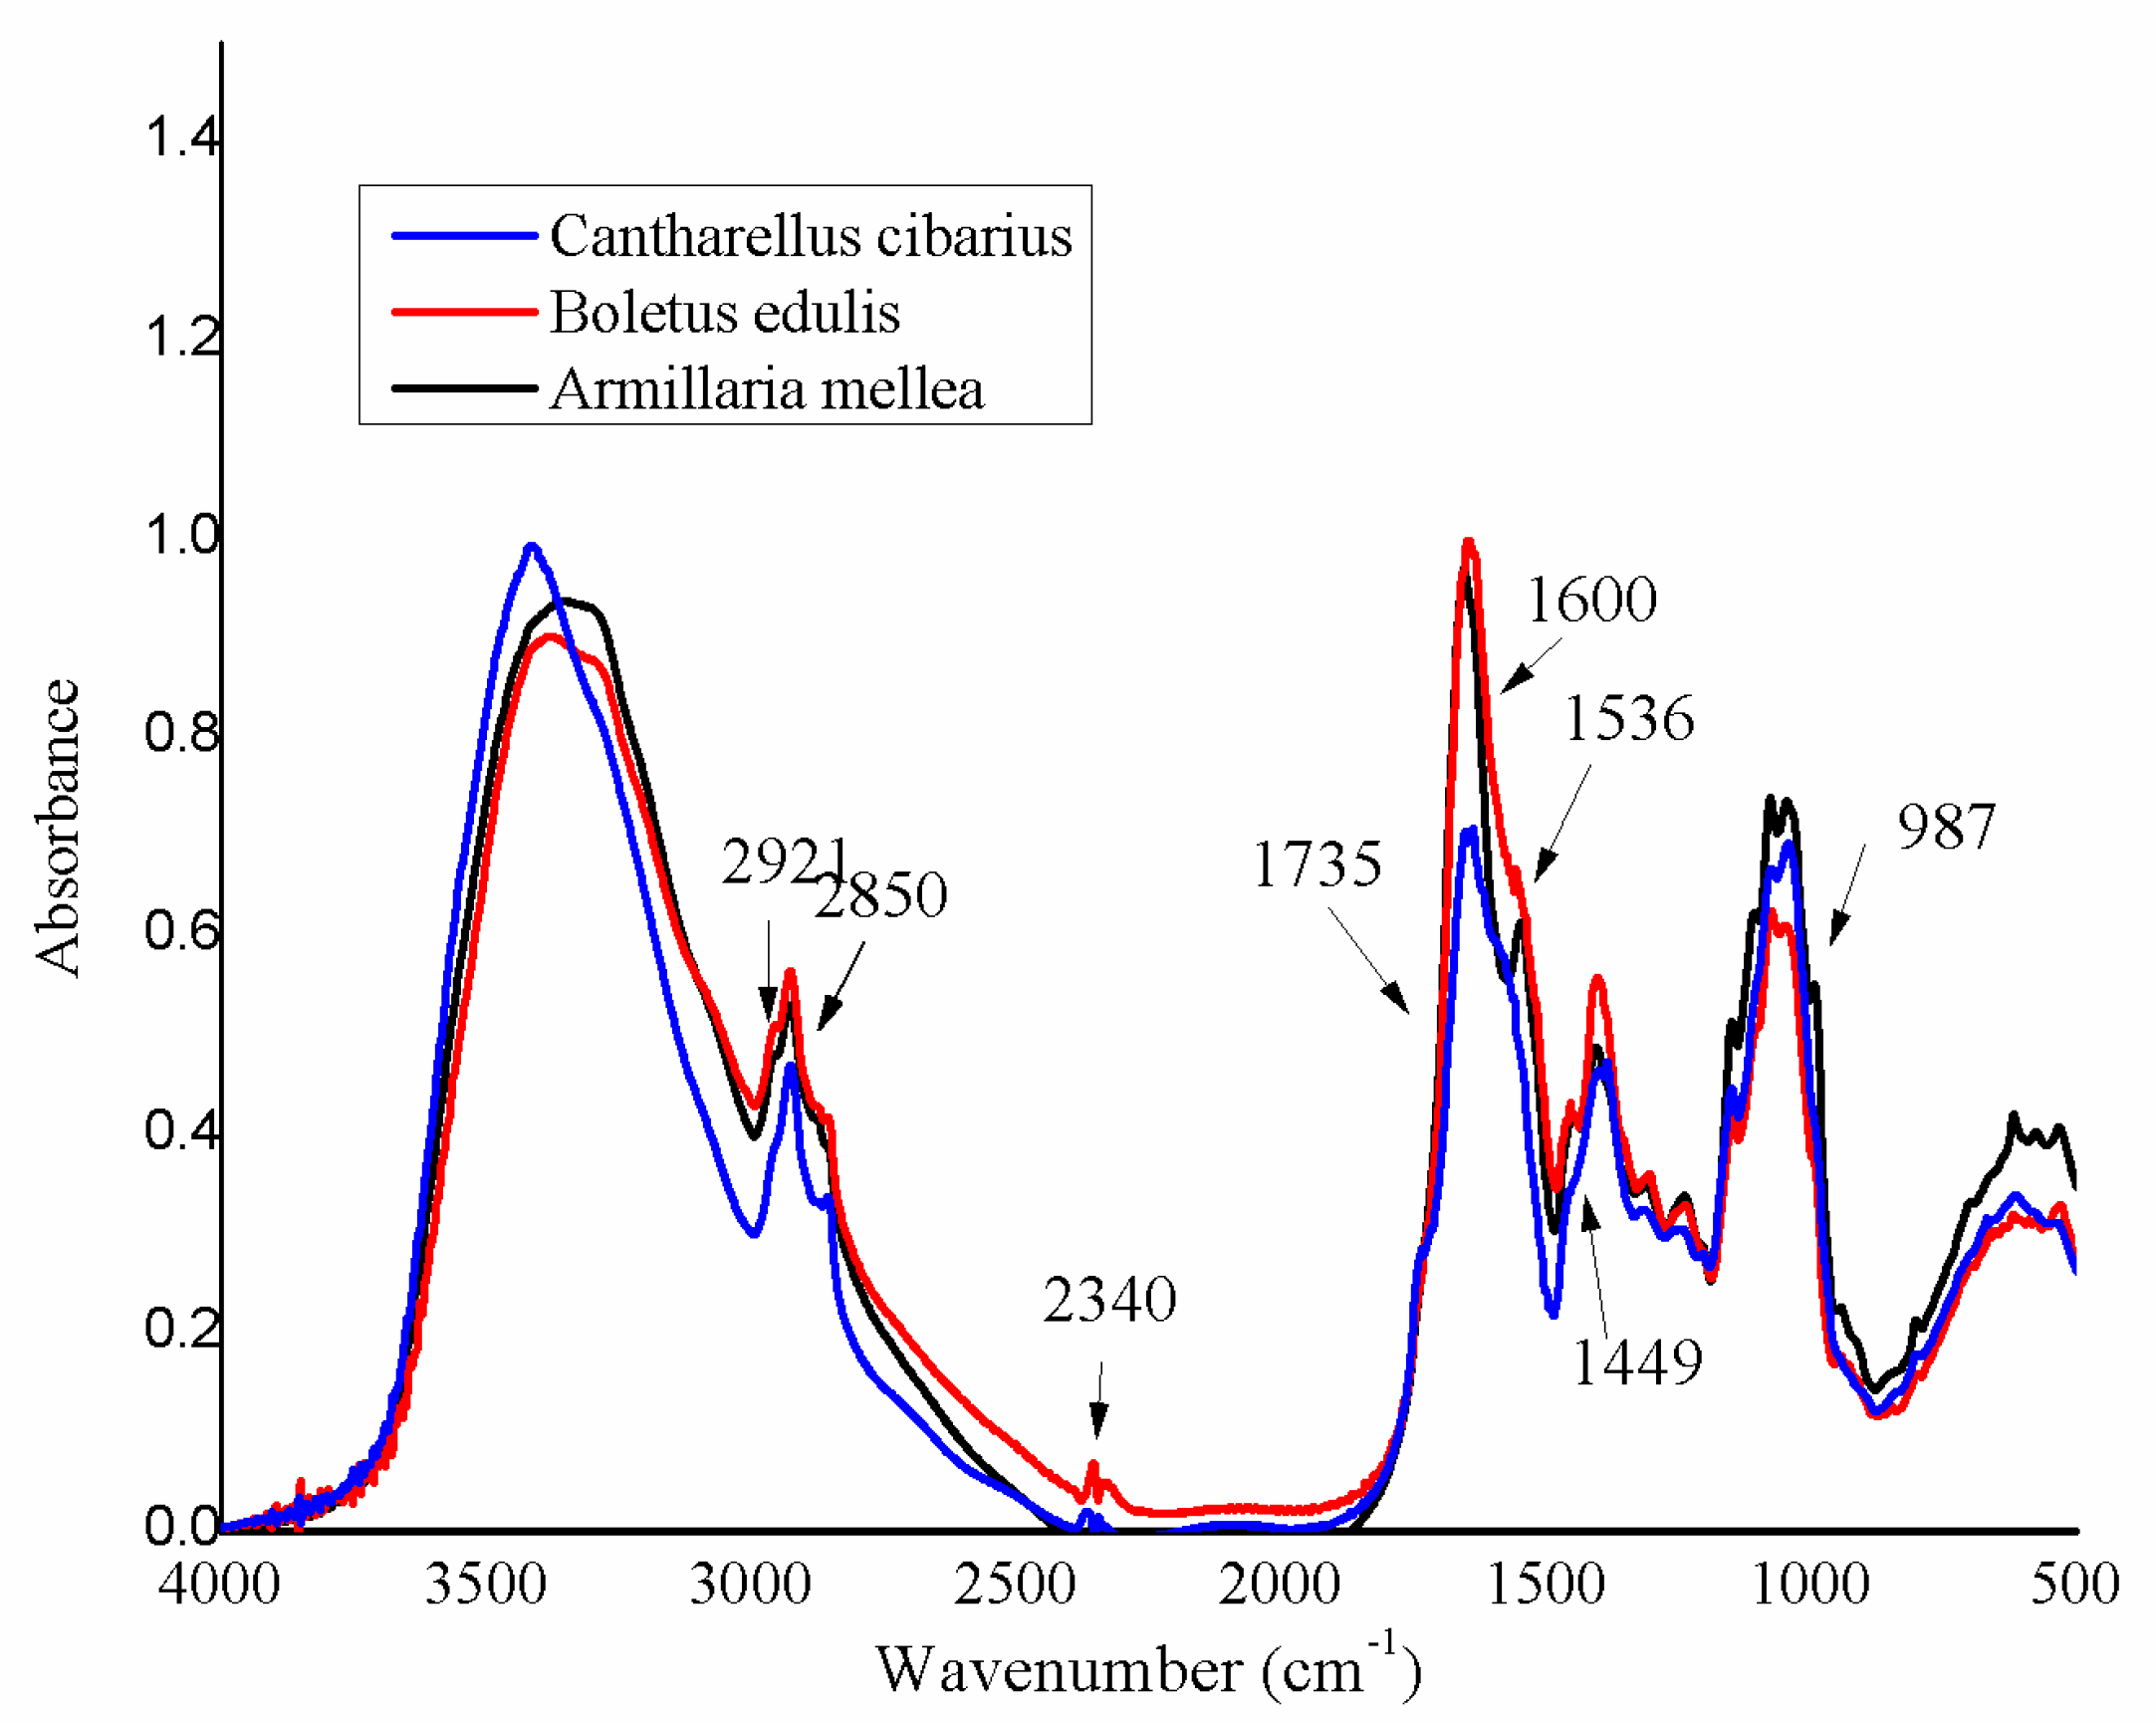
3.1. FT-IR Initial Spectra of Mushroom Samples

As previously mentioned, 77 wild-grown mushroom samples, belonging to three different species—namely, Armillaria mellea, Boletus edulis, and Cantharellus cibarius—were analyzed. The experimental spectra are presented in Figure 1.
At the first visual inspection of mushroom samples, the most relevant differences in the spectra seem to be situated around the bands from 2921 cm−1, 2340 cm−1, 1735 cm−1, 1600 cm−1, 1546 cm−1, 1433 cm−1, and 987 cm−1. According to the literature, the organic compounds responsible for these differences are as follows: saturated aliphatic esters (1750, 1733, and 1710 cm−1); melanin (1600 cm−1); amide II group, mainly chitosan (1582, 1550, and 1536 cm−1); and polysaccharides (1450–1425 and 1415 cm−1) [23]. Peaks in the region of 1000–400 cm−1 mainly belong to polysaccharides, such as β-d-glucans and the pyranose form of glucose [24].
The impossibility to identify all spectral differences, especially the subtle one, among the analyzed species, is not surprising for spectroscopic analysis of complex matrices; therefore, different chemometric methods are required in order to give a better and more comprehensive characterization of matrices. One big advantage of chemometric methods is that they highlight “hidden” information, which otherwise could have not been identified.

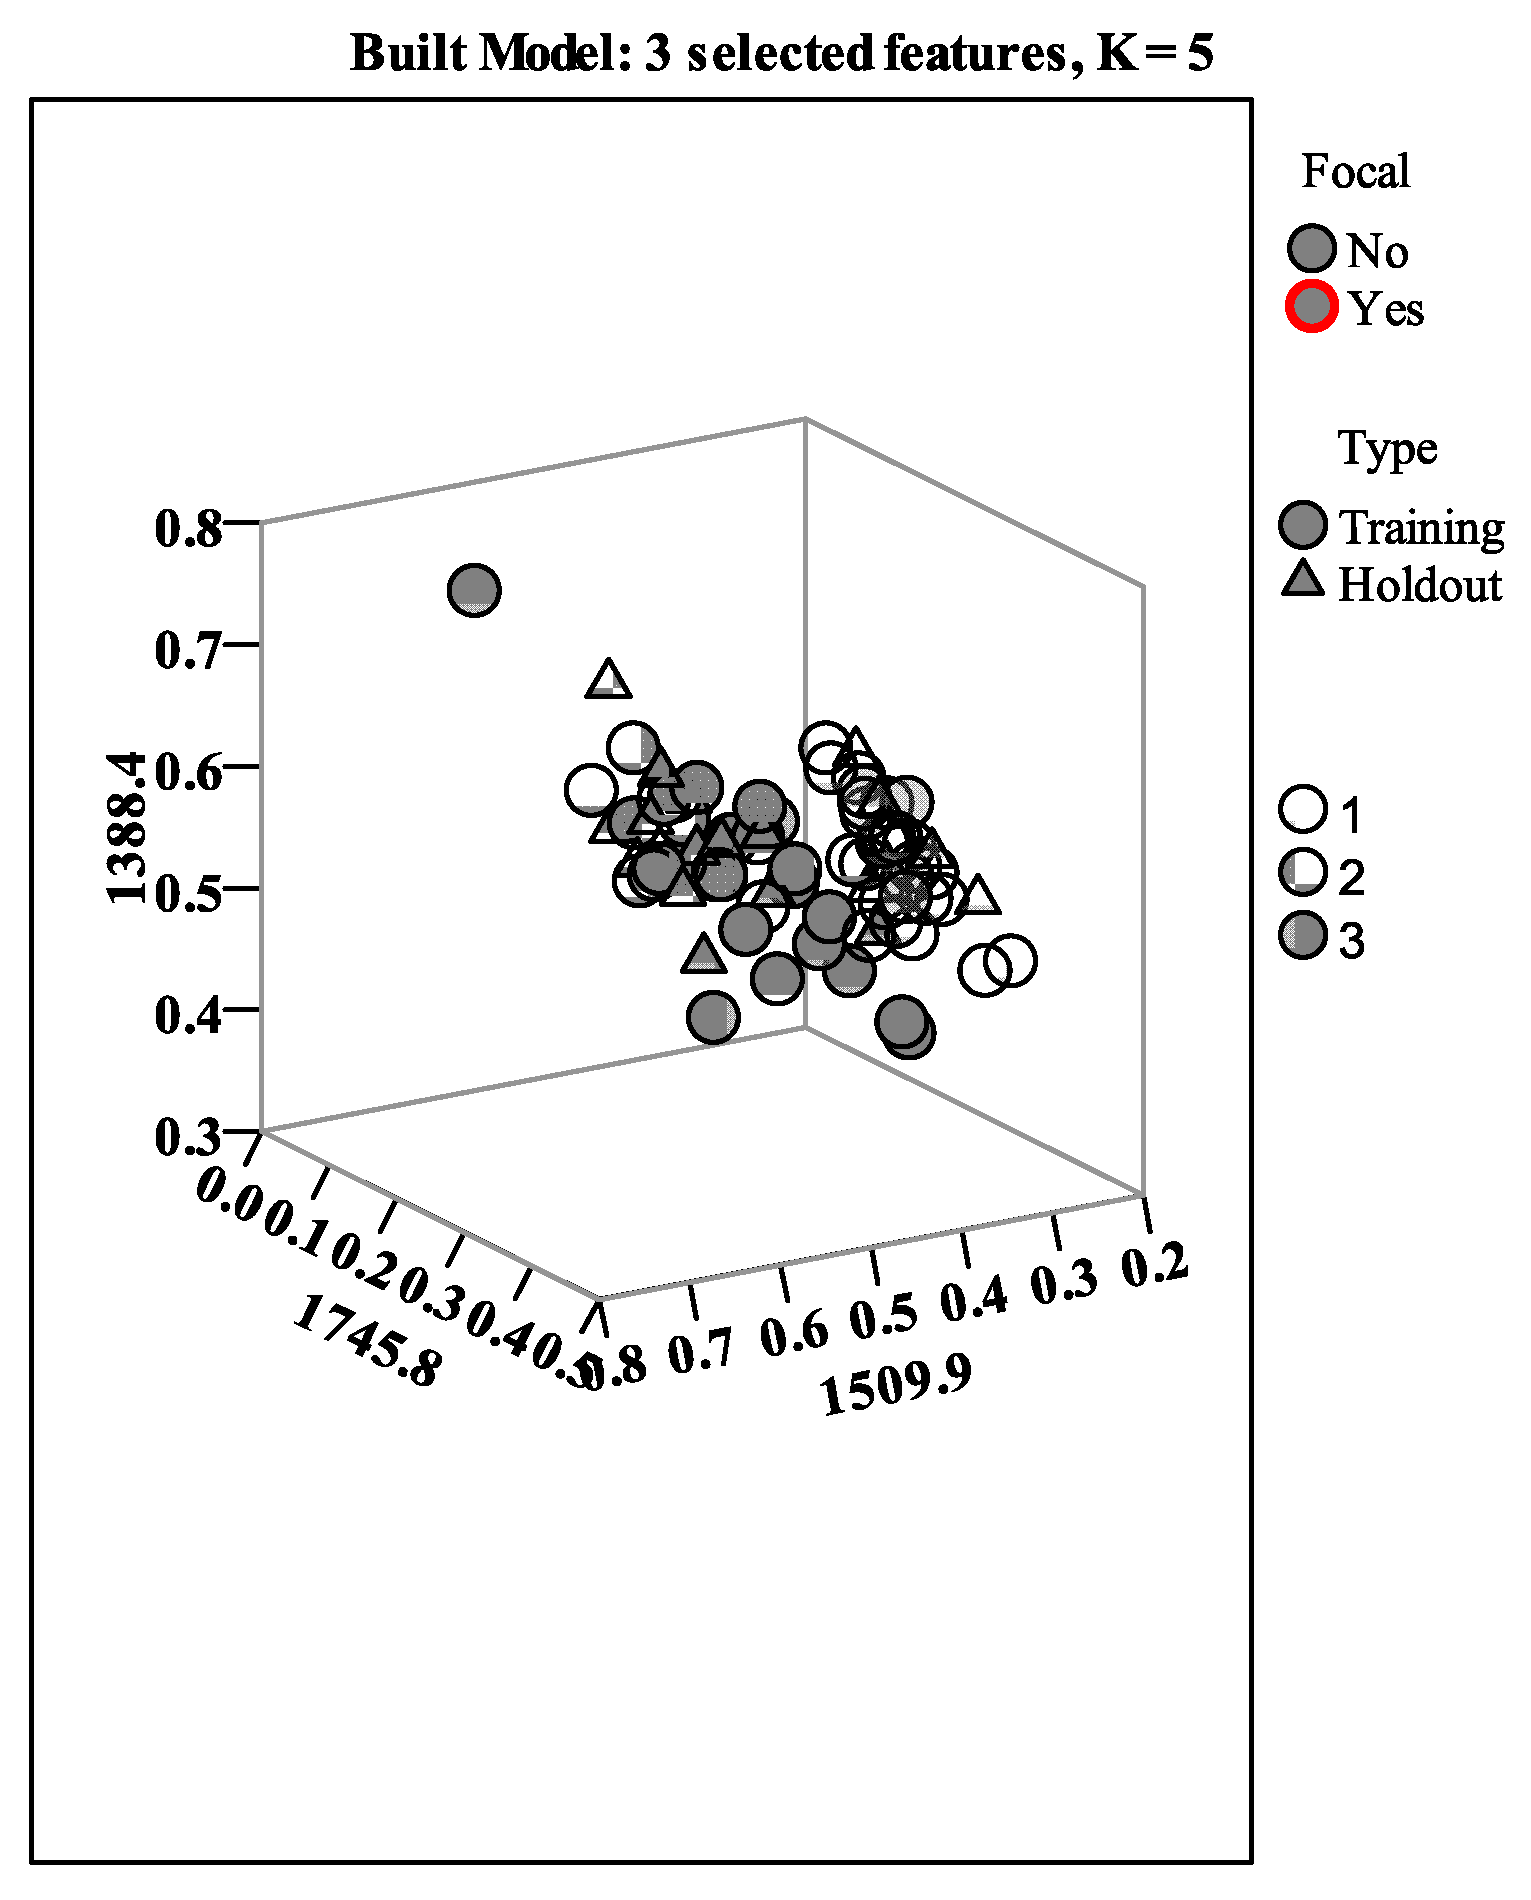
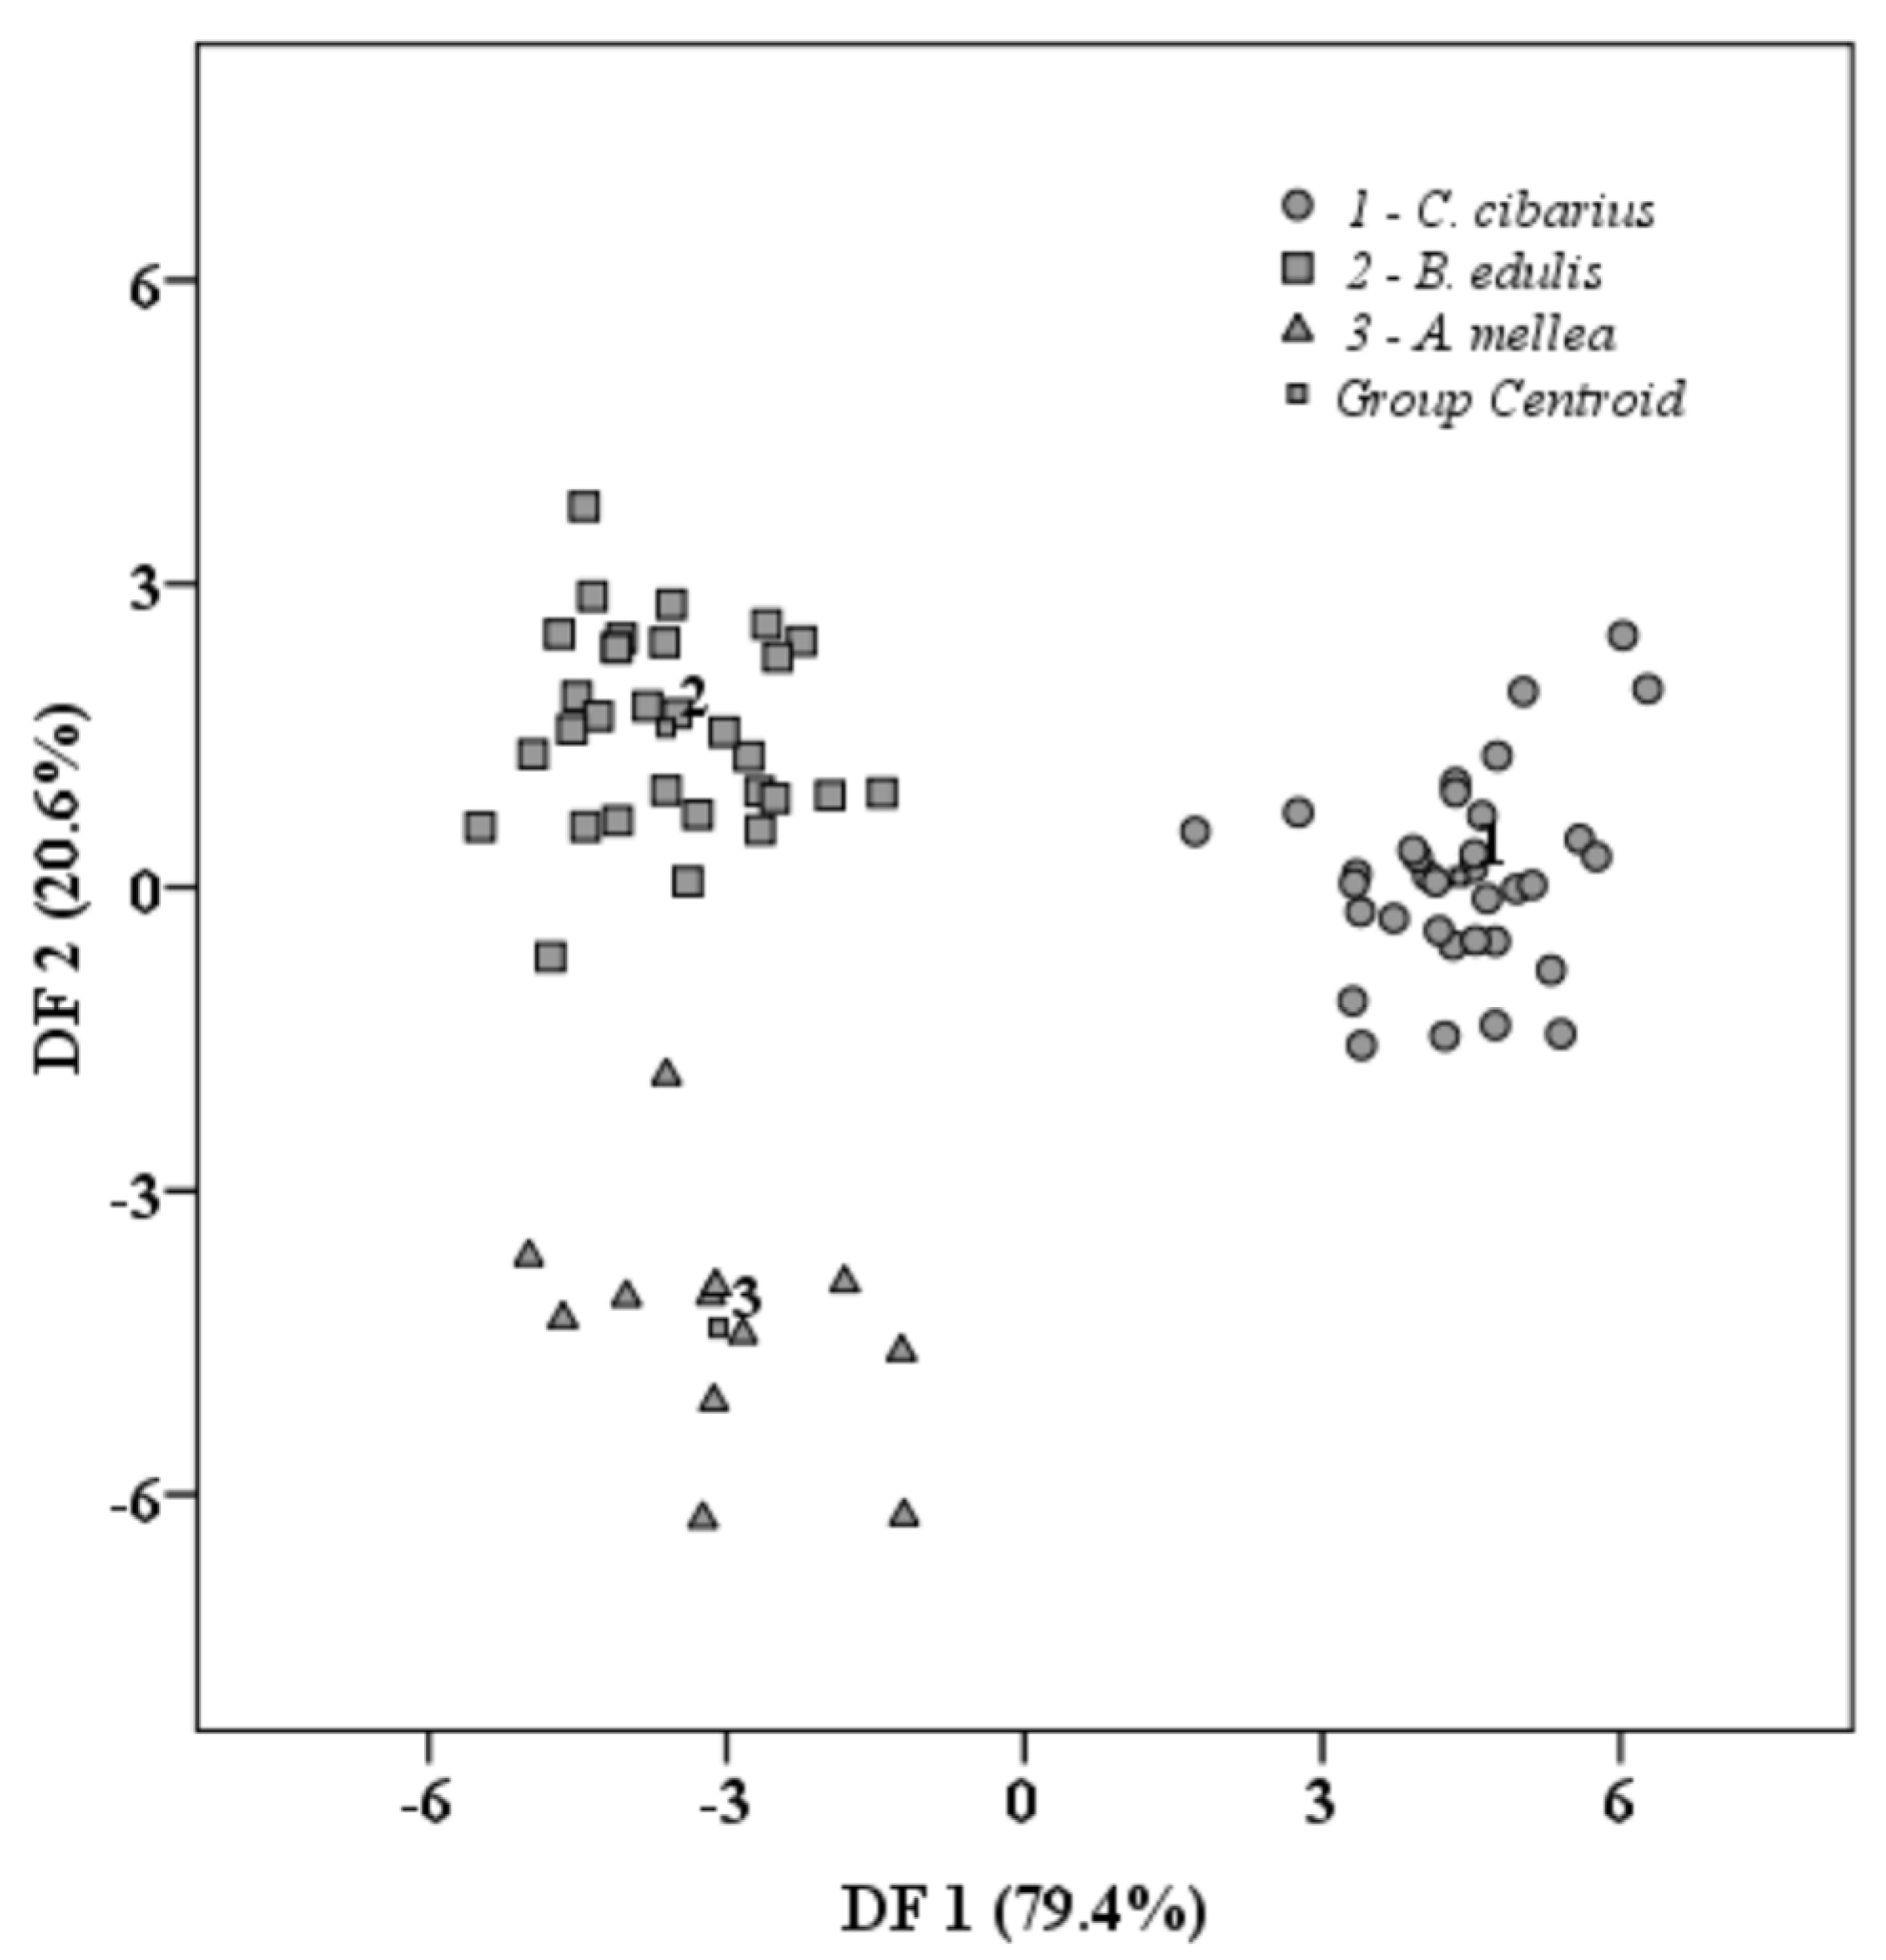
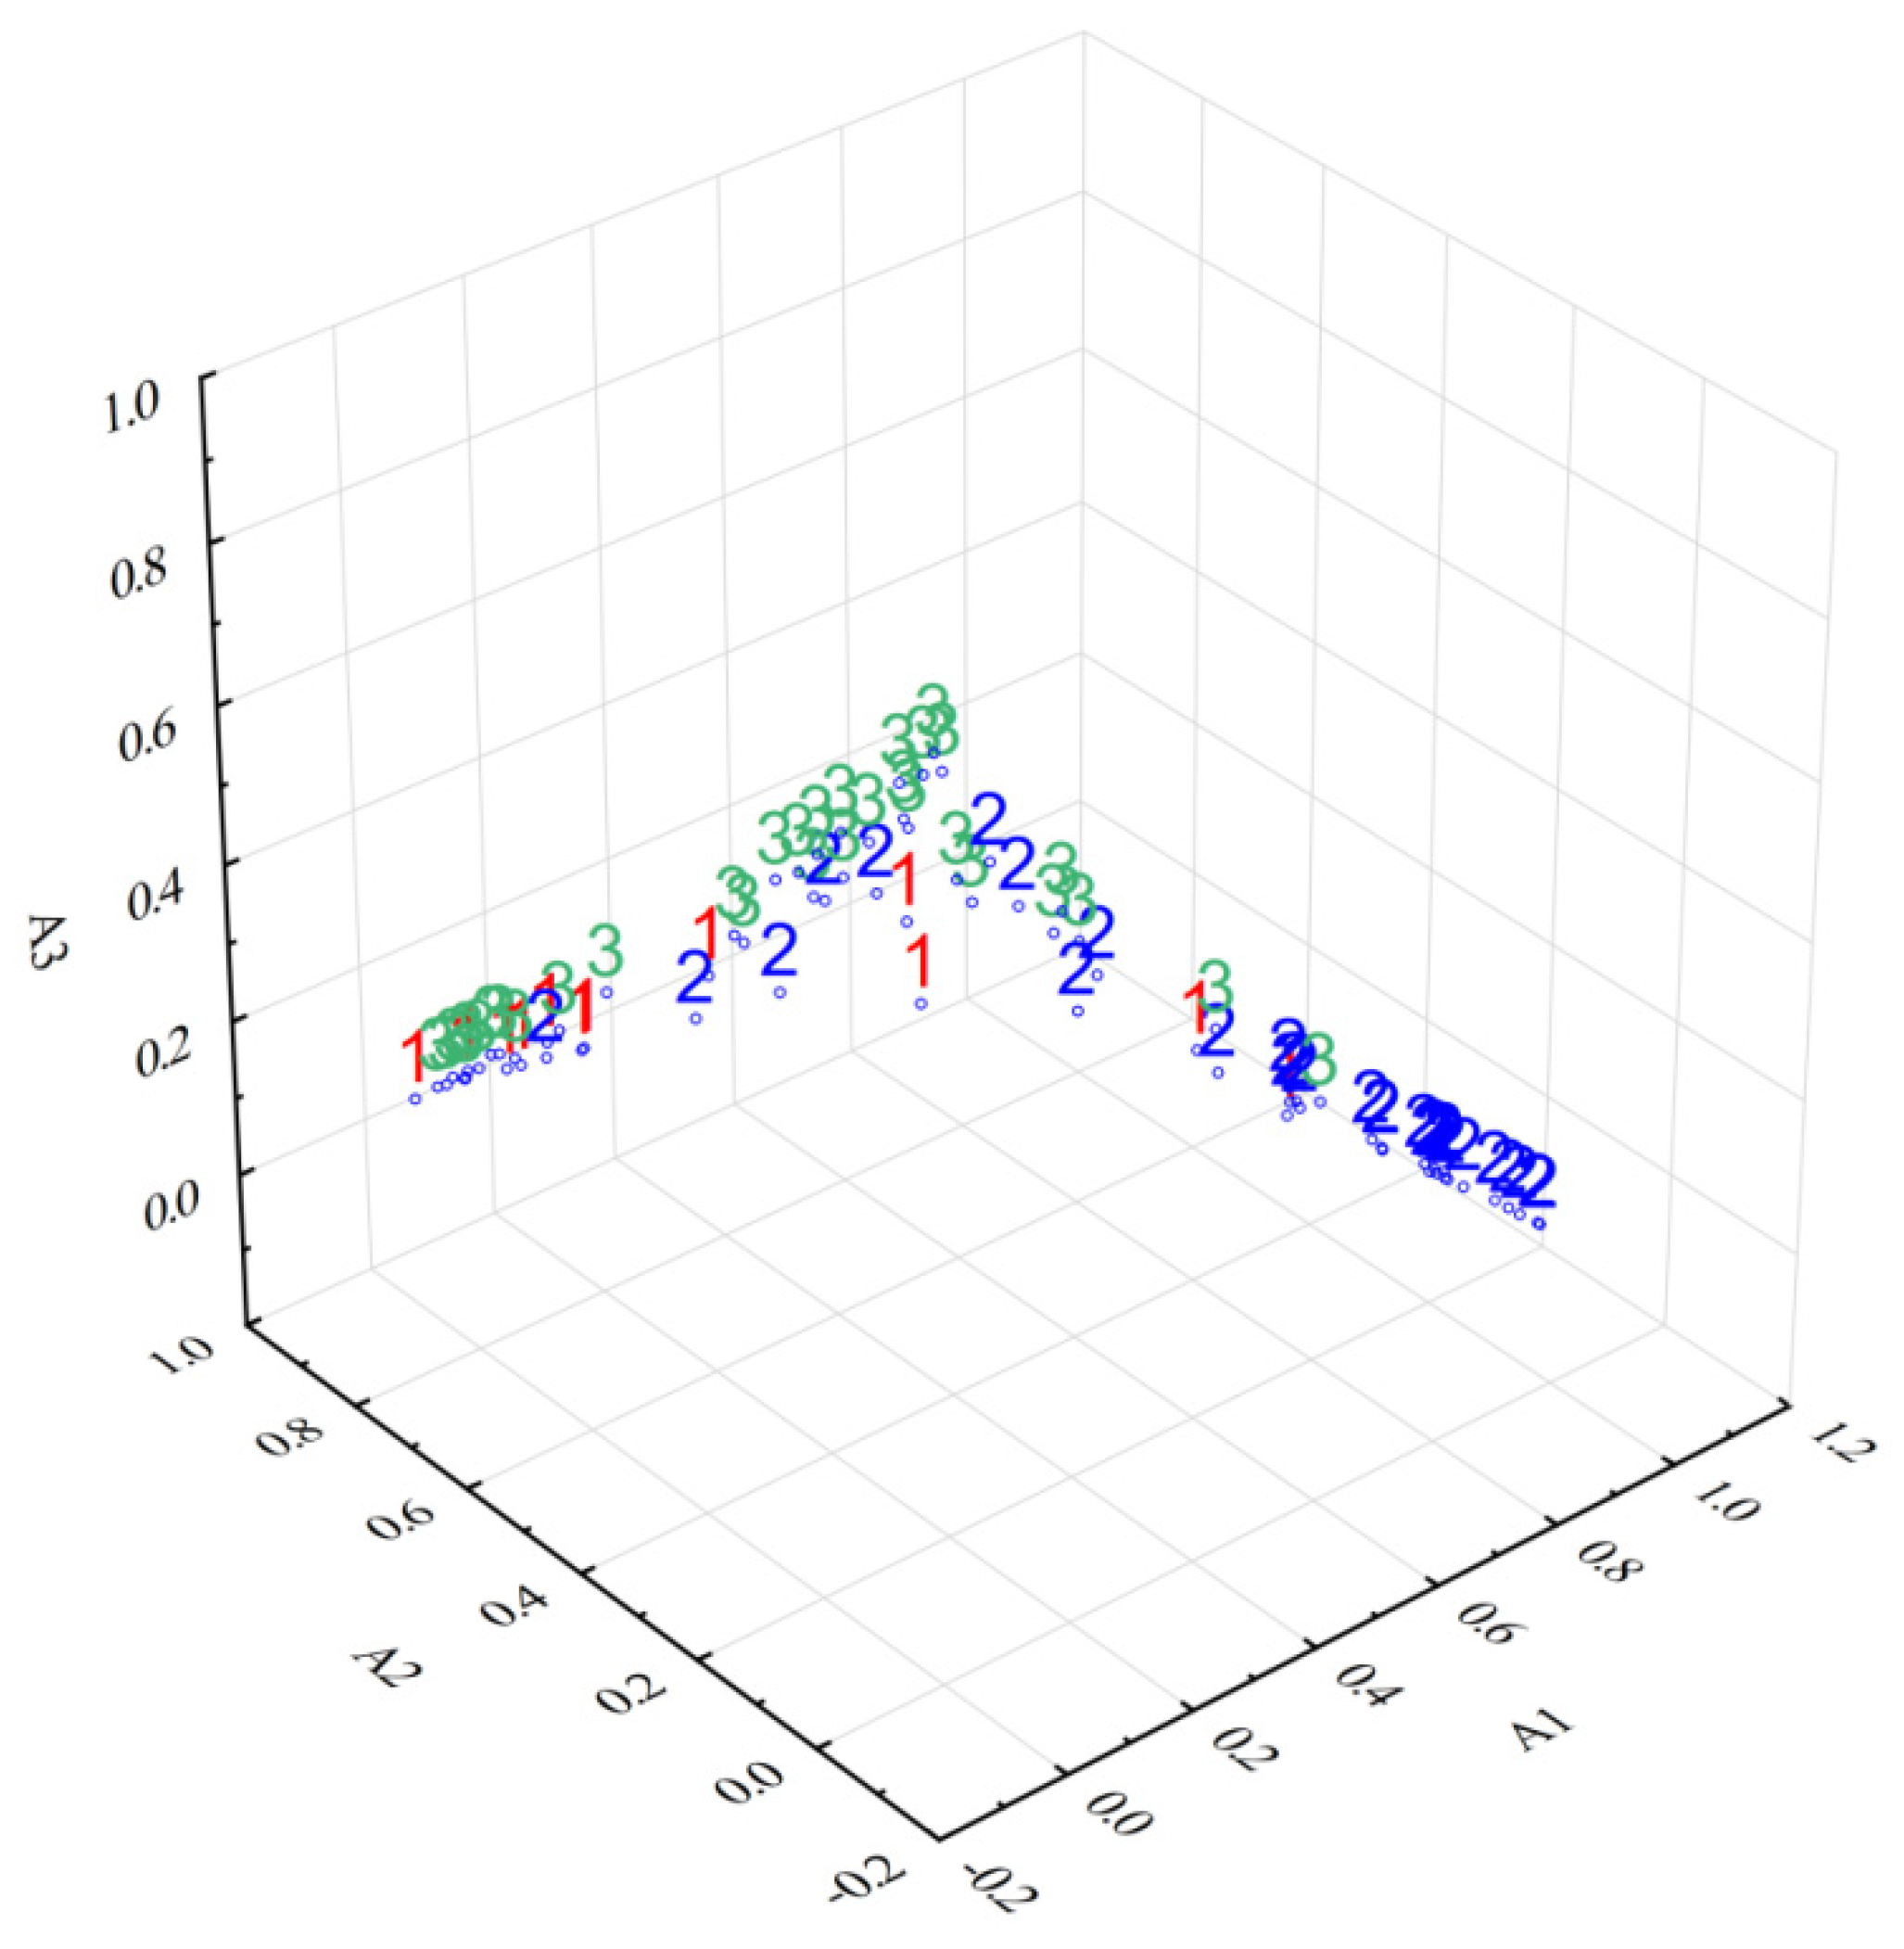
3.2. Chemometric Processing

For chemometric data processing, only the fingerprint region 1800–400 cm−1 was taken into account. Even so, because of the large dimension of the obtained FT-IR matrix, which is very difficult to further chemometrically process, first, a factorial analysis for dimensions reduction was applied, namely PCA. In this case, the PCA analysis was run using the following key parameters: extraction method, principal components, rotation methods, and Varimax with Kaiser normalization. An impressive number of PCs was obtained, but only PCs with eigenvalues higher than one were retained for further analysis. Usually, the first PCs obtained explain the largest percent of data variation. In this case, the first fourteen PCs had eigenvalues higher than one and explained a cumulative variance of 99.53%, being representative of the next chemometric treatment.
For discrimination of the three investigated mushroom species, a new variable was created, and each sample received a code corresponding to their species, as follows: code1 for Cantharellus cibarius, code 2 for Boletus edulis, and code 3 for Armillaria mellea. This variable was used as a grouping variable, while the PCs obtained previously were employed as independent variables. Wilk’s lambda was chosen as the discrimination method. The percent obtained for initial classification was 100%, and the cross-validation step of the method returned 97.4% of correctly classified samples. From the classification table, it could be observed that, in the cross-validation procedure, only one sample of Armillaria mellea was assigned to the Boletus edulis group. The graphical representation is presented in Figure 2.
As three groups were compared, two discriminant functions were obtained. These functions were statistically significant (p = 0.001) and the Wilks values were 0.012 and 0.195, respectively. The first function (DF1, 79.4%) contained the largest values for the majority of PCs, and the second function (DF2, 20.6%) was given by only two PCs. Generally, the largest values (loadings) of each point from the spectra suggest a higher contribution of that variable to the corresponding PC; thus, only values higher than 0.5 were considered. In this case, by inspecting the rotated component matrix obtained after running PCA, it could be observed that some parts of the spectra were highlighted as being different among the investigated mushroom species. For the first PC, the corresponding part of the spectra is from 400 to 925 cm−1. According to a paper published by Meenu et al., the region below 900 cm−1 could be assigned to α-glucans and β-glucans [25]. These compounds belong to polysaccharides groups, and the most common glucans from fungi are β-glucans [26], whose beneficial effect upon human health is well known—immunomodulatory, antitumor, hypolipidemic, and antimicrobial [27]. Glucans are responsible for the proper functioning and health of cells from the wall structure. Other significant areas from spectra retained by the second PC are those from 999 to 1121 cm−1 and 1141 to 1155 cm−1. These two regions from spectra could serve as a valuable indicator of mushrooms’ genus, although particular species cannot be identified through spectroscopic techniques [28,29]. The next PC grouped another two spectral regions, 1484–1559 cm−1 and 1598–1695 cm−1. The next two PCs grouped another significant region of FT-IR spectra, namely, 1715–1800 cm−1 and 1548–1561 cm−1.
Taking into consideration that some of the last obtained PCs did not contain any specific spectra regions, as well as the fact that no specific points were identified, a more powerful classification method was employed, this time with the entire FT-IR spectra as variables.
Among the machine learning algorithms, k nearest neighbor is the most simple and accessible one. In this case, kNN was applied for highlighting the features used to predict a certain mushroom species. As a target variable for the model, the species variable was set, with a specific code, the same as in LDA case, namely, code 1 for Cantharellus cibarius (samples 1–34), code 2 for Boletus edulis (samples 35–65), and code 3 for Armillaria mellea (samples 66–77). The specific number of neighbors was set to five, while the distance among the identified neighbors was measured through Euclidian distance. Moreover, features selection was adopted and a weighting by the significance of each point was selected [30,31]. The partition of sample between training and holdout sets was randomly assigned, with a proportion of 70% and 30%, respectively (Table 1). The classification table, obtained after running kNN, is presented below.
In the training step, the overall percent of correctly classified samples was 86.21%, while for the holdout set, the percent rose to 94.74%. The lower values obtained for the training set were due to one C. cibarius sample, two B. edulis, and five A. mellea, which were placed to other species. In any case, for the holdout sample, only one sample from B. edulis was misclassified. Regarding the features selection, only three points were selected: 1746 cm−1, 1510 cm−1, and 1388 cm−1. The samples’ distribution between the two sets, according to selected features, is presented in Figure 3 below:
It should be noticed that the results obtained using PCA-LDA and kNN are very similar in terms of species prediction accuracy. Regarding the obtained predictors, it should be mentioned that, except for 1746 cm−1, which also appeared in LDA classification, the other two bands are new predictors. This could lead to the conclusion that these two approaches are complementary.
The number of groups for fuzzy c-means clustering (FCM) analysis was chosen according to the three investigated species, namely three. The sample codes for this analysis were as follows: code 1 for Armillaria mellea (samples 1–12), code 2 for Boletus edulis (samples 13–43), and code 3 for Cantharellus cibarius (samples 44–77). FCM produced three fuzzy partitions, which were all represented by a prototype (a cluster center with the spectrum corresponding to the fuzzy robust means of the original FT-IR spectra characteristics for 77 samples weighted by degree of membership (DOM)) corresponding to each partition. To compare the partitions, the similarities and differences among samples, the spectra of the prototypes corresponding to the three fuzzy partitions (A1–A3) obtained by applying both FCM and DOMs of samples corresponding to all fuzzy partitions, have to be analyzed. The results presented in Table 2 and Figure 4 clearly illustrate the most specific characteristics of each fuzzy partition and their (dis)similarity and the sample assignment according to their DOMs.
The fuzzy partition A1, for example, includes almost all samples from the 13–43 group (Boletus edulis) as well as samples 1 and 10 from the A2 partition and 70 and 75 from the A3 partition, with relatively small DOMs. The remaining samples belonging to this group (14, 24, 28) were included in the A2 partition, with small DOMs, except for sample 28 (0.7454), while samples 25, 29, 31, 35, and 41 were placed in the A3 partition with moderate DOMs.
Except for samples 14, 24, and 28 from Boletus edulis, the second fuzzy partition A2 contains the majority of samples from 1–12 (Armillaria melea) as well as samples 44, 48–50, 58, 61–63, 66, 68, 72, and 73 from the Cantharellus cibarius group, with relatively high and moderate DOMs.
On the contrary, the third fuzzy partition A3 includes the majority of samples from 44–77 belonging to Cantharellus cibarius as well as samples 3 and 5 from A2 and 25, 29, 31, 35, and 41 from A1 with small DOMs, except for 29 (0.7029).
The fuzzy c-means clustering analysis successfully classified the investigated samples according to their species, meaning that, in every partition, the predominant species had the biggest DOMs, while samples belonging to other species had lower DOMs.

4. Conclusions

The present study demonstrated the great potential of combined analytical techniques, such FT-IR, and different chemometric processing methods. By applying LDA on scores obtained after PCA, the obtained percent for initial classification was 100%, and the cross-validation step of the method returned 97.4% of correctly classified samples. Only one A. mellea sample overlapped on the B. edulis group. When kNN was used in the same manner as LDA, the overall percent of correctly classified samples from the training step was 86.21%, while for the holdout set, the percent rose to 94.74%. The lower values obtained for the training set were due to one C. cibarius sample, two B. edulis, and five A. mellea, which were placed to other species. In any case, for the holdout sample set, only one sample from B. edulis was misclassified. These two statistical techniques proved to be complementary, with only one common band being found (1746 cm−1). The FCM analysis successfully classified the investigated mushroom samples according to their species, meaning that, in every partition, the predominant species had the biggest DOMs, while samples belonging to other species had lower DOMs.
This approach, obtained through the synergy between the FT-IR analytical technique and different chemometric methods, represents a suitable tool for species authentication of dried mushrooms, which could serve as fair trade.

Author Contributions

Conceptualization, methodology, and writing, I.F. and D.A.M.; sample collection and analytic measurements, F.-D.C., R.P., C.V.F.-A. and O.M.; software processing I.F. and C.S.; writing, I.F., C.V.F.-A., F.-D.C. and O.M.; revision, D.A.M. and C.S. All authors have read and agreed to the published version of the manuscript.

Funding

This work was supported by the Ministry of Research, Innovation, and Digitalization, grant number PD 90/2020, within PNCDI III.

Institutional Review Board Statement

Not applicable.

Informed Consent Statement

Not applicable.

Conflicts of Interest

The authors declare no conflict of interest.

References

  1. Cardwell, G.; Bornman, J.F.; James, A.P.; Black, L.J. A review of mushrooms as a potential source of dietary vitamin D. Nutrients 2018, 10, 1498. [Google Scholar] [CrossRef] [Green Version]
  2. Rathore, H.; Prasad, S.; Sharma, S. Mushroom nutraceuticals for improved nutrition and better human health: A review. Pharma Nutr. 2017, 5, 35–46. [Google Scholar] [CrossRef]
  3. Das, B.; Rajkonwar, J.; Jagannath, A.; Raul, P.K.; Deb, U. Infra-red spectra of different species of cultivated oyster mushrooms: Possible tool for identifying bioactive compounds and establishing taxonomic linkage. Def. Life Sci. J. 2020, 5, 118–124. [Google Scholar] [CrossRef]
  4. Li, J.; Wu, H.; Wang, L.; Huang, Y.; Wang, L. Key taste components in two edible Boletus mushrooms using widely targeted metabolomics. Biochem. Syst. Ecol. 2021, 96, 104268. [Google Scholar] [CrossRef]
  5. Granato, D.; Putnik, P.; Kovacevic, D.B.; Santos, J.S.; Calado, V.; Rocha, R.S.; Cruz, A.G.D.; Jarvis, B.; Rodionova, O.Y.; Pomerantsev, A. Trends in Chemometrics: Food Authentication, Microbiology and Effects of Processing. Compr. Rev. Food Sci. Food Saf. 2018, 17, 663–677. [Google Scholar] [CrossRef] [Green Version]
  6. Marçal, S.; Sousa, A.S.; Taofiq, O.; Antunes, F.; Morais, A.M.M.B.; Freitas, A.C.; Barros, L.; Ferreira, I.C.F.R.; Pintado, M. Impact of postharvest preservation methods on nutritional value and bioactive properties of mushrooms. Trends Food Sci. Technol. 2021, 110, 418–431. [Google Scholar] [CrossRef]
  7. Zhang, K.; Pu, Y.Y.; Sun, D.W. Recent advances in quality preservation of postharvest mushrooms (Agaricus bisporus): A review. Trends Food Sci. Technol. 2018, 78, 72–82. [Google Scholar] [CrossRef]
  8. Yadav, D.; Negi, P.H. Bioactive components of mushrooms: Processing effects and health benefits. Food Res. Int. 2021, 148, 110599. [Google Scholar] [CrossRef]
  9. Mleczek, M.; Siwulski, M.; Budka, A.; Mleczek, P.; Budzyńska, S.; Szostek, M.; Kuczyńska-Kippen, N.; Kalač, P.; Niedzielski, P.; Gąsecka, M.; et al. Toxicological risks and nutritional value of wild edible mushrooms species—A half century monitoring study. Chemosphere 2021, 263, 128095. [Google Scholar] [CrossRef]
  10. Zsigmond, A.R.; Varga, K.; Harangi, S.; Baranyai, E.; Urak, I. Elemental profile of edible mushrooms from a forest near a major Romanian city. Acta Univ. Sapientiae Agric. Environ. 2015, 7, 98–107. [Google Scholar] [CrossRef] [Green Version]
  11. Roise, D.J.; Baars, J.; Tan, Q. Current overview of mushrooms production in the world. In Edible and Medicinal Mushrooms: Technology and Applications; Diego, C.Z., Pardo-Gimenez, A., Eds.; Wiley-Blackwell: Hoboken, NJ, USA, 2017. [Google Scholar]
  12. Gong, P.; Wang, S.; Liu, M.; Chen, F.; Yang, W.; Chang, X.; Liu, N.; Zhao, Y.; Wang, J.; Chern, X. Extraction methods, chemical characterizations and biological activities of mushrooms polysaccharides: A mini-review. Carbohydr. Res. 2020, 494, 108037. [Google Scholar] [CrossRef]
  13. Bebu, A.; Andronie, L.; Maties, A.; Micle, S.; Darjan, S.; Culcear, O. Comparative analysis between mushrooms LactariusPiperatus and AgaricusBisporus (Champignon) using FT-IR Spectroscopy. Sci. Pap. Ser. B Hortic. 2020, LXIV, 633–637. [Google Scholar]
  14. Zavastin, D.E.; Biliută, G.; Dodi, G.; Macsim, A.; Lisa, G.; Gherman, S.P.; Breabăn, I.G.; Miron, A.; Coseri, S. Metal content and crude polysaccharide characterization of selected mushrooms growing in Romania. J. Food Comp. Anal. 2018, 67, 149–158. [Google Scholar] [CrossRef]
  15. O’Gorman, A. Use of Fourier Transform Infrared Spectroscopy and Chemometric Data Analysis To Evaluate Damage and Age in Mushrooms (Agaricus bisporus) Grown in Ireland. J. Agric. Food Chem. 2010, 58, 7770–7776. [Google Scholar] [CrossRef] [Green Version]
  16. D’Souza, R.A.; Kamat, N.M. Potential of FT-IR spectroscopy in chemical characterization of Termitomyces Pellets. J. Appl. Biol. Biotechnol. 2017, 5, 080–084. [Google Scholar]
  17. Liu, H.I.; Zang, Y.; Zhao, X.; Tong, H. Improved geographical origin discrimination for tea using ICP-MS and ICP-OES techniques in combination with chemometric approach. J. Sci. Food Agric. 2020, 100, 3507–3516. [Google Scholar] [CrossRef]
  18. Gao, R.; Chen, C.; Wang, H.; Chen, C.; Yan, Z.; Han, H.; Chen, F.; Wu, Y.; Wang, Z.; Zhou, Y.; et al. Classification of multicategory edible fungi based on the infrared spectra of caps and stalks. PLoS ONE 2020, 15, e0238149. [Google Scholar] [CrossRef]
  19. Sârbu, C.; Pop, H.F. Fuzzy Soft-Computing Methods and Their Applications in Chemistry. Rev. Comput. Chem. 2004, 20, 249–253. [Google Scholar]
  20. Feher, I.; Magdas, D.A.; Voica, C.; Cristea, G.; Sârbu, C. Fuzzy Divisive Hierarchical Associative-Clustering Applied to Different Varieties of White Wines According to Their Multi-Elemental Profiles. Molecules 2020, 25, 4955. [Google Scholar] [CrossRef] [PubMed]
  21. Ruspini, E.H.; Bezdek, J.C.; Keller, J.M. Fuzzy Clustering: A historical perspective. IEEE Comput. Intell. Mag. 2019, 14, 45–55. [Google Scholar] [CrossRef]
  22. Khang, T.D.; Vuong, N.D.; Tran, M.K.; Fowler, M. Fuzzy C-means clustering algorithm with multiple fuzzification algorithms. Algorithms 2020, 13, 158. [Google Scholar] [CrossRef]
  23. Bekiaris, G.; Koutrotsios, G.; Tarantilis, P.A.; Pappas, C.S.; Zervakis, G.I. FT-IR assessment of compositional changes in lignocelluloses wastes during cultivation of Cyclocybecylindracea mushrooms and use of chemometric models to predict production performance. J. Mater. Cycles Waste Manag. 2020, 22, 1027–1035. [Google Scholar] [CrossRef]
  24. Yao, S.; Li, T.; Li, J.Q.; Liu, H.G.; Wang, Y.Z. Geographic identification of Boletus mushrooms by data fusion of FT-IR and UV spectroscopies combined with multivariate statistical analysis. Spectrochim. Acta A Mol. Biomol. Spectrosc. 2018, 198, 257–263. [Google Scholar] [CrossRef] [PubMed]
  25. Meenu, M.; Xu, B. Application of vibrational spectroscopy fro classification, authentication and quality analysis of mushrooms: A concise review. Food Chem. 2019, 289, 545–557. [Google Scholar] [CrossRef] [PubMed]
  26. Morales, D.; Rutckeviski, R.; Villalva, M.; Abreu, H.; Soler-Rivas, C.; Santoyo, S.; Iacomini, M.; Ribeiro Smiderle, F. Isolation and comparison of α- and β-D-glucans from shiitake mushrooms (Lentinula edodes) with different biological activities. Carbohydr. Polym. 2020, 229, 115521. [Google Scholar] [CrossRef]
  27. Khan, A.A.; Gani, A.; Masoodi, F.A.; Mushtaq, U.; Naik, A.S. Structural, rheological, antioxidant, and functional properties of β-glucan extracted from edible mushrooms Agaricus bisporus, Pleurotus ostreatus and Coprinus attrimentarius. Bioact. Carbohydr. Diet. Fibre 2017, 11, 67–74. [Google Scholar] [CrossRef]
  28. Mohacek-Grocev, V.; Bozac, R.; Puppels, G.J. Vibrational spectroscopic characterization of wild growing mushrooms and toadstools. Spectrochim. Acta. A Mol. Biomol. Spectrosc. 2001, 57, 2815–2829. [Google Scholar] [CrossRef]
  29. Ruthes, A.C.; Cantu-Jungles, T.M.; Cordeiro, L.M.C.; Iacomini, M. Prebiotic potential of mushrooms D-glucans: Implications of physicochemical properties and structural features. Carbohydr. Polym. 2021, 262, 117940. [Google Scholar] [CrossRef]
  30. Dhanabal, S.; Chandramathi, S. A review of various k-nearest neighbor query processing techniques. Int. J. Comput. Appl. 2011, 31, 14–22. [Google Scholar]
  31. Gilani, S.J.; Imam, S.S.; Ahmad, J. Application of fingerprinting techniques in authentication and traceability of fruits and vegetables. In Fingerprinting Techniques in Food Authentication and Traceability, 1st ed.; Siddiqi, K.S., Nollet, L.M.L., Eds.; CRC Press: Boca Raton, FL, USA; Taylor and Francis Group: London, UK, 2019; pp. 341–342. [Google Scholar]
Figure 1. FT-IR spectra of the three selected species.
Applsci 11 09577 g001
Figure 2. Mushrooms’ differentiation after applying LDA.
Applsci 11 09577 g002
Figure 3. kNN modeling of mushroom samples, with three features selected and five neighbors.
Applsci 11 09577 g003
Figure 4. 3D scatterplot of DOMs corresponding to partitions A1, A2, and A3.
Applsci 11 09577 g004
Table 1. Classification table of mushroom samples, obtained after kNN modeling.
PartitionPredicted
C. cibariusB. edulisA. melleaPercent Correct
TrainingC. cibarius271096.43%
B. edulis118190.00%
A. mellea23550.00%
Overall percent51.73%37.94%10.35%86.21%
HoldoutC. cibarius600100%
B. edulis010190.91%
A. mellea002100%
Overall percent31.58%52.64%15.79%94.74%
Table 2. The three fuzzy partitions obtained by applying the fuzzy c-means clustering method.
Fuzzy PartitionSamples of Each Partition Ranking in Decreasing Order of DOMsDOMs Range of Samples
A1–77
A11, 10, 13, 15, 16, 17, 18, 19, 20, 21, 22, 23, 26, 27, 30, 32, 33, 34, 36, 37, 38, 39, 40, 42, 43, 70, 750.9789–0.4021
A22, 4, 6, 7, 8, 9, 11, 12, 14, 24, 28, 44, 48, 49, 50, 58, 61, 62, 63, 66, 68, 72, 730.9224–0.4471
A33, 5, 25, 29, 31, 35, 41, 45, 46, 47, 51, 52, 53, 54, 55, 56, 57, 59, 60, 64, 65, 67, 69, 71, 74, 76, 770.9147–0.3876
Publisher’s Note: MDPI stays neutral with regard to jurisdictional claims in published maps and institutional affiliations.

