Abstract
Background: The Cancer Genome Atlas (TCGA) Research Network revealed numerous clear cell renal cell carcinoma (ccRCC) gene mutations among which titin (TTN). The link between excessive amounts of visceral adipose tissue (VAT) and ccRCC pathogenesis is known. A relationship between VHL and TTN gene mutations and a CT-derived estimation of body composition in ccRCC patients has been evaluated. Methods: We retrospectively assessed patients from the TCGA-kidney renal clear cell carcinoma (KIRC) database for evaluation of clinicopathological and body composition analysis of ccRCC VHL and TTN gene mutations. Results: Gene expression levels and survival were assessed on a large cohort of 483 patients and 533 tumor samples. A statistically significant difference of VHL expression reduction in primary tumor (p < 0.0001) and a TTN expression increase in primary tumor (p < 0.0001) was shown. TTN high expression levels was associated with statistically significant lower KIRC patient survival at eight years (p < 0.05). For body composition analysis, we included 54 male patients divided into two groups: ccRCC-VHL (n = 41) and ccRCC-TTN (n = 13) groups. Statistically significant differences between the two groups were obtained for total adipose tissue (TAT) (p < 0.01), VAT (p < 0.05), subcutaneous adipose tissue (SAT) (p < 0.05) and total abdominal muscle (TAM) (p < 0.05) areas. Conclusion: This study demonstrates a link between ccRCC TTN gene mutation and shorter patient survival. The reduction of the analyzed tissues might be a risk of cancer cachexia in ccRCC patients with TTN gene mutation.
1. Introduction
Genomic analysis performed by the Cancer Genome Atlas (TCGA) Research Network revealed numerous clear cell renal cell carcinoma (ccRCC) gene mutations including titin (TTN), polybromo 1 (PBRM1), SET domain containing 2 (SETD2), BRCA1-associated protein 1 (ubiquitin carboxy-terminal hydrolase) (BAP1), and lysine (K)-specific demethylase 5C (KDM5C) [1]. A new research field called radiogenomics has been developed. This field is based on the association between imaging phenotypes, macroscopic expression of processing that takes place at the molecular level and is detectable as imaging features, and genomic of diseases (gene mutations, gene expression patterns and other genome-related feature) [2,3].
The von Hippel-Lindau (VHL) tumor suppressor gene represents the most mutated gene in clear cell renal cell carcinoma (ccRCC) [4]. It regulates the hypoxia inducible factor (HIF) protein, which modulates the transcription of several genes, including vascular endothelial growth factor (VEGF). These genes control angiogenesis, proliferation, tumor cell migration and permeability. The mutated VHL gene can lead to an accumulation of HIF with consequent upregulation of the neoangiogenic cascade [5,6]. Thanks to the advancement of molecular sequencing technology, further key genetic mutations have been identified in addition to the already known inactivation of the VHL gene. Radiogenomics allows for the understanding of and the analysis of the biology and intrinsic heterogeneity of the cancers [7].
Currently, the role of visceral adipose tissue (VAT) in the pathogenesis of ccRCC is well known. A large percent of VAT, through an altered secretory activity of adipokines, mediating factors and molecules, may influence ccRCC induction and progression [8,9]. In fact, a larger quantity of abdominal adipose tissue, mostly VAT, was detected in ccRCC patients, demonstrating an association between VAT and ccRCC [10,11].
Adipose tissue compartments and muscle mass can be distinguished by computed tomography (CT), a non-invasive imaging technique for the qualitative and quantitative analysis of tissues [12,13,14]. The semiautomatic quantification of the abdominal adipose tissue compartments and abdominal muscle mass areas performed on a single slice allows for the obtaining of body composition data [10,11,13,14].
To date, adipose tissue and skeletal muscle mass in ccRCC patients with TTN gene mutation has not been evaluated. In the present study, using CT, we evaluate body composition in ccRCC with VHL and TTN gene mutation.
2. Materials & Methods
The local ethical committee approved the study, conducted in accordance with the Declaration of Helsinki.
2.1. Patients
A total of 483 patients from TCGA-kidney renal clear cell carcinoma (KIRC)—were evaluated for the clinicopathological analysis of TTN and VHL expression in tumor samples through the UALCAN program. Available online: http://ualcan.path.uab.edu (accessed on 1 November 2021) [15,16]. Specifically, the UALCAN program consists of 72 normal and 533 tumor samples [16]. Of these 483 patients, CT images of 267 patients were available on TCGA-KIRC and were subsequently evaluated and selected. We included Caucasian male patients with CT at the time of ccRCC diagnosis, aged 40–77, years in whom genomic analysis showed the presence of VHL and TTN gene mutations.
VHL gene mutation was selected, as it is the most frequent mutation in ccRCC [4]. TTN gene mutation was chosen for this study as it correlates with tumor mutational burden, a biomarker that reflects the amount of mutations in cancer that correlates with better immune checkpoint inhibitor outcomes [17,18].Female patients, patients with non-Caucasian ethnicity, patients without CT images, patients with previous renal ablation, cirrhotic patients and patients without VHL or TTN gene mutations were not included [15,19,20]. Through this selection, 59 ccRCC male patients with first diagnosis undergoing CT examination were selected for body composition analysis. Five of these patients were not included due to informatic errors in retrieving the full CT images.
2.2. CT Analysis
All patients underwent CT examination including the abdomen. For the quantification of total adipose tissue (TAT), VAT, subcutaneous adipose tissue (SAT) and total abdominal muscle (TAM), an application of Horos v.4.0.0 RC2 software (Annapolis, MD, USA) was used to yield semiautomatic quantification by selecting the attenuation values of the adipose tissue and skeletal muscle (i.e., respectively about −190/−30 and +10/+40 Hounsfield Unit). The area was calculated on the axial image located 3 cm above the lower margin of L3 vertebra as described above [21]. The TAM area was measured on the same slice using a region of interest (ROI) on the following muscles: rectus abdominis, transversus abdominis, external oblique, quadratus lumborum, iliocostalis lumborum, longissimus thoracis, spinalis thoracis and psoas major [22]. All the ROIs were measured by the consensus of two experienced radiologists (F.G. and C.A.M.), who were blinded to clinical data.
Female patients were not included for body composition analysis due to lack or unclear information about menopausal status, which is known to influence fat distribution [23]. Only Caucasian patients were included due known differences of body compositions according to different ethnicity [24,25].
2.3. Clinicopathological Correlation Analysis of VHL and TTN
UALCAN, an integrated data-mining web resource, was used for exploring the relationship between VHL, TTN and the clinicopathological characteristics of ccRCC. Through UALCAN, we analyzed the relative expression VHL and TTN among normal and various tumor samples. Moreover, the effect of VHL and TTN expression levels on ccRCC patient survival was also evaluated.
2.4. Statistical Analysis
Expression of VHL and TTN in normal and tumor samples were compared and represented thorough box-plots. The Kaplan-Meier method was used to verify the relationship among VHL and TTN expression levels and patients’ survival. Areas of TAT, VAT, SAT, VAT/SAT ratio and TAM area were compared between ccRCC-VHL and ccRCC-TTN groups using the Student’s t-test. A statistical significance threshold was established at p < 0.05.
3. Results
3.1. Gene Expression and Survival
Gene expression and overall survival was assessed on a large cohort of 483 patients and 533 tumor samples. There was a statistically significant difference of VHL expression due to the decrease of VHL expression in pathological specimen compared to normal renal tissue (p < 0.0001) (Figure 1), and a statistically significant increase of TTN expression in KIRC based on sample types (p < 0.0001) (Figure 2). Kaplan-Meier did not show statistically significant differences according to VHL expression levels in KIRC patients’ survival at eight years (p = 0.4) (Figure 3). However, a statistically significant difference was found according to TTN expression levels on KIRC patients’ survival at eight years (p = 0.039) (Figure 4).
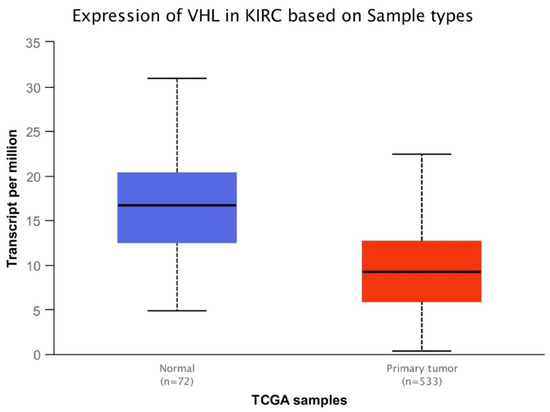
Figure 1.
Box-plot analysis showing statistically significant difference (p < 0.0001) of VHL expression between normal tissue and primary tumor.
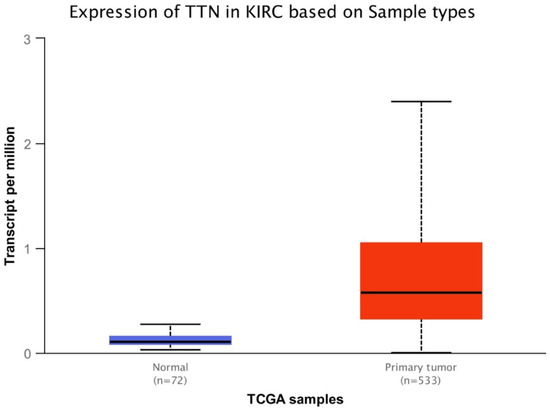
Figure 2.
Box-plot analysis showing statistically significant difference (p < 0.0001) of TTN expression between normal tissue and primary tumor.
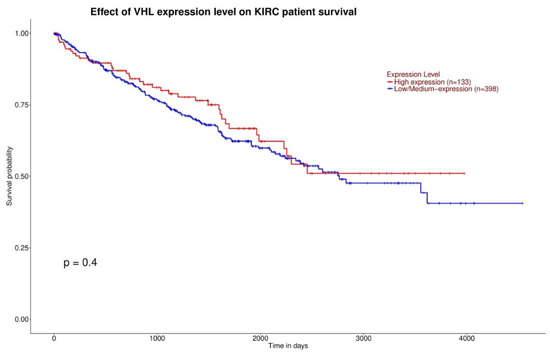
Figure 3.
Kaplan-Meier curves showing no statistically significant difference of survival between high VHL expression and low/medium VHL expression (the red curve and blue curve, respectively).
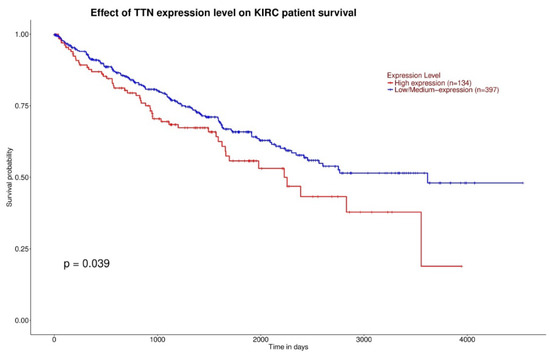
Figure 4.
Kaplan-Meier curves showing statistically significant difference (p < 0.05) of survival between high TTN expression and low/medium TTN expression (respectively red curve and blue curve).
3.2. Body Composition
A cohort of 54 Caucasian male patients, divided into two groups, was enrolled: the ccRCC-VHL group composed of ccRCC patients with VHL gene mutation (n = 41; mean age: 57.1, range: 40–77) and the ccRCC-TTN group composed of ccRCC patients with TTN gene mutation (n = 13; mean age 63.3, range 40–77). In the ccRCC-TTN group, five patients had concomitant VHL mutation. No patient of the ccRCC-VHL group had TTN gene mutation. No differences were found between the ages of the ccRCC-VHL and ccRCC-TTN groups. Descriptive data of ccRCC-VHL group and ccRCC-TTN group are listed in Table 1 and Table 2.

Table 1.
Descriptive data of ccRCC-VHL group.
Table 2.
Descriptive data of ccRCC-TTN group.
Statistically significant differences (i.e., decrease in the ccRCC-TTN group) between the ccRCC-VHL group and the ccRCC-TTN group were obtained for the TAT area (p < 0.01), VAT area (p = 0.02), SAT area (p = 0.01) and TAM area (p = 0.01) (Table 3 and Figure 5). No statistically significant differences were obtained between the two groups for VAT/SAT ratio. The full results are listed in Table 3 and Figure 5. Examples of CT cases are provided in Figure 6.
Table 3.
Mean of the ccRCC-VHL group and ccRCC-TTN group and Student’s t-test results.
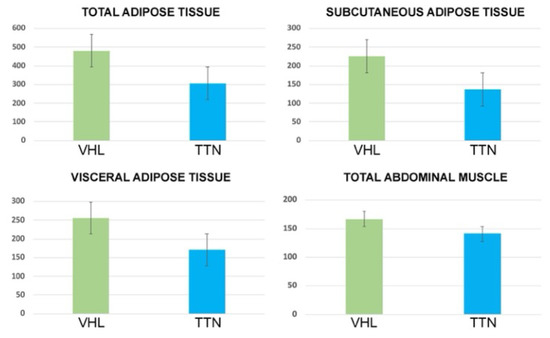
Figure 5.
Bar chart with error bars showing a significant difference of mean values of TAT, SAT, VAT and TAM areas between ccRCC-VHL group and ccRCC-TTN group.
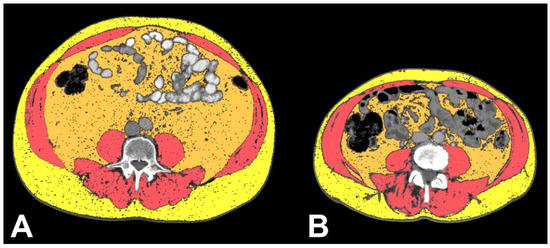
Figure 6.
Axial CT images showing VAT segmented in orange, TAM segmented in pink salmon and SAT segmented in yellow in ccRCC-VHL patient (A) and ccRCC-TTN patient (B), clearly showing the decreased amount of VAT, TAM and SAT in the ccRCC-TTN patient. Please note that this is a demonstrative figure to show the main massage of this study and not a figure explaining the methods of body composition segmentation (please see methods section for a detailed description).
4. Discussion
In this study we evaluated gene expression, survival, and body composition of ccRCC patients with VHL and TTN gene mutations. The decreased expression of VHL and the increased expression of TTN in KIRC based on sample types was shown (Figure 1 and Figure 2). Furthermore, while the expression levels of VHL on KIRC patient survival did not show a significant difference, a TTN high expression level showed a link with shorter survival (Figure 3 and Figure 4). Indeed, ccRCC patients with VHL low/medium expression show a survival probability greater than 0.25 and a maximum survival greater than eight years, while ccRCC patients with TTN high expression show a survival probability lower than 0.25 and lower maximum survival (around eight years). Moreover, our results showed a significant decrease of TAT, VAT, SAT and TAM in the ccRCC-TTN group compared to the ccRCC-VHL group (Figure 5 and Figure 6).
The role of adipose tissue, especially VAT, in the pathogenesis of RCC is known. In fact, both ccRCC patients and non-ccRCC patients showed an increased amount of VAT [10,11,26]. Furthermore, the relationship between VAT and VHL and KDM5C gene mutations has been recently reported [27]. Increased adipose tissue determines the abnormal secretion of adipokines and the release of hypoxia-inducible factor 1 (HIF-1) following the insufficient supply of oxygen [28,29,30]. The complex of proteins related to VHL protein leads to HIF degradation, and with the inactivation of the VHL gene the lack of HIF degradation could develop angiogenesis and cell growth [31,32,33,34].
Long non-coding RNAs are a group of non-protein coding RNA transcripts [31]. They were considered “transcriptional junk”, but recently it has been shown that they can play an important regulatory role in various diseases including cancer [35,36]. Many long non-coding RNAs have been shown to play a regulatory role in ccRCC progression by acting both as tumor suppressors and oncogenes [37]. It has recently been shown that long non-coding antisense RNA TTN 1 (TTN-AS1) is overexpressed in many malignancies including lung adenocarcinoma, gastric cancer and colorectal cancer [38,39,40,41]. A recent study investigated the expression, molecular mechanisms and function of TTN-AS1 in ccRCC in order to improve understanding of the ccRCC progression [37]. They demonstrated that TTN-AS1 knockdown suppressed cell proliferation of ccRCC, suggesting a possible role as oncogene [37]. This data can help in the development of new therapeutic strategies.
The reduction of abdominal adipose tissue compartments and abdominal muscle mass in the ccRCC-TTN group compared to the ccRCC-VHL group might be linked to TTN gene mutation. In fact, the ccRCC-VHL group showed a better survival trend compared with the ccRCC-TTN group. Furthermore, these body composition differences in ccRCC patients with TTN gene mutation could be used as a biomarker of tumor mutational burden. Currently, molecular mechanisms and the pathogenic activity of TTN gene mutation in ccRCC are not fully understood. Further studies will have to include larger samples of ccRCC patients with TTN gene mutation in order to confirm the relationship between the observed decreased survival in ccRCC patients with TTN gene mutation and changes of body composition towards cancer cachexia.
Here, for the first time, we suggested a correlation between CT derived body composition and VHL and TTN expression in ccRCC, and our data are likely to stimulate further studies on the topic. Indeed, understanding changes of body composition could be of extreme help for developing possible future therapeutic strategies aimed at blocking long non-coding RNA TTN-AS1, as they could help in non-invasive identification of TTN gene mutation.
The limitations of this study are the retrospective nature that did not allow for the presentation of further data, such as body mass index and hormonal status, the different number of patients that make up the groups, the small sample of patients with TTN mutation, and the absence of Asian and African American patients in the sample.
5. Conclusions
In conclusion, this study demonstrates for the first time a different body composition between ccRCC-VHL and ccRCC-TTN groups, with decreased quantity of TAT, VAT, SAT and TAM in the ccRCC-TTN group. These findings suggest a link between TTN gene mutation in ccRCC and cancer cachexia. Further studies will shed light on the role of this mutation in the pathogenesis of ccRCC, in cancer cachexia and in patient survival.
Author Contributions
Conceptualization, F.G. and C.A.M.; methodology, F.G. and C.A.M.; software, F.G. and C.A.M.; validation, F.G., A.T., R.F.G., B.B.Z. and C.A.M.; formal analysis, F.G. and C.A.M.; investigation, F.G. and C.A.M.; resources, F.G. and C.A.M.; data curation, F.G. and C.A.M.; writing—original draft preparation, F.G. and C.A.M.; writing—review and editing, F.G., A.T., R.F.G., B.B.Z. and C.A.M.; visualization, F.G. and C.A.M.; supervision, F.G., B.B.Z. and C.A.M.; project administration, F.G. and C.A.M. All authors have read and agreed to the published version of the manuscript.
Funding
This research did not receive any specific grant from funding agencies in the public, commercial, or not-for-profit sectors.
Institutional Review Board Statement
All the procedures were retrospective and agreed with the Declaration of Helsinki. CT images and data of ccRCC patients were retrieved from The Cancer Imaging Archive (TCIA). The TCIA project received approval of the Institutional Review Board. This subsequent retrospective analysis was on the publicly available, anonymized data and did not require further review due to previous protections implemented by TCIA.
Informed Consent Statement
All the subjects included in the study signed a written informed consent.
Data Availability Statement
The data presented in this study are openly available in the UALCAN program (http://ualcan.path.uab.edu, accessed on 1 November 2021) and in The Cancer Imaging Archive (https://wiki.cancerimagingarchive.net/display/Public/TCGA-KIRC, accessed on 1 November 2019).
Conflicts of Interest
The authors declare no conflict of interest.
References
- Available online: https://www.cancer.gov/about-nci/organization/ccg/research/structural-genomics/tcga (accessed on 1 November 2021).
- Alessandrino, F.; Krajewski, K.M.; Shinagare, A.B. Update on radiogenomics of clear cell renal cell carcinoma. Eur. Urol. Focus 2016, 2, 572–573. [Google Scholar] [CrossRef]
- Pinker, K.; Shitano, F.; Sala, E.; Do, R.K.; Young, R.J.; Wibmer, A.G.; Hricak, H.; Sutton, E.J.; Morris, E.A. Background, current role, and potential applications of radiogenomics. J. Magn. Reson. Imaging 2018, 47, 604–620. [Google Scholar] [CrossRef]
- Cancer Genome Atlas Research Network. Comprehensive molecular characterization of clear cell renal cell carcinoma. Nature 2013, 499, 43–49. [Google Scholar] [CrossRef]
- Seizinger, B.R.; Rouleau, G.A.; Ozelius, L.J.; Lane, A.H.; Farmer, G.E.; Lamiell, J.M.; Haines, J.; Yuen, J.W.; Collins, D.; Majoor-Krakauer, D.; et al. Von Hippel–Lindau disease maps to the region of chromosome 3 associated with renal cell carcinoma. Nature 1988, 332, 268–269. [Google Scholar] [CrossRef]
- Cowey, C.L.; Rathmell, W.K. VHL gene mutations in renal cell carcinoma: Role role as a biomarker of disease outcome and drug efficacy. Curr. Oncol. Rep. 2009, 11, 94–101. [Google Scholar] [CrossRef] [PubMed]
- Sala, E.; Mema, E.; Himoto, Y.; Veeraraghavan, H.; Brenton, J.D.; Snyder, A.; Weigelt, B.; Vargas, H.A. Unravelling tumour heterogeneity using next-generation imaging: Radiomics, radiogenomics, and habitat imaging. Clin. Radiol. 2017, 72, 3–10. [Google Scholar] [CrossRef]
- Despres, J.P.; Lemieux, I. Abdominal obesity and metabolic syndrome. Nature 2006, 444, 881–887. [Google Scholar] [CrossRef]
- Zhang, H.P.; Zou, J.; Xu, Z.Q.; Ruan, J.; Yang, S.D.; Yin, Y.; Mu, H.J. Association of leptin, visfatin, apelin, resistin and adiponectin with clear cell renal cell carcinoma. Oncol. Lett. 2017, 13, 463–468. [Google Scholar] [CrossRef] [PubMed][Green Version]
- Greco, F.; Cirimele, V.; Mallio, C.A.; Beomonte Zobel, B.; Grasso, R.F. Increased visceral adipose tissue in male patients with clear cell renal cell carcinoma. Clin. Cancer Investig. J. 2018, 7, 132–136. [Google Scholar] [CrossRef]
- Greco, F.; Quarta, L.G.; Grasso, R.F.; Beomonte Zobel, B.; Mallio, C.A. Increased visceral adipose tissue in clear cell renal cell carcinoma with and without peritumoral collateral vessels. Br. J. Radiol. 2020, 93, 20200334. [Google Scholar] [CrossRef] [PubMed]
- Del Buono, R.; Sabatino, L.; Greco, F. Neck fat volume as a potential indicator of difficult intubation: A pilot study. Saudi J. Anaesth. 2018, 12, 67–71. [Google Scholar]
- Greco, F.; Quarta, L.G.; Carnevale, A.; Giganti, M.; Grasso, R.F.; Beomonte Zobel, B.; Mallio, C.A. Subcutaneous Adipose Tissue Reduction in Patients with Clear Cell Renal Cell Carcinoma and Peritumoral Collateral Vessels: A Retrospective Observational Study. Appl. Sci. 2021, 11, 6076. [Google Scholar] [CrossRef]
- Lee, K.; Shin, Y.; Huh, J.; Sung, Y.S.; Lee, I.S.; Yoon, K.H.; Kim, K.W. Recent Issues on Body Composition Imaging for Sarcopenia Evaluation. Korean J. Radiol. 2019, 20, 205–217. [Google Scholar] [CrossRef]
- Akin, O.; Elnajjar, P.; Heller, M.; Jarosz, R.; Erickson, B.J.; Kirk, S.; Linehan, M.; Gautam, R.; Vikram, R.; Garcia, K.M.; et al. Radiology Data from The Cancer Genome Atlas Kidney Renal Clear Cell Carcinoma [TCGA-KIRC] collection. Cancer Imaging Arch. 2016. [Google Scholar] [CrossRef]
- Chandrashekar, D.S.; Bashel, B.; Balasubramanya, S.A.H.; Creighton, C.J.; Ponce-Rodriguez, I.; Chakravarthi, B.V.S.K.; Varambally, S. UALCAN: A Portal for Facilitating Tumor Subgroup Gene Expression and Survival Analyses. Neoplasia 2017, 19, 649–658. [Google Scholar] [CrossRef]
- Oh, J.H.; Jang, S.J.; Kim, J.; Sohn, I.; Lee, J.Y.; Cho, E.J.; Chun, S.M.; Sung, C.O. Spontaneous mutations in the single TTN gene represent high tumor mutation burden. NPJ Genom. Med. 2020, 5, 33. [Google Scholar] [CrossRef]
- Klempner, S.J.; Fabrizio, D.; Bane, S.; Reinhart, M.; Peoples, T.; Ali, S.M.; Sokol, E.S.; Frampton, G.; Schrock, A.B.; Anhorn, R.; et al. Tumor Mutational Burden as a Predictive Biomarker for Response to Immune Checkpoint Inhibitors: A Review of Current Evidence. Oncologist 2020, 25, e147–e159. [Google Scholar] [CrossRef]
- NIH National Cancer Institute. Available online: https://cancergenome.nih.gov/ (accessed on 1 November 2021).
- Clark, K.; Vendt, B.; Smith, K.; Freymann, J.; Kirby, J.; Koppel, P.; Moore, S.; Phillips, S.; Maffitt, D.; Pringle, M.; et al. The Cancer Imaging Archive (TCIA): Maintaining and Operating a Public Information Repository. J. Digit. Imaging 2013, 26, 1045–1057. [Google Scholar] [CrossRef] [PubMed]
- Noumura, Y.; Kamishima, T.; Sutherland, K.; Nishimura, H. Visceral adipose tissue area measurement at a single level: Can it represent visceral adipose tissue volume? Br. J. Radiol. 2017, 90, 20170253. [Google Scholar] [CrossRef]
- Prado, C.M.; Heymsfield, S.B. Lean tissue imaging: A new era for nutritional assessment and intervention. JPEN J. Parenter. Enteral. Nutr. 2014, 38, 940–953. [Google Scholar] [CrossRef] [PubMed]
- Bredella, M.A. Sex Differences in Body Composition. Adv. Exp. Med. Biol. 2017, 1043, 9–27. [Google Scholar]
- Kyle, U.G.; Genton, L.; Pichard, C. Body composition: What’s new? Curr. Opin. Clin. Nutr. Metab. Care 2002, 5, 427–433. [Google Scholar] [CrossRef]
- Wagner, D.R.; Heyward, V.H. Measures of body composition in blacks and whites: A comparative review. Am. J. Clin. Nutr. 2000, 71, 1392–1402. [Google Scholar] [CrossRef]
- Greco, F.; Mallio, C.A.; Grippo, R.; Messina, L.; Vallese, S.; Rabitti, C.; Quarta, L.G.; Grasso, R.F.; Beomonte Zobel, B. Increased visceral adipose tissue in male patients with non-clear cell renal cell carcinoma. Radiol. Med. 2020, 125, 538–543. [Google Scholar] [CrossRef]
- Greco, F.; Mallio, C.A. Relationship between Visceral Adipose Tissue and Genetic Mutations (VHL and KDM5C) in Clear Cell Renal Cell Carcinoma. Radiol. Med. 2021, 126, 645–651. [Google Scholar] [CrossRef]
- De Cubas, A.A.; Rathmell, W.K. Epigenetic modifers: Activities in renal cell carcinoma. Nat. Rev. Urol. 2018, 15, 599–614. [Google Scholar] [CrossRef]
- Fischer-Posovszky, P.; Wabitsch, M.; Hochberg, Z. Endocrinology of adipose tissue—An update. Horm. Metab. Res. 2007, 39, 314–321. [Google Scholar] [CrossRef]
- Raucci, R.; Rusolo, F.; Sharma, A.; Colonna, G.; Castello, G.; Costantini, S. Functional and structural features of adipokine family. Cytokine 2013, 61, 1–14. [Google Scholar] [CrossRef]
- Brugarolas, J. Molecular genetics of clear-cell renal cell carcinoma. J. Clin. Oncol. 2014, 32, 1968–1976. [Google Scholar] [CrossRef]
- Stebbins, C.E.; Kaelin, W.G., Jr.; Pavletich, N.P. Structure of the VHL-ElonginC–ElonginB complex: Implications for VHL tumor suppressor function. Science 1999, 284, 455–461. [Google Scholar] [CrossRef]
- Maxwell, P.H.; Wiesener, M.S.; Chang, G.W.; Clifford, S.C.; Vaux, E.C.; Cockman, M.E.; Wykoff, C.C.; Pugh, C.W.; Maher, E.R.; Ratcliffe, P.J. The tumor suppressor protein VHL targets hypoxia-inducible factors for oxygen-dependent proteolysis. Nature 1999, 399, 271–275. [Google Scholar] [CrossRef] [PubMed]
- Mattick, J.S.; Makunin, I.V. Non-coding RNA. Hum. Mol. Genet. 2006, 15 (Suppl. 1), R17–R29. [Google Scholar] [CrossRef] [PubMed]
- Miranda-Castro, R.; de-Los-Santos-Alvarez, N.; Lobo-Castanon, M.J. Long noncoding RNAs: From genomic junk to rising stars in the early detection of cancer. Anal. Bioanal. Chem. 2019, 411, 4265–4275. [Google Scholar] [CrossRef] [PubMed]
- Wapinski, O.; Chang, H.Y. Long noncoding RNAs and human disease. Trends. Cell. Biol. 2011, 21, 354–361. [Google Scholar] [CrossRef]
- Lin, K.; Chen, H.; Su, C.; Zhu, H.; Lai, C.; Shi, Y. Long Non-Coding RNA TTN-AS1 Serves as a Competing Endogenous RNA of miR-195 to Facilitate Clear Cell Renal Cell Carcinoma Progression. Cancer Manag. Res. 2020, 12, 3091–3097. [Google Scholar] [CrossRef] [PubMed]
- Dong, M.M.; Peng, S.J.; Yuan, Y.N.; Luo, H.P. LncRNA TTN-AS1 contributes to gastric cancer progression by acting as a competing endogenous RNA of miR-376b-3p. Neoplasma 2019, 66, 564–575. [Google Scholar] [CrossRef]
- Zhong, Y.; Wang, J.; Lv, W.; Xu, J.; Mei, S.; Shan, A. LncRNA TTN-AS1 drives invasion and migration of lung adenocarcinoma cells via modulation of miR-4677-3p/ZEB1 axis. J. Cell. Biochem. 2019, 120, 17131–17141. [Google Scholar] [CrossRef]
- Wang, Y.; Jiang, F.; Xiong, Y.; Cheng, X.; Qiu, Z.; Song, R. LncRNA TTN-AS1 sponges miR-376a-3p to promote colorectal cancer progression via upregulating KLF15. Life Sci. 2019, 244, 116936. [Google Scholar] [CrossRef]
- Cui, Z.; Han, B.; Wang, X.; Li, Z.; Wang, J.; Lv, Y. Long non-coding RNA TTN-AS1 promotes the proliferation and invasion of colorectal cancer cells by activating miR-497-mediated PI3K/Akt/mTOR signaling. Onco Targets Ther. 2019, 12, 11531–11539. [Google Scholar] [CrossRef]
Publisher’s Note: MDPI stays neutral with regard to jurisdictional claims in published maps and institutional affiliations. |
© 2022 by the authors. Licensee MDPI, Basel, Switzerland. This article is an open access article distributed under the terms and conditions of the Creative Commons Attribution (CC BY) license (https://creativecommons.org/licenses/by/4.0/).