Communication

Up-to-Date Optimization of the 90Y-PET/CT Reconstruction Protocol for Volumetric Quantification in Trans-Arterial RadioEmbolization (TARE) Procedures in the Era of Theranostics

1
Fondazione Policlinico Universitario A. Gemelli IRCCS, 00168 Rome, Italy
2
Università Cattolica del Sacro Cuore, 00168 Rome, Italy
3
UOS Fisica Medica, Mater Olbia Hospital, Strada Statale 125 Orientale Sarda, 07026 Olbia, Italy
4
ENEA, National Institute of Ionizing Radiation Metrology, 00123 Rome, Italy
*
Author to whom correspondence should be addressed.
Appl. Sci. 2022, 12(17), 8418; https://doi.org/10.3390/app12178418
Submission received: 19 July 2022 / Revised: 18 August 2022 / Accepted: 19 August 2022 / Published: 23 August 2022
(This article belongs to the Special Issue Developments of Diagnostic Imaging Applied in Radiotherapy)

Abstract

:
(1) Background: New generation of PET-CT scanners allows performing volumetric dosimetry based on 90Y-activity distribution. The aim of this study was to perform an up-to-date evaluation of the optimal 90Y-PET-CT reconstruction parameters for a Siemens Biograph mCT scanner. (2) Methods: A cylindrical uniform phantom (P1), IEC NEMA Body-phantom (P2) and IEC NEMA Torso-phantom (P3) filled with 90Y were acquired. The matrix size and number of Equivalent Iterations (E.I.) were evaluated through the Recovery Coefficient (RC) and the Coefficient of Variation (CoV). The optimal post-reconstruction Gaussian Filter (GF) was assessed through an analysis of Root Mean Square Error (RMSE) and Full Width at Half Maximum (FWHM) in DVHs. (3) Results: For P1, RC values showed constant trends varying the matrix size (slope m = 1.25 × 10⁻³) or E.I. (slope m = −2.16 × 10⁻⁴). For P2, CoV decreased increasing the matrix size and it grew increasing the E.I. For P3, RMSE and mean dose values showed constant trends varying the Gaussian filter (slope m = 1.51 × 10⁻²) while FWHM decreased increasing filter. For smaller volumes, RMSE grew increasing the filter (from 34% to 74%) and the use of larger filters resulted in a dose underestimation (from 172 to 133 Gy). (4) Conclusions: The optimal reconstruction parameters for the Siemens Biograph mCT PET/CT scanner are presented, combining old metrics with new ones involving a dosimetric approach.

1. Introduction

Trans-Arterial Radioembolization (TARE), also called Selective Internal Radiotherapy (SIRT), represents a valuable treatment option for patients with unresectable, malignant, primary or secondary hepatic tumors [1,2,3,4]. The 90Y-loaded microspheres, locally injected via catheterization, reach the lesion area exploiting liver vascularization [5], and they remain trapped in the microvasculature of tumor capillary vessels because of their embolic size. The short range in water of β-particles from 90Y decay (~11 mm) makes this treatment extremely selective; therefore, a high absorbed dose can be delivered to tumoral areas while sparing surrounding healthy tissue [5]. Since 90Y is a β-emitter with no gamma emissions, post-implantation imaging and dose delivery confirmation has previously been based on bremsstrahlung imaging with single photon emission computed tomography (SPECT) [6]. The resulting SPECT images are generally of poor quality, with little delineation of heterogeneity and limited quantitative interpretation, even if new specialized software and acquisition modes have shown promise [7,8]. The recognition of the positron-generating decay branch of 90Y has opened the possibility of using PET/CT systems as an alternative for the direct imaging of implanted microspheres [9,10]. Different studies have demonstrated the feasibility of 90Y PET/CT for post-injection treatment monitoring and its advantages over bremsstrahlung SPECT scanning [10,11]. For this reason, there is a growing interest in investigating 90Y quantification, based on phantom and post-radioembolization patient studies, to evaluate the 90Y-PET/CT performance, improving its accuracy and defining a standard protocol for image acquisition and reconstruction with PET/CT scanners [12,13]. The new generation of PET-CT scanners with Time-of-Flight (ToF) technology has improved performances, allowing for the implementation of volumetric 90Y-dosimetry techniques and for the investigation of tumor dose-response directly based on 3D 90Y-activity distribution [14,15,16]. Many authors have tried to establish a routine protocol for 90Y-PET/CT in terms of bed-time acquisition, matrix size, the number of Equivalent Iterations (EI), defined as the product of iterations and subsets, and the post-reconstruction Gaussian filter [17,18,19,20,21]. Siman et al. [21] recently presented an approach to optimization that also involves the evaluation of Dose Volume Histograms (DVH) and absorbed dose distribution. In particular, they used the Root Mean Square Error (RMSE) extracted from integral DVHs (iDVHs) as a metric to evaluate the best 90Y-PET/CT reconstruction parameters. The aim of this study was to perform an up-to-date evaluation of the optimal 90Y PET-CT reconstruction parameters (in terms of Matrix Size, EI and Gaussian Filter) to improve the accuracy of quantification and dosimetry, combining old metrics (RC convergence and CoV evaluation) with new ones, involving a dosimetric approach. In addition to RMSE metric, we proposed the use of Full Width at Half Maximum (FWHM), extracted from the analysis of differential DVHs (dDVHs), as a second complementary metric.

2. Materials and Methods

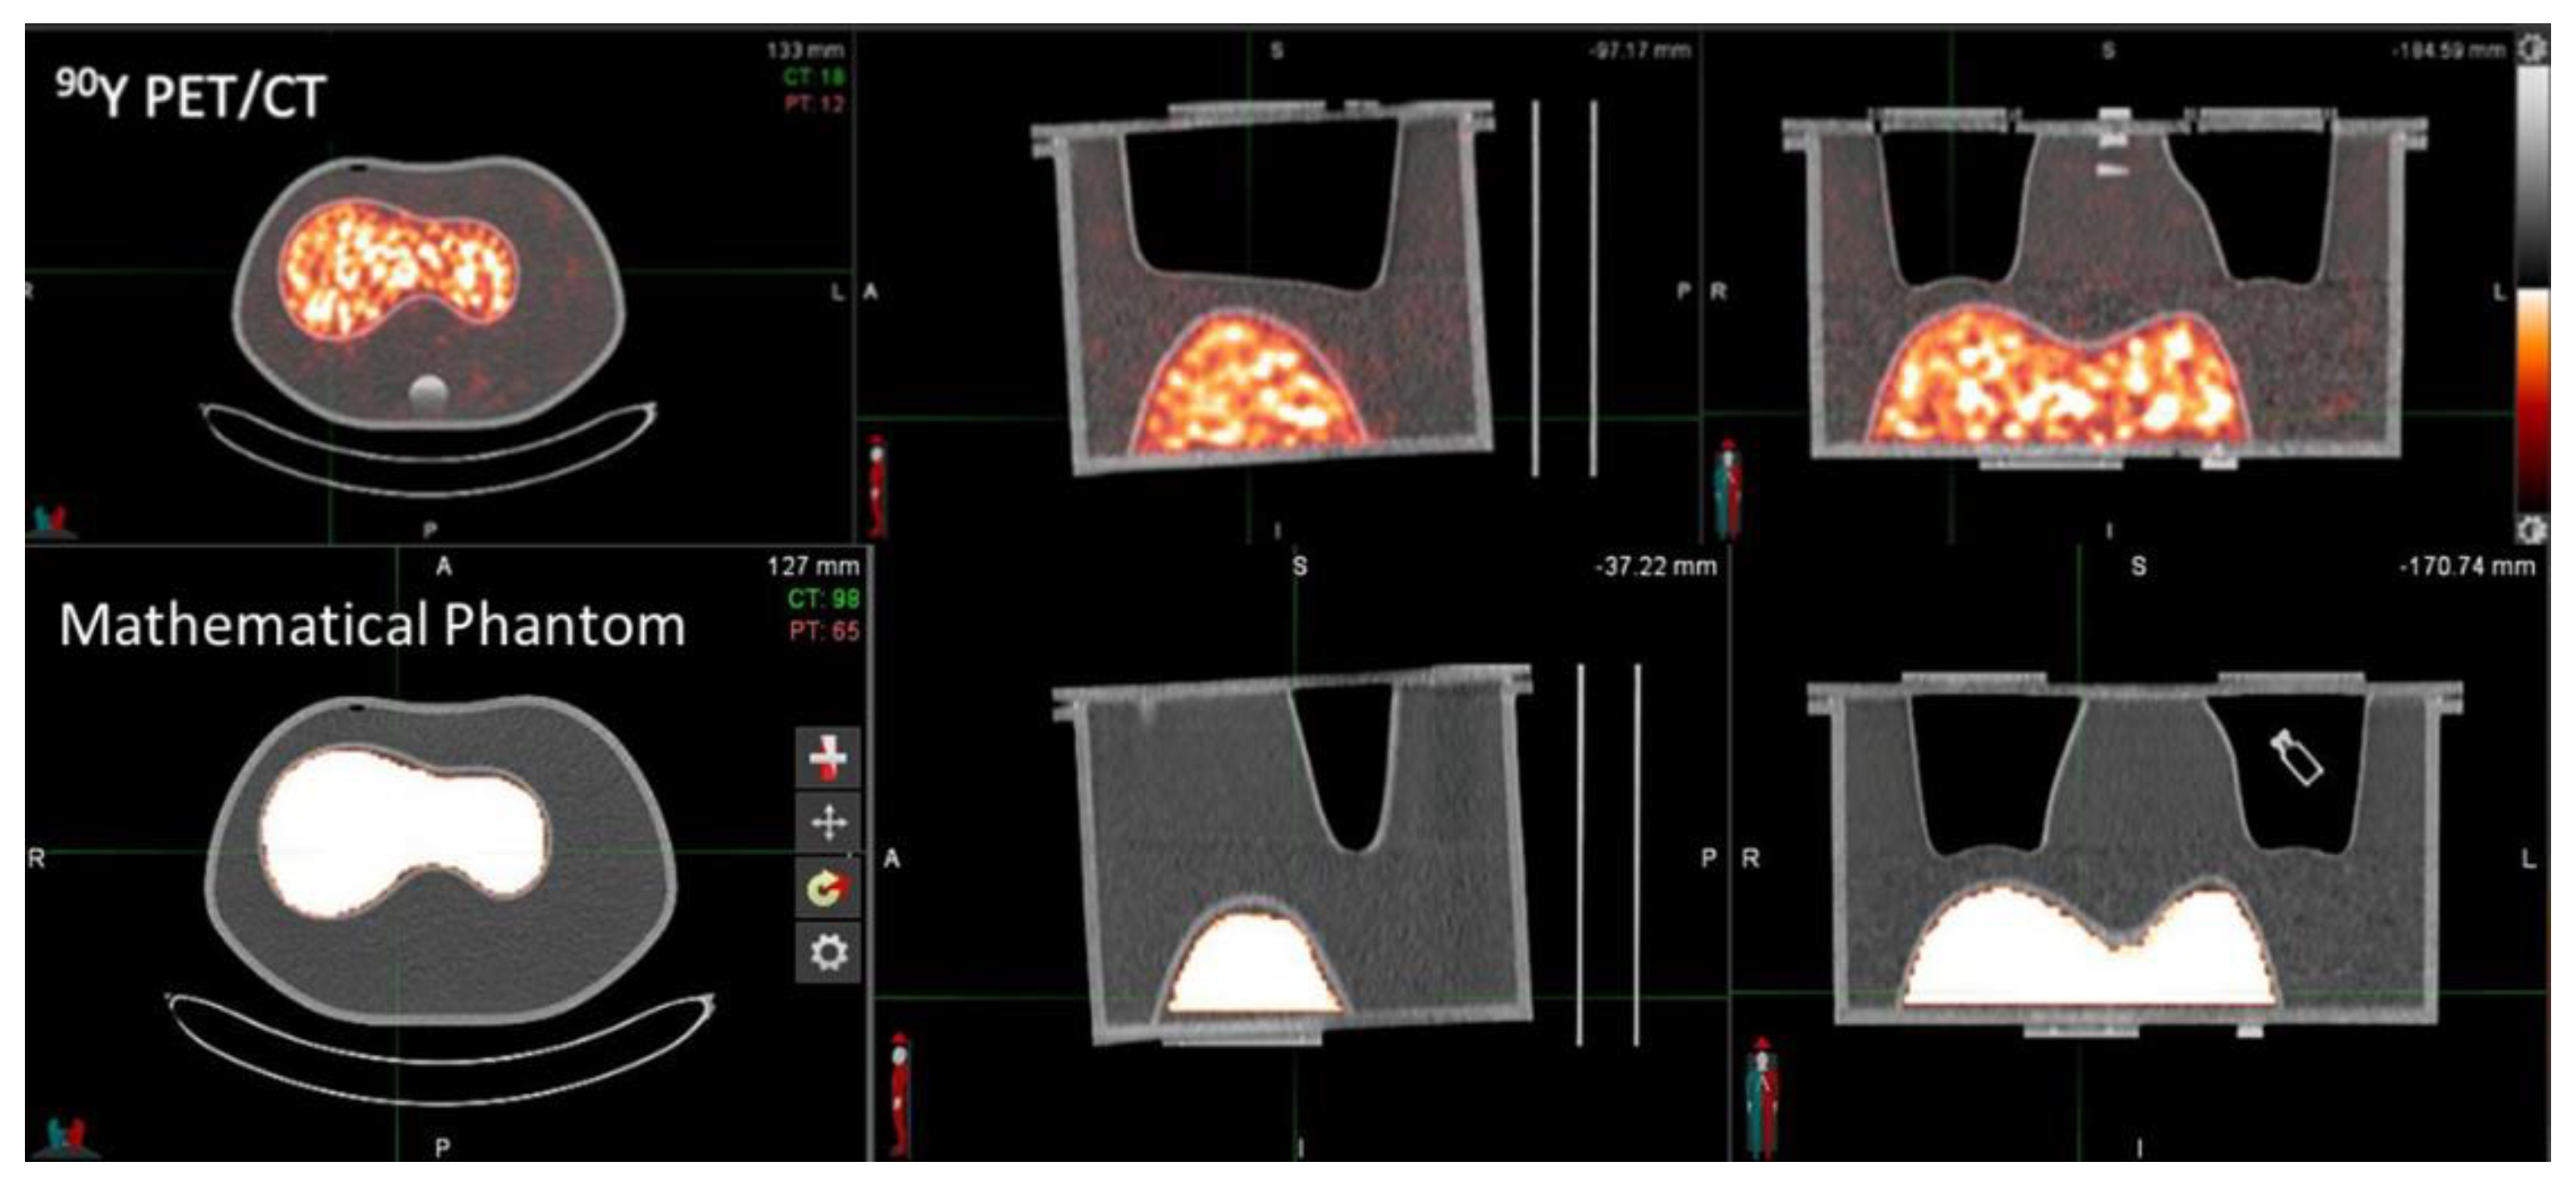
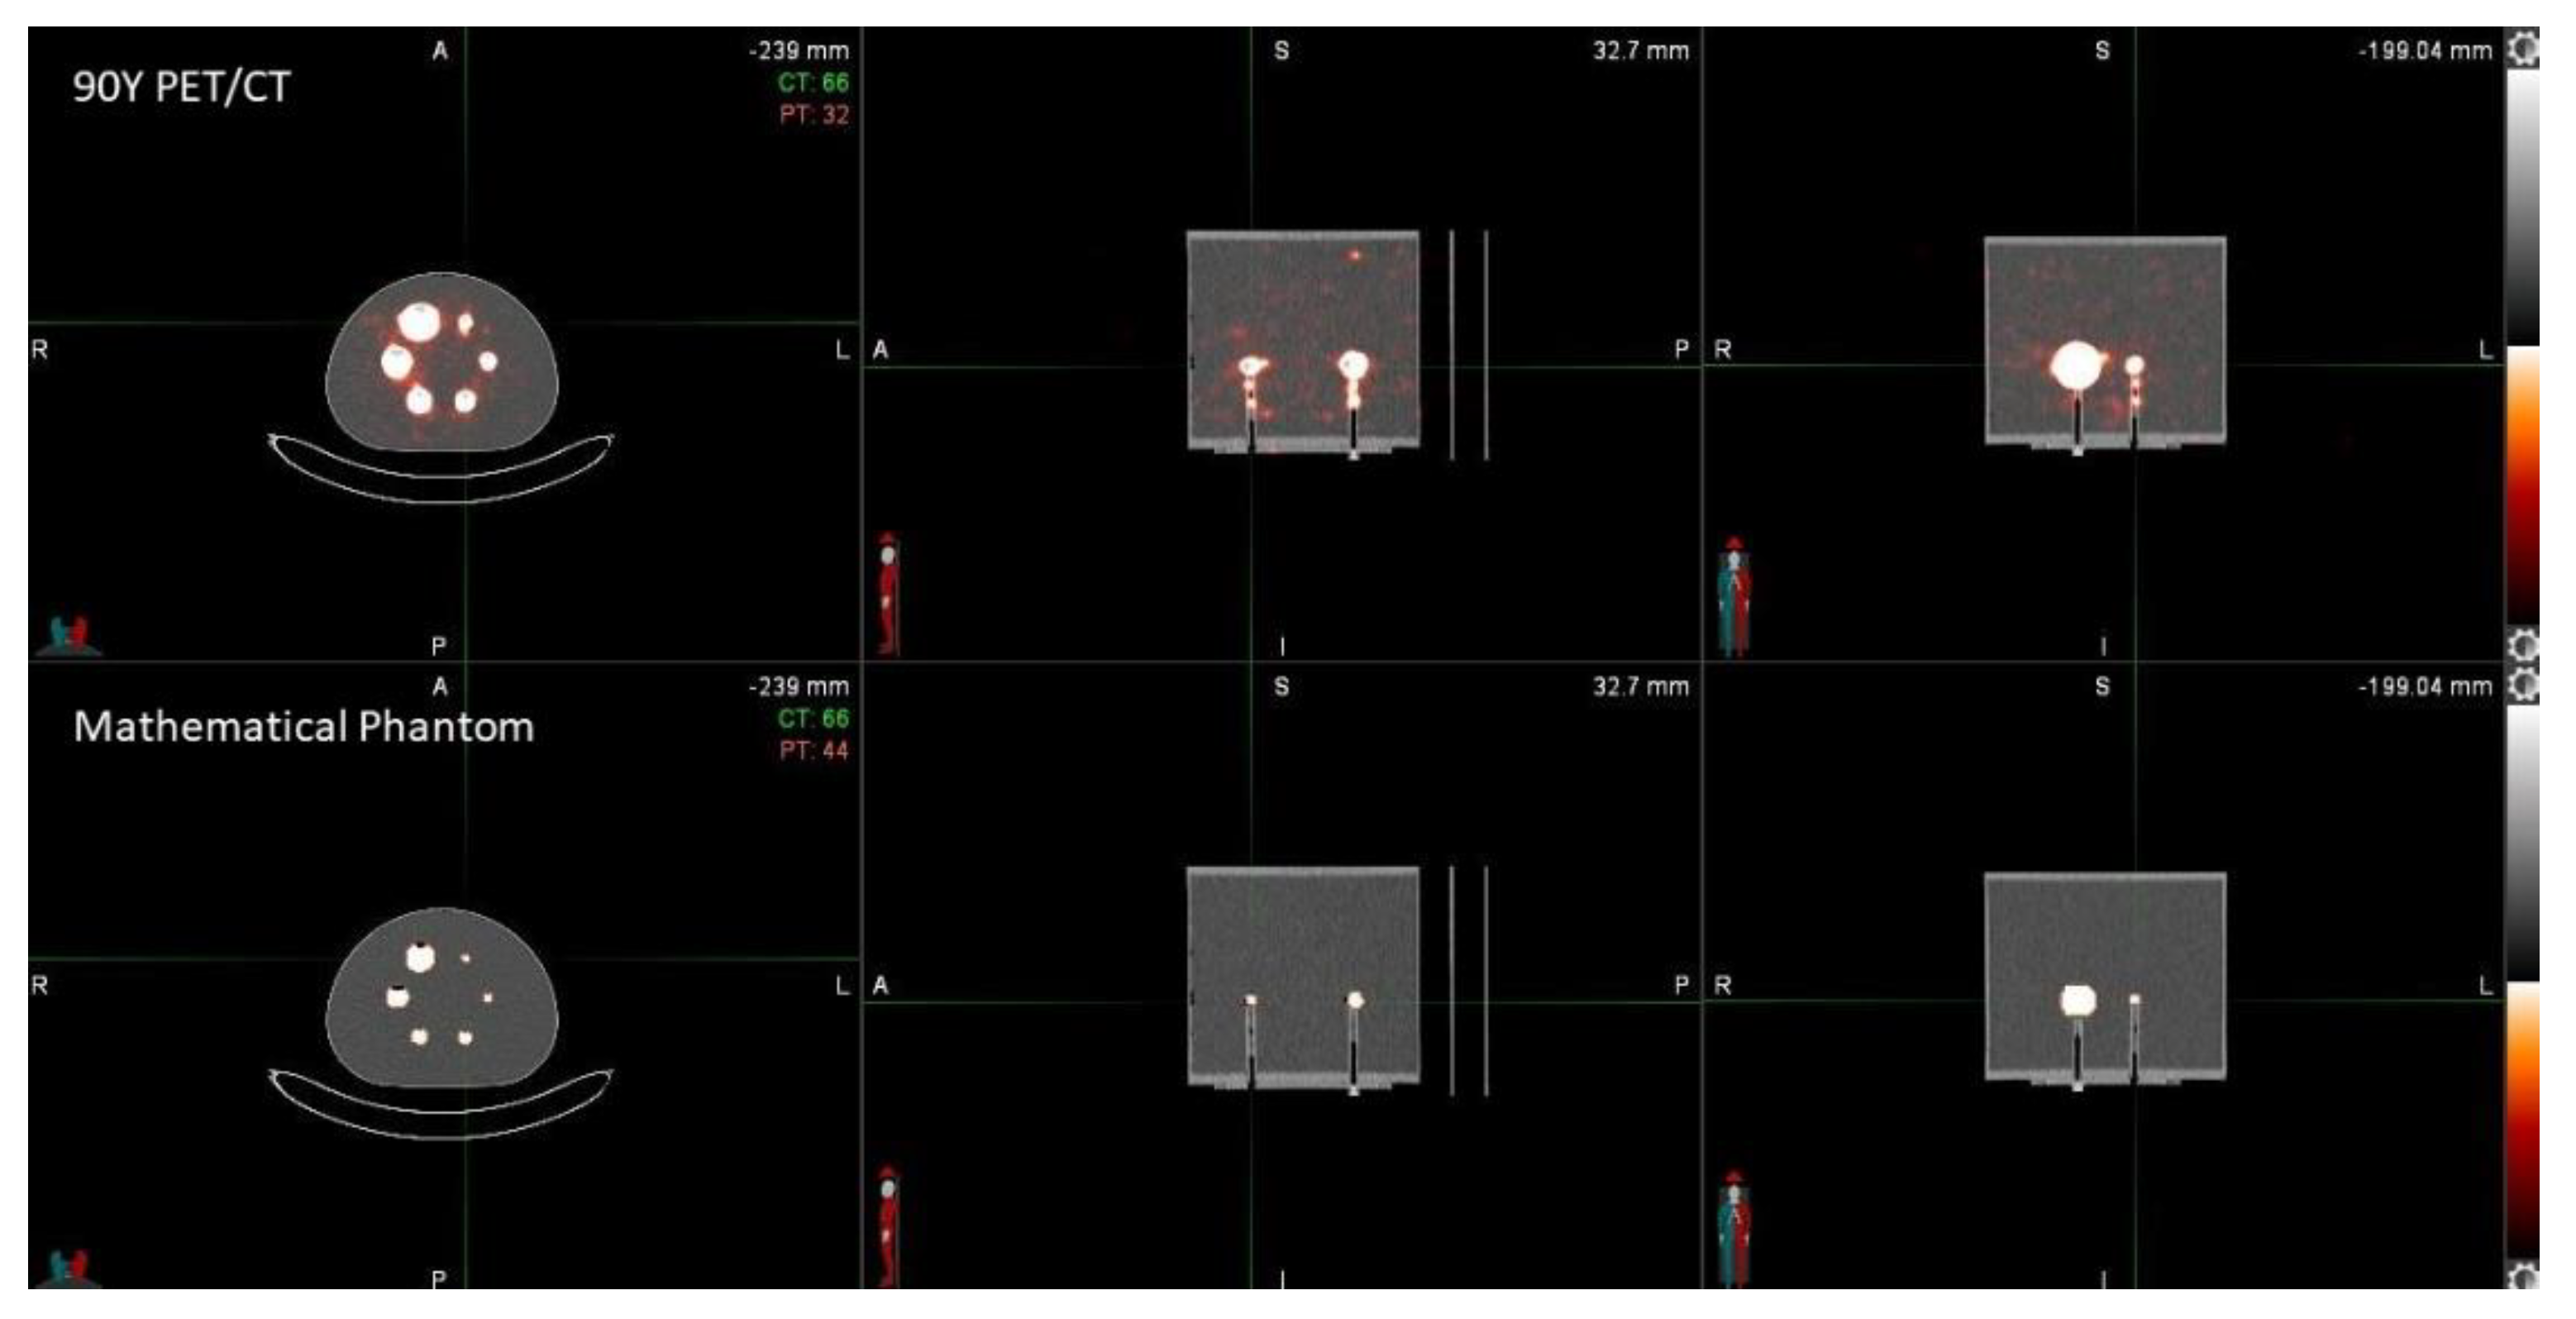
2.1. Data Acquisition, Phantom Description and VOI Segmentation

Phantom images were acquired using a Siemens Biograph mCT PET/CT scanner (Siemens Healthineers, Chicago, IL, USA). It combines a 64-slice CT with a TOF PET axial field of view of 21.8 cm. The PET scanner is composed of four rings of 48 detector blocks, with each one containing 13 × 13 lutetium oxyorthosilicate (LSO) crystals with dimensions of 4 × 4 × 20 mm3. Three phantoms were used for PET/CT acquisitions: a PMMA cylindrical phantom with a 10 L nominal volume, an IEC NEMA Body Phantom (PET/IEC-BODY/P, Data Spectrum Corporation, Hillsborough, NC, USA) and an IEC NEMA Torso (ECT/TOR/P, Data Spectrum Corporation, Hillsborough, NC, USA), named P1, P2 and P3, respectively, in the following. All phantoms were firstly filled with a solution of distilled water and diethylenetriaminepentaacetic acid (DTPA) at a concentration of 0.2 g/L to prevent the binding of 90Y to phantom walls. Subsequently, a 90Y-trichloride solution was added. P1 was uniformly filled with a clinically relevant quantity of 90Y activity concentration of 0.2 MBq/mL. P2’s spheres were filled with a 90Y activity concentration of 4.8 MBq/mL. Lastly, P3’s liver compartment was filled with a 90Y activity concentration of 1.2 MBq/mL. Activity measurements, used as ground truth, were performed using an ENEA-INMRI portable triple-to-double coincidence ratio (TDCR) counter, which provides a relative standard uncertainty below 1% [22,23,24]. Weightings of liquid solutions were performed with high-precision balances, providing accuracies below 0.01 g (Sartorius, mod. ED224S, Goettingen, Germany). For all phantoms, images were acquired in the list mode for 30 min in a single-bed position PET/CT using Siemens ultraHD PET algorithm (i.e., ToF + HD PET). Different matrix sizes, numbers of EI and Gaussian filters were used in the image reconstruction process to evaluate the effects of these parameters on the data accuracy for clinical dosimetric purposes. VOIs were drawn based on CT images and a verification of volumes was performed in order to limit edge effects.

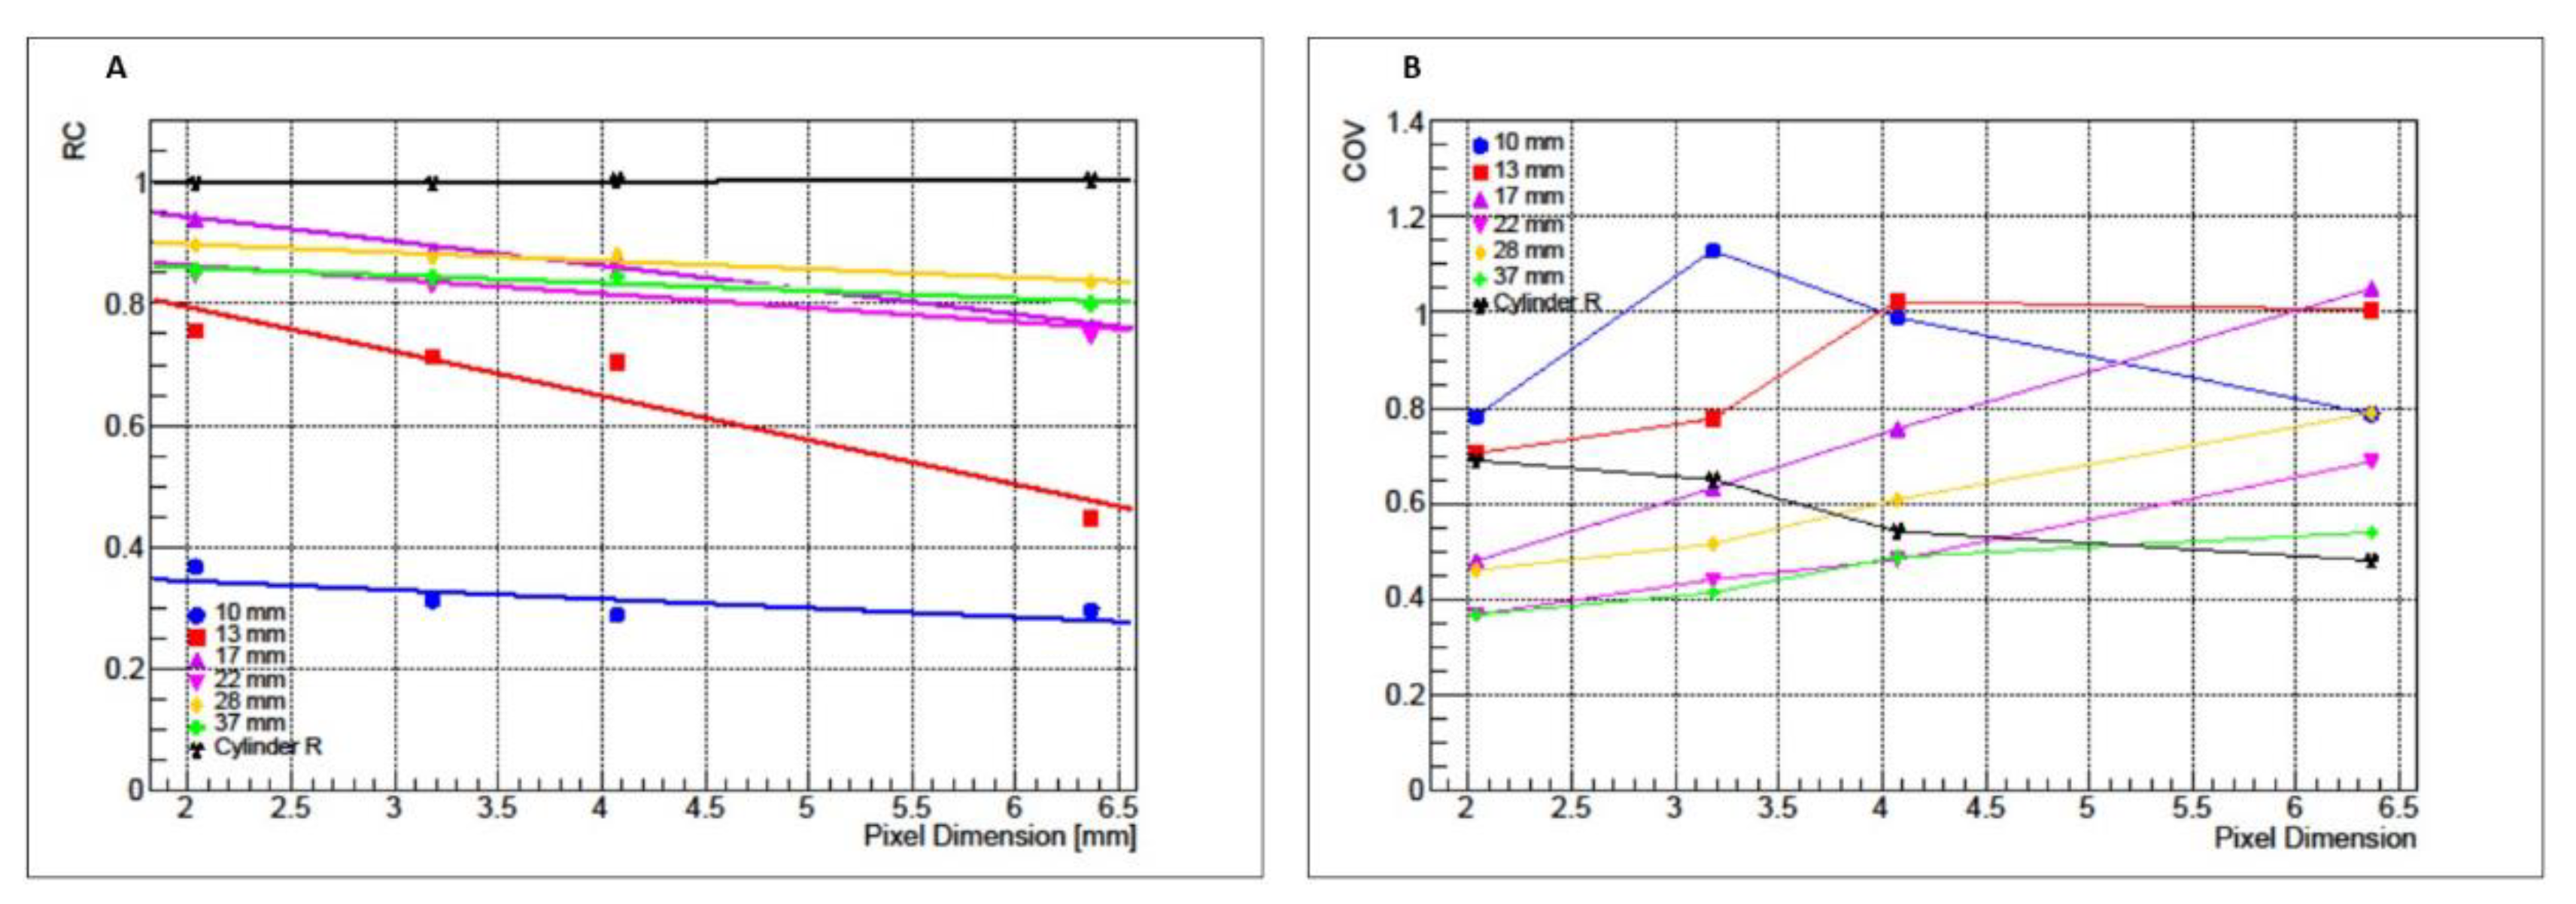
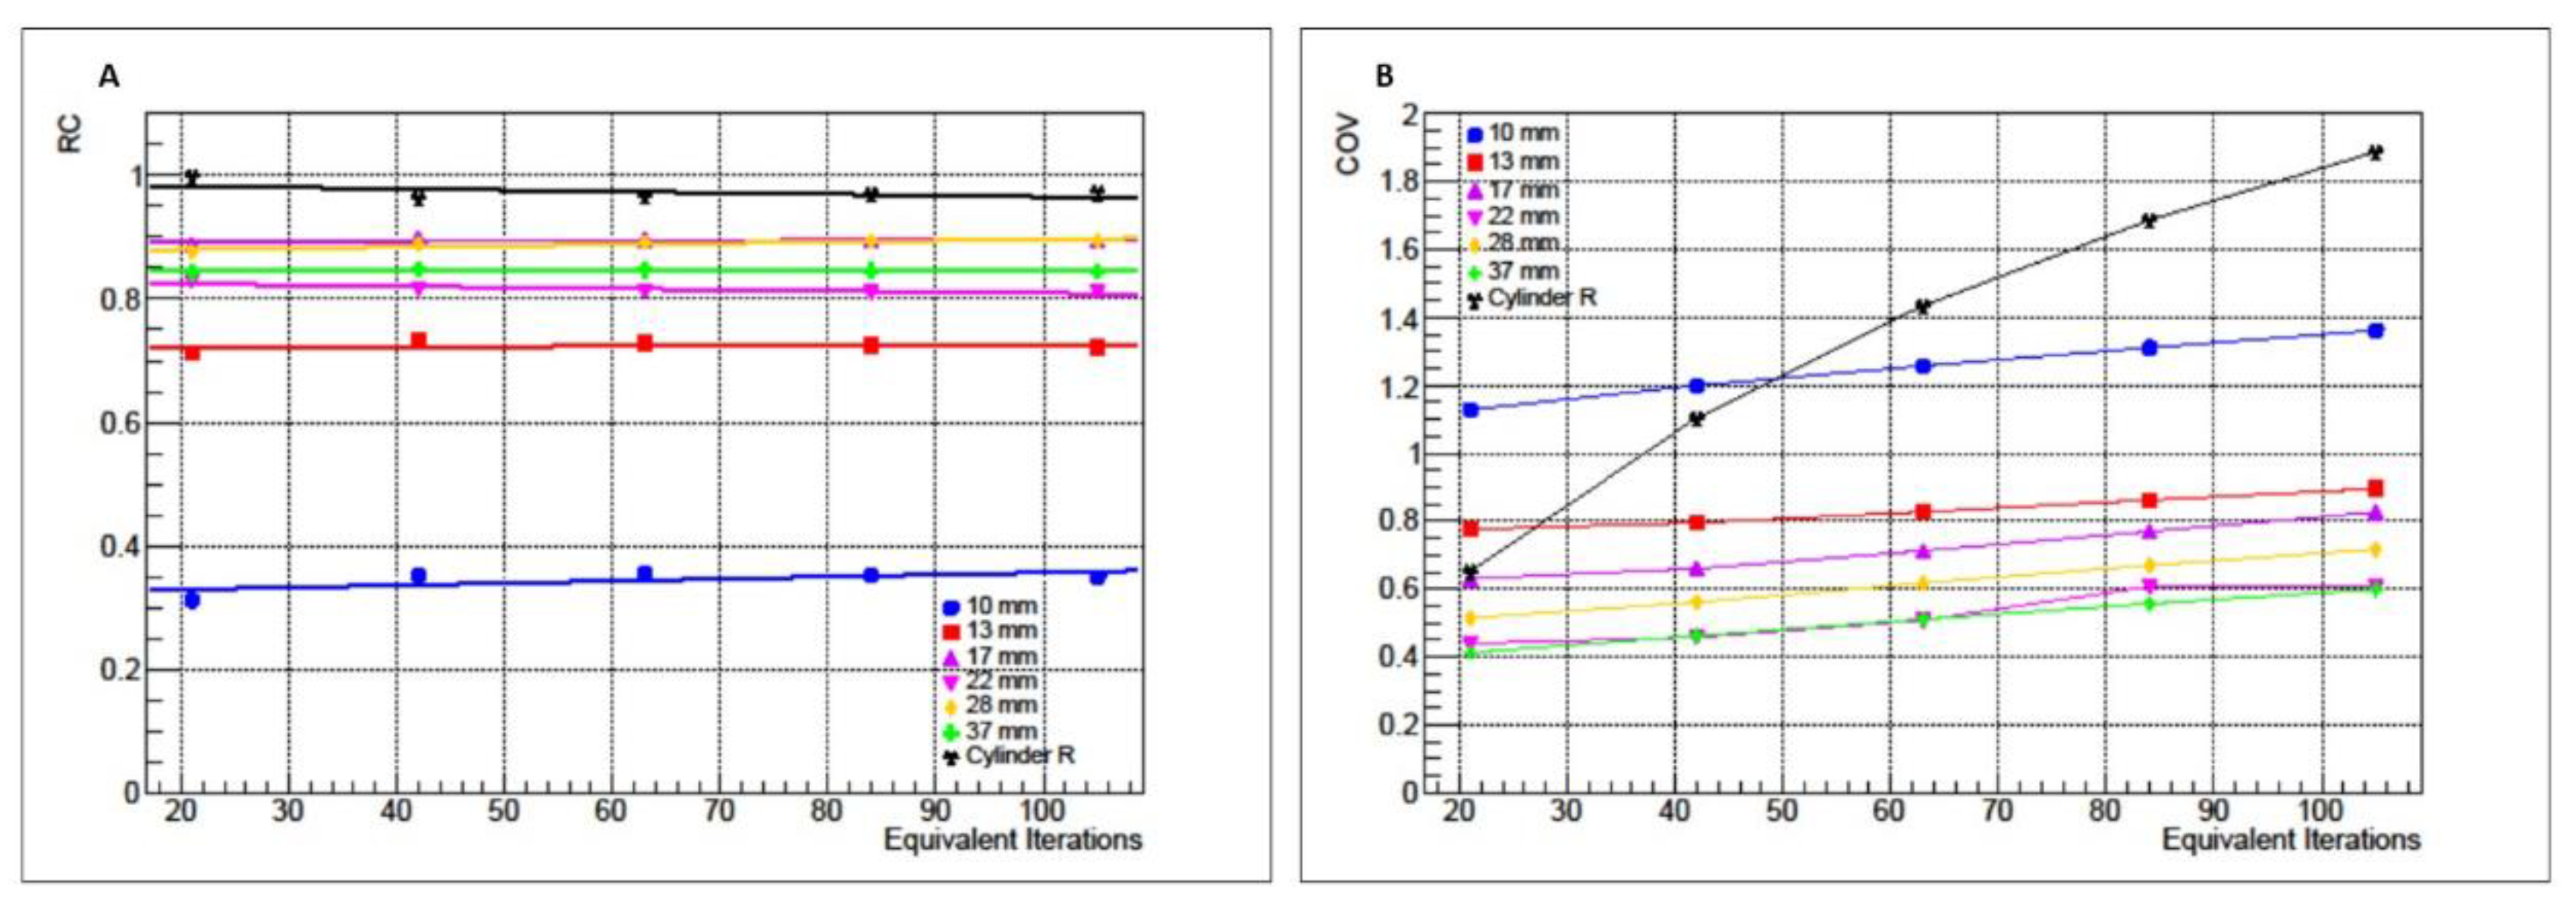
2.2. Matrix Size and Equivalent Iterations Analysis

The first round of reconstructions was performed on P1 and P2 images, varying the matrix size (128 × 128, 200 × 200, 256 × 256 and 400 × 400). The number of EIs was fixed to 21 (1 iteration, 21 subsets), using the clinical default setting of the scanner, and no Gaussian filter was selected. The quantitative data accuracy was evaluated by analyzing RC values, defined as:
RC (%) = C_voi/C_true × 100,
where C_voi is the VOI mean activity concentration (kBq/mL) extracted from the image, and C_true is the activity concentration in the VOI (kBq/mL) calculated from the ground truth measurements with the TDCR counter. Image noise was assessed with the Coefficient of Variation, defined as:
CoV(%) = SD_voi/C_voi ×100,
where [SD]_voi is the standard deviation of C_voi (kBq/mL) and C_voi is the VOI mean activity concentration (kBq/mL) extracted from the image. After choosing the matrix size, a verification of the impact of EI on the RC and CoV was performed, varying Equivalent Iterations from 21 to 105 without using any Gaussian Filter. The combination of EI was obtained only varying the number of iterations (1 to 5) without changing the number of subsets (fixed to 21 by manufacturer).

2.3. Gaussian Filter Analysis

A dosimetric approach was implemented to evaluate the impact of the Gaussian filter (varying from 0 up to 12 mm) on reconstructed 90Y PET images. MIM Sure Plan (version 6.9.4, MIM Software Inc, Cleveland, OH) was used to generate absorbed dose maps, starting from the PET acquisitions of P2 and P3, using the MIRD-17 voxel S-values approach [25] and obtaining both integral experimental DVH (iDVHexp) and differential experimental DVH (dDVHexp). Integral reference DVH (iDVHref) and differential reference DVH (dDVHref) were also obtained starting from two reference PET/CT mathematical phantoms, representing the P2 and P3, filled with the ground truth activity concentrations measured with the TDCR. In order to verify the accuracy in quantitative data, for each PET/CT data acquisition, as proposed by Siman et al. [21], the RMSE was evaluated as (3):
R M S E = i = 20 80 ( D i , e x p D i , r e f ) 2 60
where D(i,exp) is the dose at i% volume coverage in DVHexp, whereas D(i,ref) is the dose at the same i% volume coverage in DVHref. Moreover, considering the differential DVH (dDVH), a Gaussian-like shape distribution, the FWHM of the dDVH distribution was evaluated in each PET/TC acquisition as:
FWHM_Ddvh = 2.35∙σ
where σ is the standard deviation of the dDVH distribution from the Gaussian fit.
For P2, this dosimetric analysis was performed only on the 37 mm sphere because of its clinical relevance and to avoid partial volume effects, which highly affect dose values of smaller spheres.

3. Results

RCs and CoVs obtained from PET/CT reconstructed images of P1 and P2 are reported, respectively, in Figure 1A,B as functions of matrix size.
For P1, RC values are not affected by changes in matrix size. Data linear regression shows a slope m equal to 1.25 × 10−32 = 8.25 × 10⁻⁶). Conversely, CoV grows increasing the matrix size with a variation of 21%. For P2, the RC values show an approximately constant trend by changing the matrix size with a maximum variation of 10% observed for the 10 mm sphere while CoV decreases increasing the matrix size with a maximum variation of 34% observed for the 10 mm sphere.
The RC and CoV values obtained from PET/CT reconstructed images of P1 and P2 are reported in Figure 2A,B, respectively, as functions of EI.
For P1 and P2, the RC values are not affected by changes in EI. The data linear regression shows a mean slope m equal to 3.44 × 10⁻⁵ (± 2.00 × 10⁻⁴). Similarly, CoV grows, increasing the EI both for P1 (variation of 123%) and P2 (maximum variation of 23%).
In order to obtain reconstructed images suitable for both phantoms, a 256 × 256 matrix was selected, and the number of EIs was fixed to 21, since an increase in iterations results in higher image noise. The 256 × 256 matrix (corresponding to 3.18 mm × 3.18 mm pixel) was also selected considering the 90Y-PET spatial resolution for the mCT scanner (~3 mm). In Figure 3 and Figure 4, images of experimental 90Y-PET/CT and mathematical uniform IEC NEMA Torso phantoms and IEC NEMA Phantom used for the dosimetric approach in the Gaussian filter analysis are reported.
iDVHref and iDVHexp for the P3 liver compartment are shown in Figure 5A for different Gaussian filters. Similarly, iDVHref and iDVHsexp for the 37 mm sphere in P2 are shown in Figure 5B for different Gaussian filters.
For the P3 liver compartment, the mean absorbed doses show an approximately constant value of 51 Gy [50.4–53.1 Gy] increasing the Gaussian filter amplitude while standard deviations decrease from 17.7 Gy to 13.0 Gy, with a more uniform absorbed dose map with high filters. Conversely, for the P2 37 mm sphere, the mean absorbed dose values for each iDVHexp decrease from 172.2 Gy to 133.8 Gy increasing the Gaussian filter magnitude while standard deviations remain at approximately 41 Gy [40.2–41.3 Gy].
Varying the Gaussian filter magnitudes RMSE values for the liver compartment remain approximately constant [0.156–0.163] while for 37 mm sphere grows [0.377–0.744], as reported in Figure 6.
dDVHref and dDVHsexp for the liver compartment in P3 are shown in Figure 7A for different Gaussian filters. Similarly, dDVHref and dDVHsexp for the 37 mm sphere in P2 are shown in Figure 7B for different Gaussian filters. dDVHsexp for the P3 liver compartment shows Gaussian-like shapes (R2 = 0.9854) with approximately constant mean absorbed dose values [50.7–52.6 Gy] increasing the Gaussian filter magnitude. Standard deviations decrease increasing the Gaussian filter magnitude from 15.9 Gy (FWHM = 37.6 Gy) to 11.9 Gy (FWHM = 28.1 Gy) with a more uniform absorbed dose map with high filters. Conversely, the 37 mm sphere mean absorbed dose values for each dDVHexp decrease from 172 Gy to 134 Gy increasing the Gaussian filter magnitude while standard deviations remain approximately the same [40.2–42.1 Gy].

4. Discussion

In the last years, 90Y PET imaging has posed a unique challenge, primarily due to the extremely low positron yield of 32 × 10−6 per 90Y disintegration [9]. Many authors have shown the feasibility of 90Y PET for imaging microspheres after radioembolization procedures [10,15,18,26,27]. In this sense, the main goal of 90Y PET is the estimation of the dose delivered to the tumor and normal tissues. Therefore, the accuracy of the PET image in terms of the quantitative pixel value in Bq/mL is of the highest relevance, especially for the possibility to establish a dose–response correlation also at local level [15,16,28]. In this study, different set-ups of reconstruction for 90Y PET-images were investigated, and different types of analyses and metrics were used. Starting from the choice of matrix size, the effects of different matrix sizes were investigated without the bias generated by using a Gaussian filter and for a fixed number of iterations and subsets. Since there is independence for RCs and SUV from the matrix reconstruction dimension, it is reasonable to choose a matrix size of about 256 × 256, which provides a pixel value of 3.18 × 3.18 mm, considering that the resolution for the 90Y PET is approximately 3 mm [12]. Moving to the choice of the number of EIs, linear regression fits of RCs as functions of the number of EIs show independence of RCs from the number of EIs. For the 21 EIs, a convergence is achieved, and an increase in EIs only results in higher image noise. For this reason, the minimum number of EIs (i.e. 21) which are available for a Siemens mCT Biograph, is fixed. Lastly, the study of Gaussian filters was realized using dosimetric approaches. The evaluation of RMSE in iDVH proposed by Siman et al. [21] and the evaluation of FWHM in dDVH proposed in this work as a complementary metric allows for the evaluation of the accuracy of dose quantification. This analysis shows that there is an inverse trend for smaller volumes and larger ones. For larger volumes, RMSE and mean absorbed doses show independence from the choice of filter (slope m values of 0.0151 and 0.083 respectively), and FWHM decreases with increasing filter values, passing from 41.3 with no filter to 30.8 with a 12 mm filter. On the other hand, for smaller volumes, there is an inverse behavior; RMSE increases with increasing filter thickness. Moreover, for all P2’s spheres, the Gaussian-like shape distribution of dDVH is lost, likely due to partial volume effects, poor counting statistics and limited spatial resolution. In this condition, it is not possible to use the FWHM metric, and more studies should be conducted in this way to establish a cut-off value that represents the real limit of this new metric, especially when the volumes of interest are close to scanner spatial resolution. Evaluations of the possibility to introduce a new metric should also be considered. It should be noticed that this alternative metric can be used only on phantom studies with a uniform and known activity to evaluate the best scanner’s reconstruction parameters. In conclusion, a 6 mm Gaussian filter, corresponding to twice the resolution, can provide an adequate level of accuracy both for small and large volumes, even if adjustments should be performed when the lesion size is smaller than the scanner resolution. Generally, the Gaussian filter can be a free parameter that should be modeled depending on the clinical volume of interest. Moreover, in this aspect, more studies should be conducted to establish an objective guideline to follow in all situations. These future studies should be based firstly on phantoms and should subsequently be validated on patients. Surely, the higher effective sensitivity of new digital PET/CT scanners could particularly improve 90Y-PET-CT imaging. In this sense, a study has been performed by Kunnen et al. [29] by comparing the new digital Siemens PET-CT “Biograph Vision” with its predecessor “Biograph mCT”. The results of this first study show that the new digital scanner outperforms the mCT because of its lower noise level, but based on quantitative measurements, both scanners perform similarly. This suggests that a smooth upgrade during quantitative studies is possible, if the proper reconstruction protocol is chosen.

5. Conclusions

In this work, a set of optimal reconstruction parameters (matrix = 256 × 256, EI = 21, GF = 6 mm) for 90Y-PET images acquired with the Siemens Biograph mCT PET-CT scanner is presented. The optimization was performed combining old metrics (RC convergence and CoV evaluation) with new ones, involving a dosimetric approach (RMSE and FWHM in DVHs). This allows one to obtain reconstructed images suitable for post-TARE dosimetry, even if a careful evaluation of the Gaussian filter should be assessed when dealing with small lesions.

Author Contributions

Conceptualization, A.C. and L.I.; Methodology, A.C. and L.I.; Formal Analysis, A.C., R.M. and A.M.; Investigation, L.I., A.C., L.P., D.C., M.N., S.A., M.D. and M.C.; Writing—Original Draft Preparation, A.C., R.M. and A.M.; Writing—Review and Editing, L.I., A.C., L.P., M.N. and S.A.; Supervision, L.I.; Project Administration, L.I. All authors have read and agreed to the published version of the manuscript.

Funding

This research received no external funding.

Institutional Review Board Statement

Not applicable.

Informed Consent Statement

Not applicable.

Data Availability Statement

The raw data supporting the conclusion of this article will be made available by the authors, without undue reservation.

Conflicts of Interest

The authors declare no conflict of interest.

References

  1. Cianni, R.; Urigo, C.; Notarianni, E.; Saltarelli, A.; Salvatori, R.; Pasqualini, V.; Dornbusch, T.; Cortesi, E. Selective internal radiation therapy with SIR-spheres for the treatment of unresectable colorectal hepatic metastases. Cardiovasc. Interv. Radiol. 2009, 32, 1179–1186. [Google Scholar] [CrossRef] [PubMed]
  2. Salem, R.; Thurston, K.G.; Carr, B.I.; Goin, J.E.; Geschwind, J.F.H. Yttrium-90 microspheres: Radiation therapy for unresectable liver cancer. J. Vasc. Interv. Radiol. 2002, 13, S223–S229. [Google Scholar] [CrossRef]
  3. Edeline, J.; Touchefeu, Y.; Guiu, B.; Farge, O.; Tougeron, D.; Baumgaertner, I.; Ayav, A.; Campillo-Gimenez, B.; Beuzit, L.; Pracht, M.; et al. Radioembolization plus chemotherapy for first-line treatment of locally advanced intrahepatic cholangiocarcinoma: A phase 2 clinical trial. JAMA Oncol. 2020, 6, 51–59. [Google Scholar] [CrossRef] [PubMed]
  4. Mulcahy, M.; Salem, R.; Mahvash, A.; Pracht, M.; Montazeri, A.; Bandula, S.; Hermann, K.; Brown, E.; Zuckerman, D.; Wilson, G.; et al. LBA21 Radioembolization with chemotherapy for colorectal liver metastases: A randomized, open-label, international, multicenter, phase III trial (EPOCH study). Ann. Oncol. 2021, 32, S1295. [Google Scholar] [CrossRef]
  5. Dezarn, W.A.; Cessna, J.T.; DeWerd, L.A.; Feng, W.; Gates, V.L.; Halama, J.; Kennedy, A.S.; Nag, S.; Sarfaraz, M.; Sehgal, V.; et al. Recommendations of the American association of physicists in medicine on dosimetry, imaging, and quality assurance procedures for 90Y microsphere brachytherapy in the treatment of hepatic malignancies. Med. Phys. 2011, 38, 4824–4845. [Google Scholar] [CrossRef]
  6. Siman, W.; Mikell, J.K.; Kappadath, S. Practical reconstruction protocol for quantitative 90Y bremsstrahlung SPECT/CT. Med. Phys. 2016, 43, 5093–5103. [Google Scholar] [CrossRef]
  7. Walrand, S.; Hesse, M.; Demonceau, G.; Pauwels, S.; Jamar, F. Yttrium-90-labeled microsphere tracking during liver selective internal radiotherapy by bremsstrahlung pinhole SPECT: Feasibility study and evaluation in an abdominal phantom. EJNMMI Res. 2011, 1, 1–14. [Google Scholar] [CrossRef]
  8. Yue, J.; Mauxion, T.; Reyes, D.K.; Lodge, M.A.; Hobbs, R.F.; Rong, X.; Dong, Y.; Herman, J.M.; Wahl, R.L.; Geschwind, J.-F.H.; et al. Comparison of quantitative Y-90 SPECT and non-time-of-flight PET imaging in post-therapy radioembolization of liver cancer. Med. Phys. 2016, 43, 5779–5790. [Google Scholar] [CrossRef]
  9. Selwyn, R.G.; Nickles, R.J.; Thomadsen, B.R.; DeWerd, L.A.; Micka, J.A. A new internal pair production branching ratio of 90Y: The development of a non-destructive assay for 90Y and 90Sr. Appl. Radiat. Isot. 2007, 65, 318–327. [Google Scholar] [CrossRef]
  10. Wright, C.L.; Binzel, K.; Zhang, J.; Wuthrick, E.J.; Knopp, M.V. Clinical feasibility of 90 Y digital PET/CT for imaging microsphere biodistribution following radioembolization. Eur. J. Nucl. Med. Mol. Imaging 2017, 44, 1194–1197. [Google Scholar] [CrossRef]
  11. Elschot, M.; Vermolen, B.J.; Lam, M.G.; de Keizer, B.; van den Bosch, M.A.; de Jong, H.W. Quantitative comparison of PET and Bremsstrahlung SPECT for imaging the in vivo yttrium-90 microsphere distribution after liver radioembolization. PLoS ONE 2013, 8, e55742. [Google Scholar] [CrossRef] [PubMed]
  12. Martí-Climent, J.M.; Prieto, E.; Elosúa, C.; Rodríguez-Fraile, M.; Domínguez-Prado, I.; Vigil, C.; García-Velloso, M.J.; Arbizu, J.; Peñuelas, I.; Richter, J.A. PET optimization for improved assessment and accurate quantification of 90Y-microsphere biodistribution after radioembolization. Med. Phys. 2014, 41, 092503. [Google Scholar] [CrossRef]
  13. Ferrari, P.; Mariotti, F.; De Coste, V.; Capogni, M.; Pimpinella, M.; D’Arienzo, M. Phantom validation of quantitative Y-90 PET/CT-based dosimetry in liver radioembolization. EJNMMI Res. 2017, 7, 94. [Google Scholar]
  14. Walrand, S.; Hesse, M.; Jamar, F. Update on novel trends in PET/CT technology and its clinical applications. Br. J. Radiol. 2018, 91, 20160534. [Google Scholar] [CrossRef]
  15. Levillain, H.; Derijckere, I.D.; Marin, G.; Guiot, T.; Vouche, M.; Reynaert, N.; Hendlisz, A.; Vanderlinden, B.; Flamen, P. 90Y-PET/CT-based dosimetry after selective internal radiation therapy predicts outcome in patients with liver metastases from colorectal cancer. EJNMMI Res. 2018, 8, 1–9. [Google Scholar] [CrossRef] [PubMed]
  16. Alsultan, A.A.; van Roekel, C.; Barentsz, M.W.; Smits, M.L.J.; Kunnen, B.; Koopman, M.; Braat, A.J.; Bruijnen, R.C.; de Keizer, B.; Lam, M.G. Dose-response and dose-toxicity relationships for glass 90Y radioembolization in patients with liver metastases from colorectal cancer. J. Nucl. Med. 2021, 62, 1616–1623. [Google Scholar] [CrossRef] [PubMed]
  17. Willowson, K.; Forwood, N.; Jakoby, B.W.; Smith, A.M.; Bailey, D.L. Quantitative 90Y image reconstruction in PET. Med. Phys. 2012, 39, 7153–7159. [Google Scholar] [CrossRef] [PubMed]
  18. Willowson, K.P.; Tapner, M.; Bailey, D.L. A multicentre comparison of quantitative 90 Y PET/CT for dosimetric purposes after radioembolization with resin microspheres. Eur. J. Nucl. Med. Mol. Imaging 2015, 42, 1202–1222. [Google Scholar] [CrossRef]
  19. Carlier, T.; Eugène, T.; Bodet-Milin, C.; Garin, E.; Ansquer, C.; Rousseau, C.; Ferrer, L.; Barbet, J.; Schoenahl, F.; Kraeber-Bodéré, F. Assessment of acquisition protocols for routine imaging of Y-90 using PET/CT. EJNMMI Res. 2013, 3, 1–12. [Google Scholar] [CrossRef]
  20. Attarwala, A.A.; Molina-Duran, F.; Büsing, K.A.; Schönberg, S.O.; Bailey, D.L.; Willowson, K.; Glatting, G. Quantitative and qualitative assessment of yttrium-90 PET/CT imaging. PLoS ONE 2014, 9, e110401. [Google Scholar] [CrossRef]
  21. Siman, W.; Mikell, J.K.; Mawlawi, O.R.; Mourtada, F.; Kappadath, S.C. Dose volume histogram-based optimization of image reconstruction parameters for quantitative 90Y-PET imaging. Med. Phys. 2019, 46, 229–237. [Google Scholar] [CrossRef] [PubMed]
  22. Capogni, M.; Antohe, A. Construction and implementation of a TDCR system at ENEA. Appl. Radiat. Isot. 2014, 87, 260–264. [Google Scholar] [CrossRef] [PubMed]
  23. Mini, G.; Pepe, F.; Tintori, C.; Capogni, M. A full digital approach to the TDCR method. Appl. Radiat. Isot. 2014, 87, 166–170. [Google Scholar] [CrossRef]
  24. Broda, R. A review of the triple-to-double coincidence ratio (TDCR) method for standardizing radionuclides. Appl. Radiat. Isot. 2003, 58, 585–594. [Google Scholar] [CrossRef]
  25. Bolch, W.E.; Bouchet, L.G.; Robertson, J.S.; Wessels, B.W.; Siegel, J.A.; Howell, R.W.; Erdi, A.K.; Aydogan, B.; Costes, S.; Watson, E.E.; et al. MIRD pamphlet no. 17: The dosimetry of nonuniform activity distributions—Radionuclide S values at the voxel level. J. Nucl. Med. 1999, 40, 11S–36S. [Google Scholar]
  26. Srinivas, S.M.; Natarajan, N.; Kuroiwa, J.; Gallagher, S.; Nasr, E.; Shah, S.N.; DiFilippo, F.P.; A Obuchowski, N.; Bazerbashi, B.; Yu, N.; et al. Determination of radiation absorbed dose to primary liver tumors and normal liver tissue using post-radioembolization 90Y PET. Front. Oncol. 2014, 4, 255. [Google Scholar] [CrossRef] [PubMed]
  27. Lhommel, R.; van Elmbt, L.; Goffette, P.; Eynde, M.V.D.; Jamar, F.; Pauwels, S.; Walrand, S. Feasibility of 90 Y TOF PET-based dosimetry in liver metastasis therapy using SIR-Spheres. Eur. J. Nucl. Med. Mol. Imaging 2010, 37, 1654–1662. [Google Scholar] [CrossRef]
  28. Kao, Y.-H.; Steinberg, J.D.; Tay, Y.-S.; Lim, G.K.; Yan, J.; Townsend, D.W.; A Budgeon, C.; A Boucek, J.; Francis, R.J.; Cheo, T.S.; et al. Post-radioembolization yttrium-90 PET/CT-part 2: Dose-response and tumor predictive dosimetry for resin microspheres. EJNMMI Res. 2013, 3, 1–12. [Google Scholar] [CrossRef]
  29. Kunnen, B.; Beijst, C.; Lam, M.G.E.H.; Viergever, M.A.; De Jong, H.W.A.M. Comparison of the biograph vision and biograph mCT for quantitative 90Y PET/CT imaging for radioembolisation. EJNMMI Phys. 2020, 7, 14. [Google Scholar] [CrossRef]
Figure 1. RC (A) and CoV (B) values for cylindrical phantom (black) and IEC NEMA Body phantom as functions of pixel dimension (inverse of matrix size).
Applsci 12 08418 g001
Figure 2. RC (A) and CoV (B) values for cylindrical phantom (black) and IEC NEMA Body phantom as functions of EI.
Applsci 12 08418 g002
Figure 3. Experimental 90Y−PET/CT and mathematical uniform IEC NEMA Torso phantoms.
Applsci 12 08418 g003
Figure 4. Experimental 90Y−PET/CT and mathematical uniform IEC NEMA Phantom.
Applsci 12 08418 g004
Figure 5. Integral Dose–Volume Histograms (iDVHs) for whole liver compartment (A) and for the 37 mm sphere (B), obtained with different Gaussian filters. Mean absorbed doses and respective standard deviations are also reported.
Applsci 12 08418 g005
Figure 6. Normalized RMSE for the liver (black) and for the IEC NEMA spheres as a function of the Gaussian filter.
Applsci 12 08418 g006
Figure 7. dDVHs for liver compartment (A) and 37 mm sphere (B) for different Gaussian filters.
Applsci 12 08418 g007
Publisher’s Note: MDPI stays neutral with regard to jurisdictional claims in published maps and institutional affiliations.

