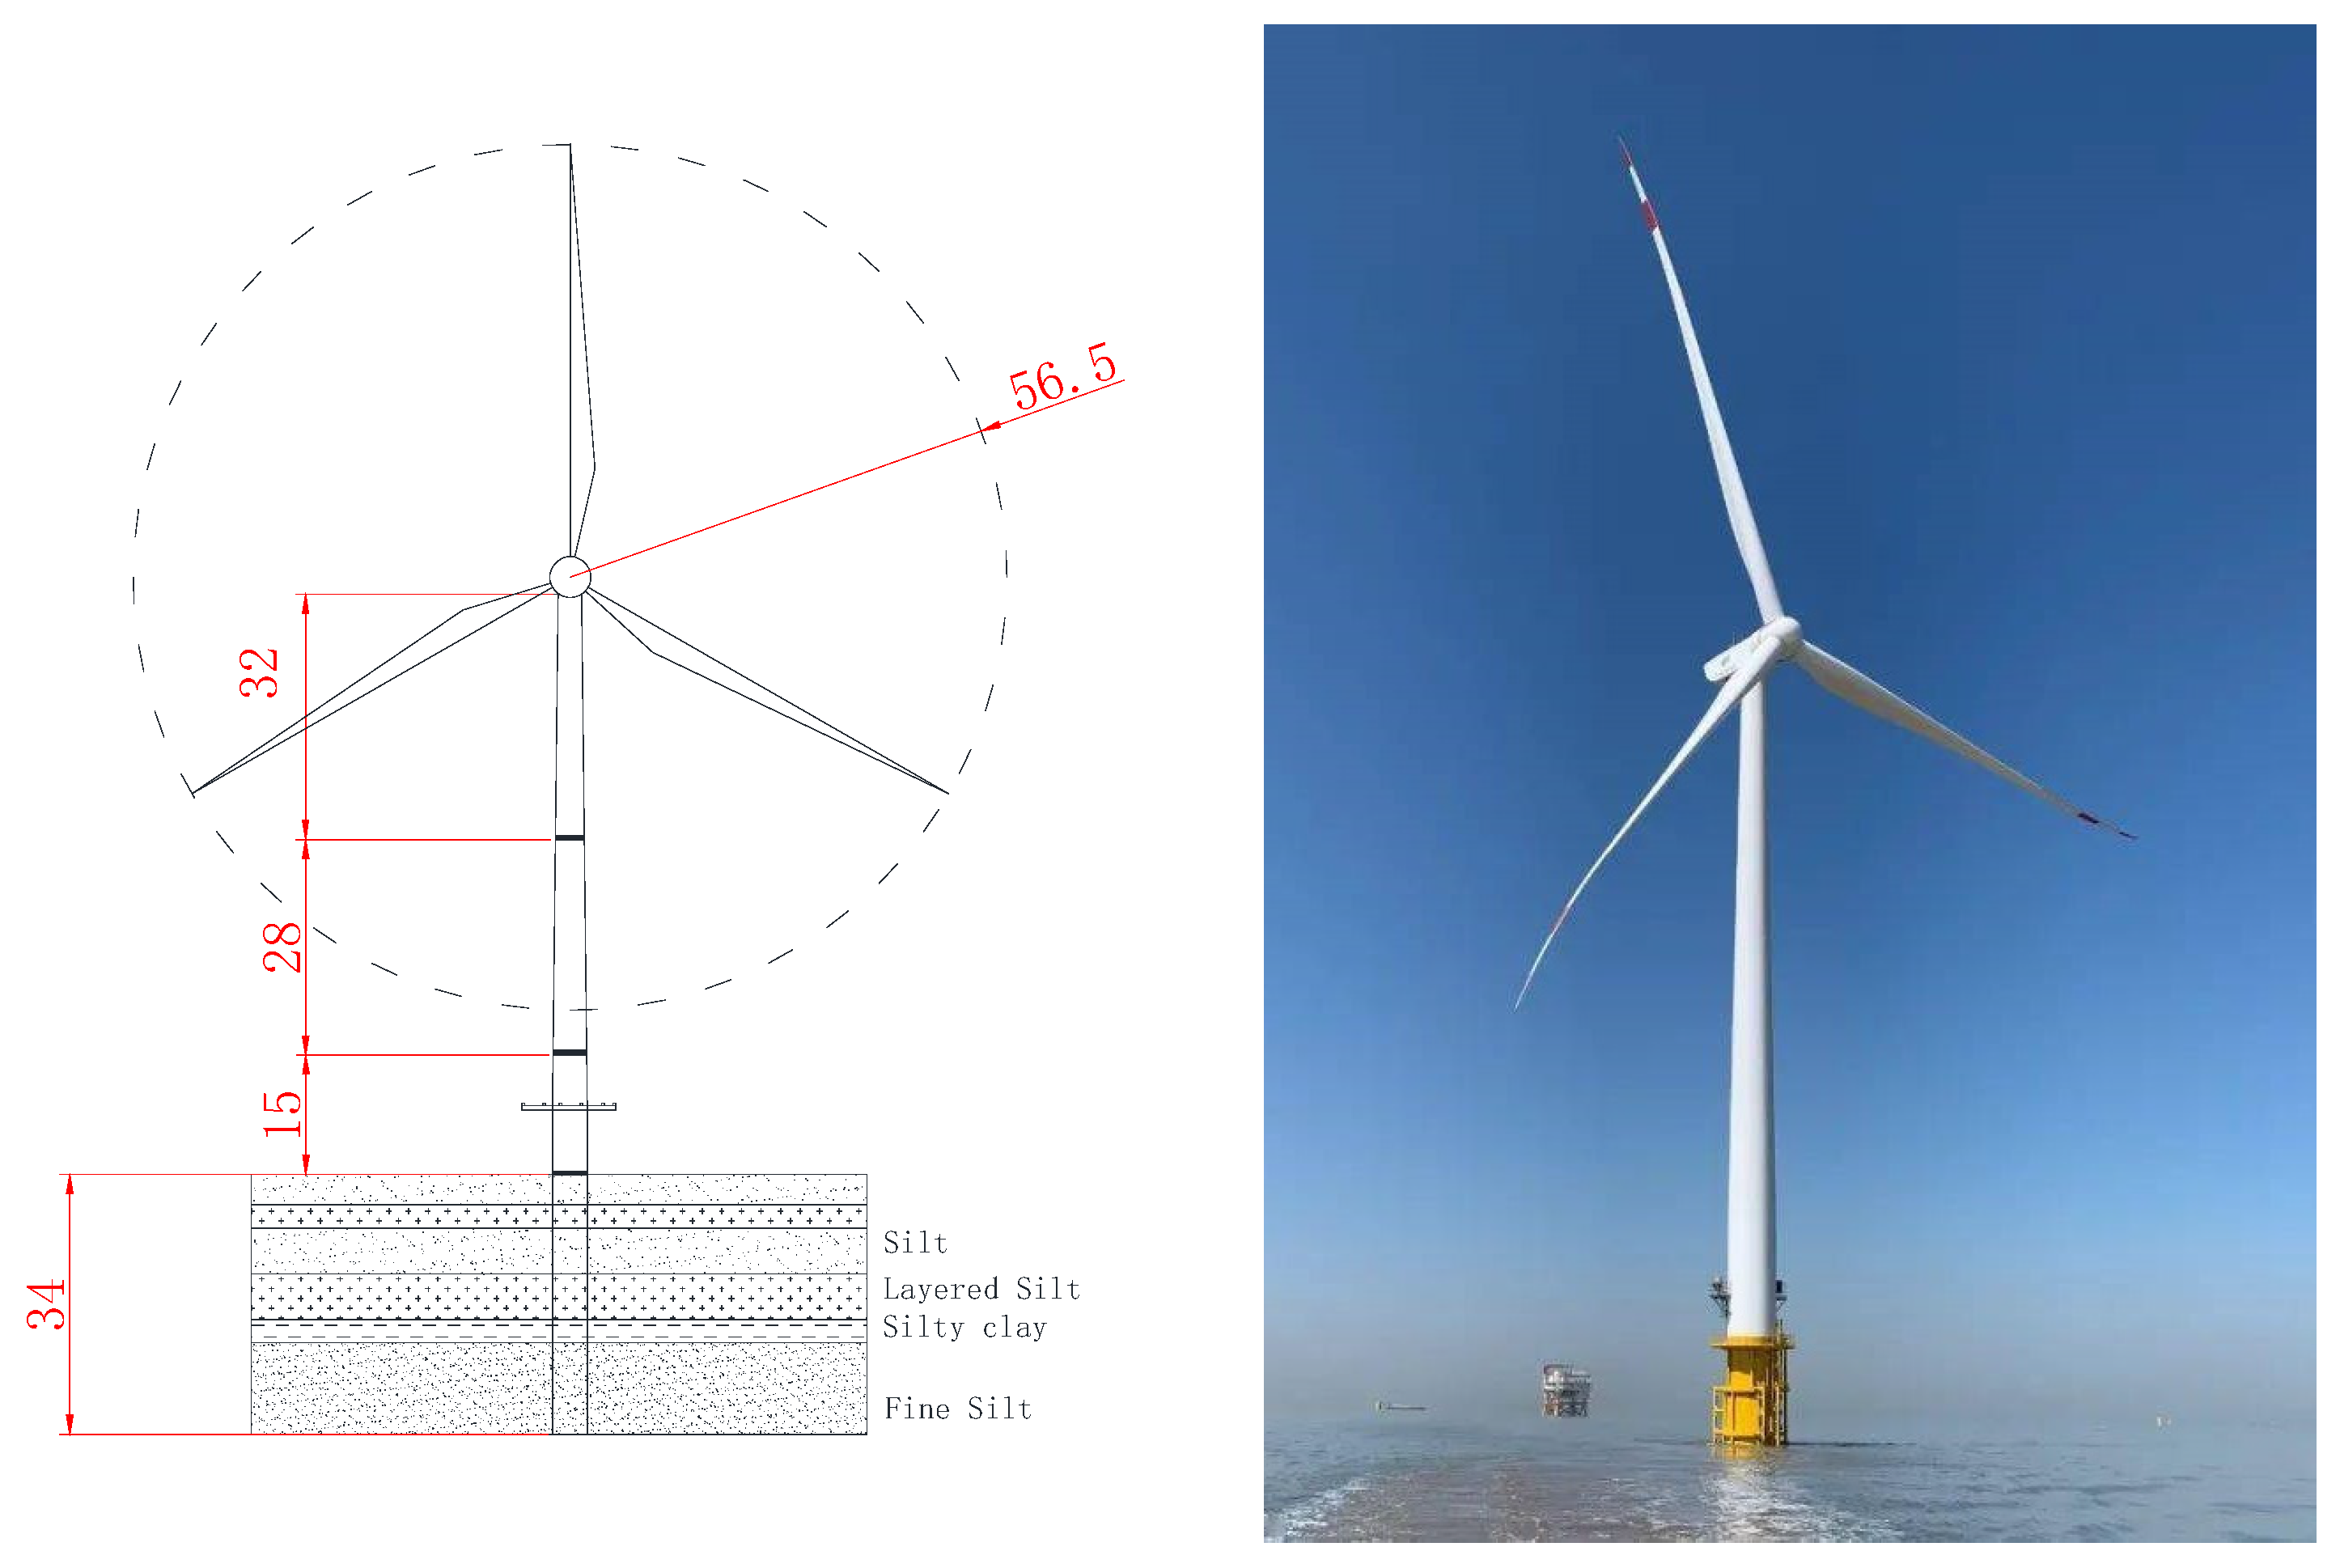
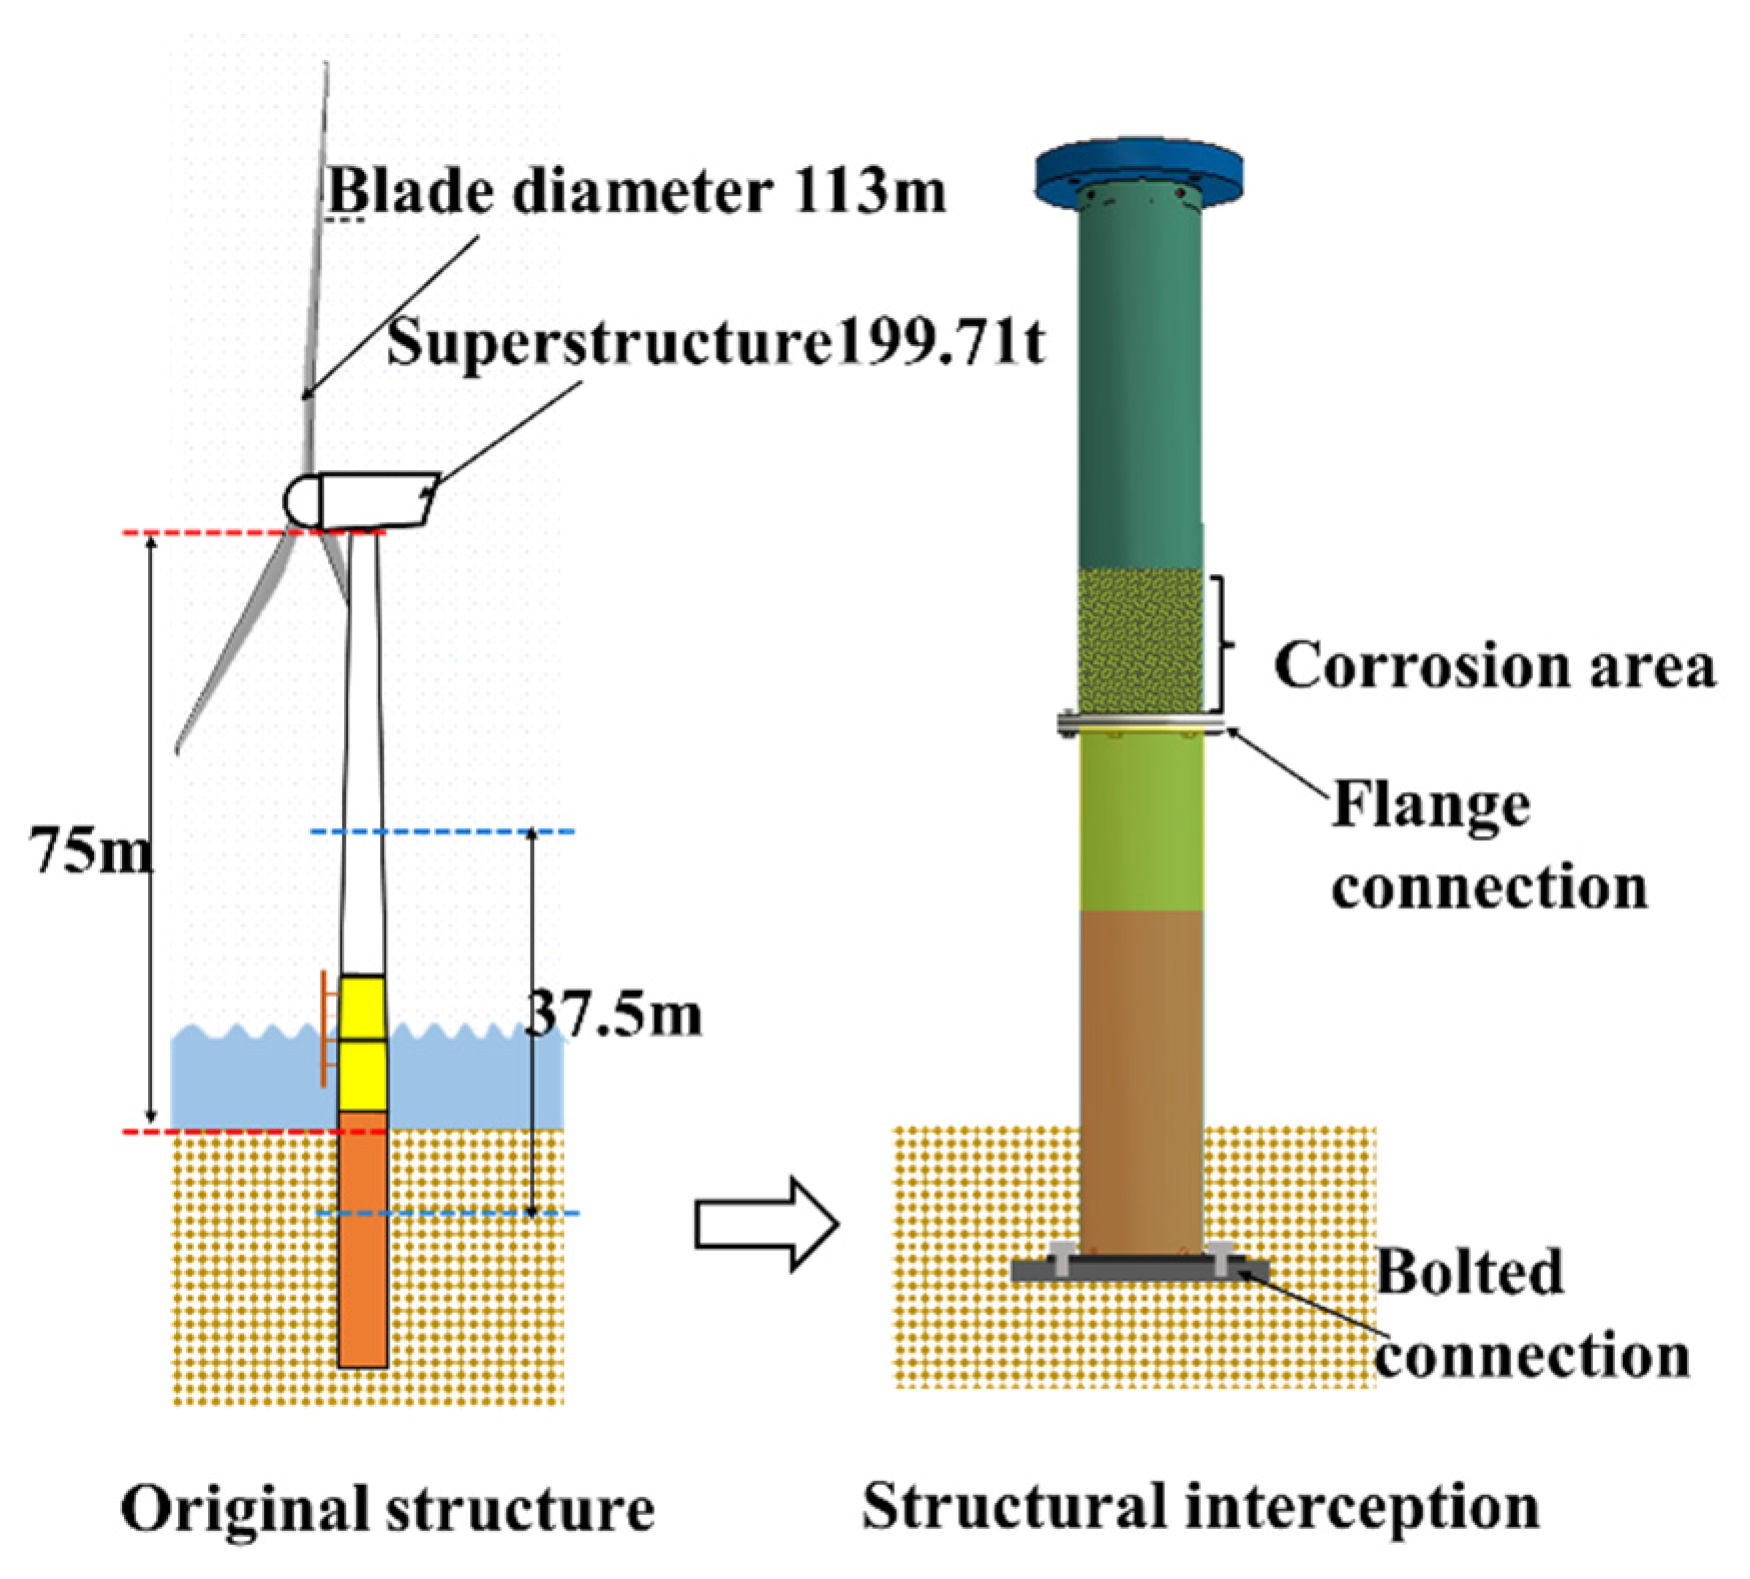
Figure 1.
Structural dimensions and geological conditions of wind turbine tower.
Figure 1.
Structural dimensions and geological conditions of wind turbine tower.
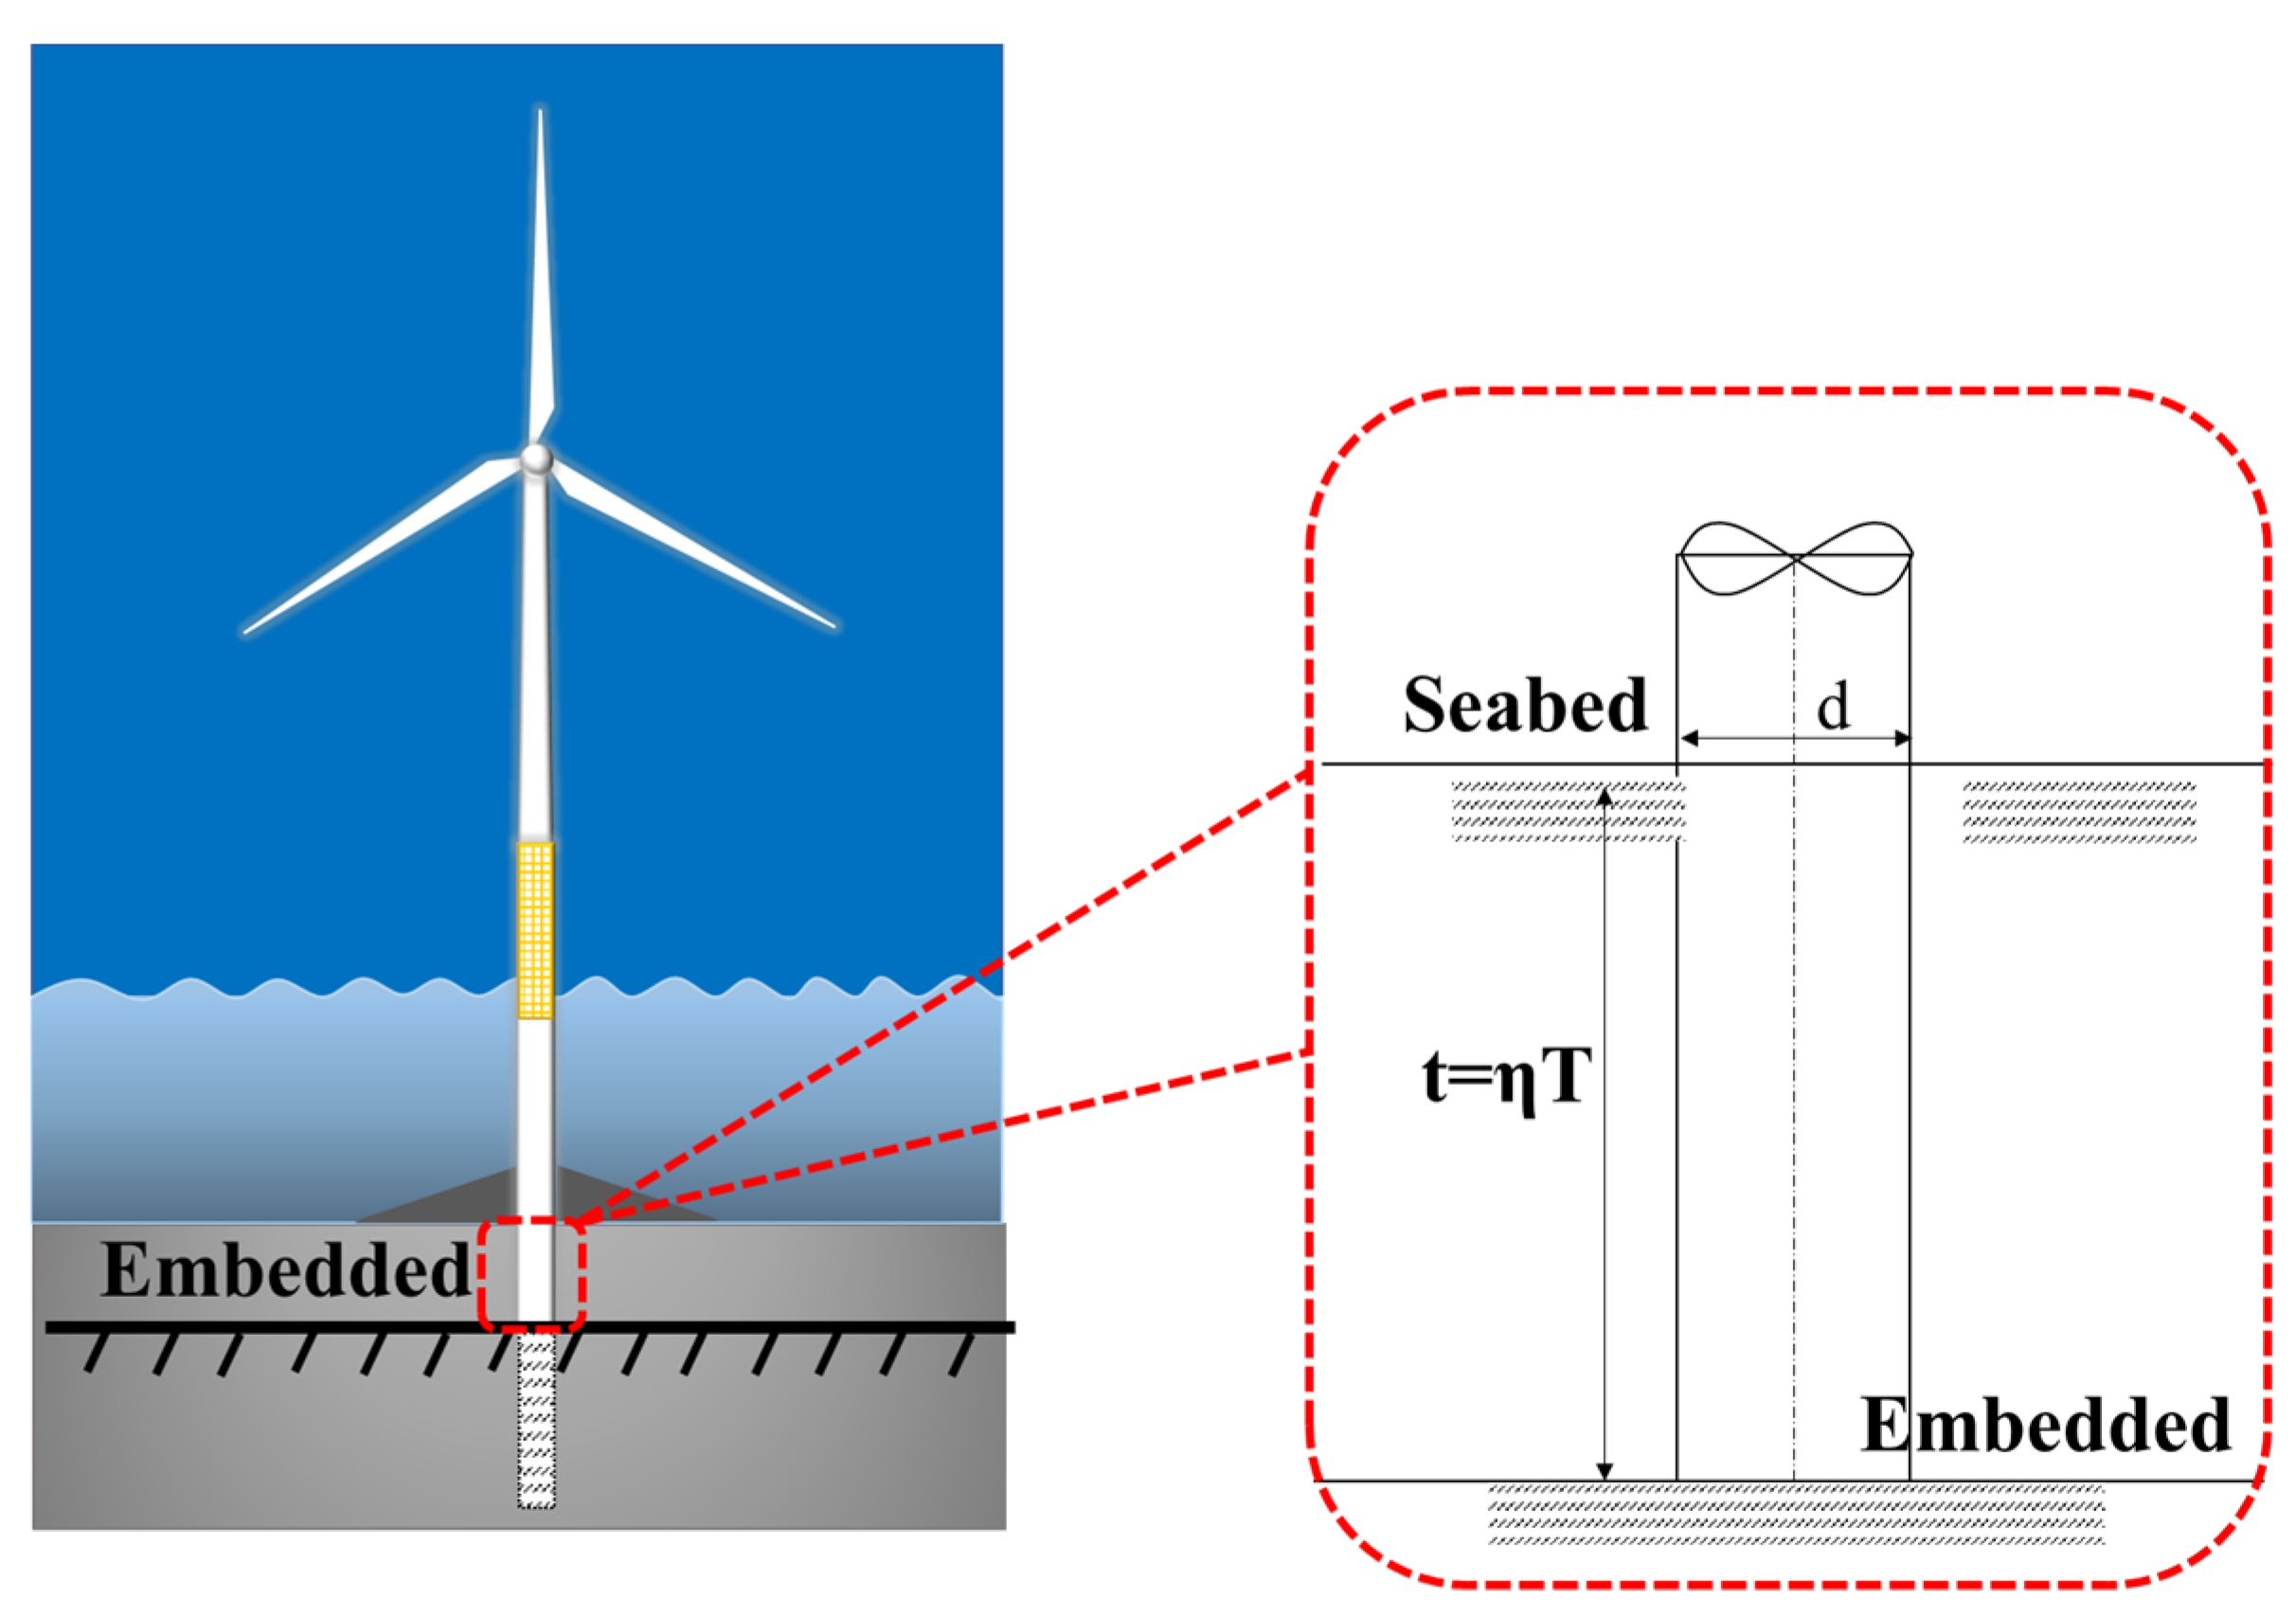
Figure 2.
Hypothetical embedded point method.
Figure 2.
Hypothetical embedded point method.
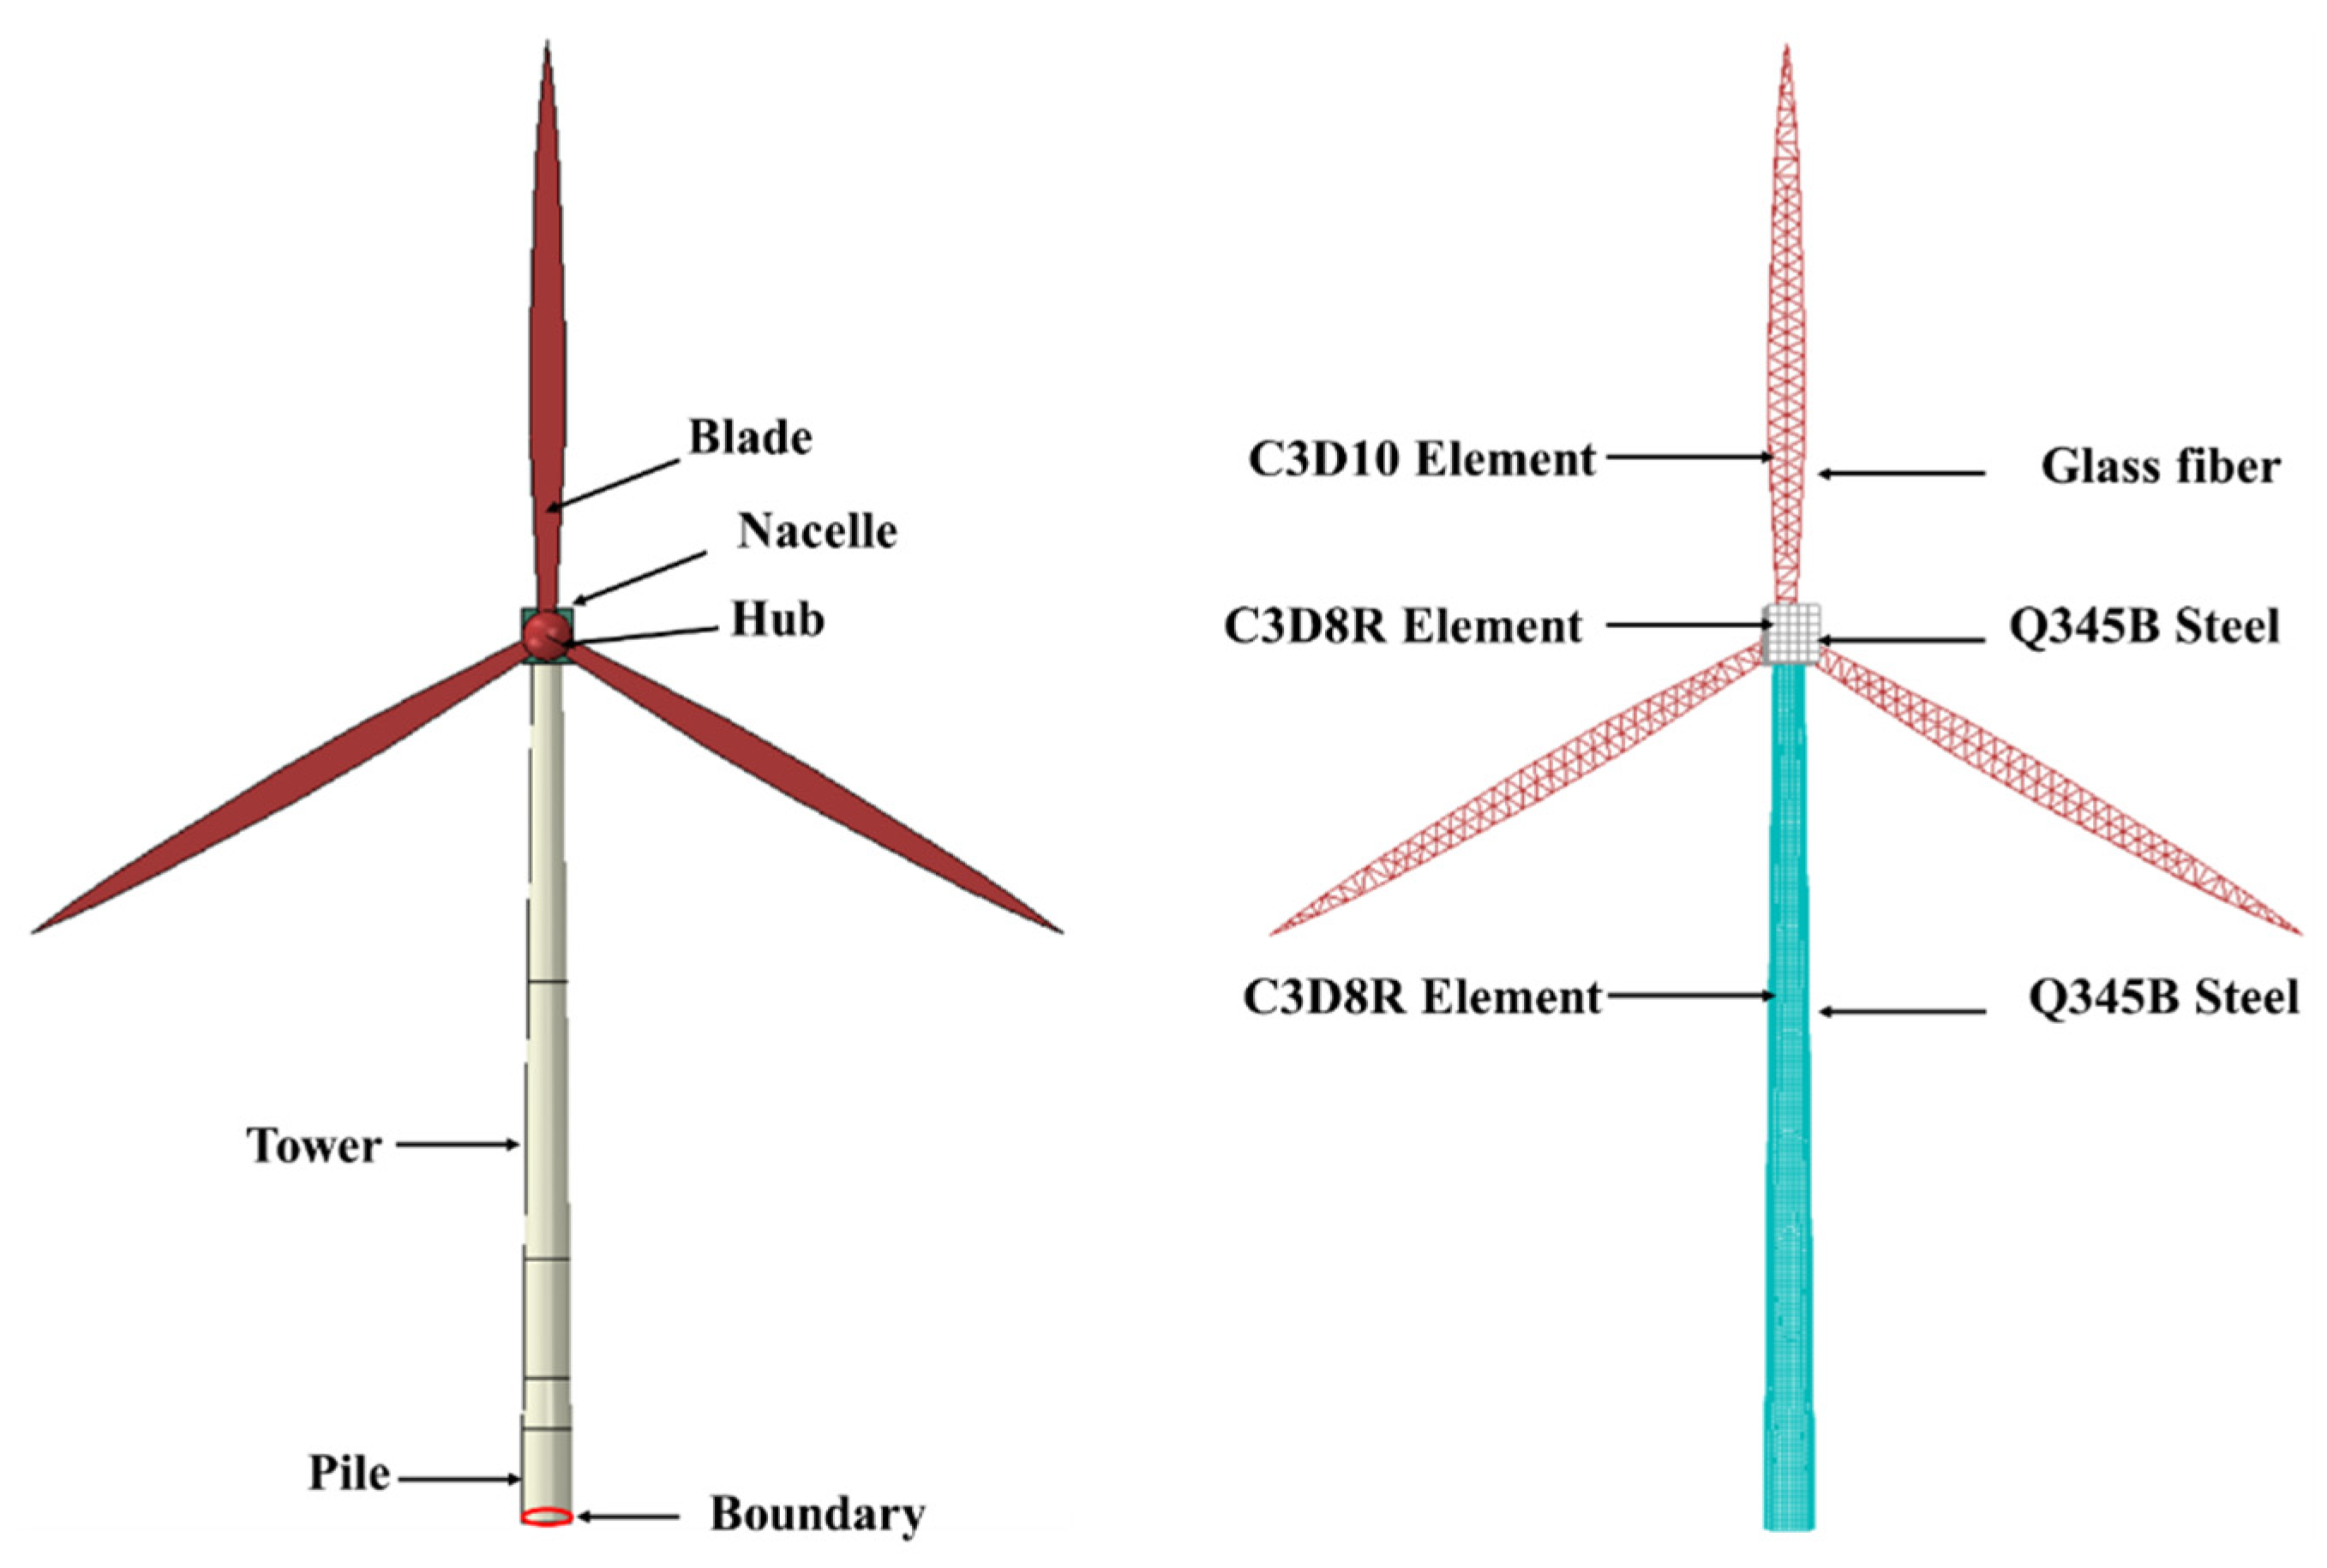
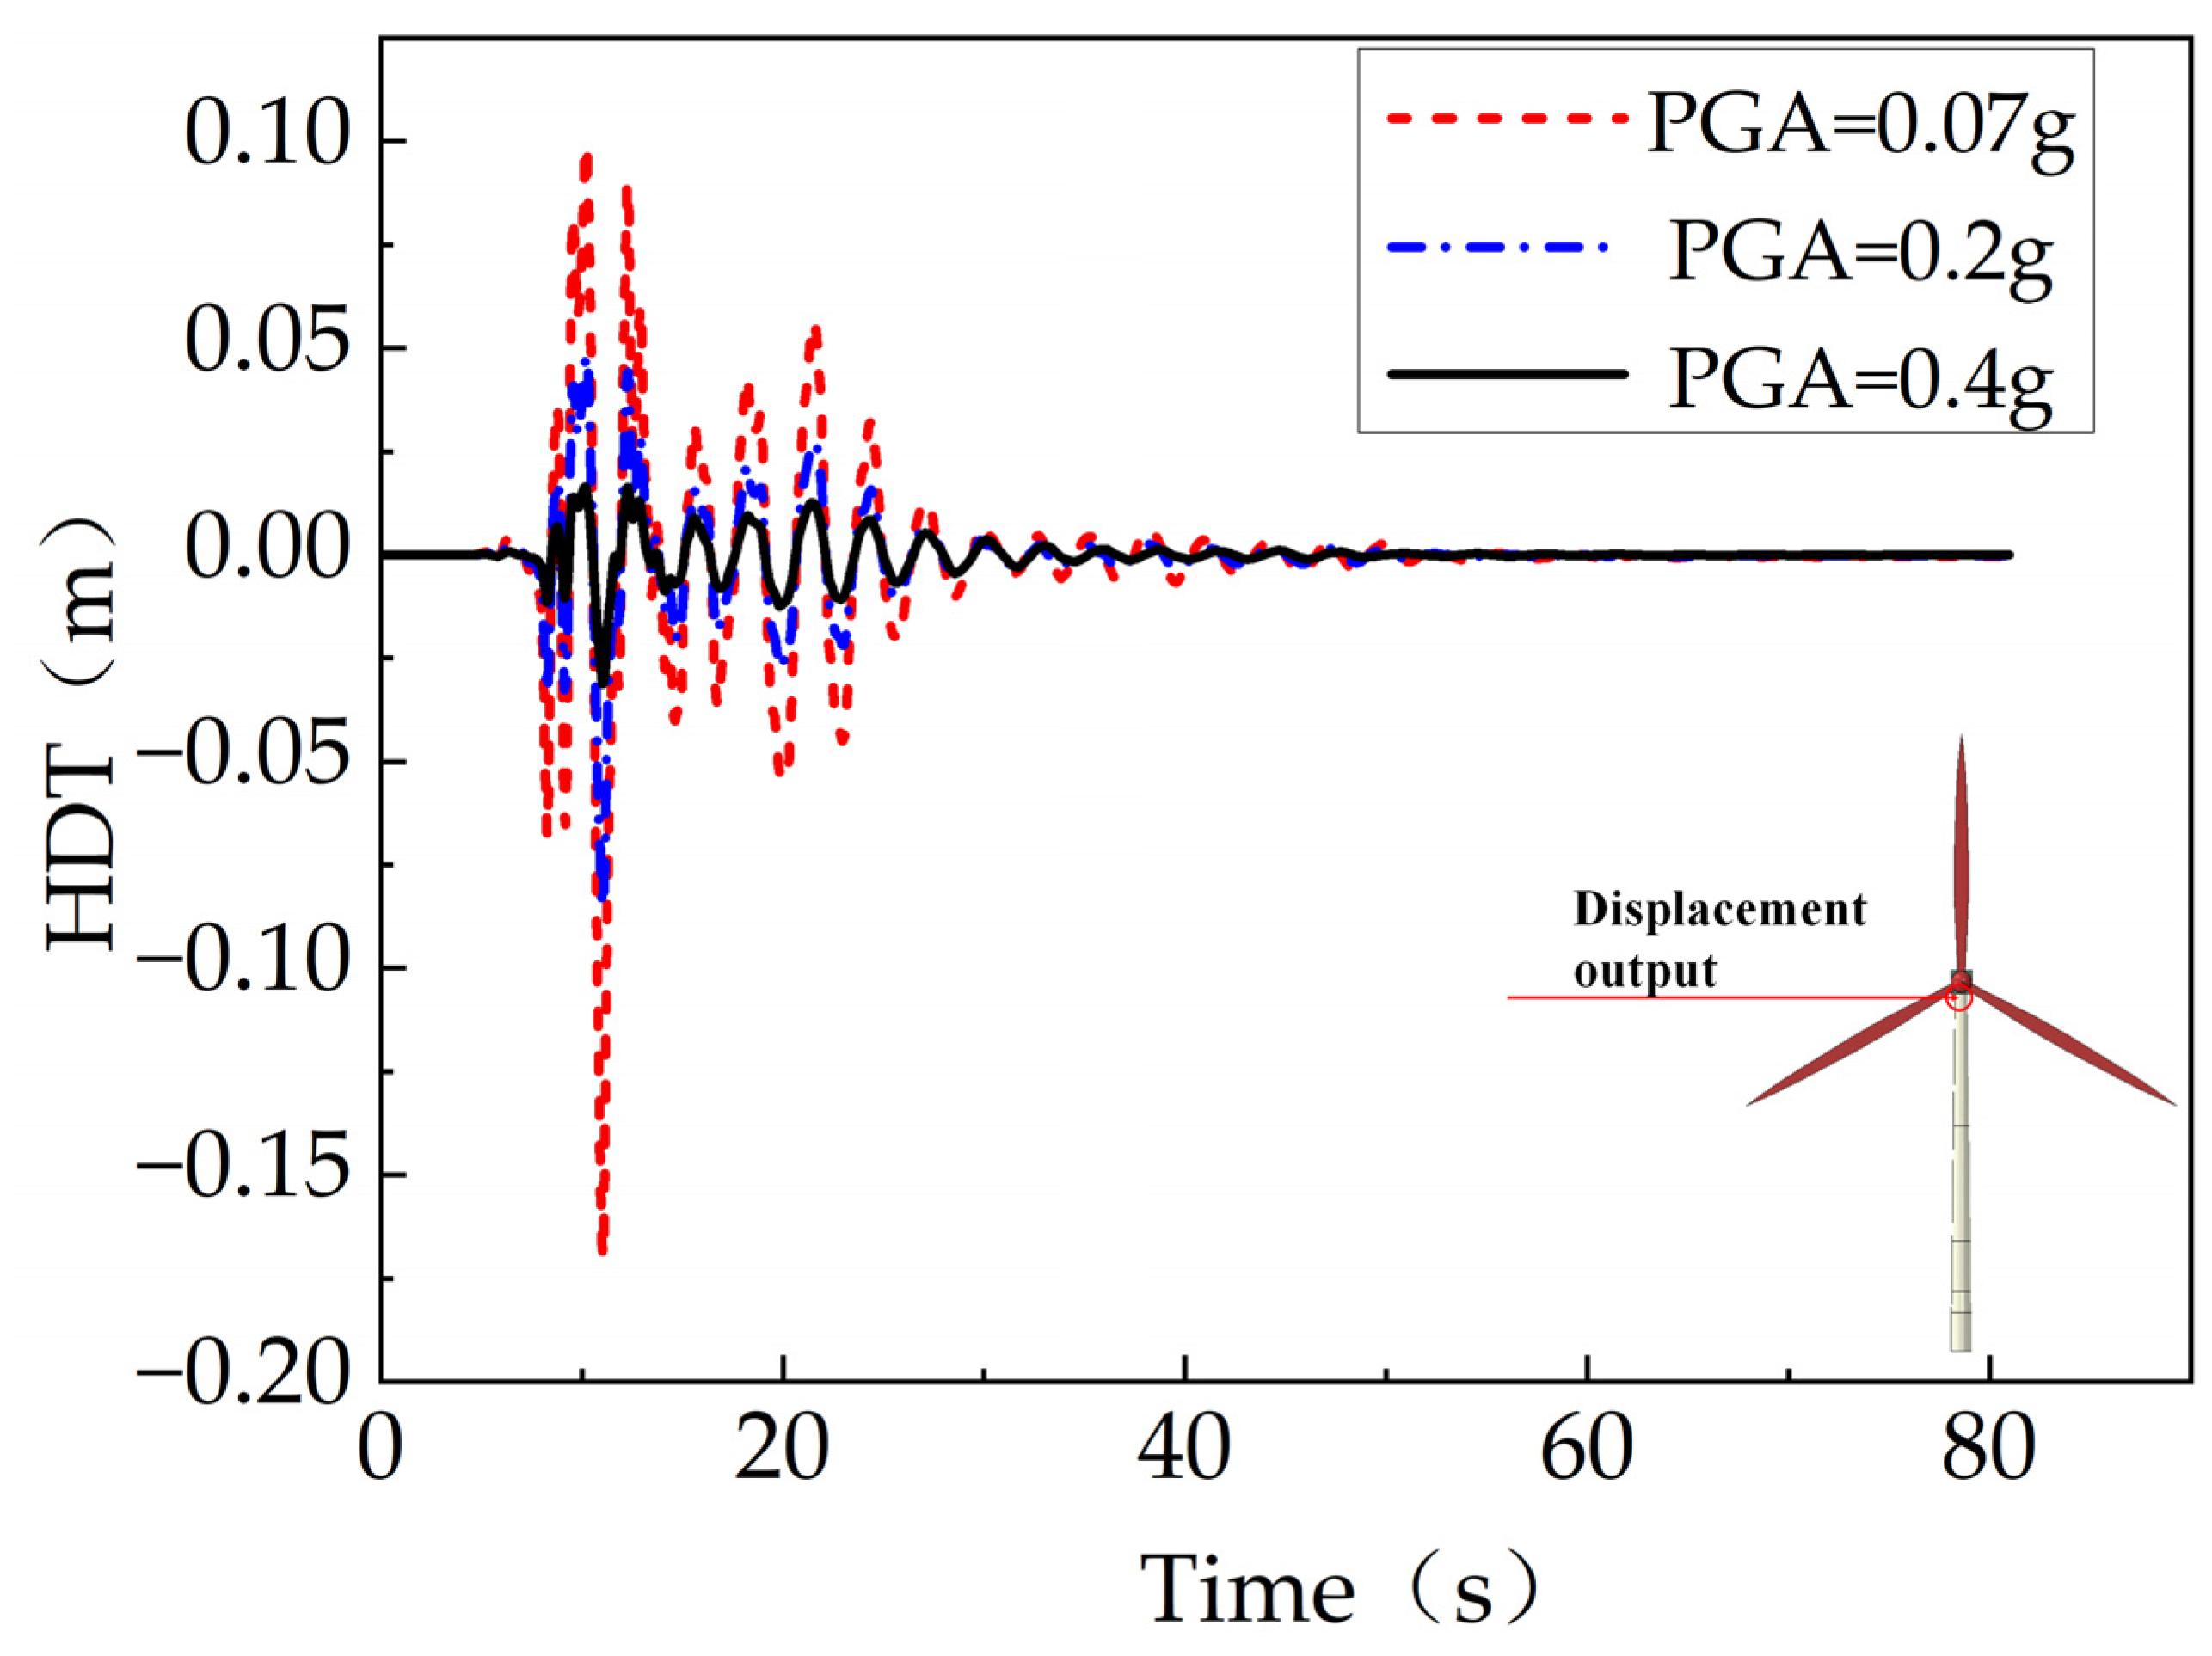
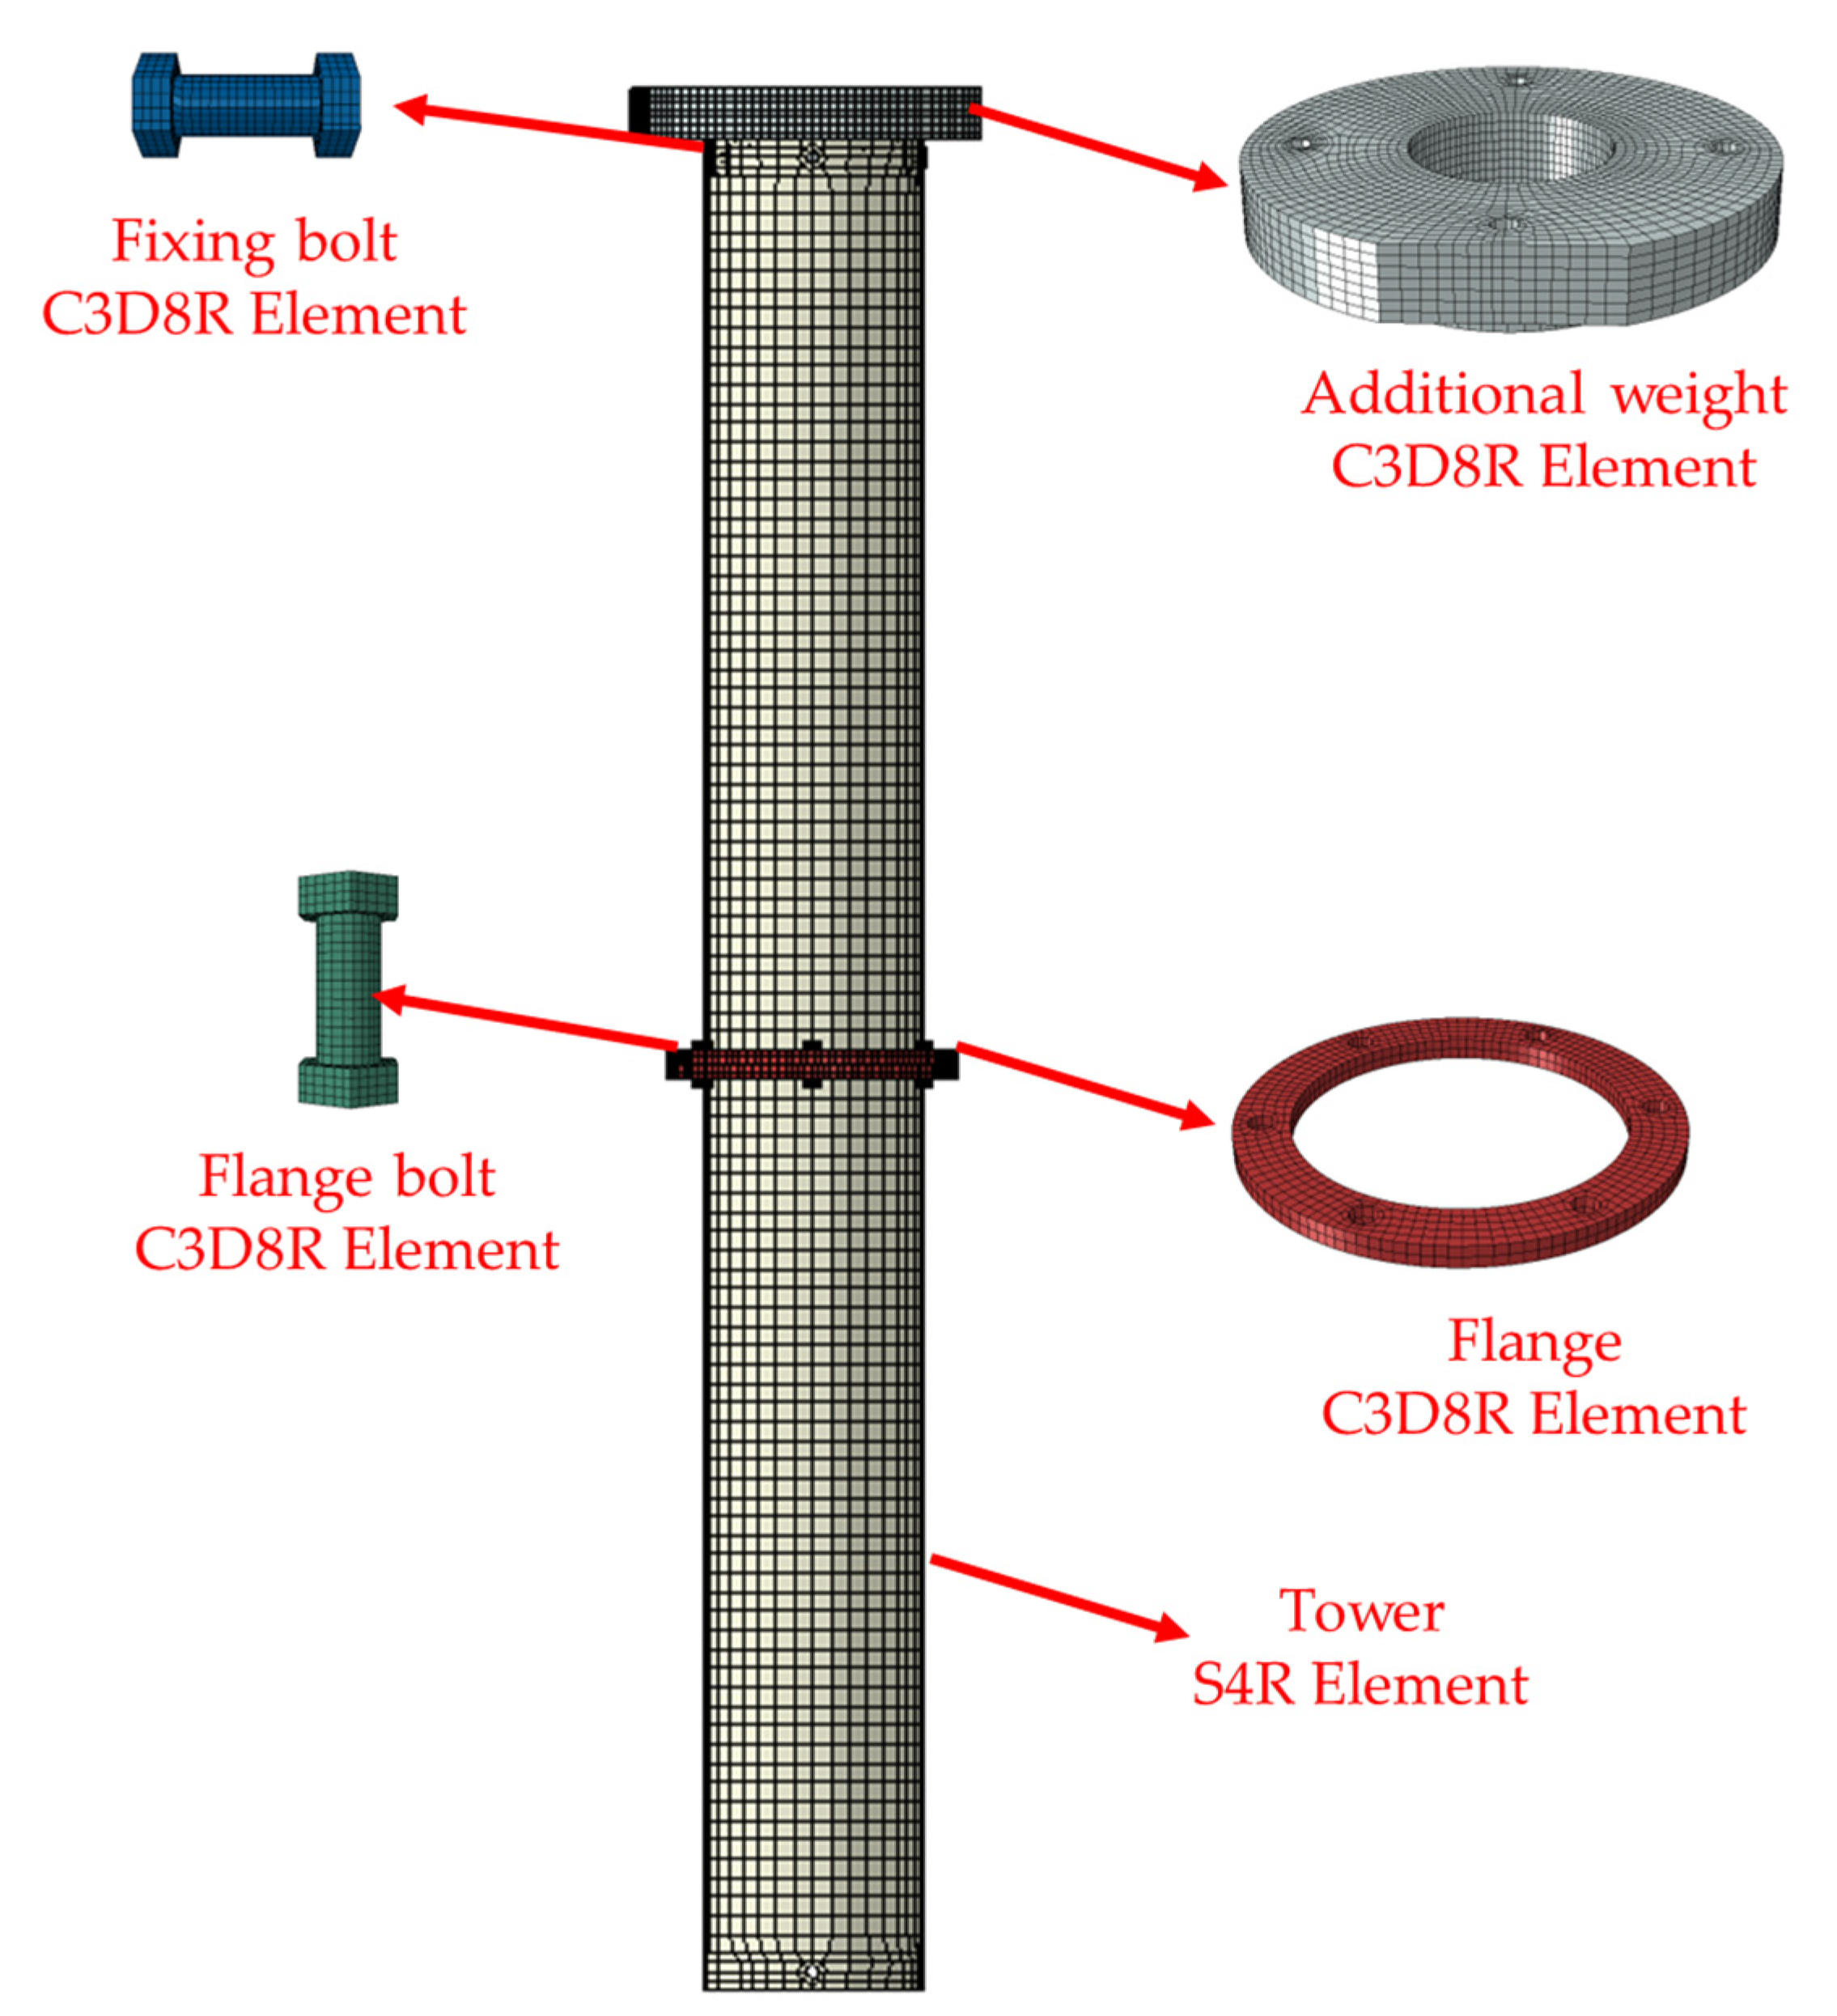
Figure 3.
FE model of wind turbine tower structure.
Figure 3.
FE model of wind turbine tower structure.
Figure 4.
Python program execution process.
Figure 4.
Python program execution process.
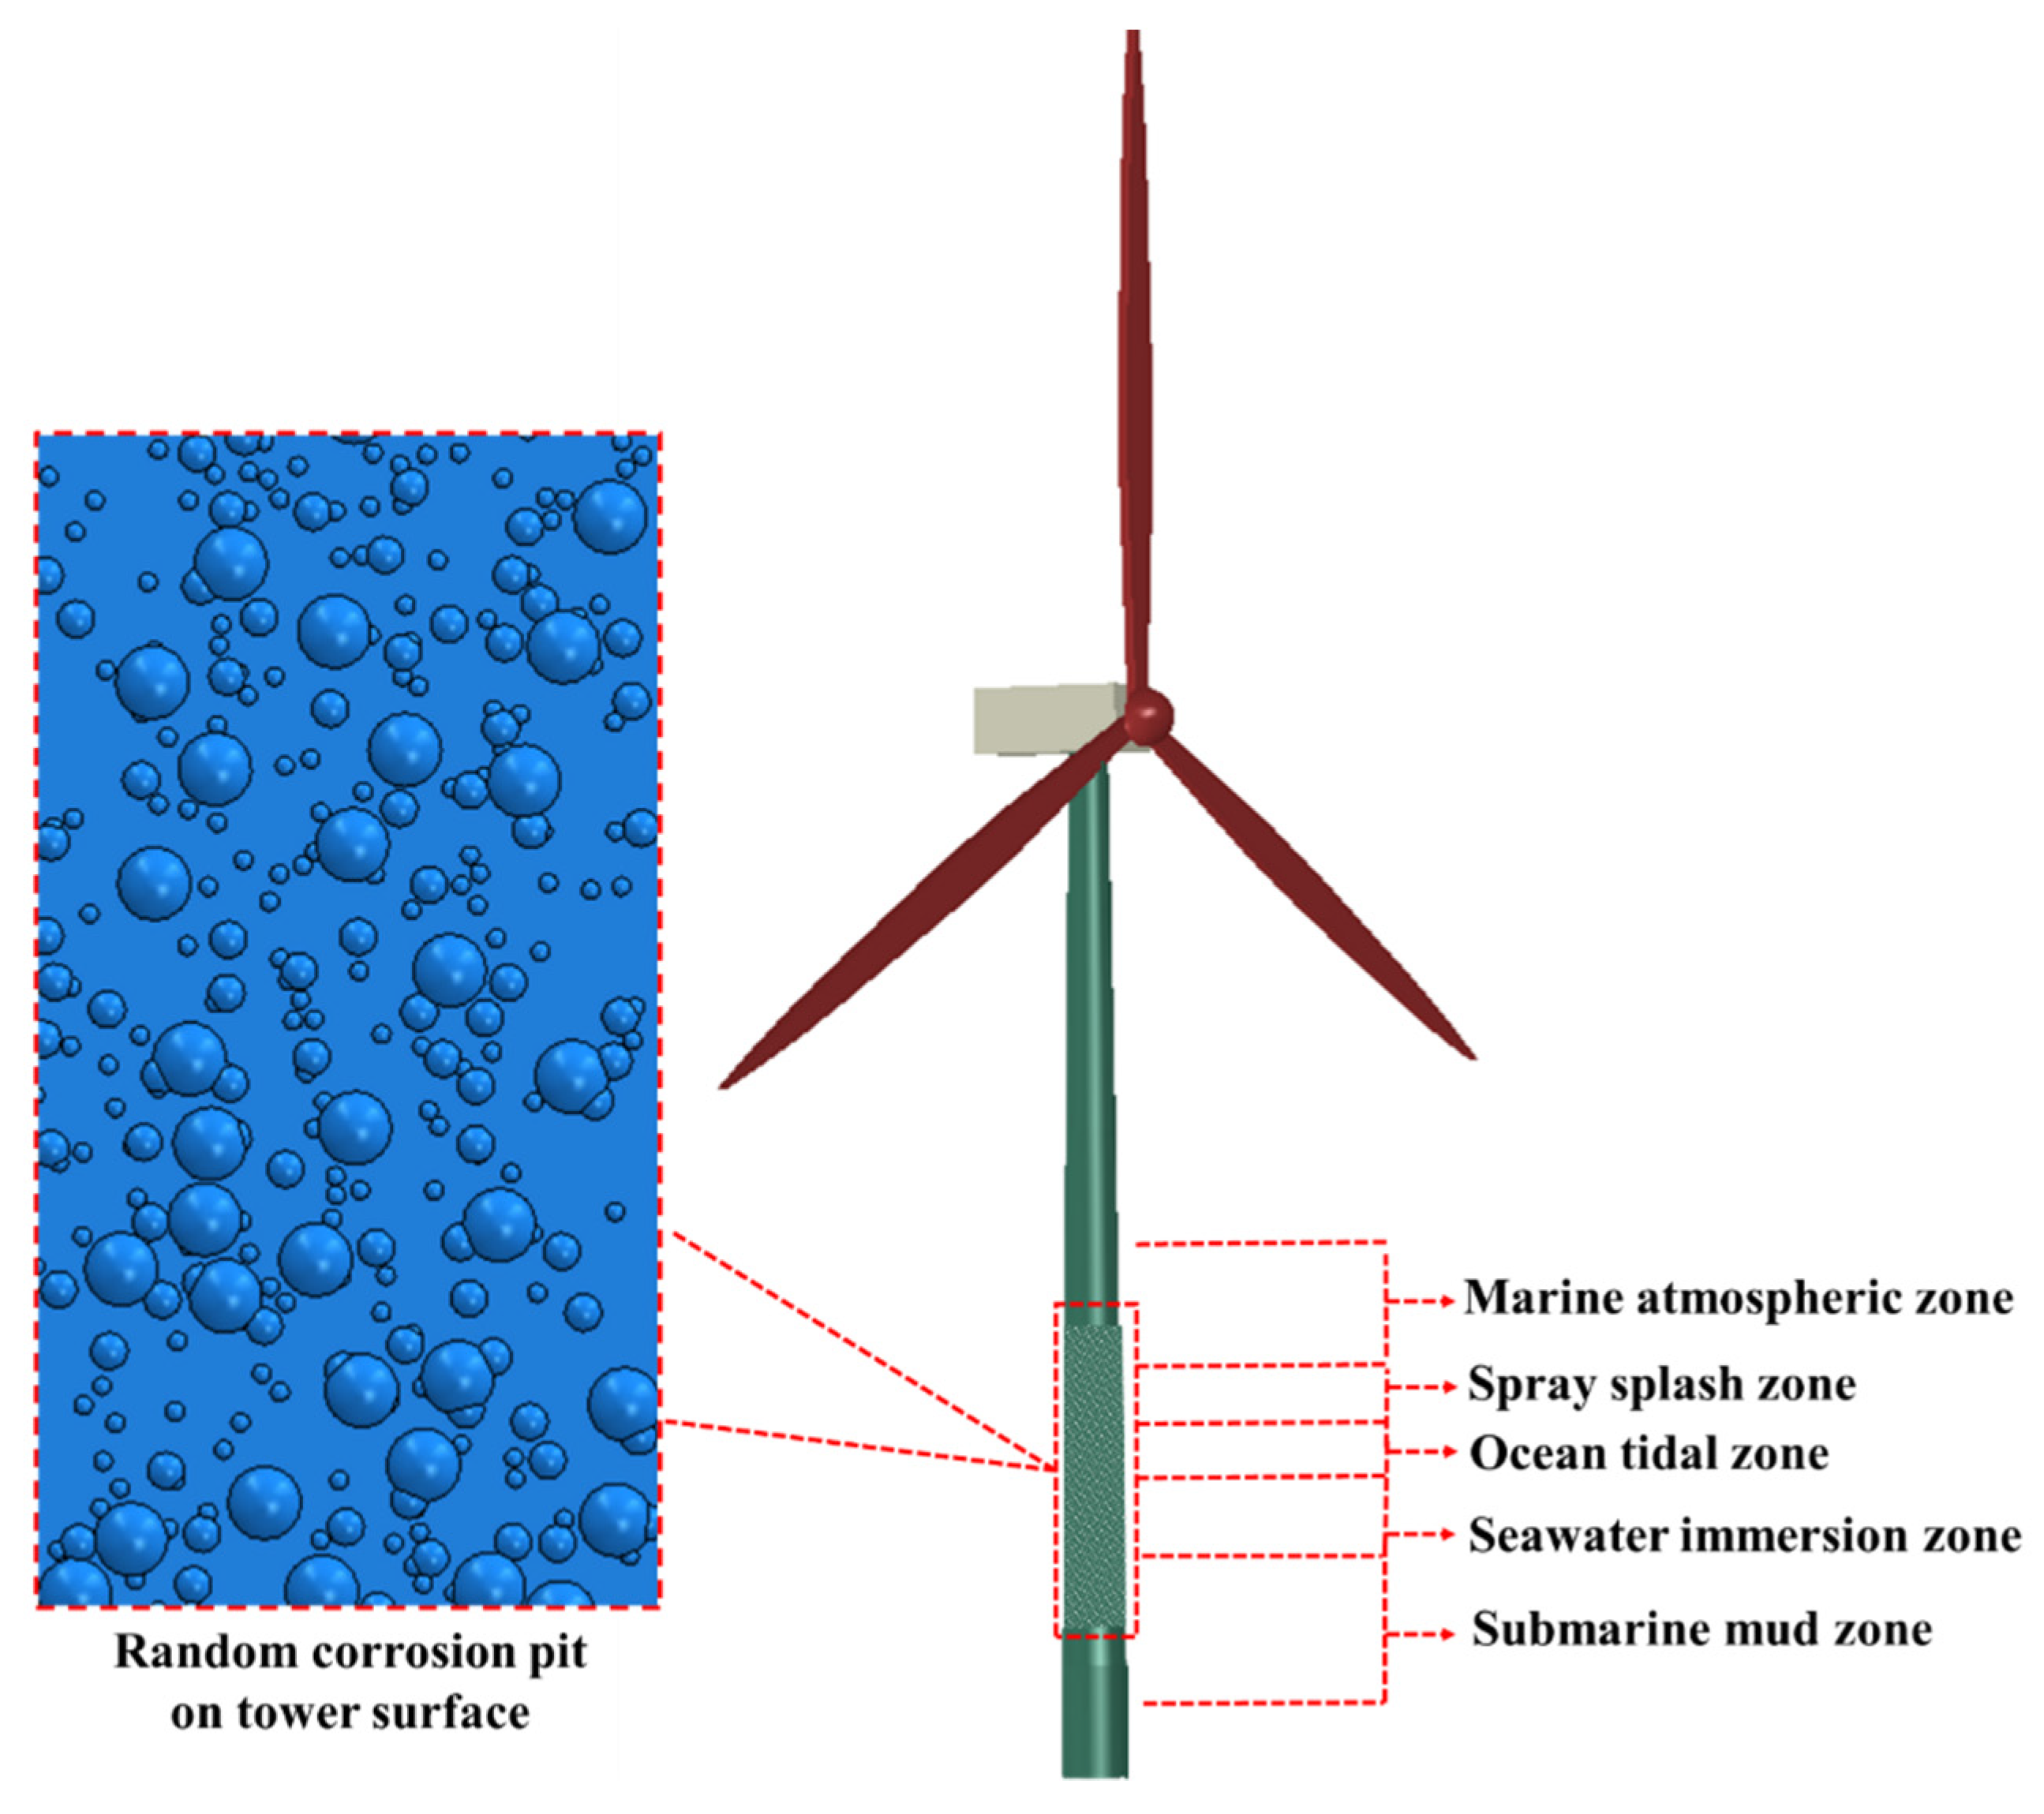
Figure 5.
FE model with random corrosion.
Figure 5.
FE model with random corrosion.
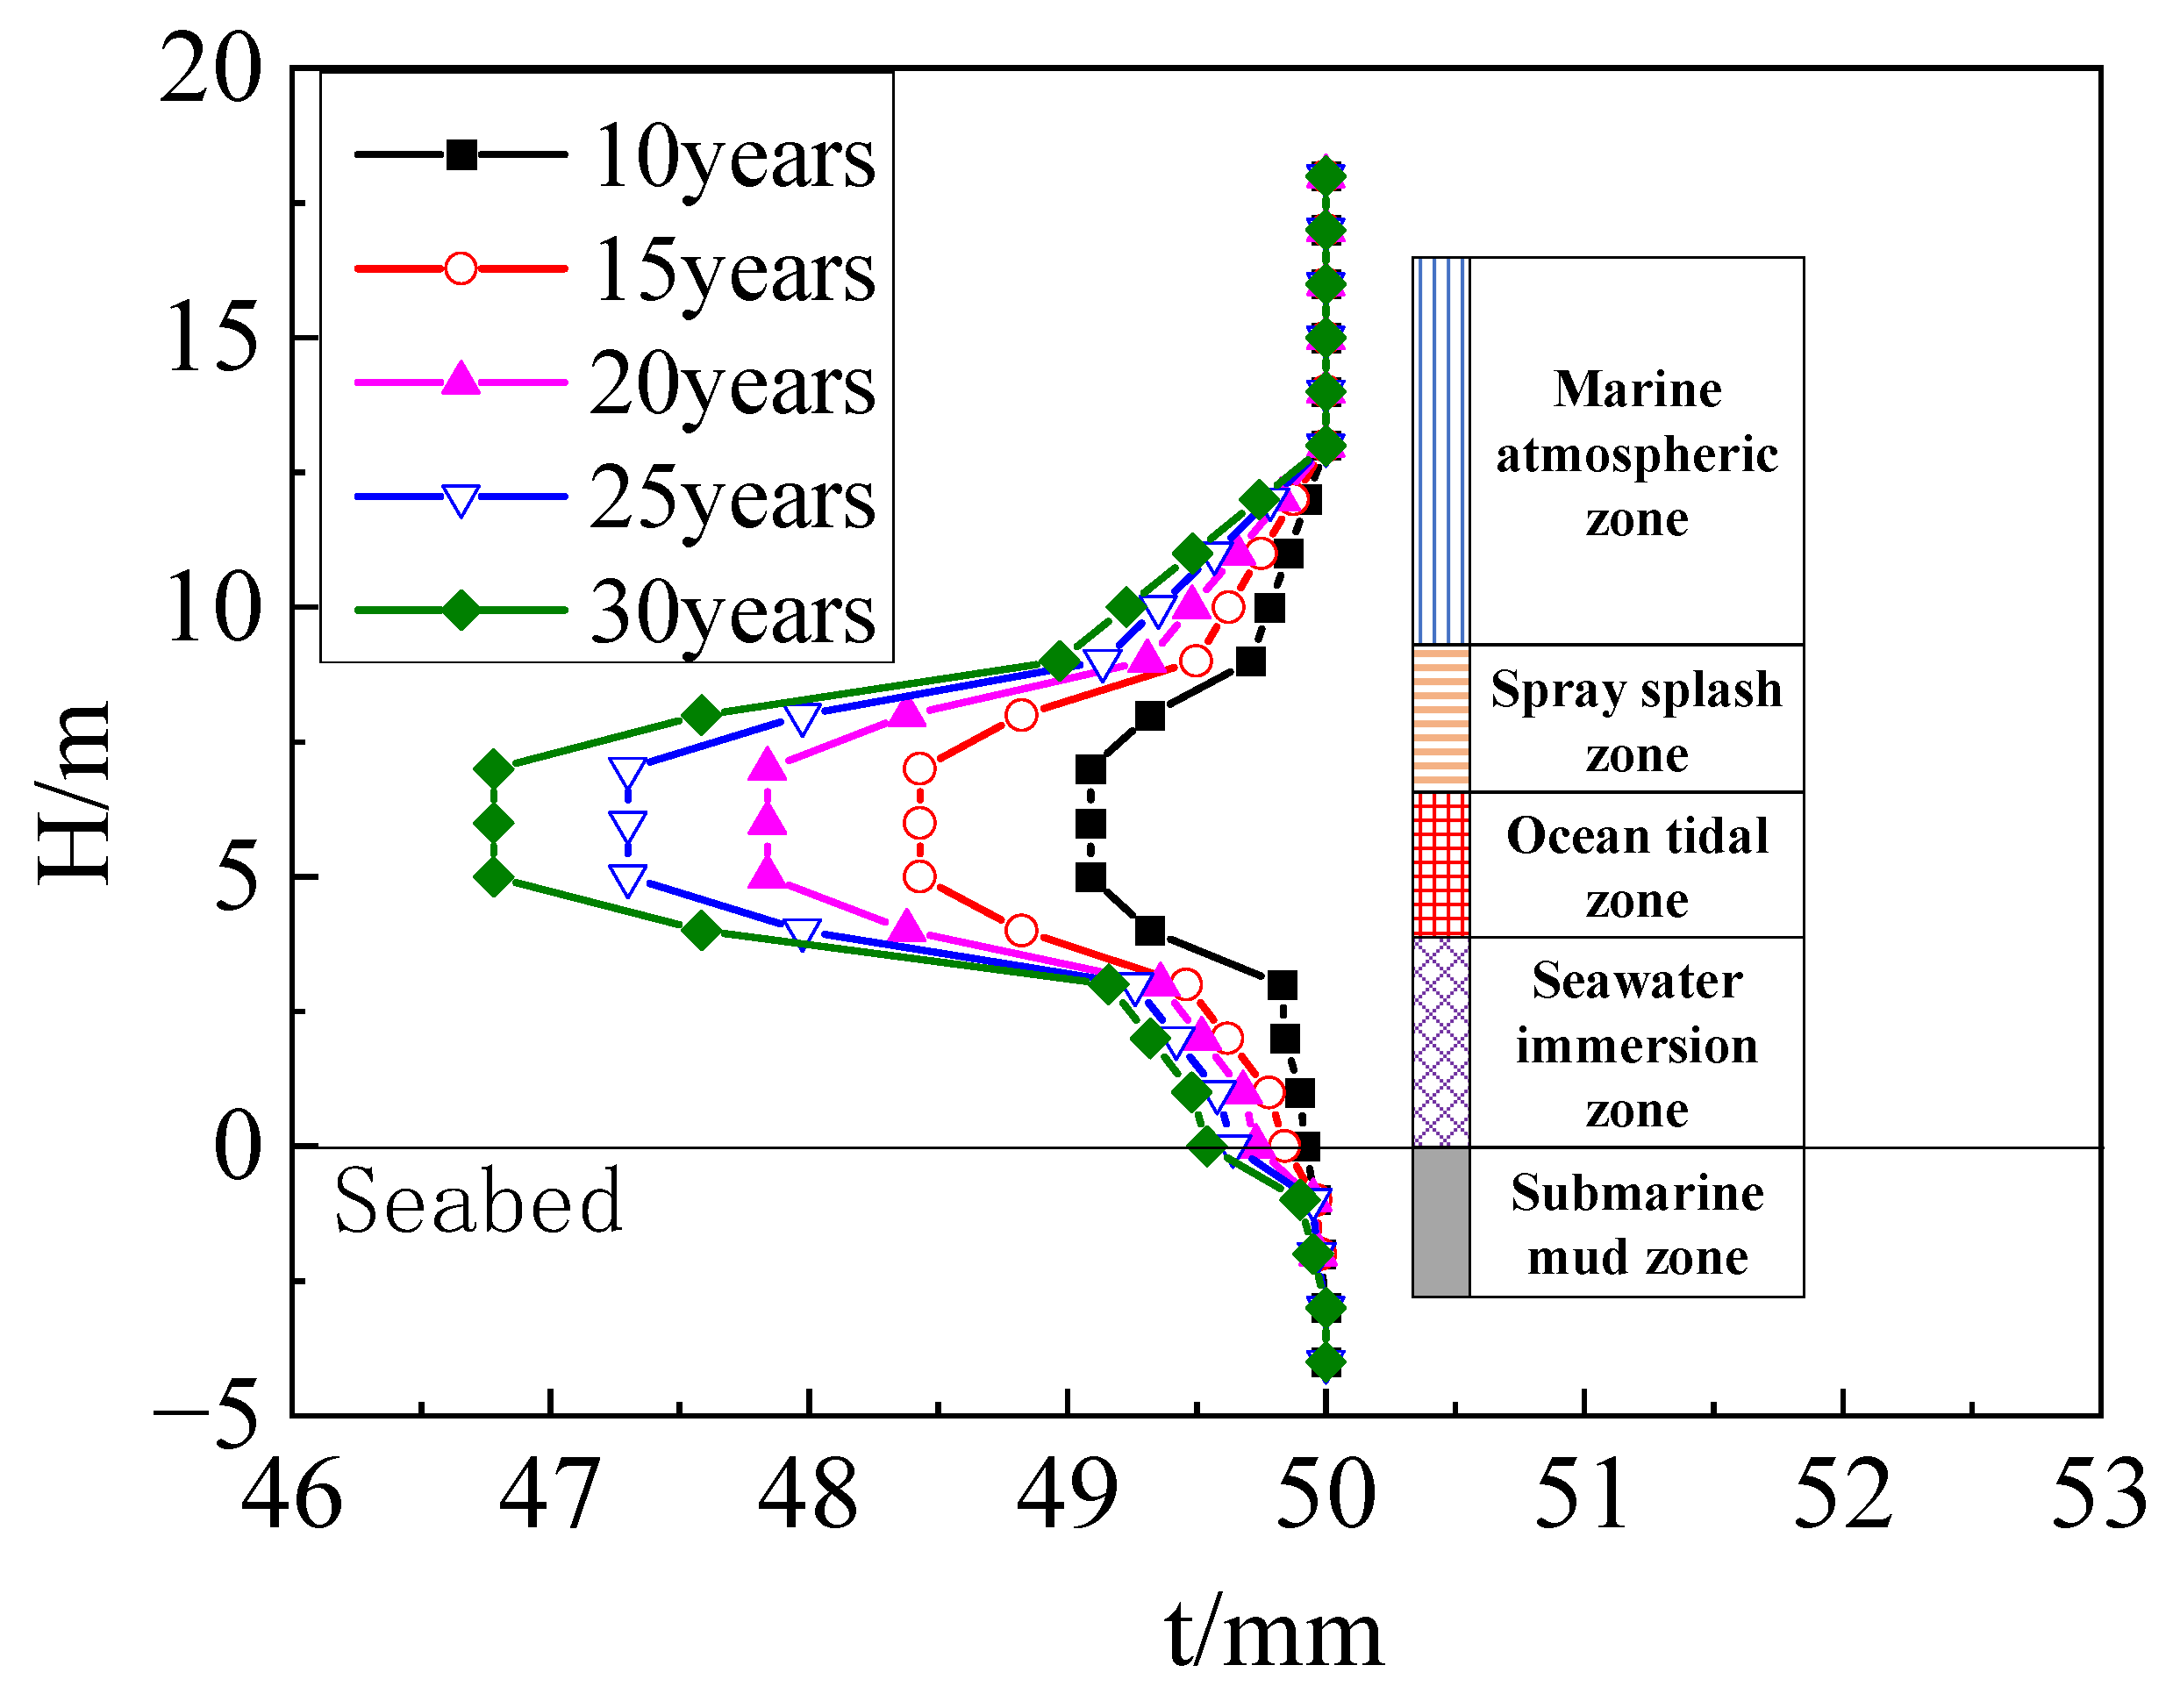
Figure 6.
The wall thickness of the tower varies with time.
Figure 6.
The wall thickness of the tower varies with time.
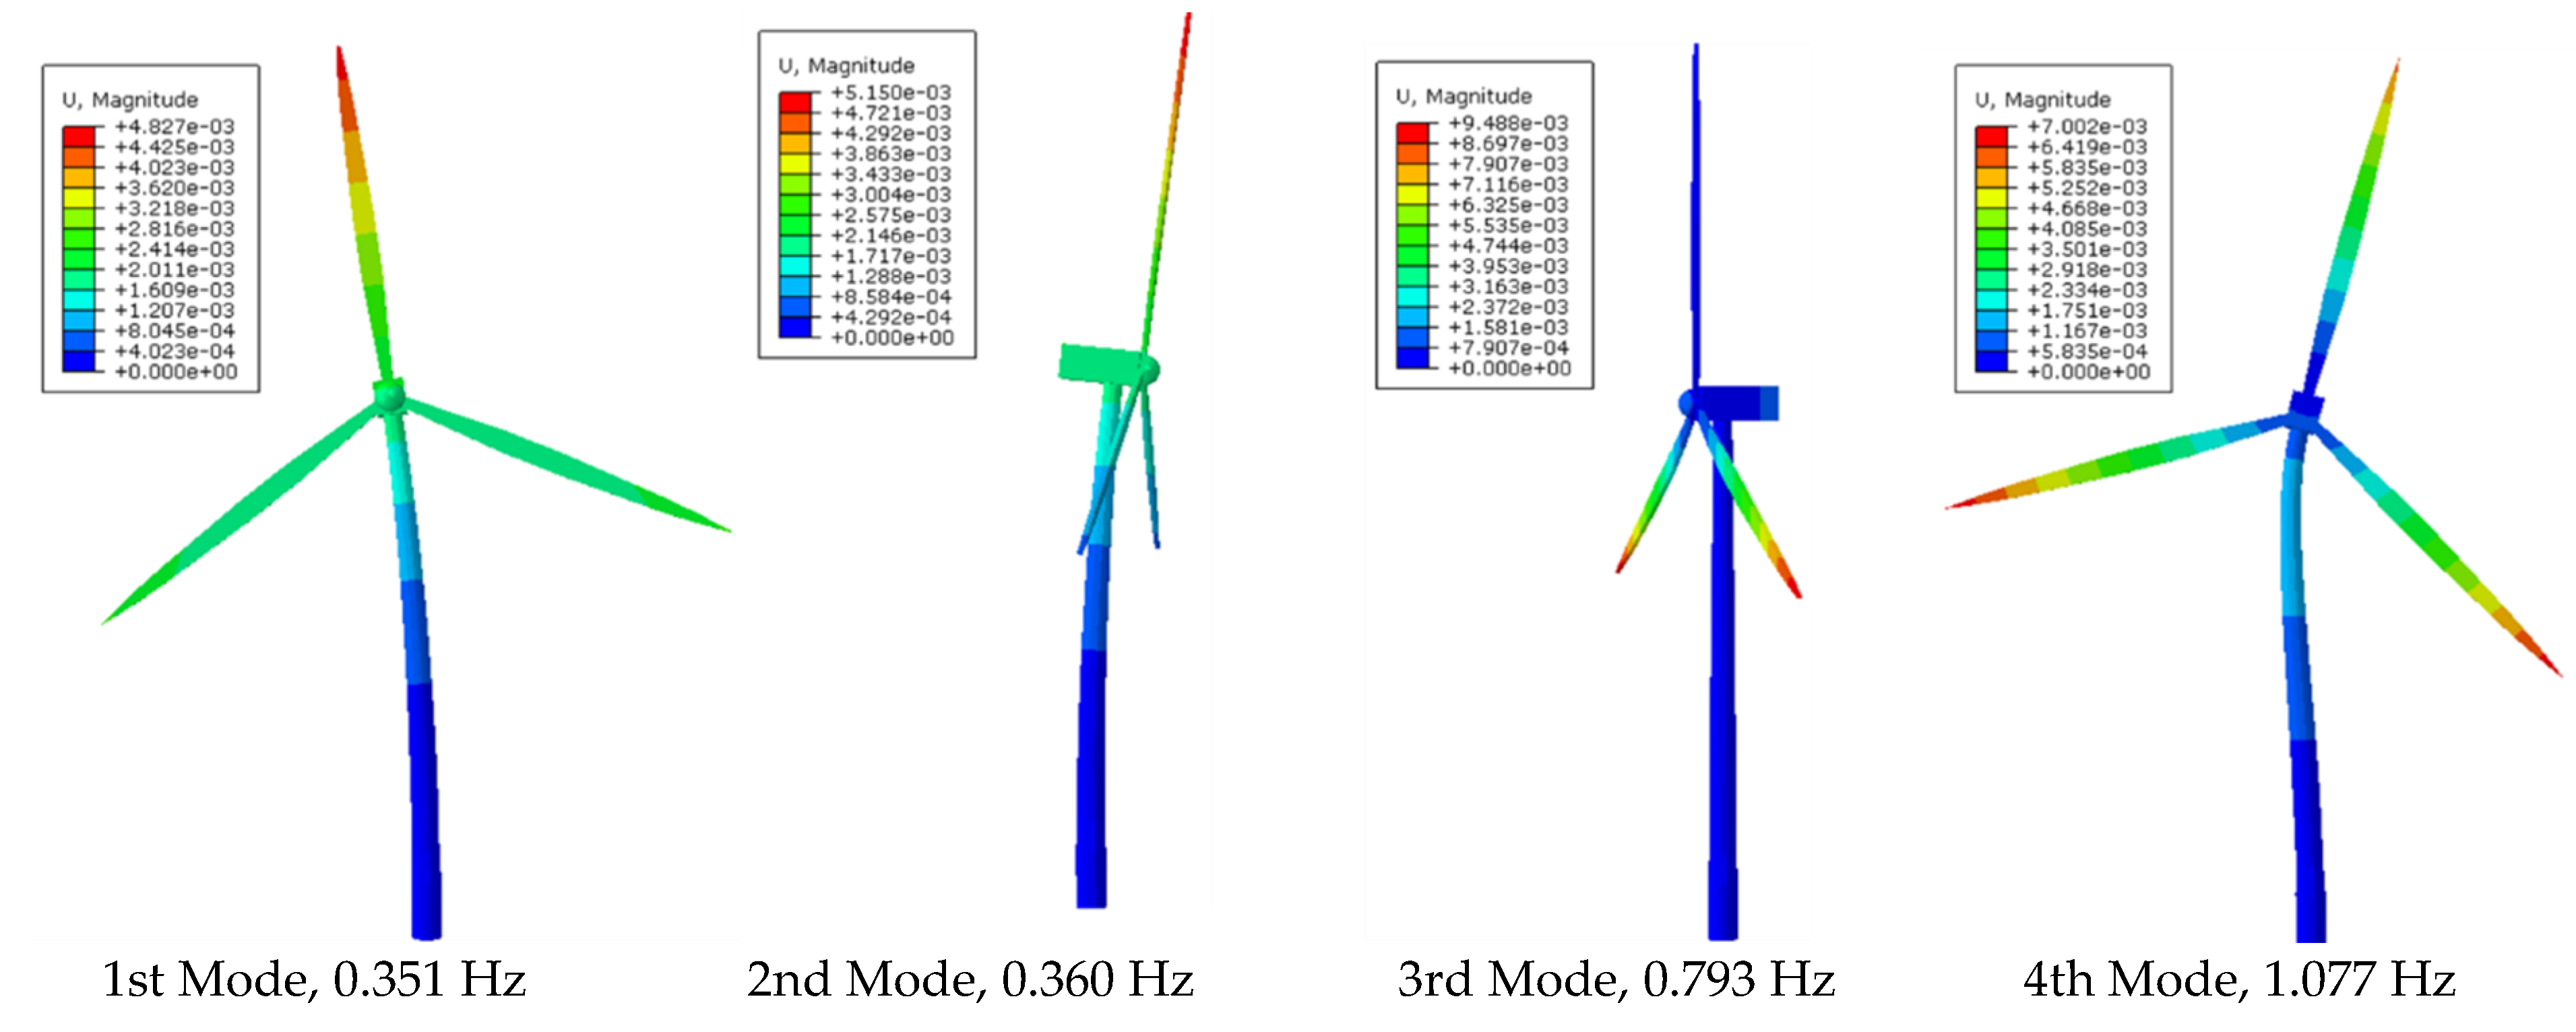
Figure 7.
Model shapes of the tower.
Figure 7.
Model shapes of the tower.
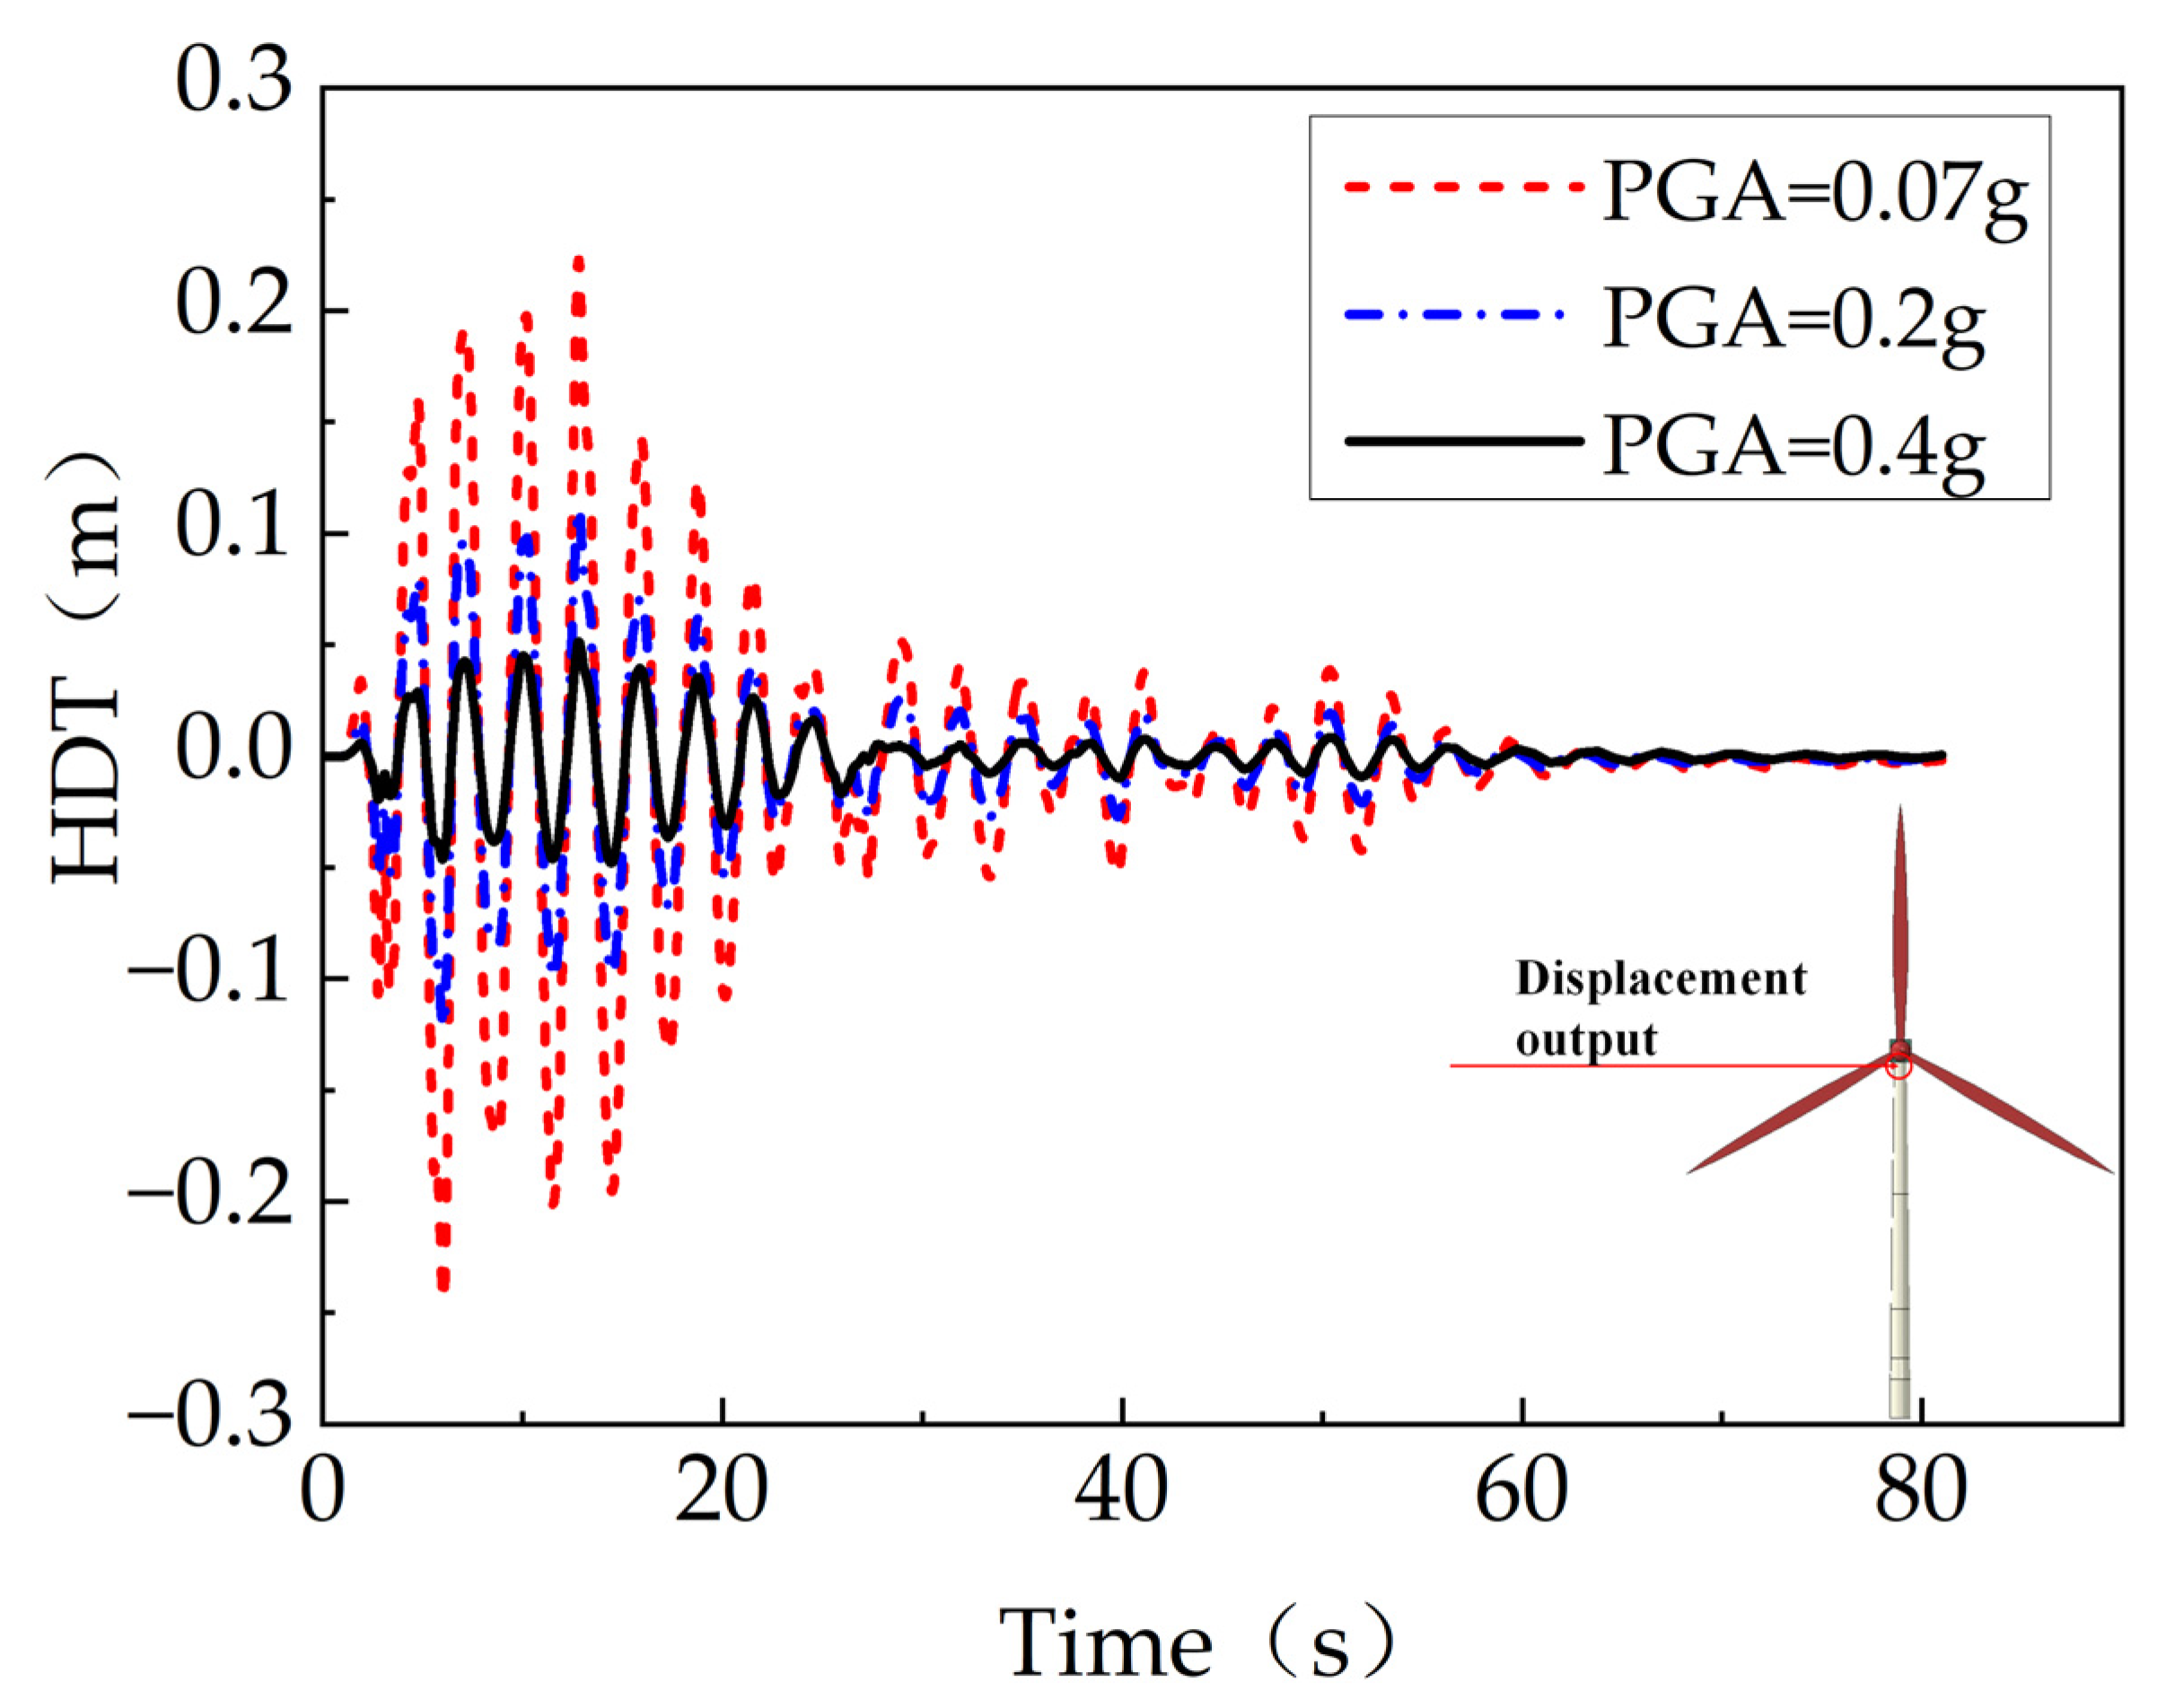
Figure 8.
El Centro earthquake.
Figure 8.
El Centro earthquake.
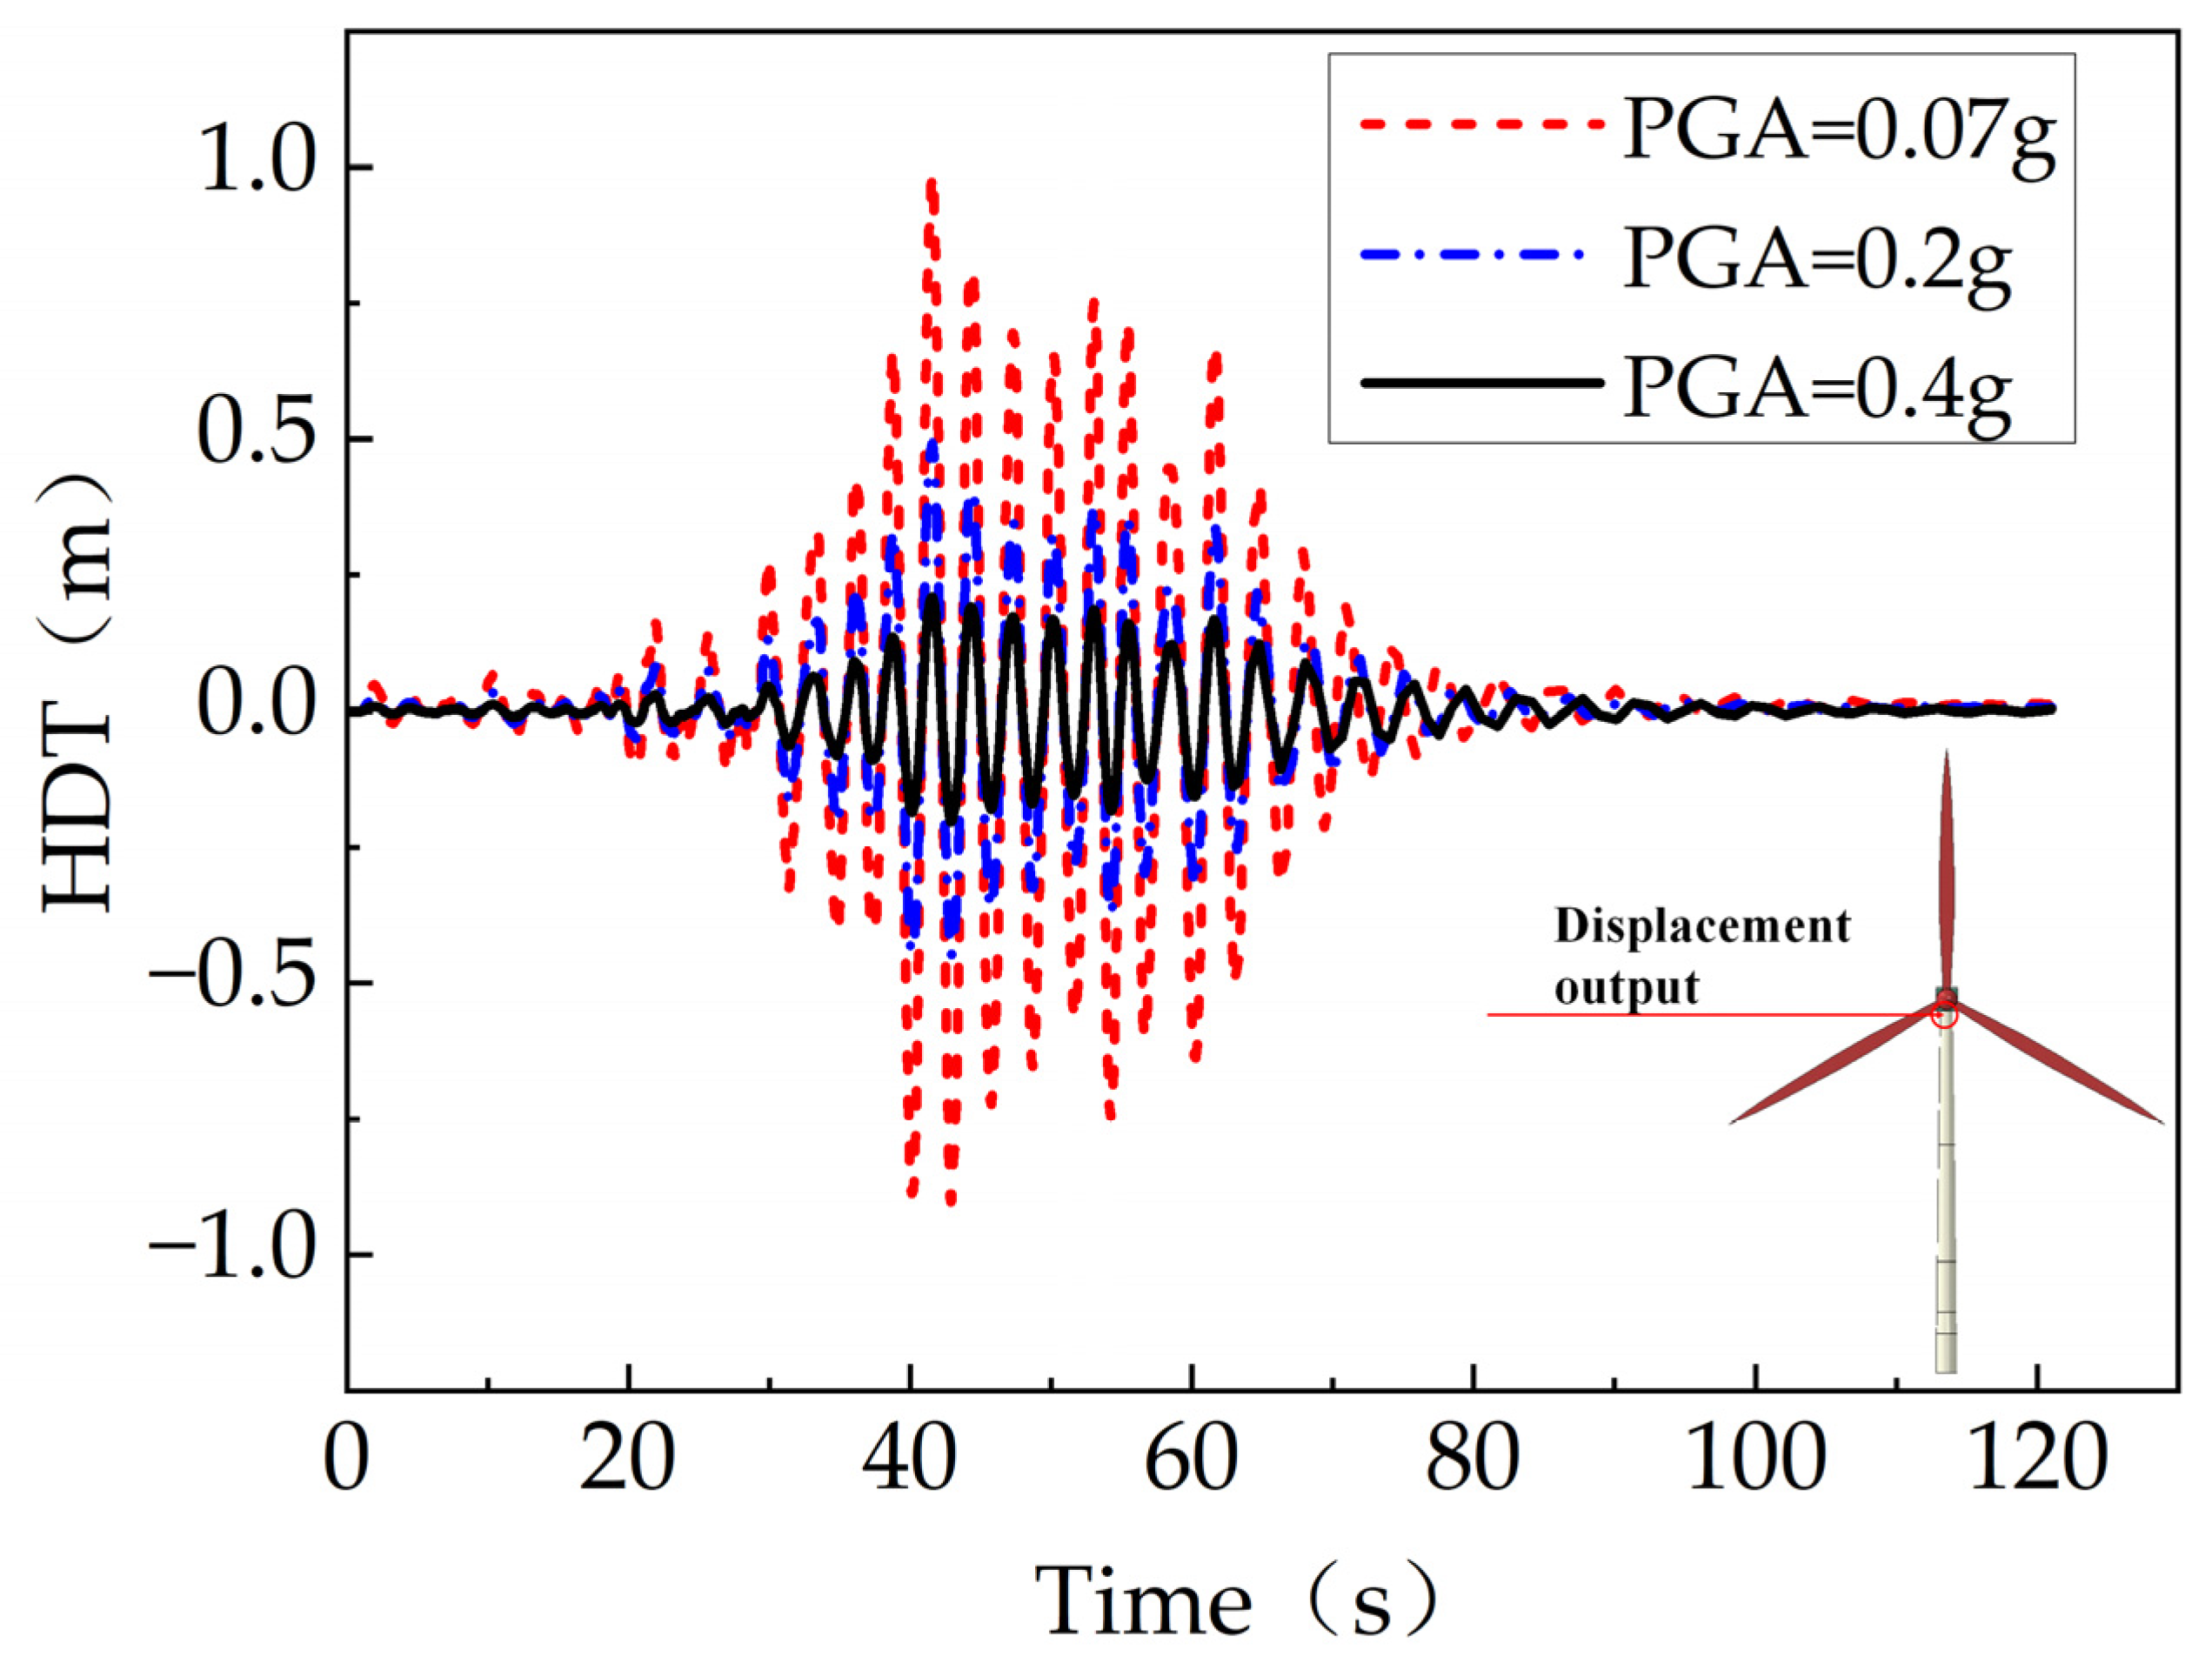
Figure 9.
Nihonkai-Chubu earthquake.
Figure 9.
Nihonkai-Chubu earthquake.
Figure 10.
Hyogoken-Nanbu earthquake.
Figure 10.
Hyogoken-Nanbu earthquake.
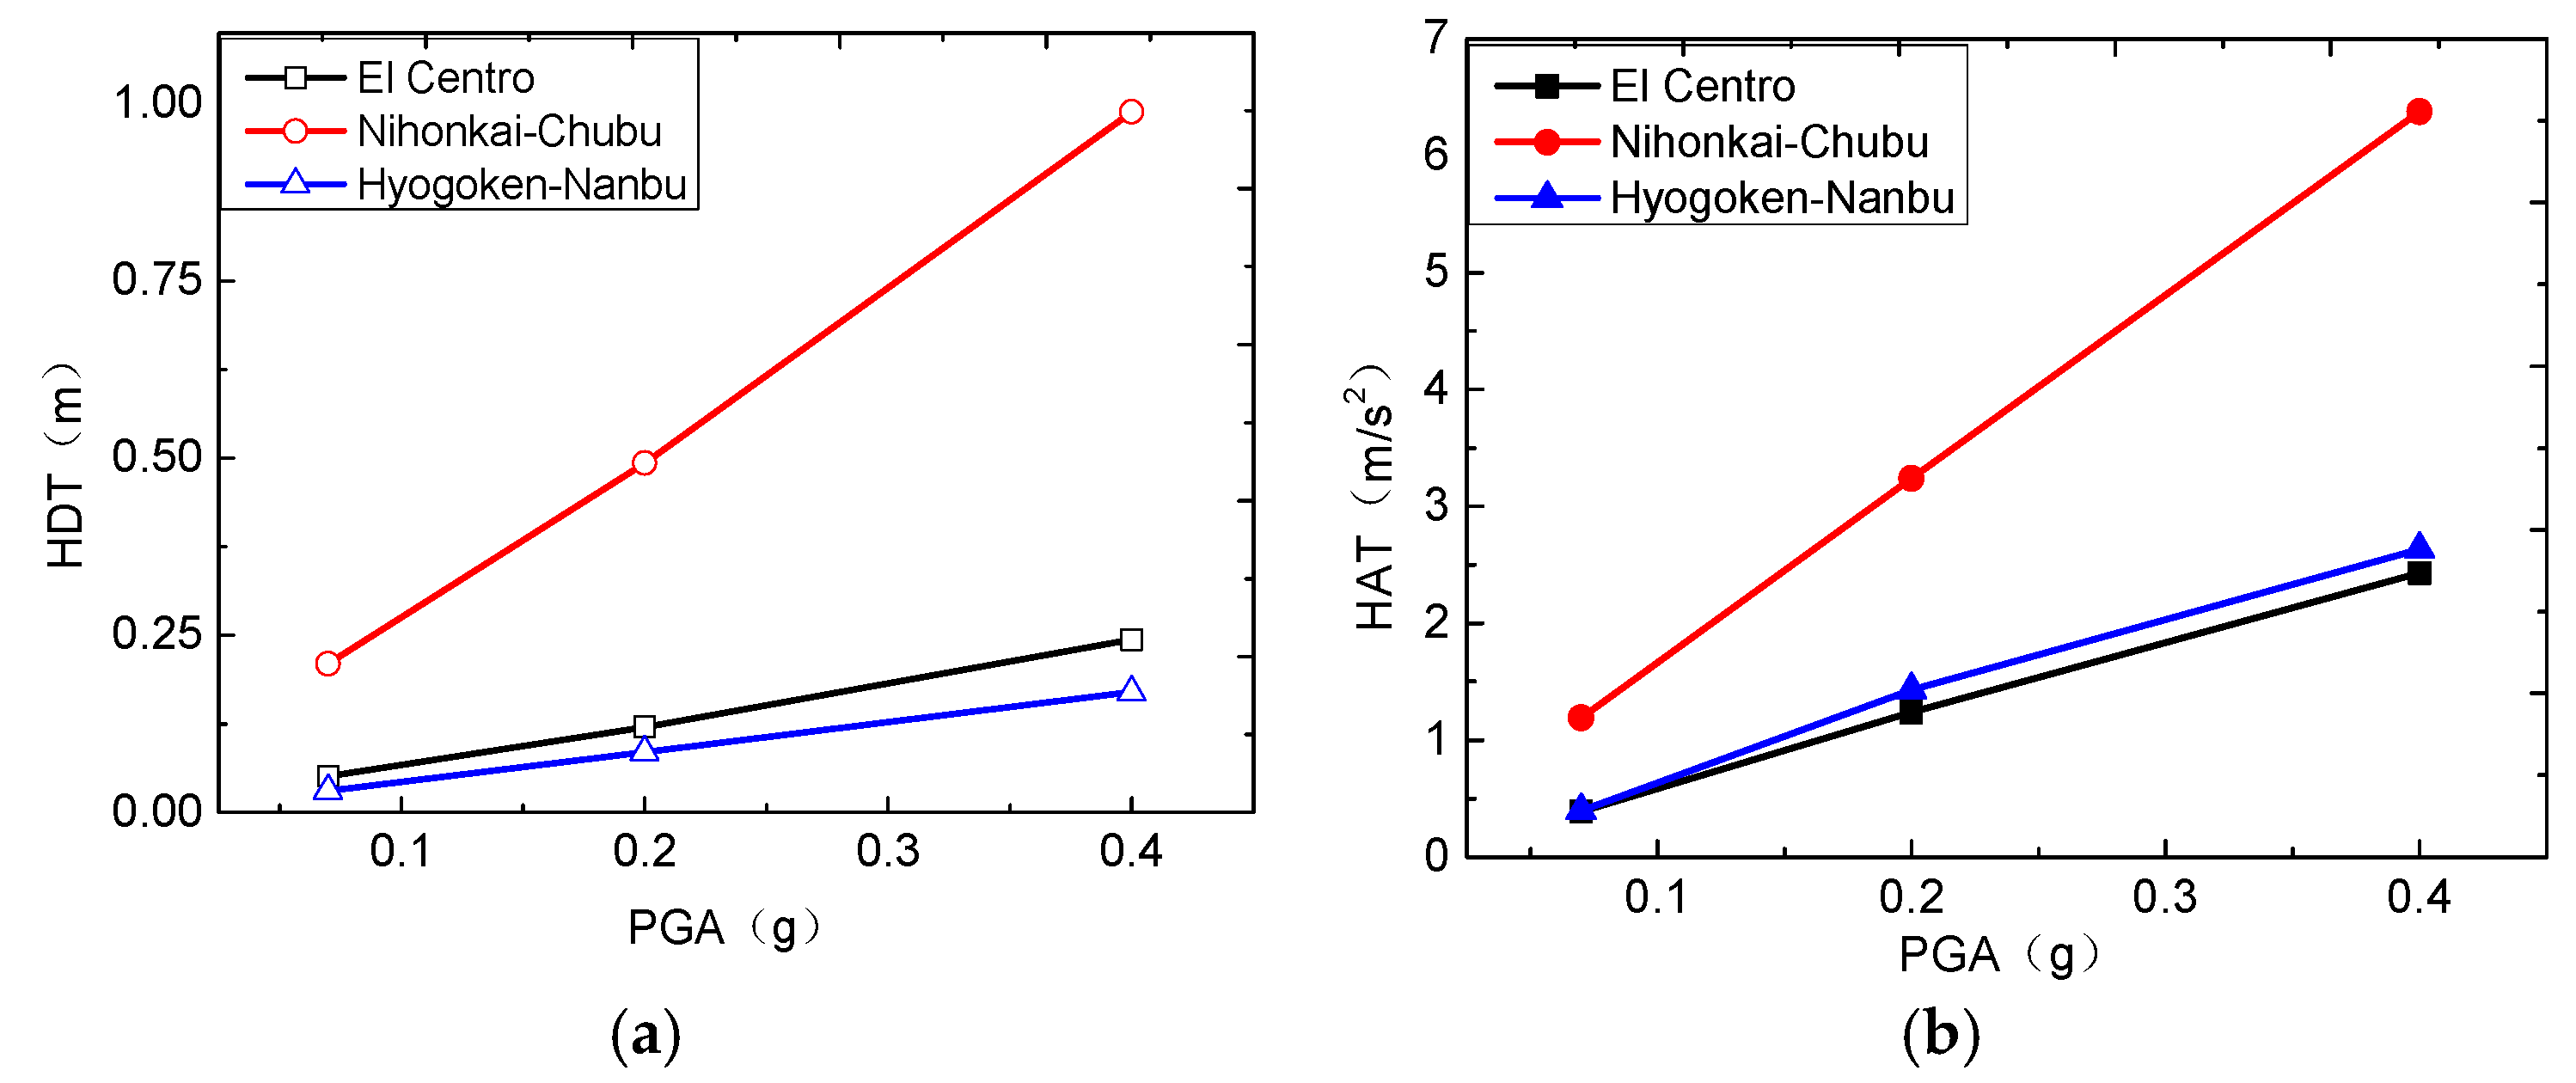
Figure 11.
Comparison of dynamic response characteristics of wind turbine tower: (a) the maximum displacement; (b) the peak acceleration.
Figure 11.
Comparison of dynamic response characteristics of wind turbine tower: (a) the maximum displacement; (b) the peak acceleration.
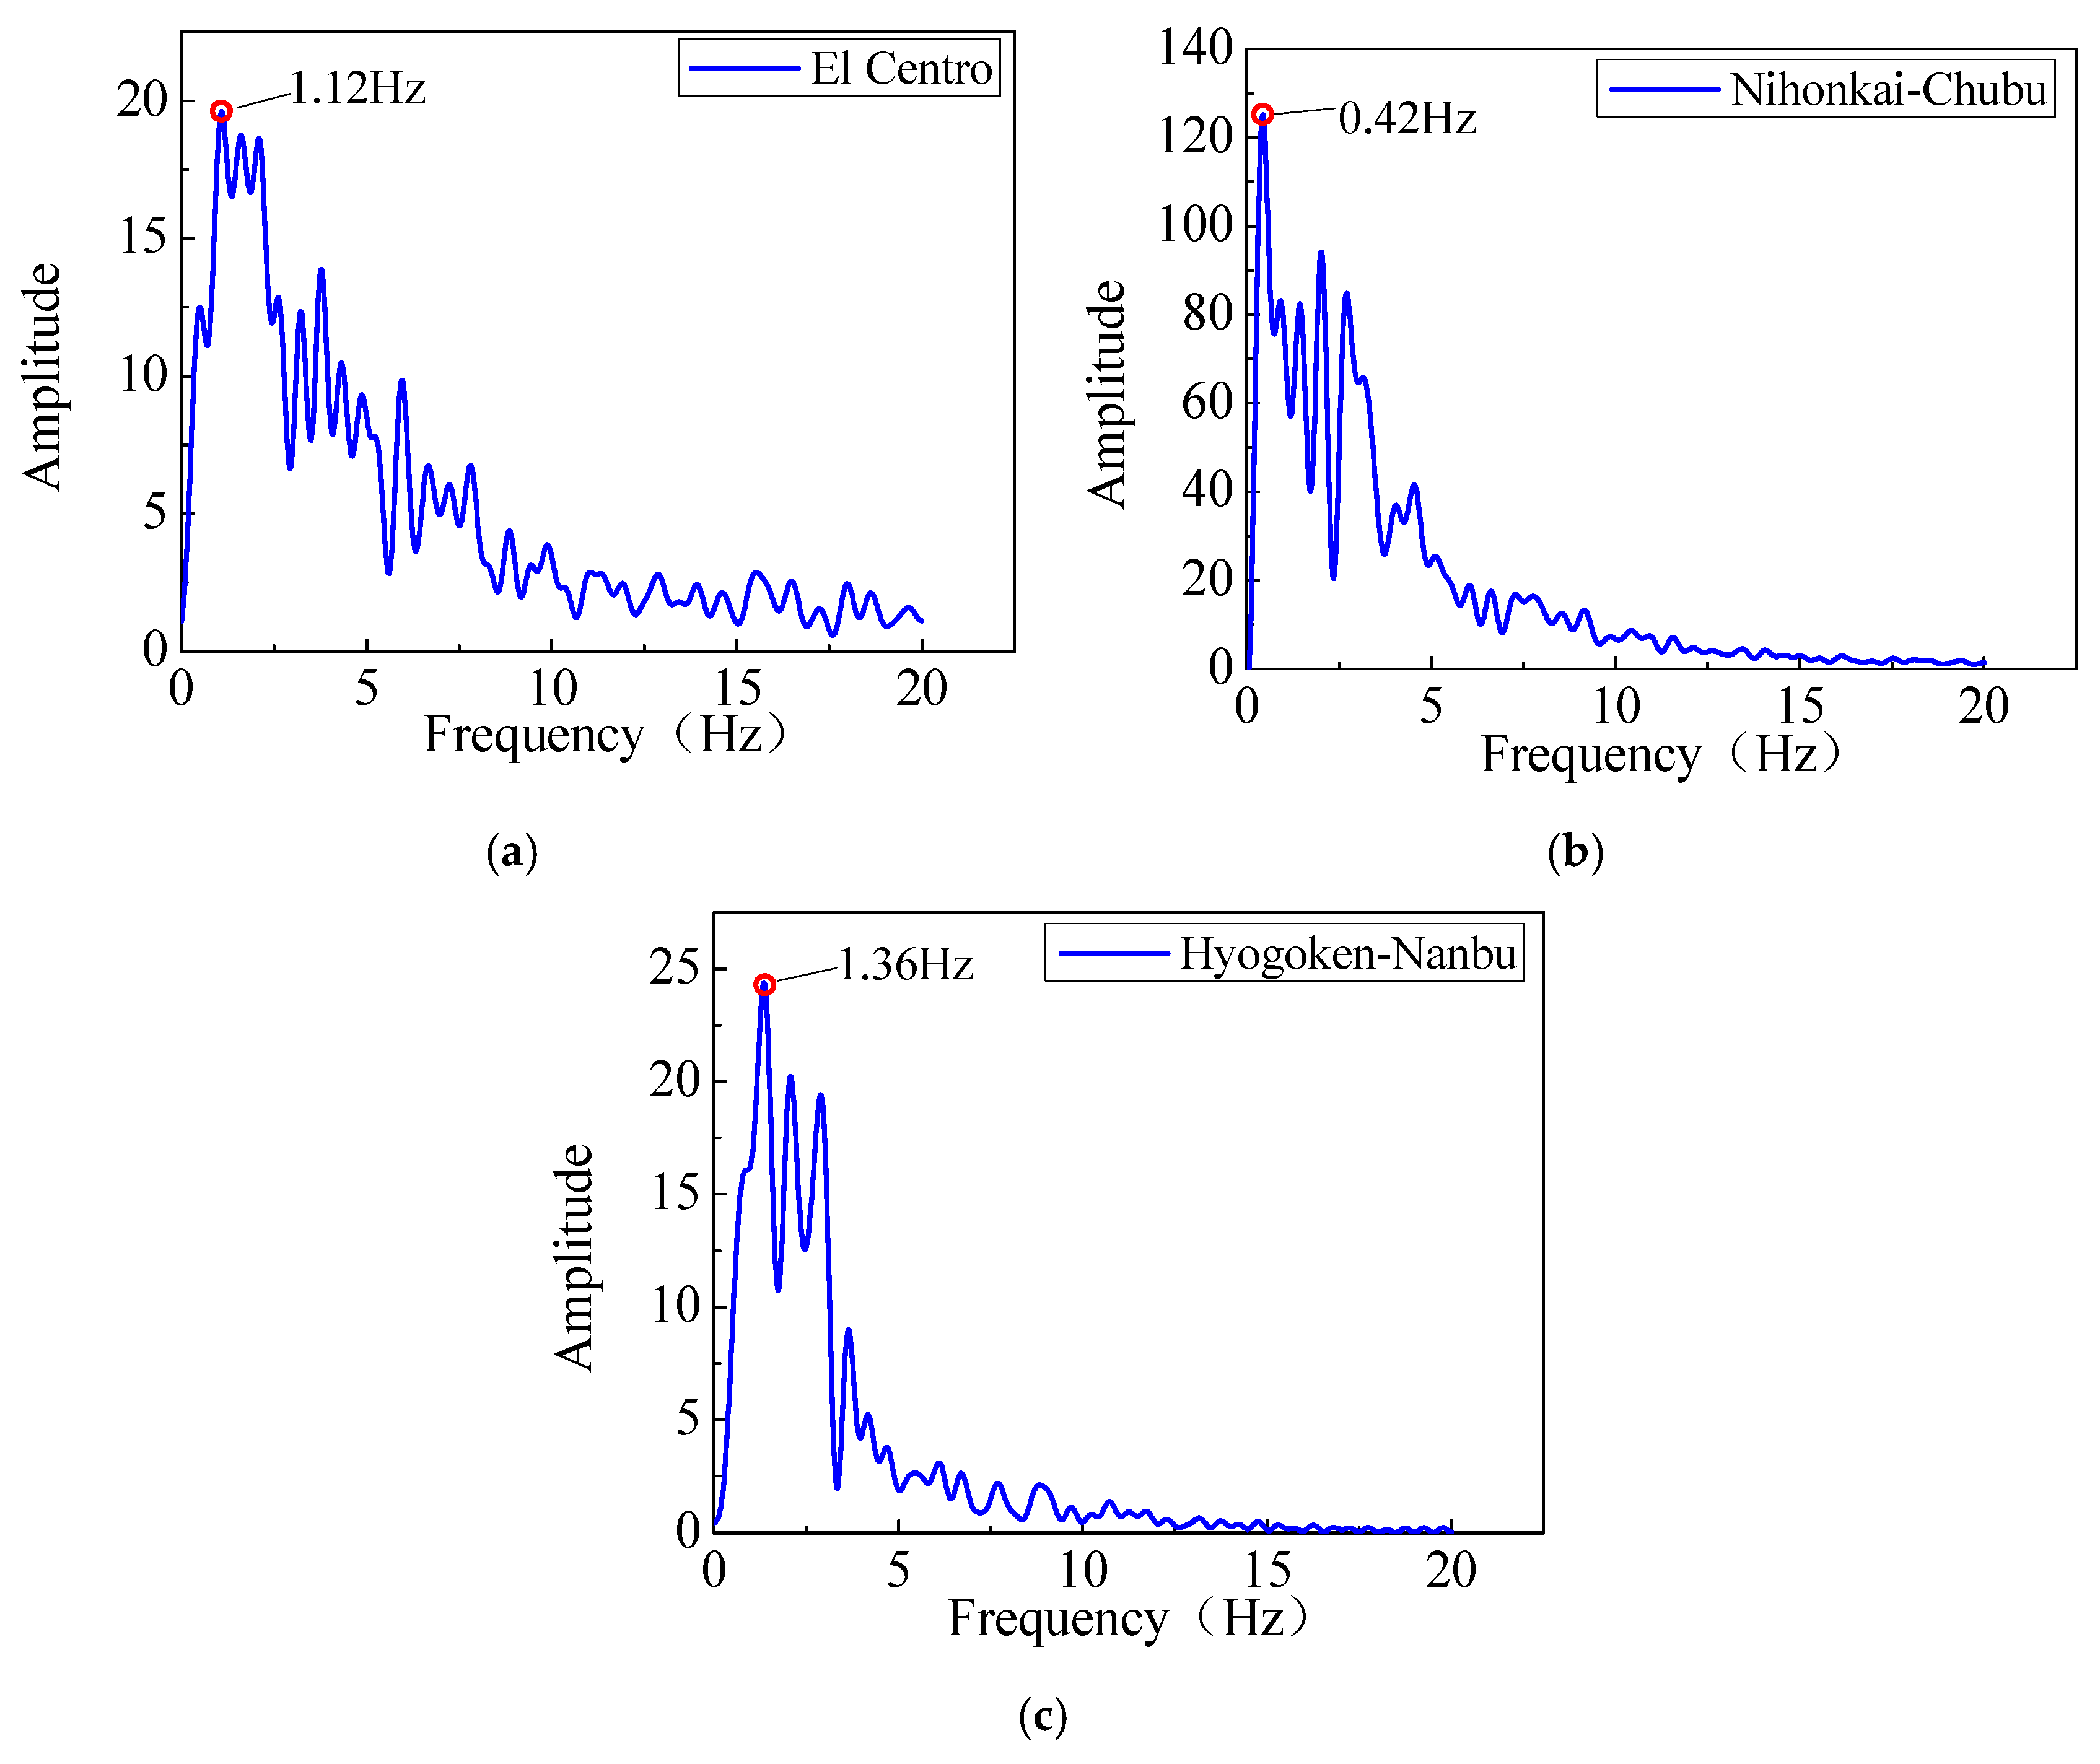
Figure 12.
Fourier spectrum of seismic wave: (a) the El Centro earthquake; (b) the Nihonkai-Chubu earthquake; (c) the Hyogoken-Nanbu earthquake.
Figure 12.
Fourier spectrum of seismic wave: (a) the El Centro earthquake; (b) the Nihonkai-Chubu earthquake; (c) the Hyogoken-Nanbu earthquake.
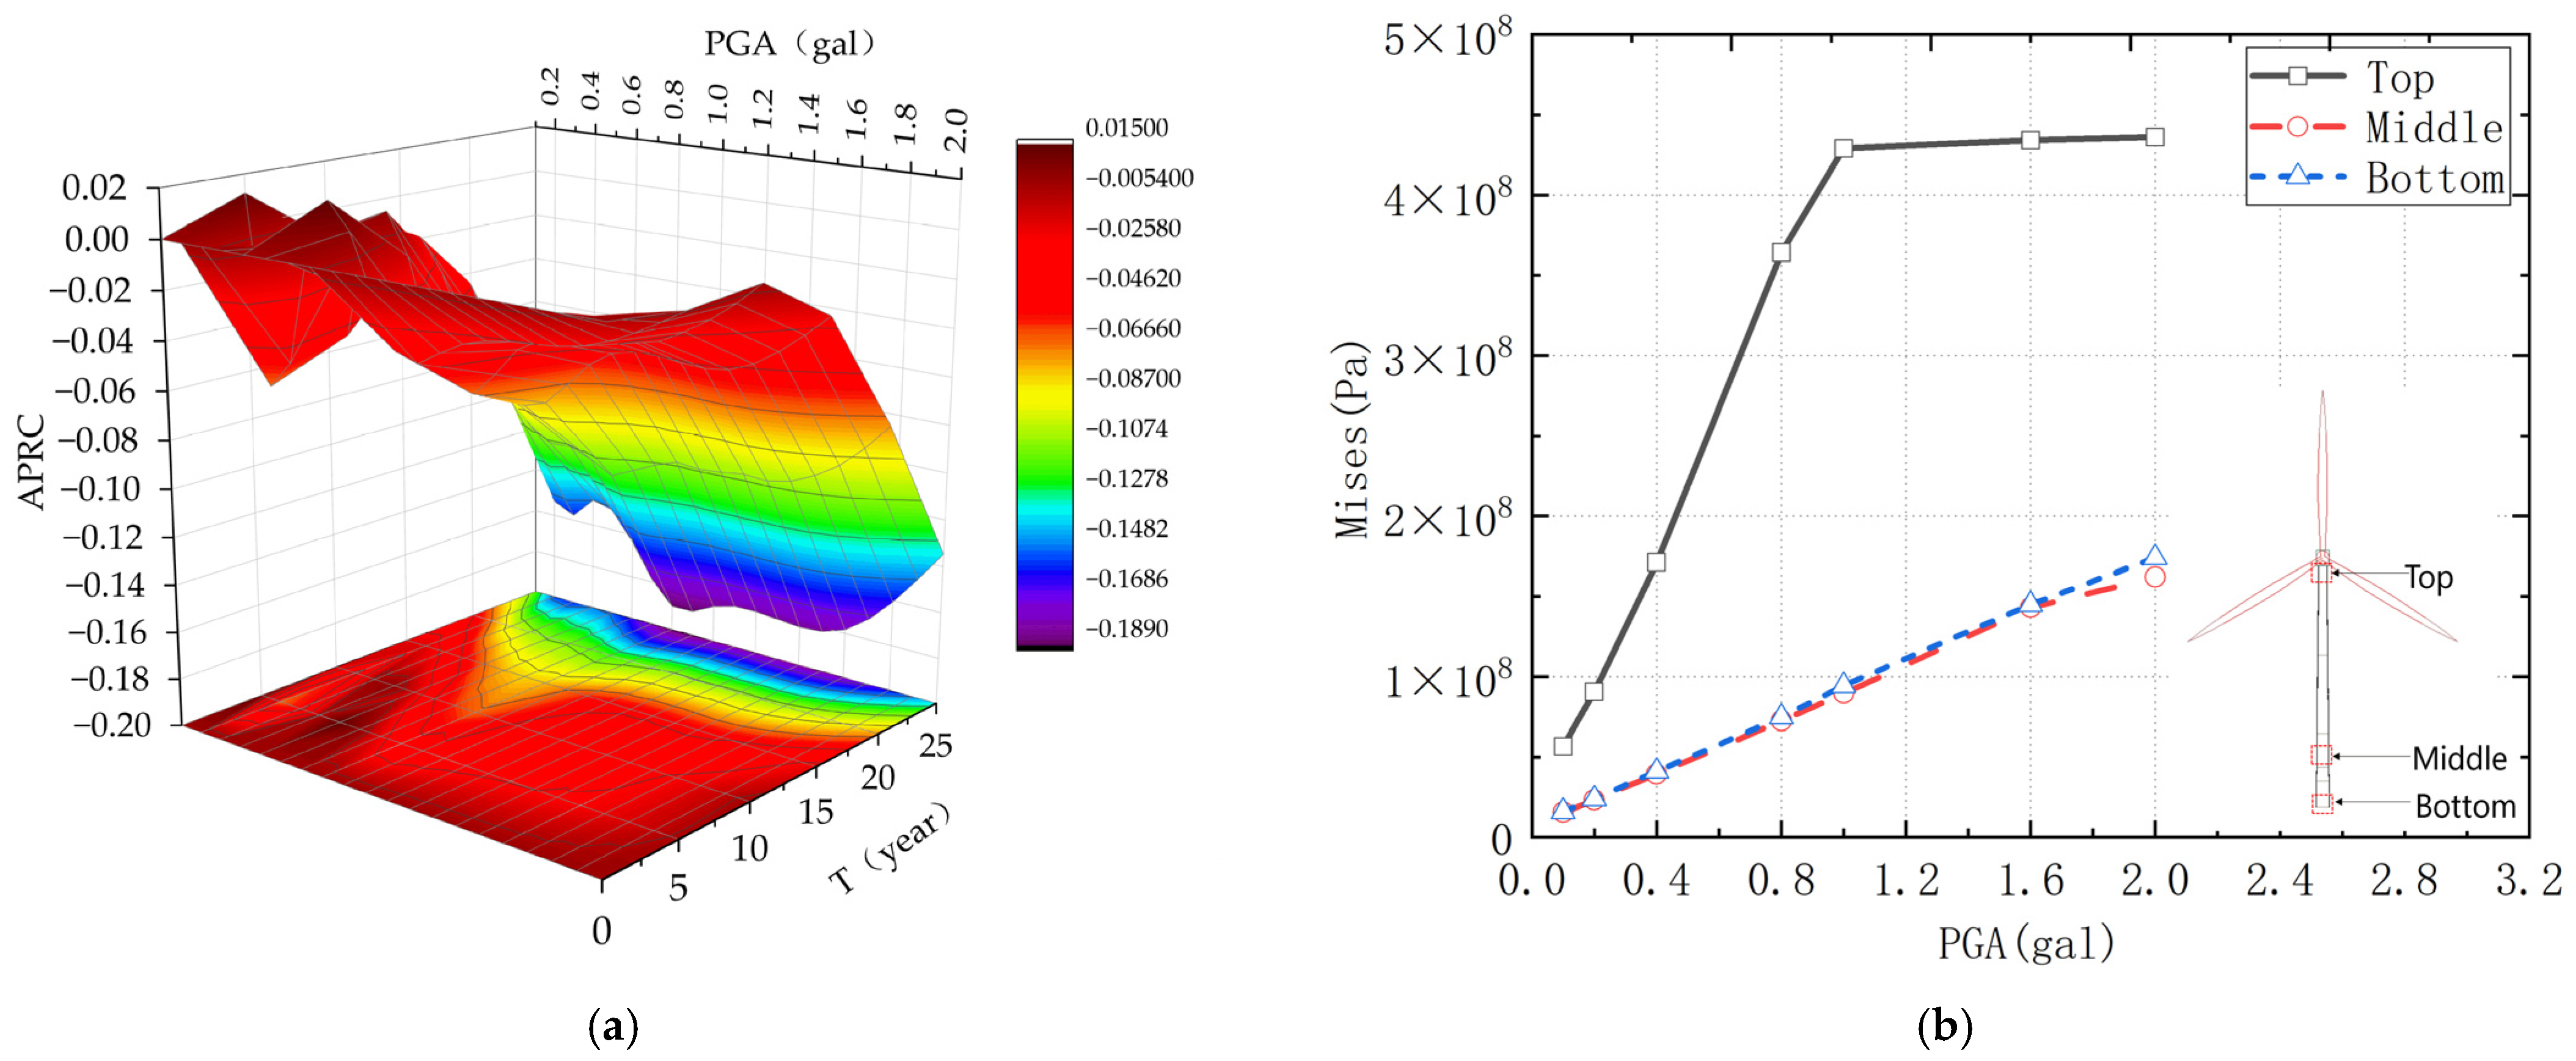
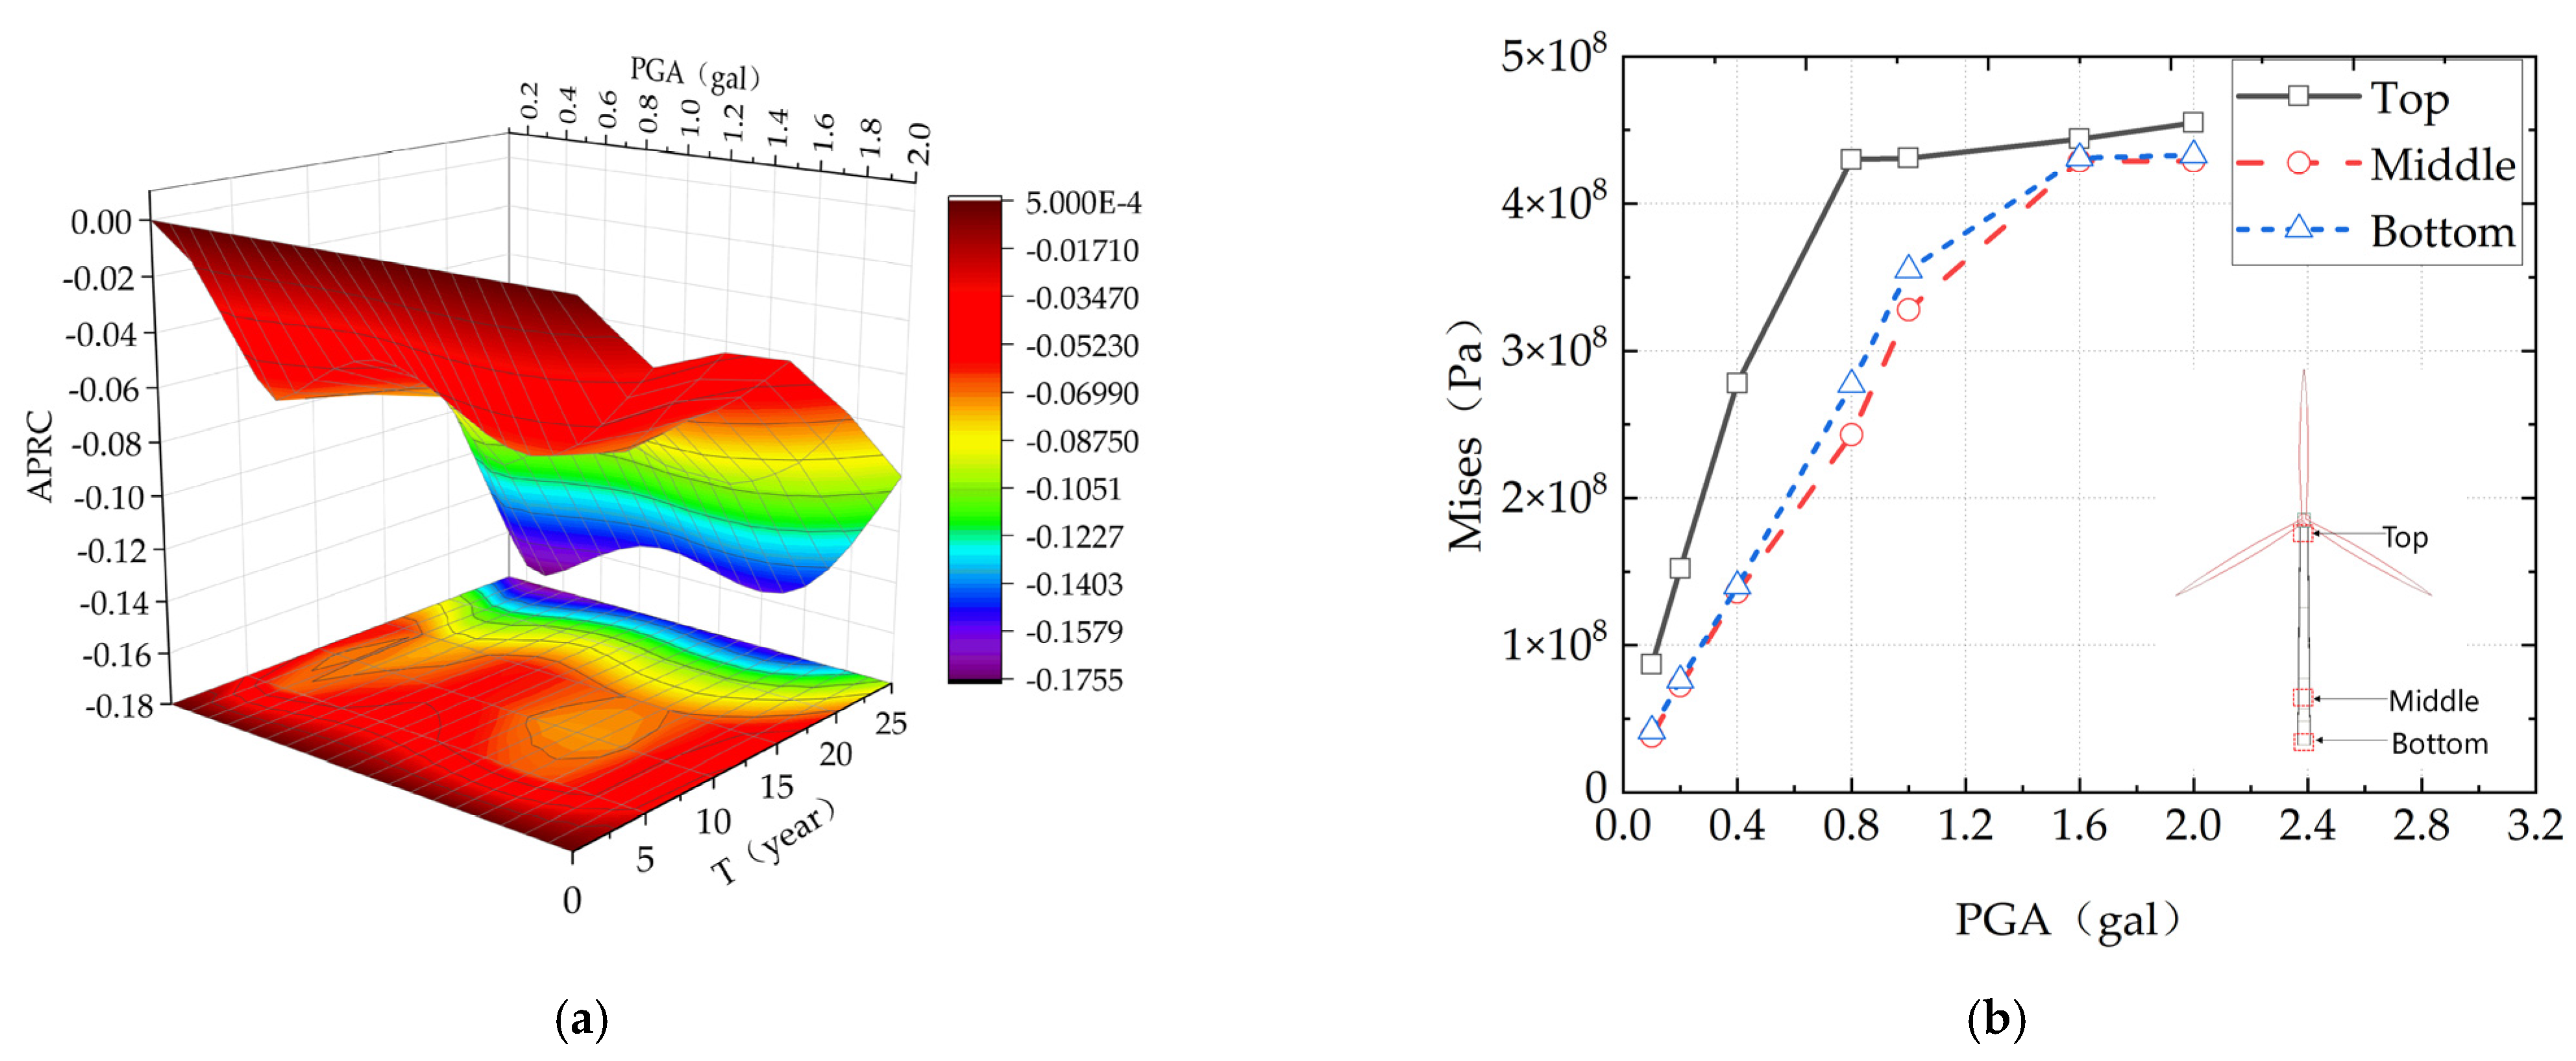
Figure 13.
The El Centro earthquake: (a) structural APRC value; (b) maximum Mises stress.
Figure 13.
The El Centro earthquake: (a) structural APRC value; (b) maximum Mises stress.
Figure 14.
The Nihonkai-Chubu earthquake: (a) structural APRC value; (b) maximum Mises stress.
Figure 14.
The Nihonkai-Chubu earthquake: (a) structural APRC value; (b) maximum Mises stress.
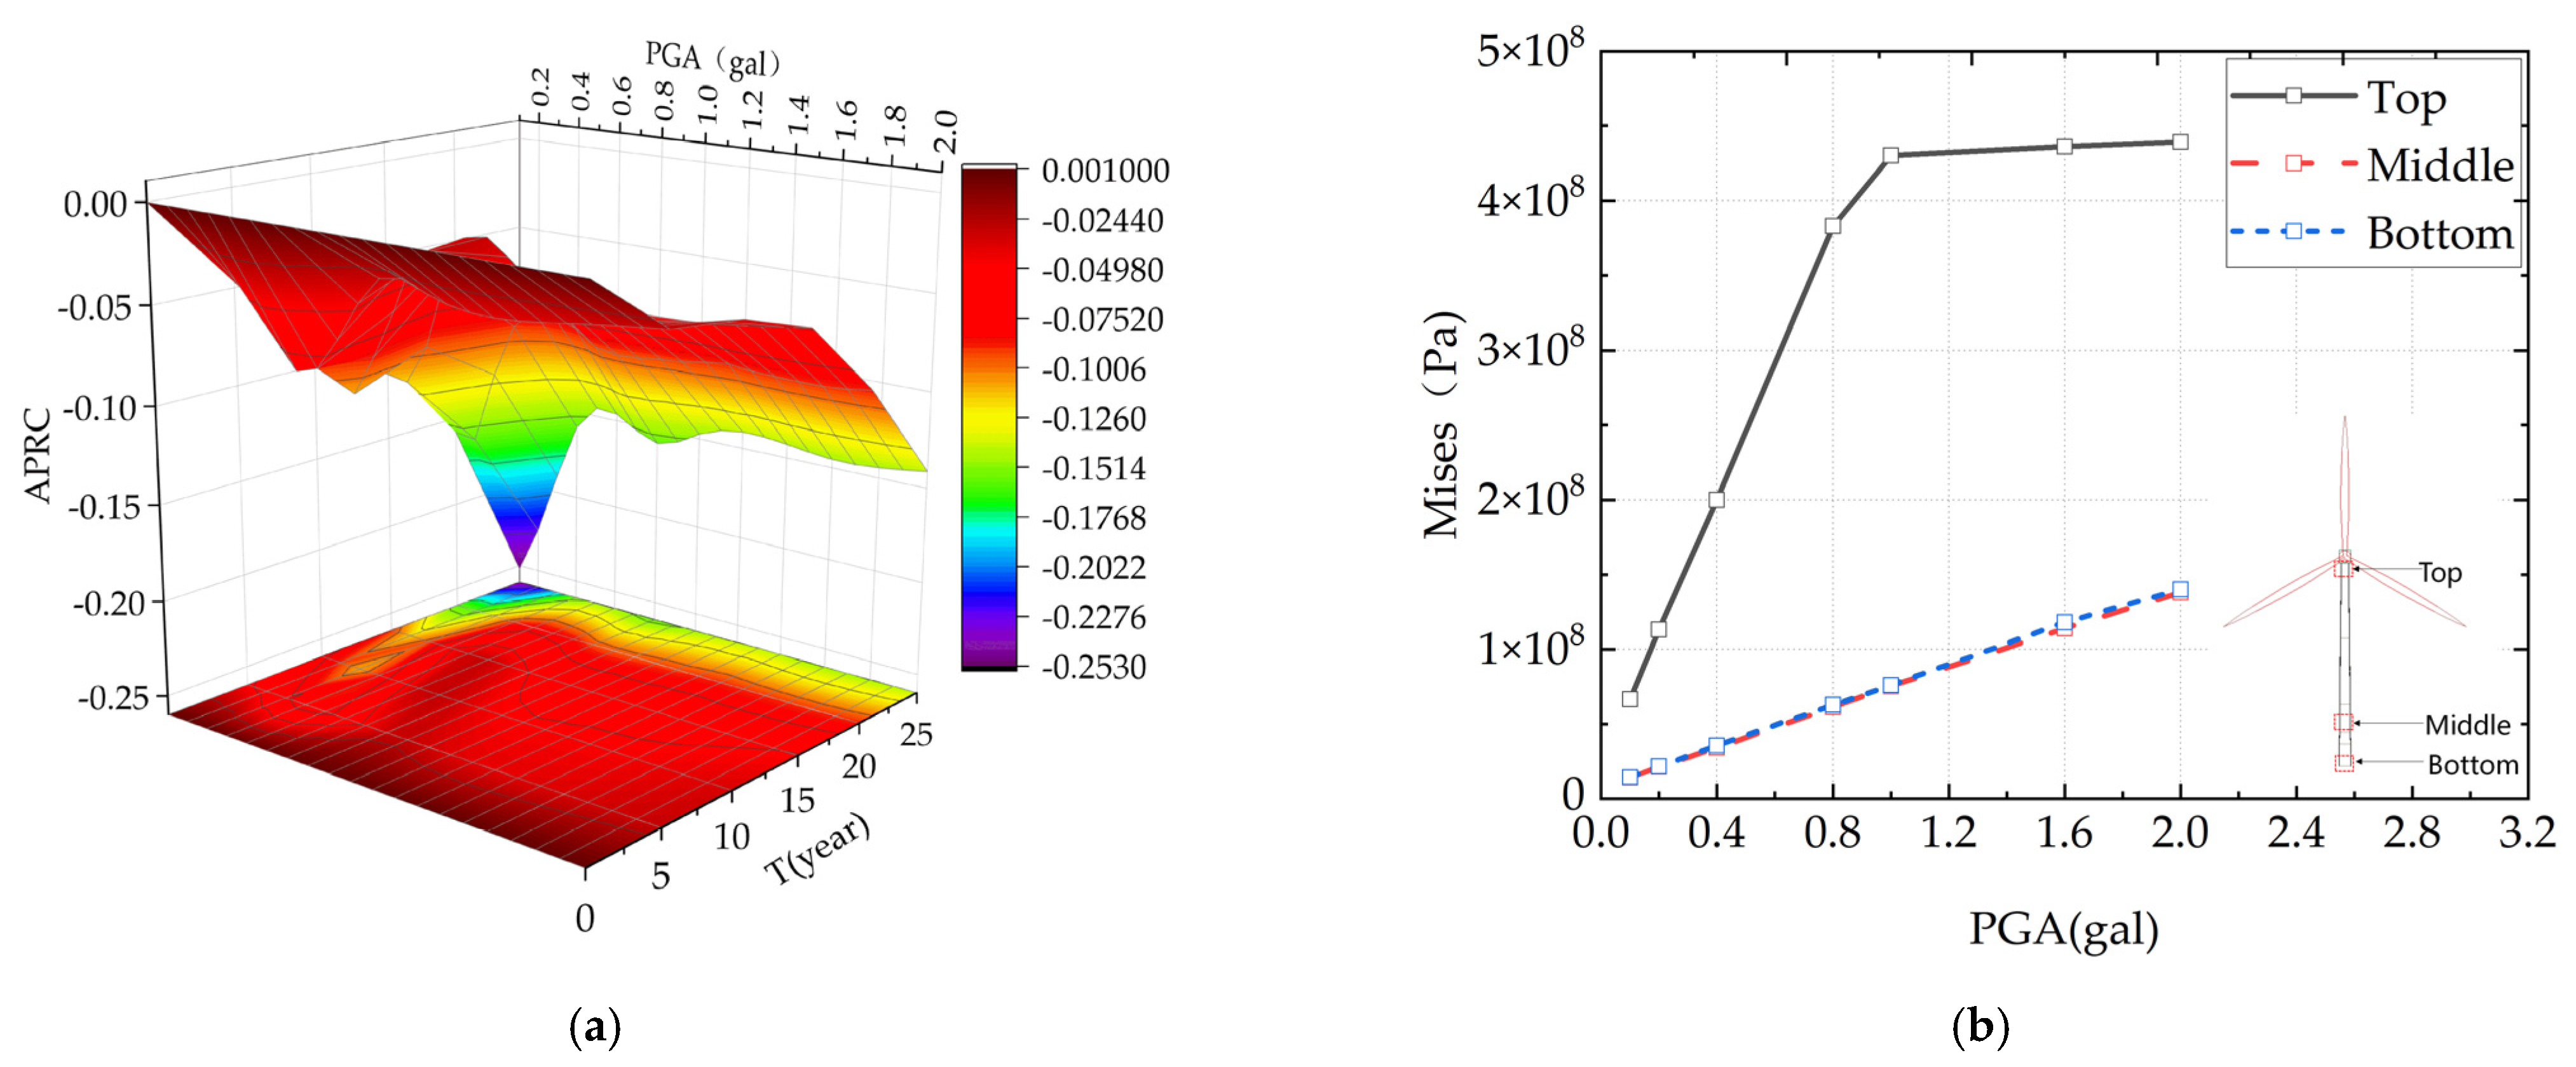
Figure 15.
The Hyogoken-Nanbu earthquake: (a) structural APRC value; (b) maximum Mises stress.
Figure 15.
The Hyogoken-Nanbu earthquake: (a) structural APRC value; (b) maximum Mises stress.
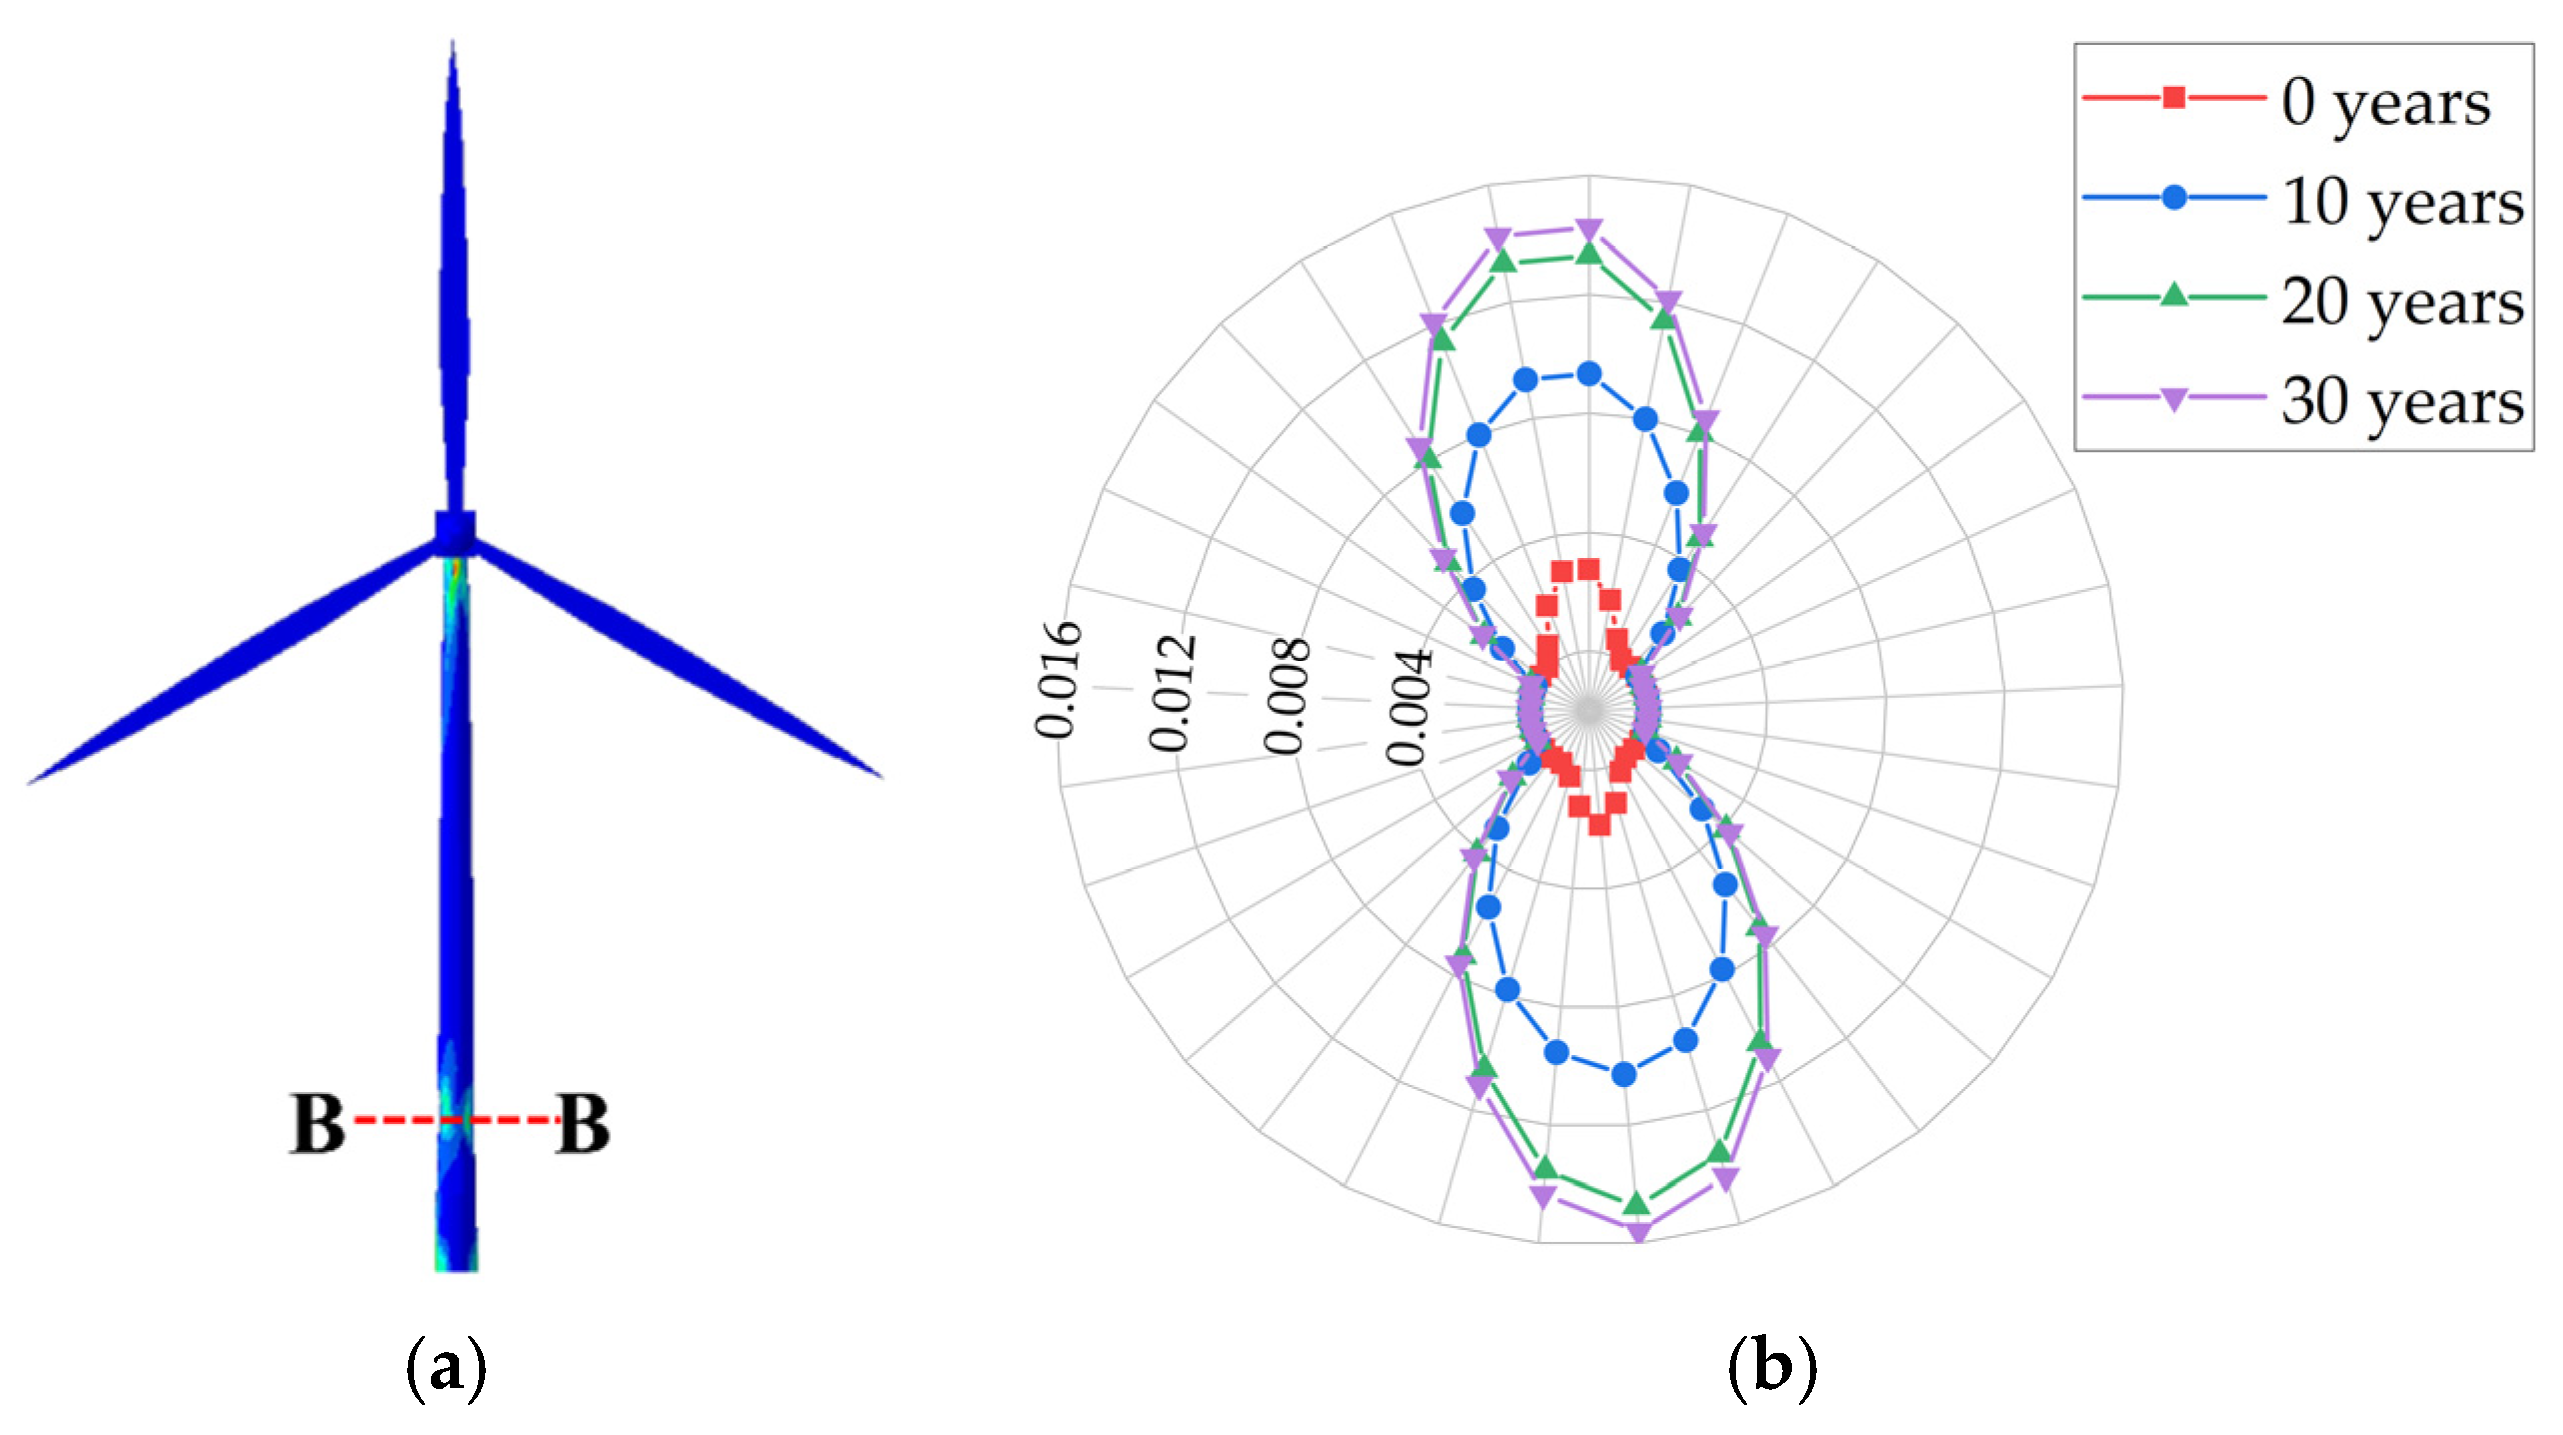
Figure 16.
Equivalent plastic strain of corrosion area structure: (a) Section position; (b) Equivalent plastic strain of section B-B.
Figure 16.
Equivalent plastic strain of corrosion area structure: (a) Section position; (b) Equivalent plastic strain of section B-B.
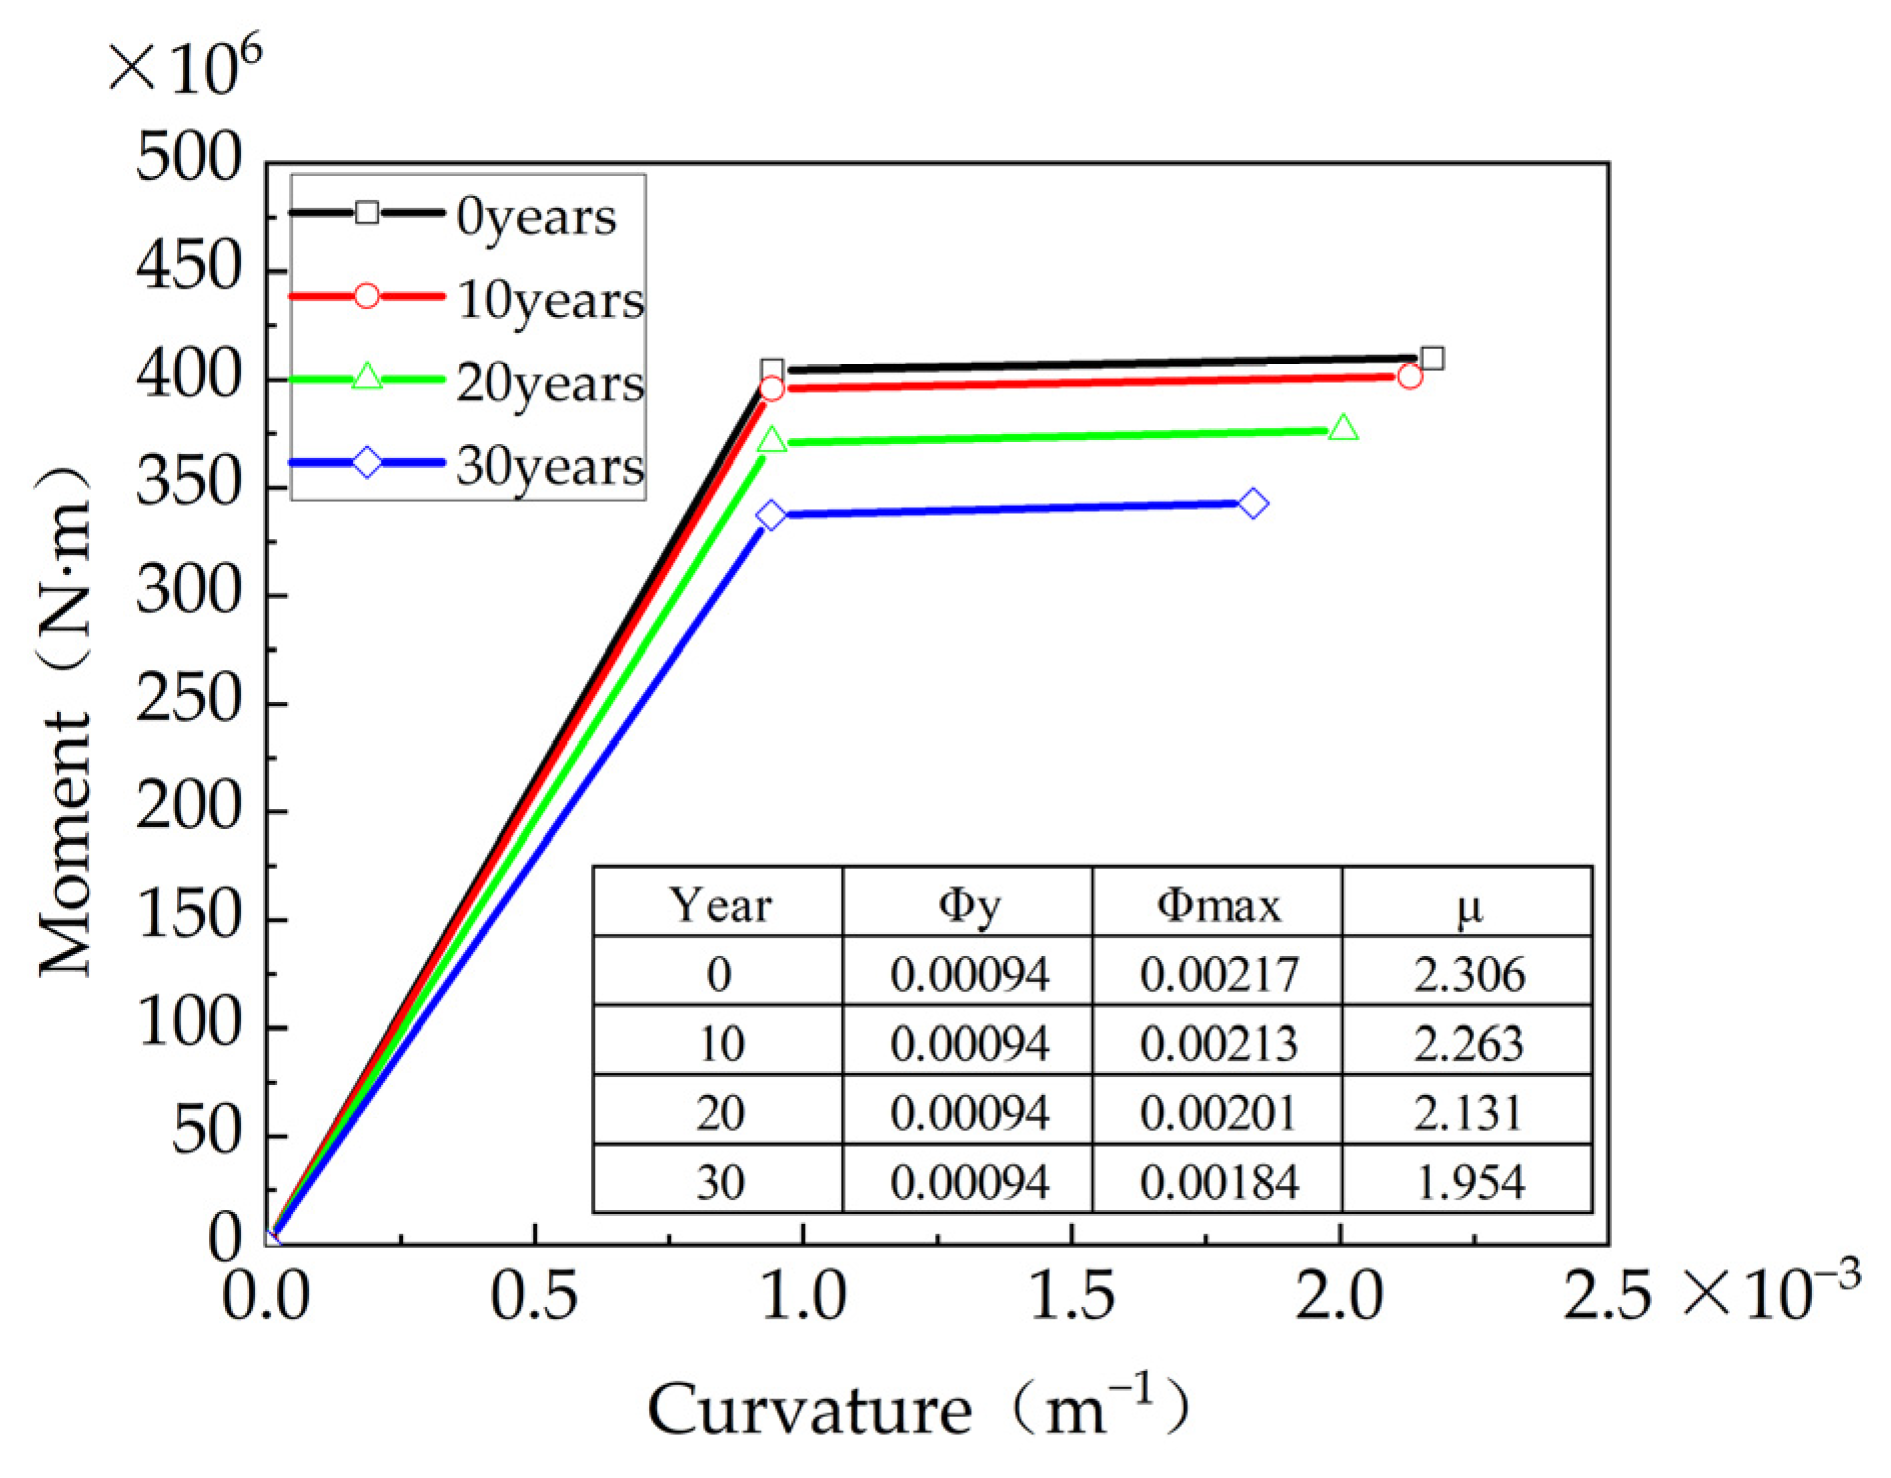
Figure 17.
Bending moment curvature relationship of different corrosion structures.
Figure 17.
Bending moment curvature relationship of different corrosion structures.
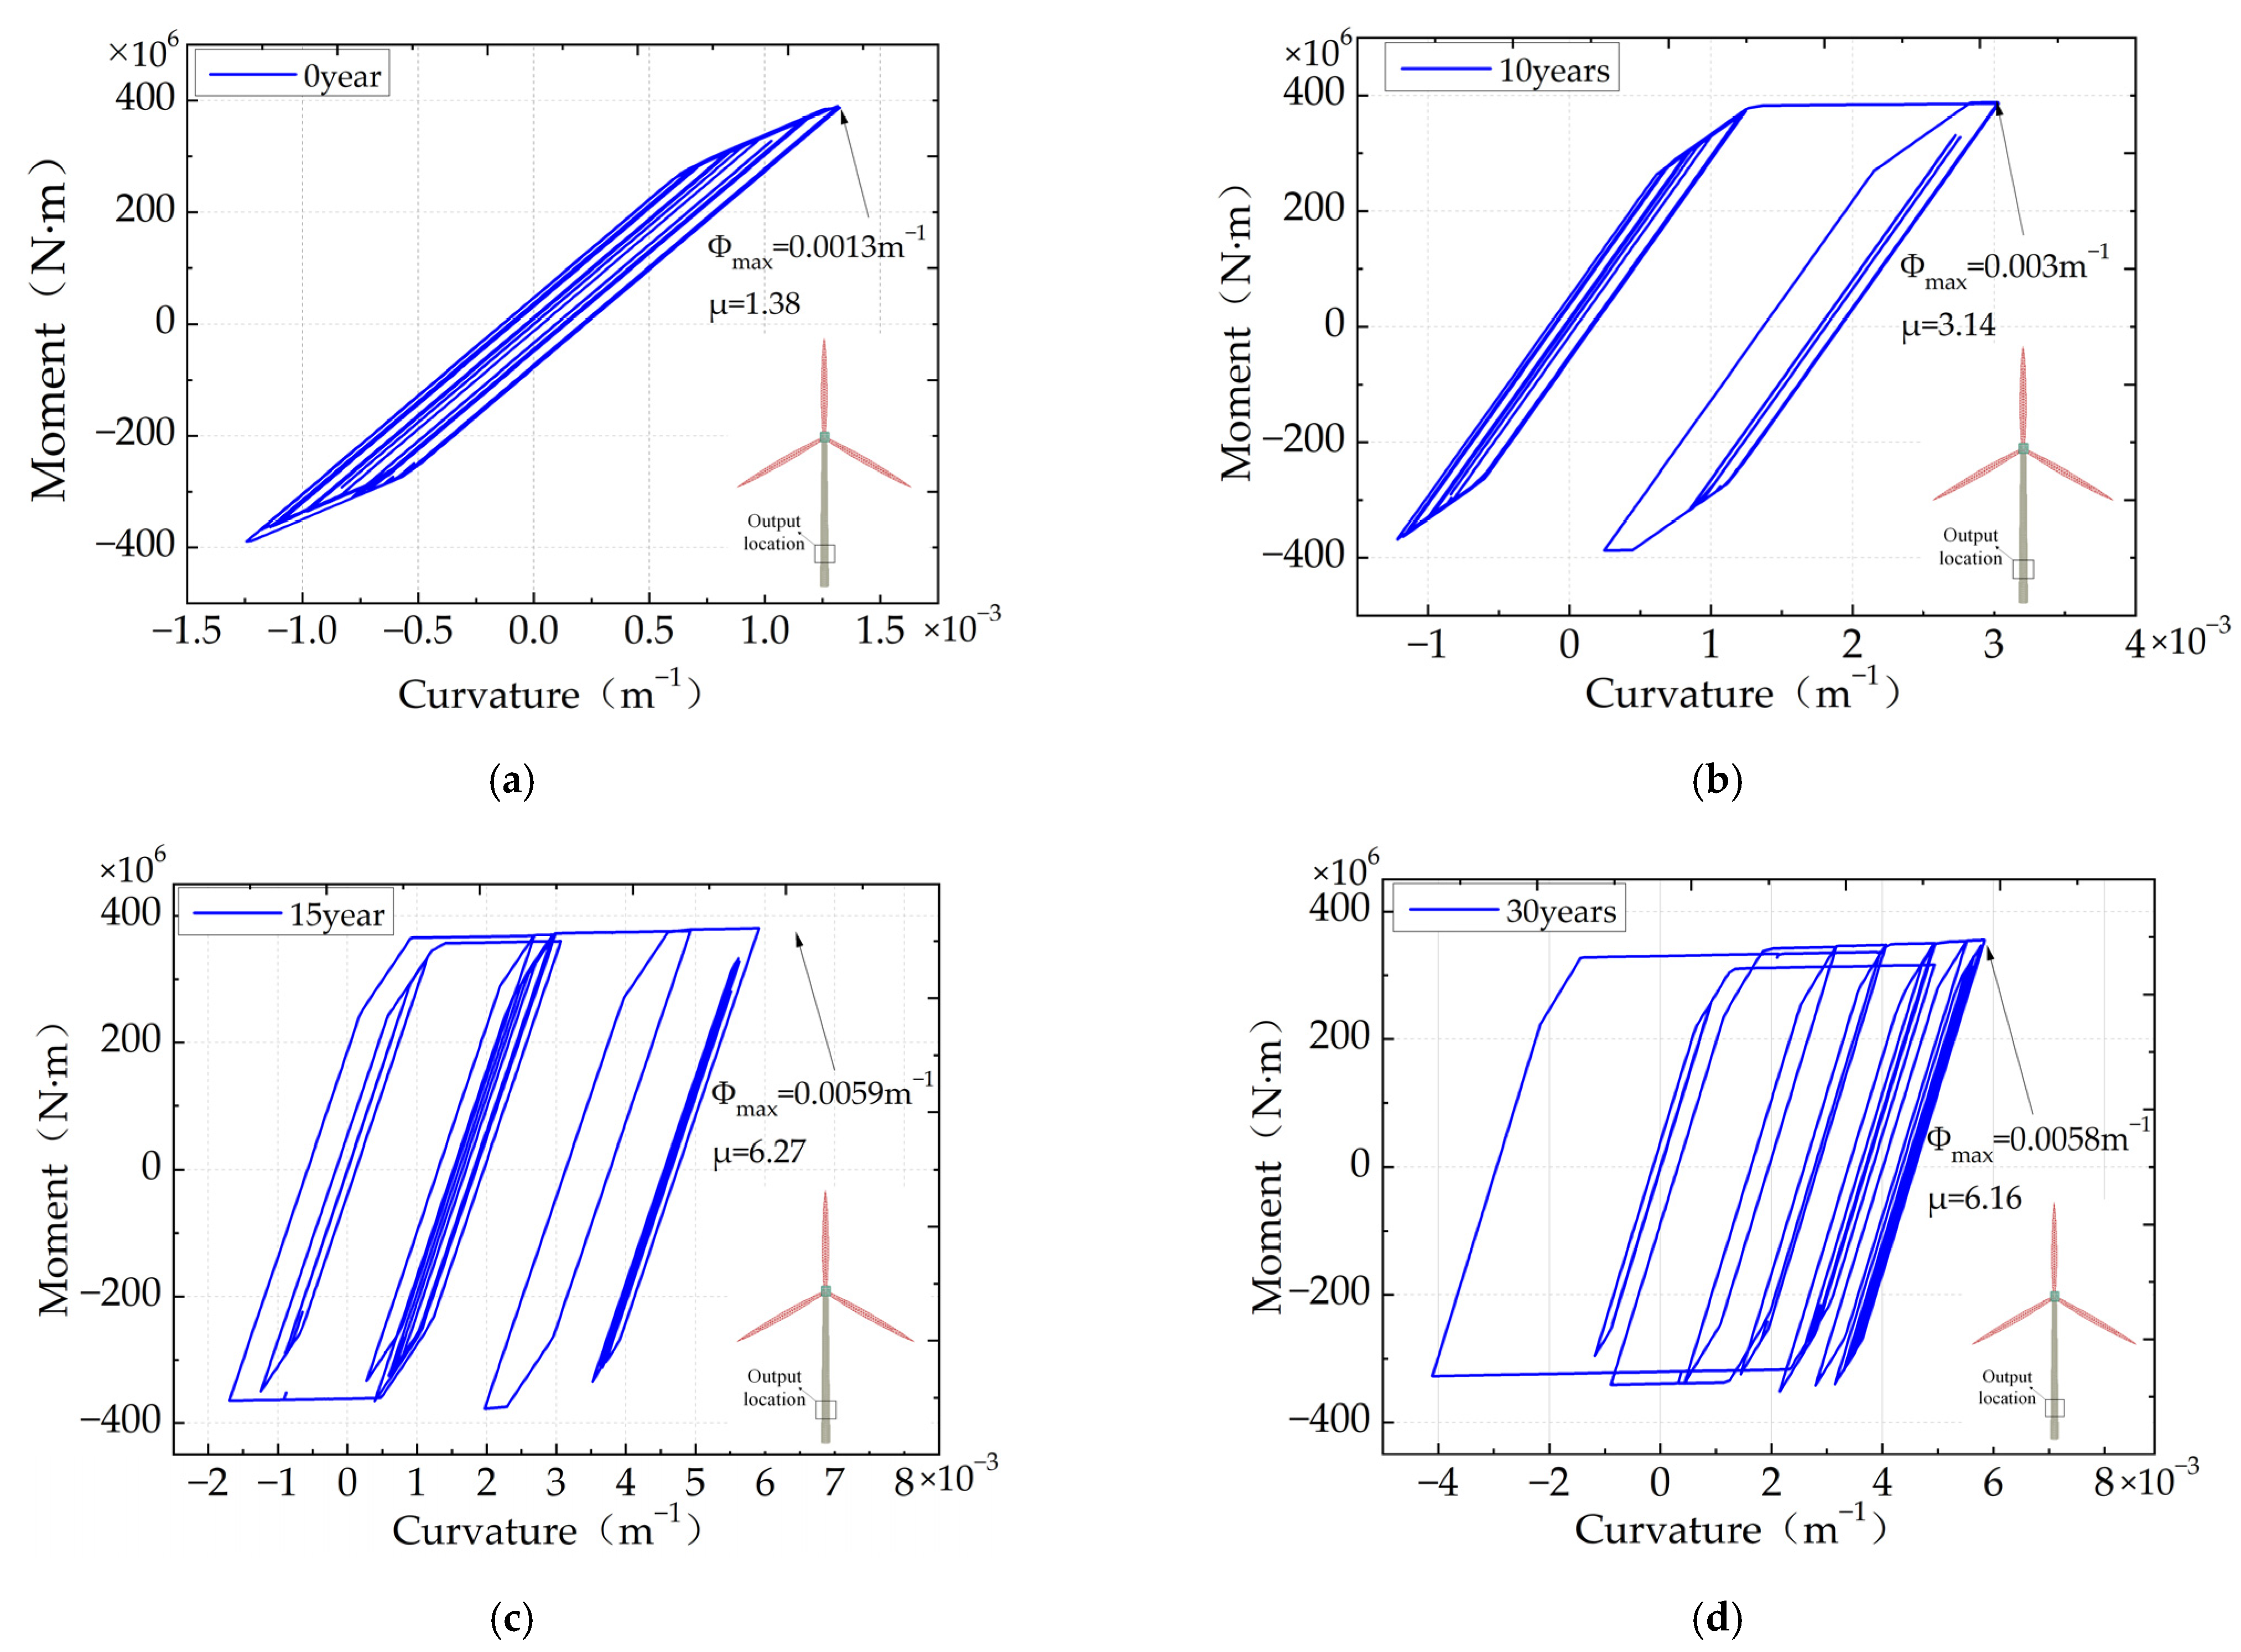
Figure 18.
Moment Curvature hysteretic curve of structure under earthquake action: (a) Without corrosion; (b) 10 years of corrosion; (c) 20 years of corrosion; (d) 30 years of corrosion.
Figure 18.
Moment Curvature hysteretic curve of structure under earthquake action: (a) Without corrosion; (b) 10 years of corrosion; (c) 20 years of corrosion; (d) 30 years of corrosion.
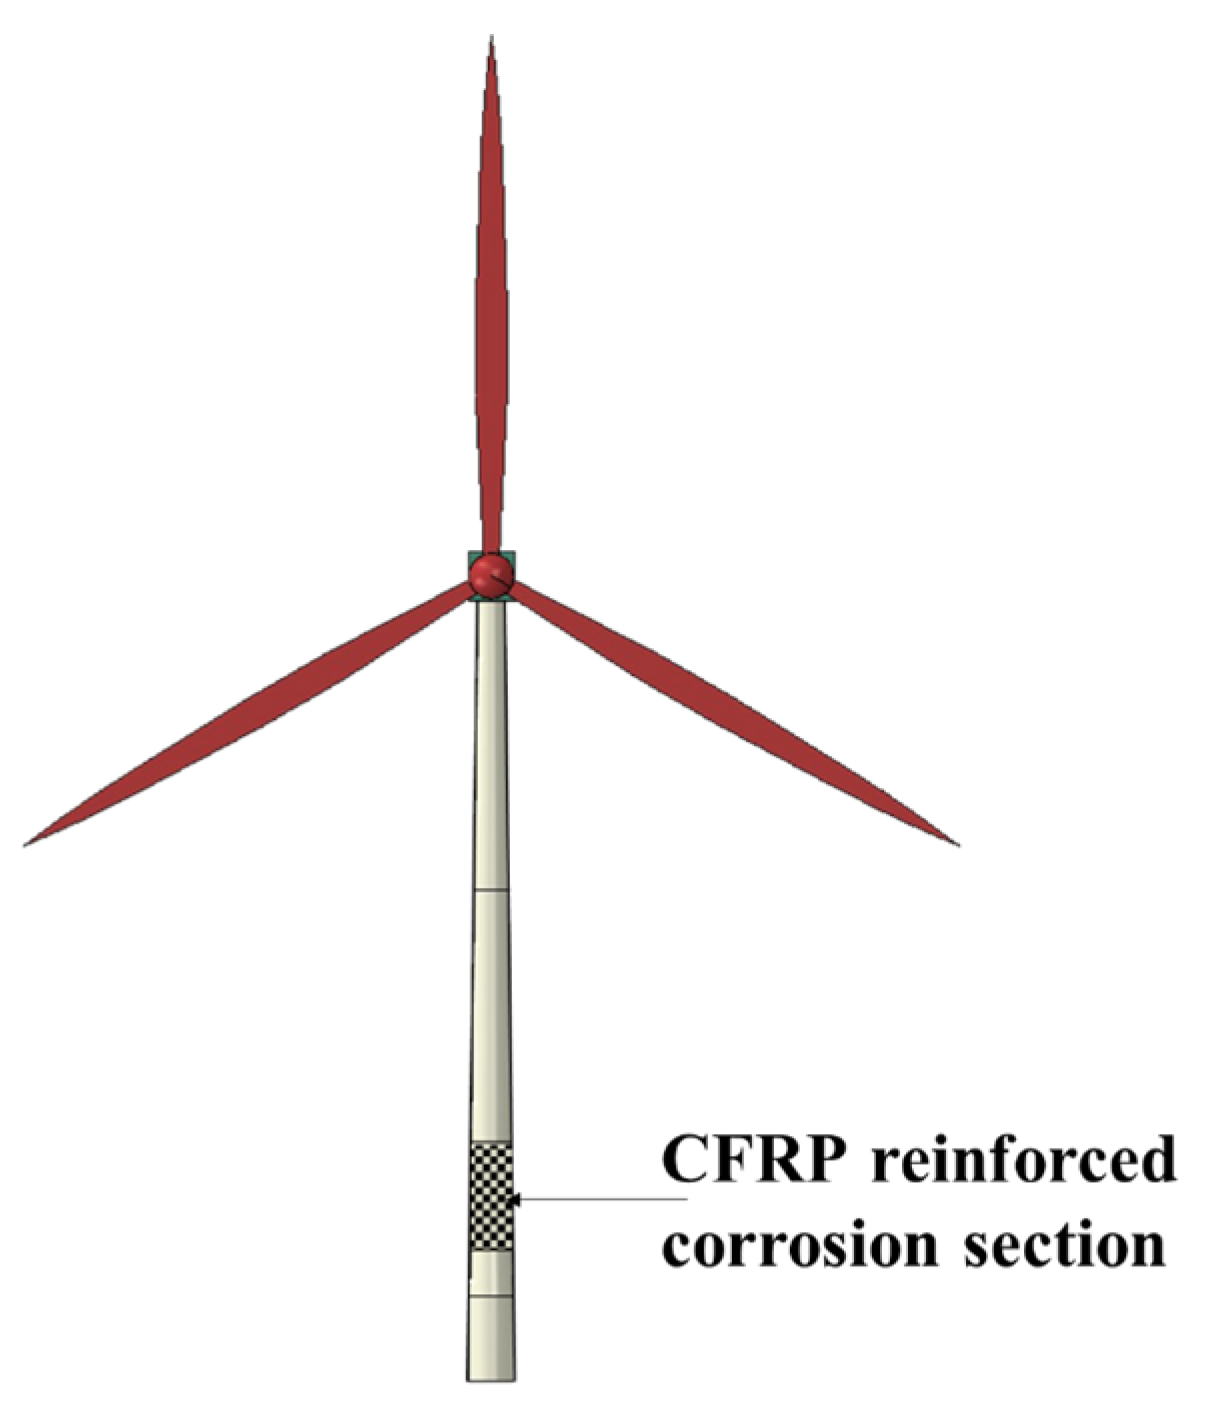
Figure 19.
Wind turbine tower strengthened with CFRP.
Figure 19.
Wind turbine tower strengthened with CFRP.
Figure 20.
Comparison of different reinforcement conditions: (a) two-layer CFRP reinforcement; (b) four-layer CFRP reinforcement; (c) eight-layer CFRP reinforcement; (d) Comparison of structural residual deformation.
Figure 20.
Comparison of different reinforcement conditions: (a) two-layer CFRP reinforcement; (b) four-layer CFRP reinforcement; (c) eight-layer CFRP reinforcement; (d) Comparison of structural residual deformation.
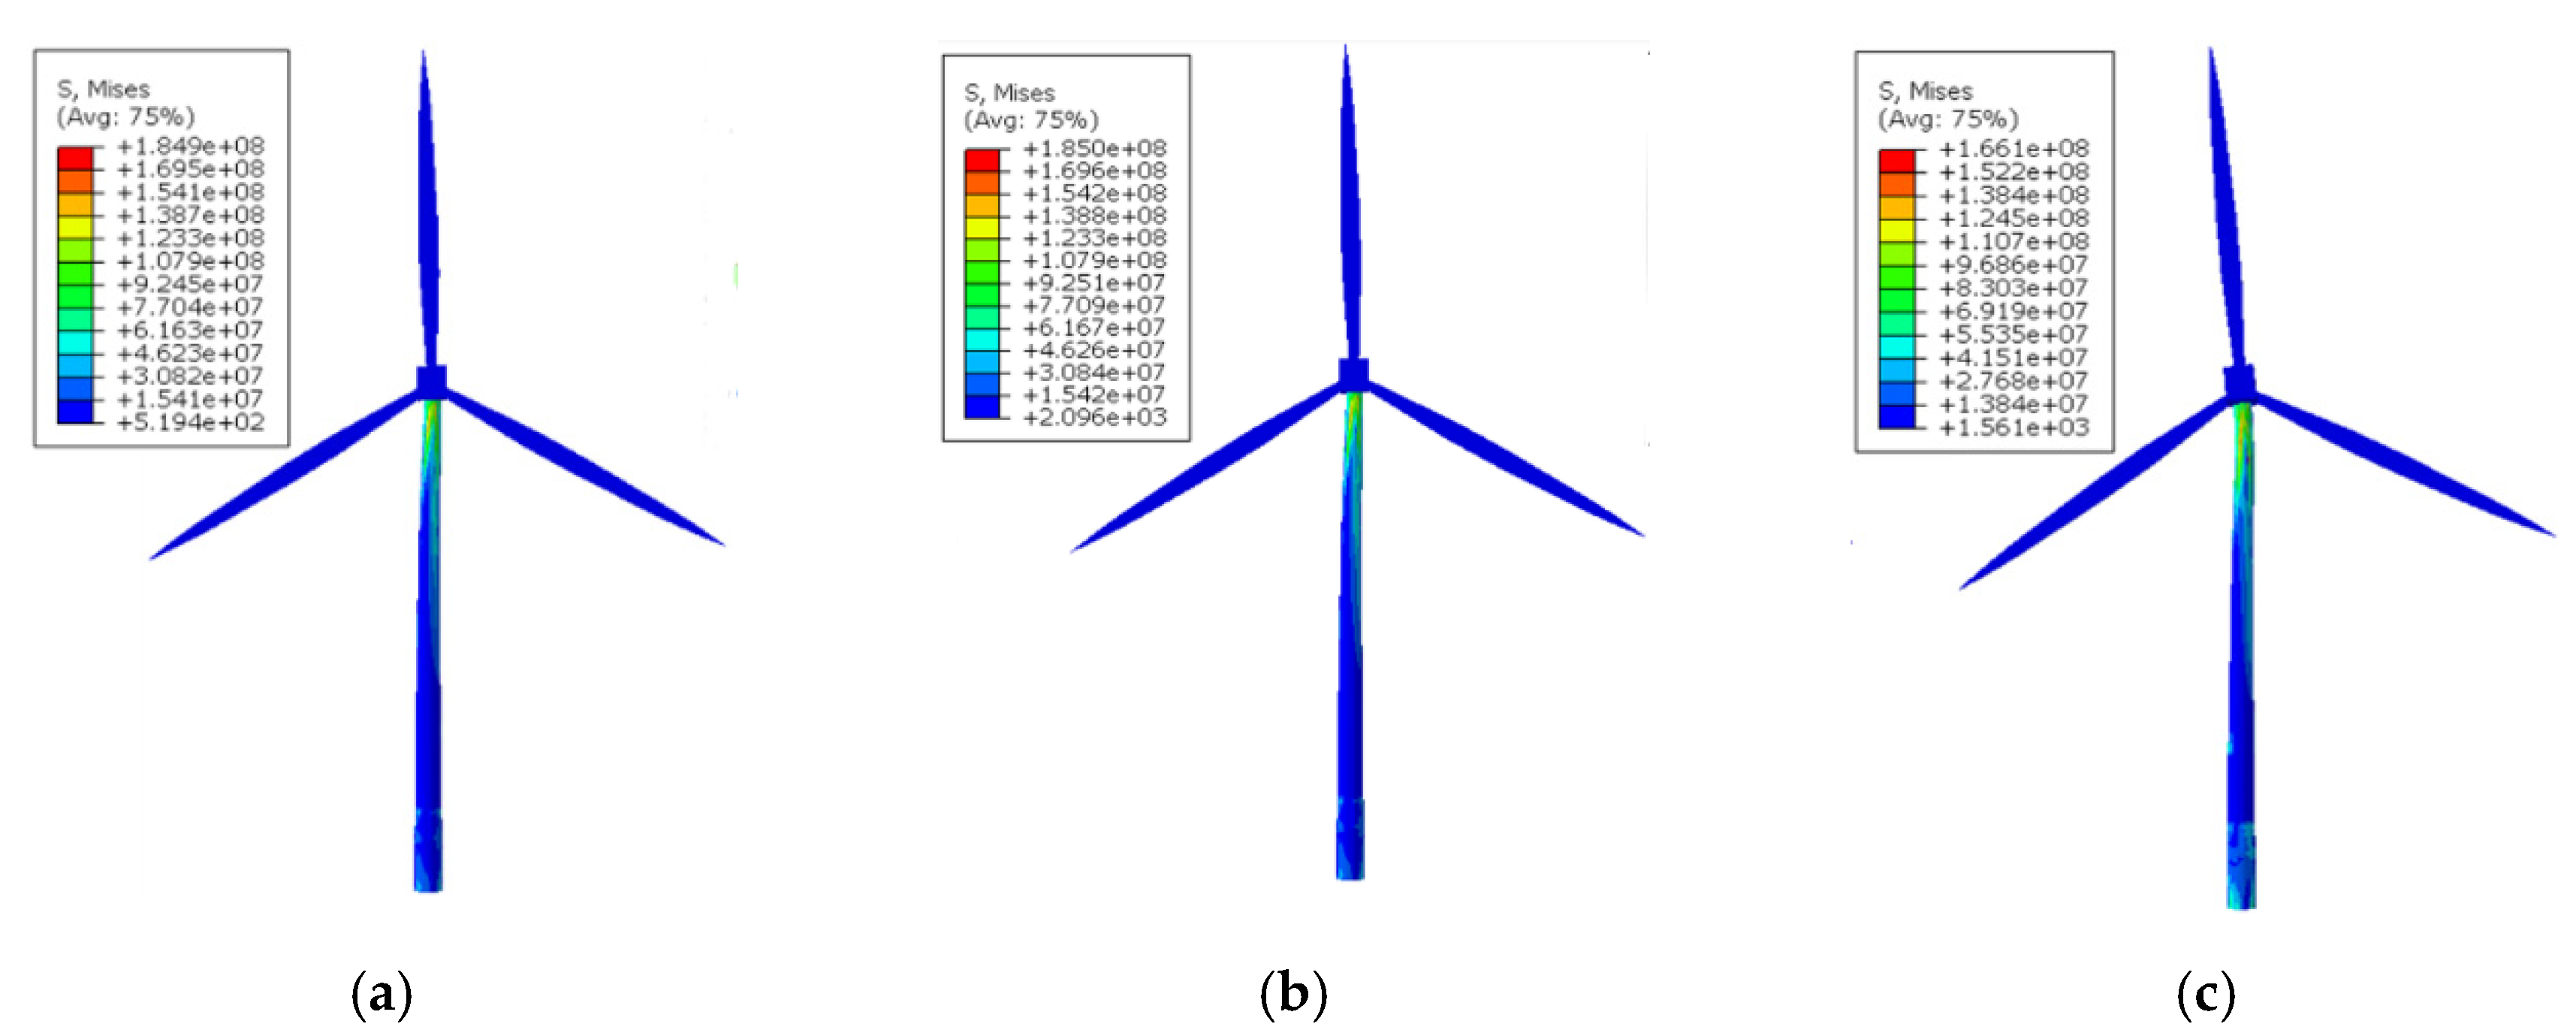
Figure 21.
Structural stress cloud diagram: (a) two layer CFRP; (b) four layer CFRP; (c) eight layer CFRP.
Figure 21.
Structural stress cloud diagram: (a) two layer CFRP; (b) four layer CFRP; (c) eight layer CFRP.
Figure 22.
Selection of shaking table test model.
Figure 22.
Selection of shaking table test model.
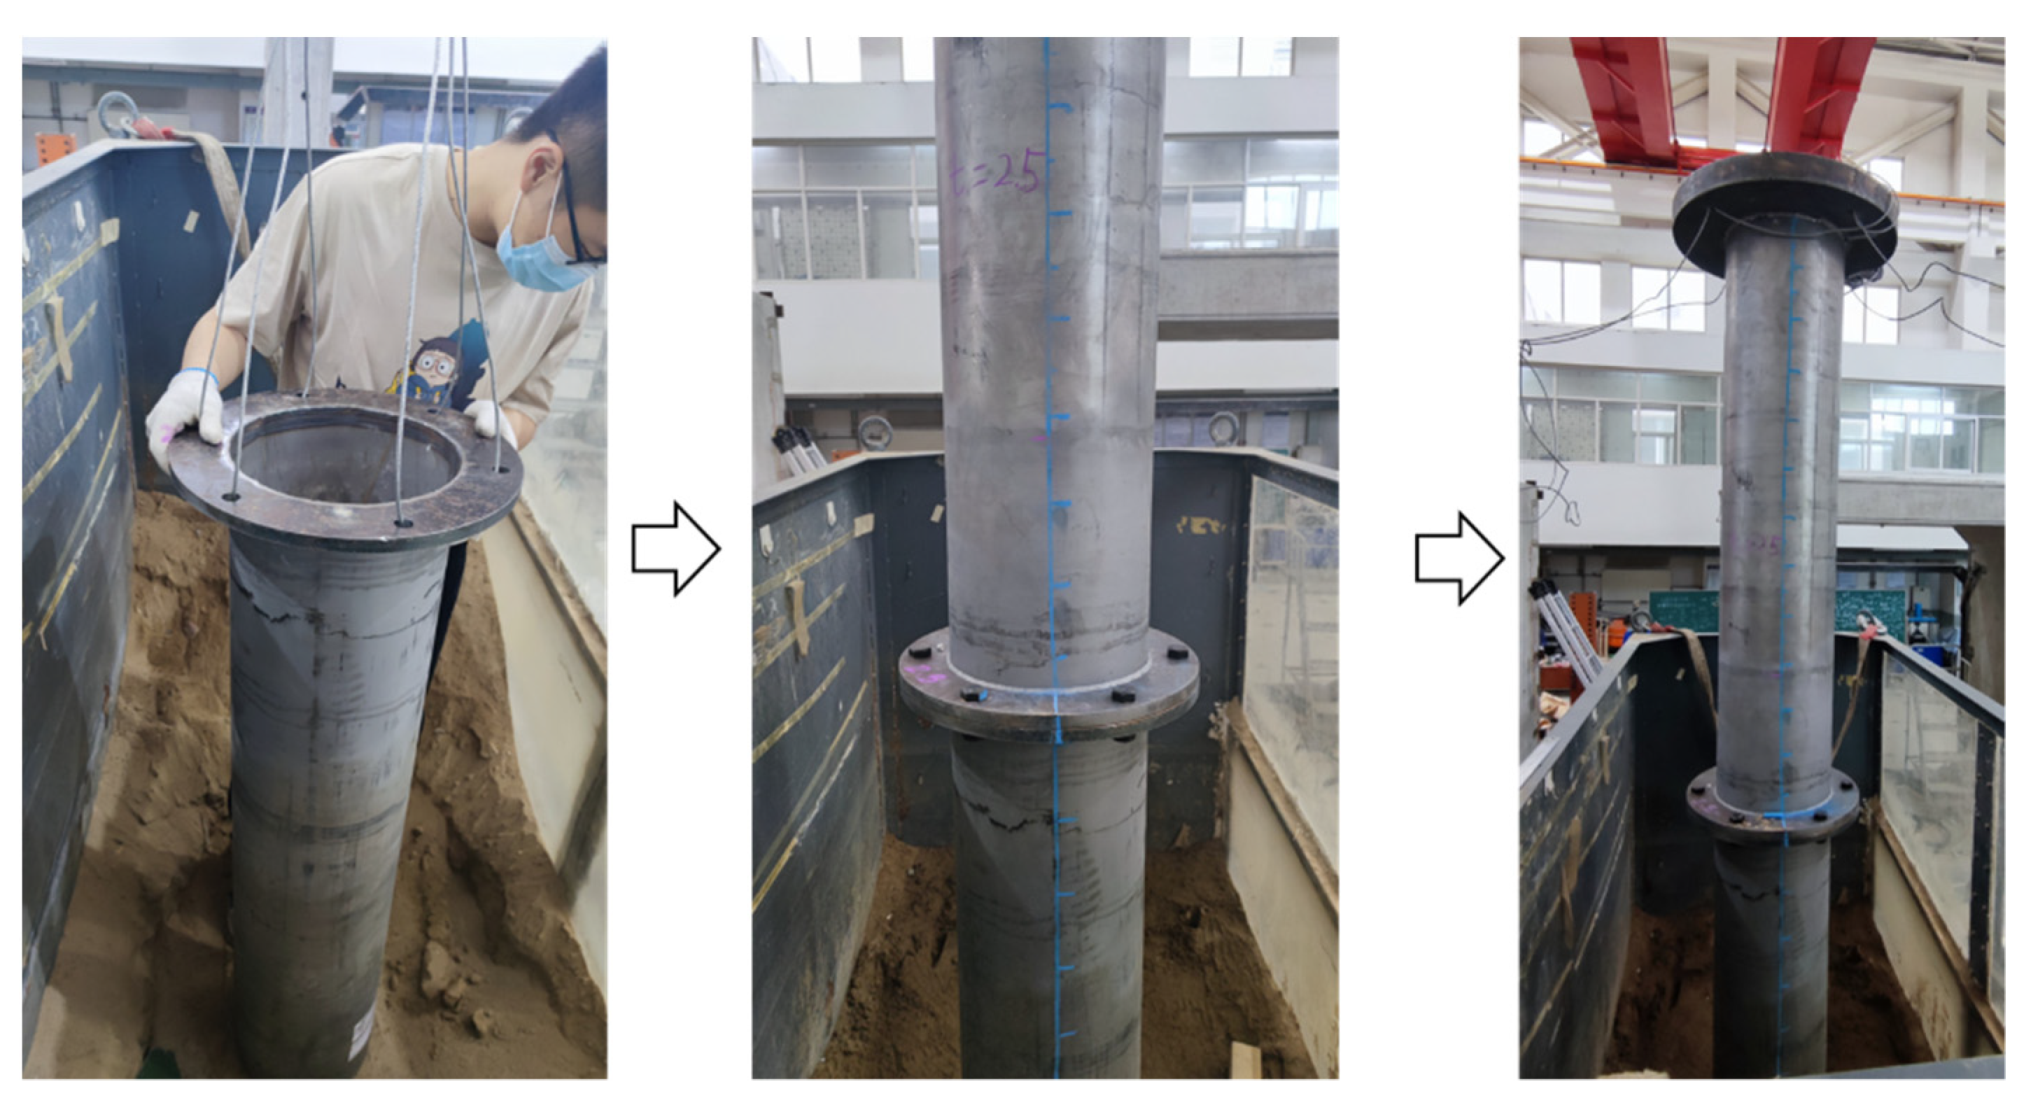
Figure 23.
Installation of experimental model.
Figure 23.
Installation of experimental model.
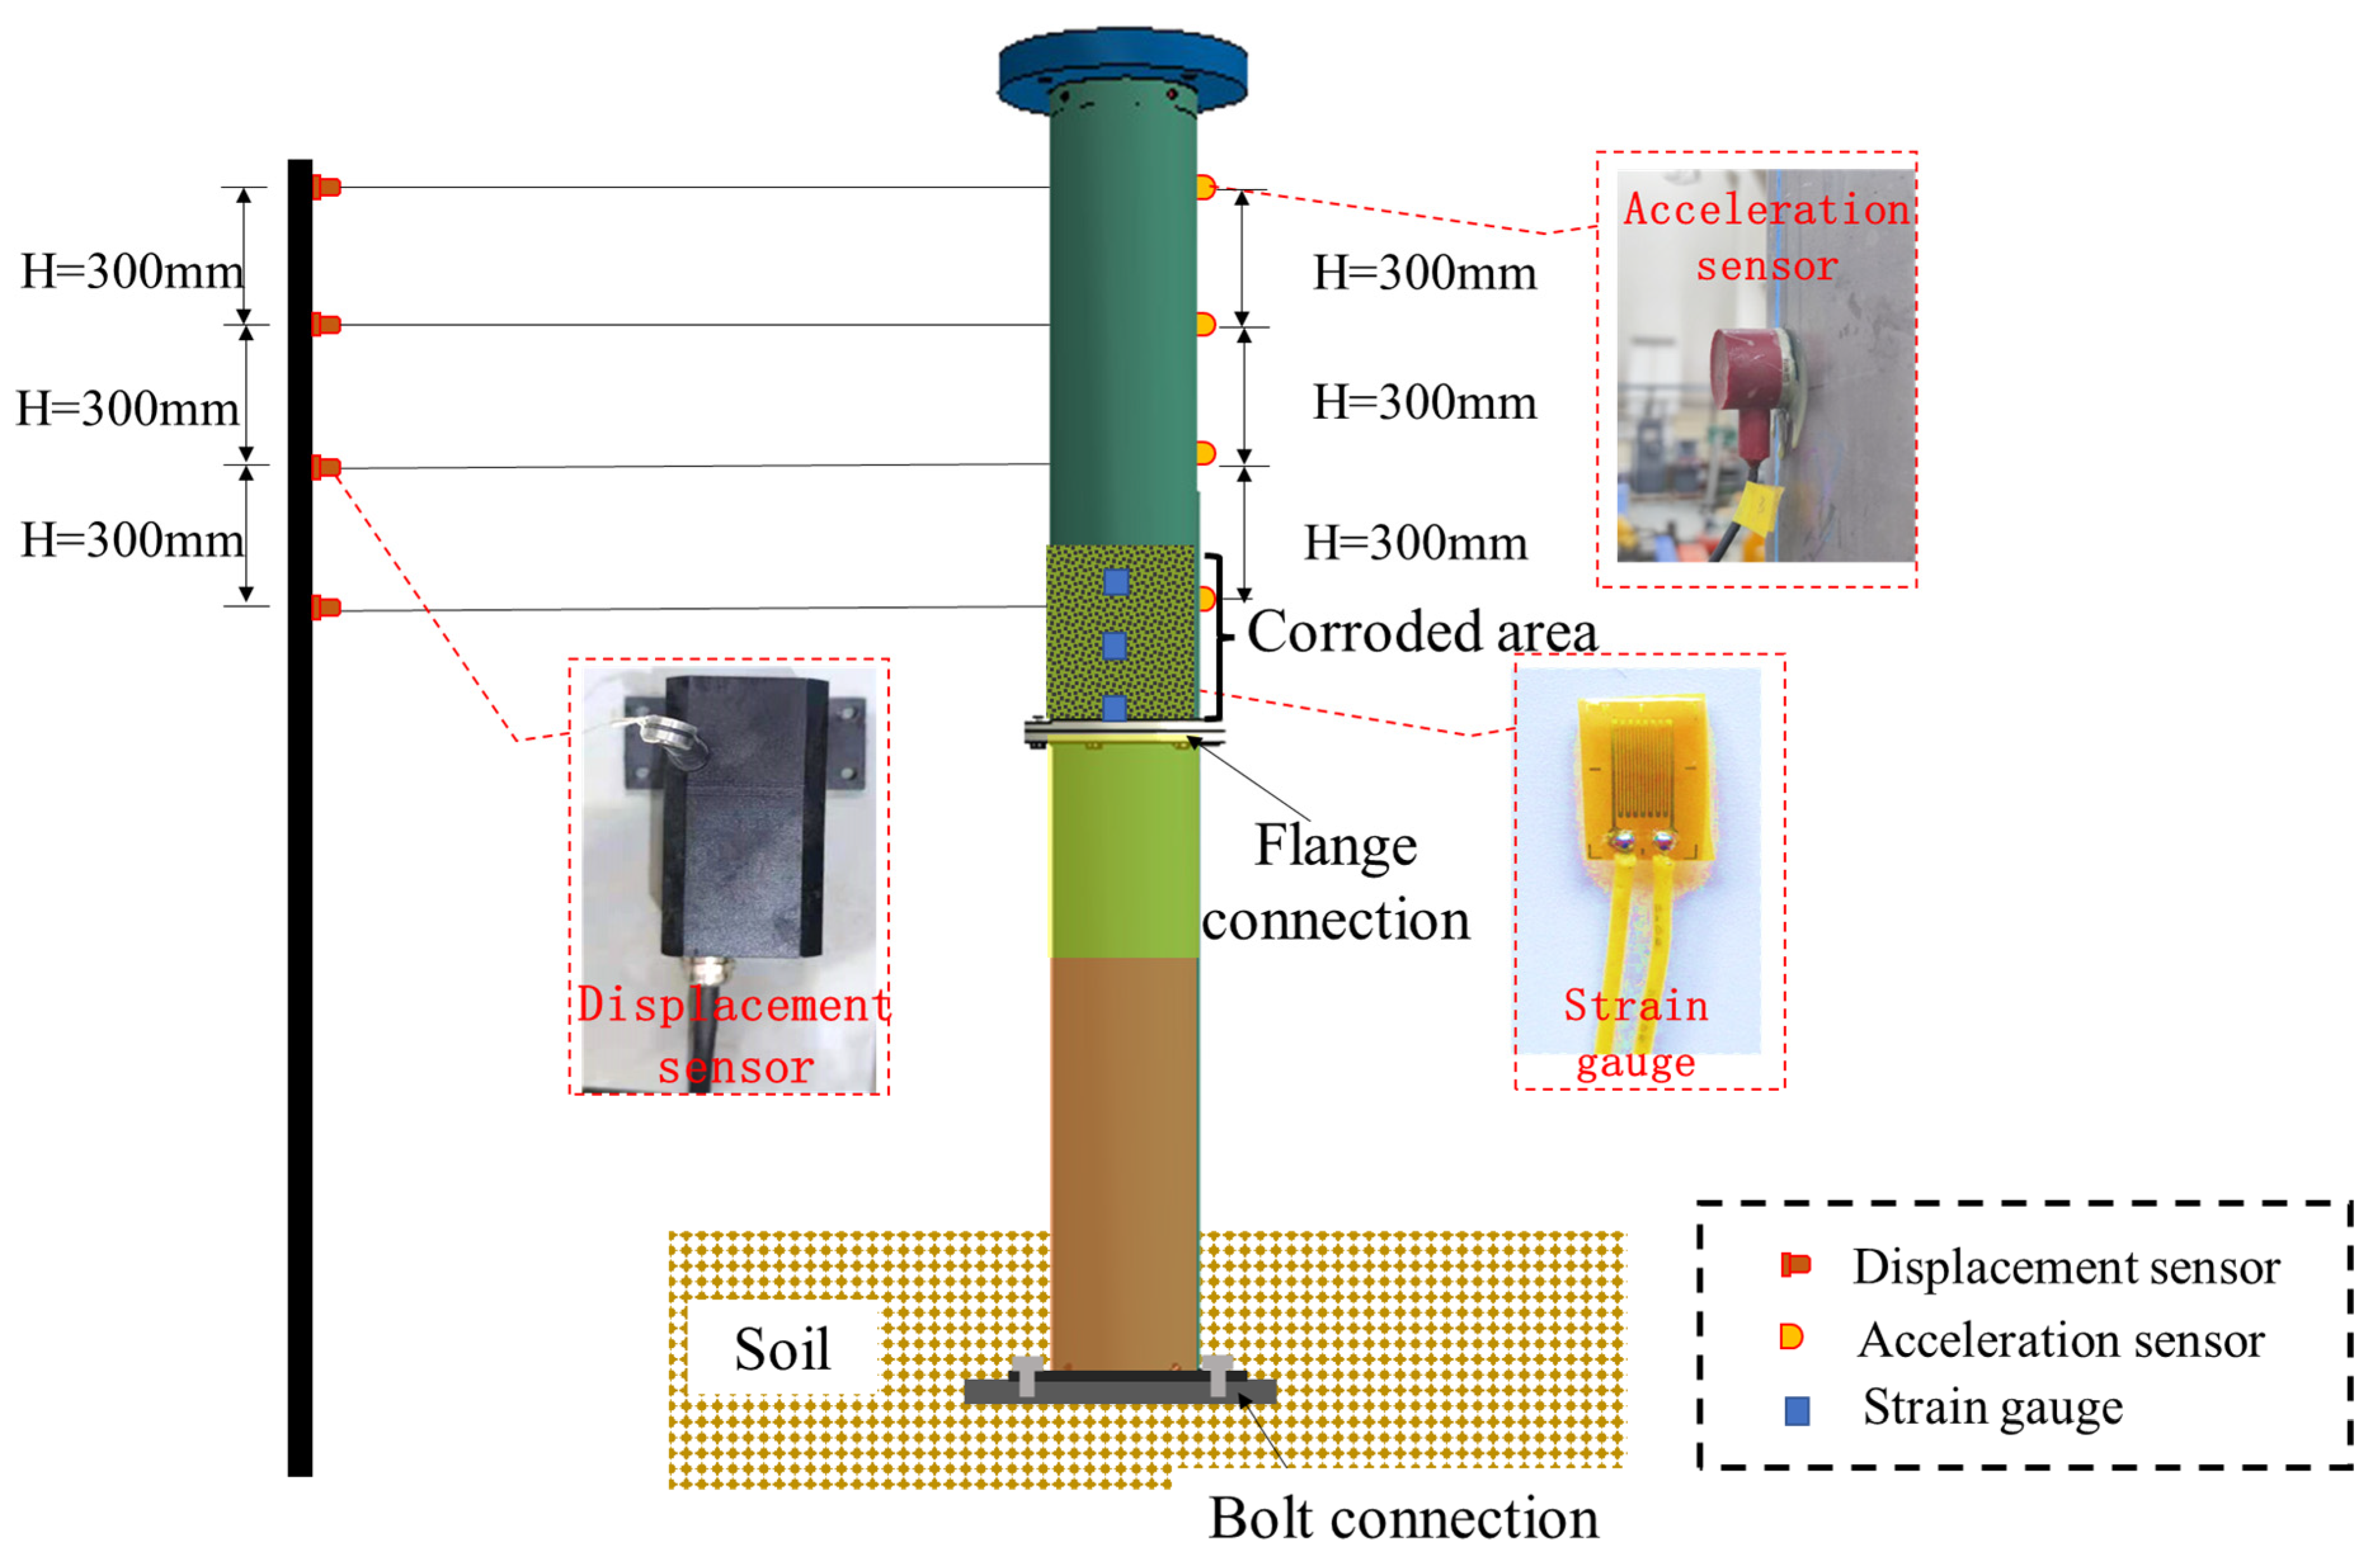
Figure 24.
Sensor placement.
Figure 24.
Sensor placement.
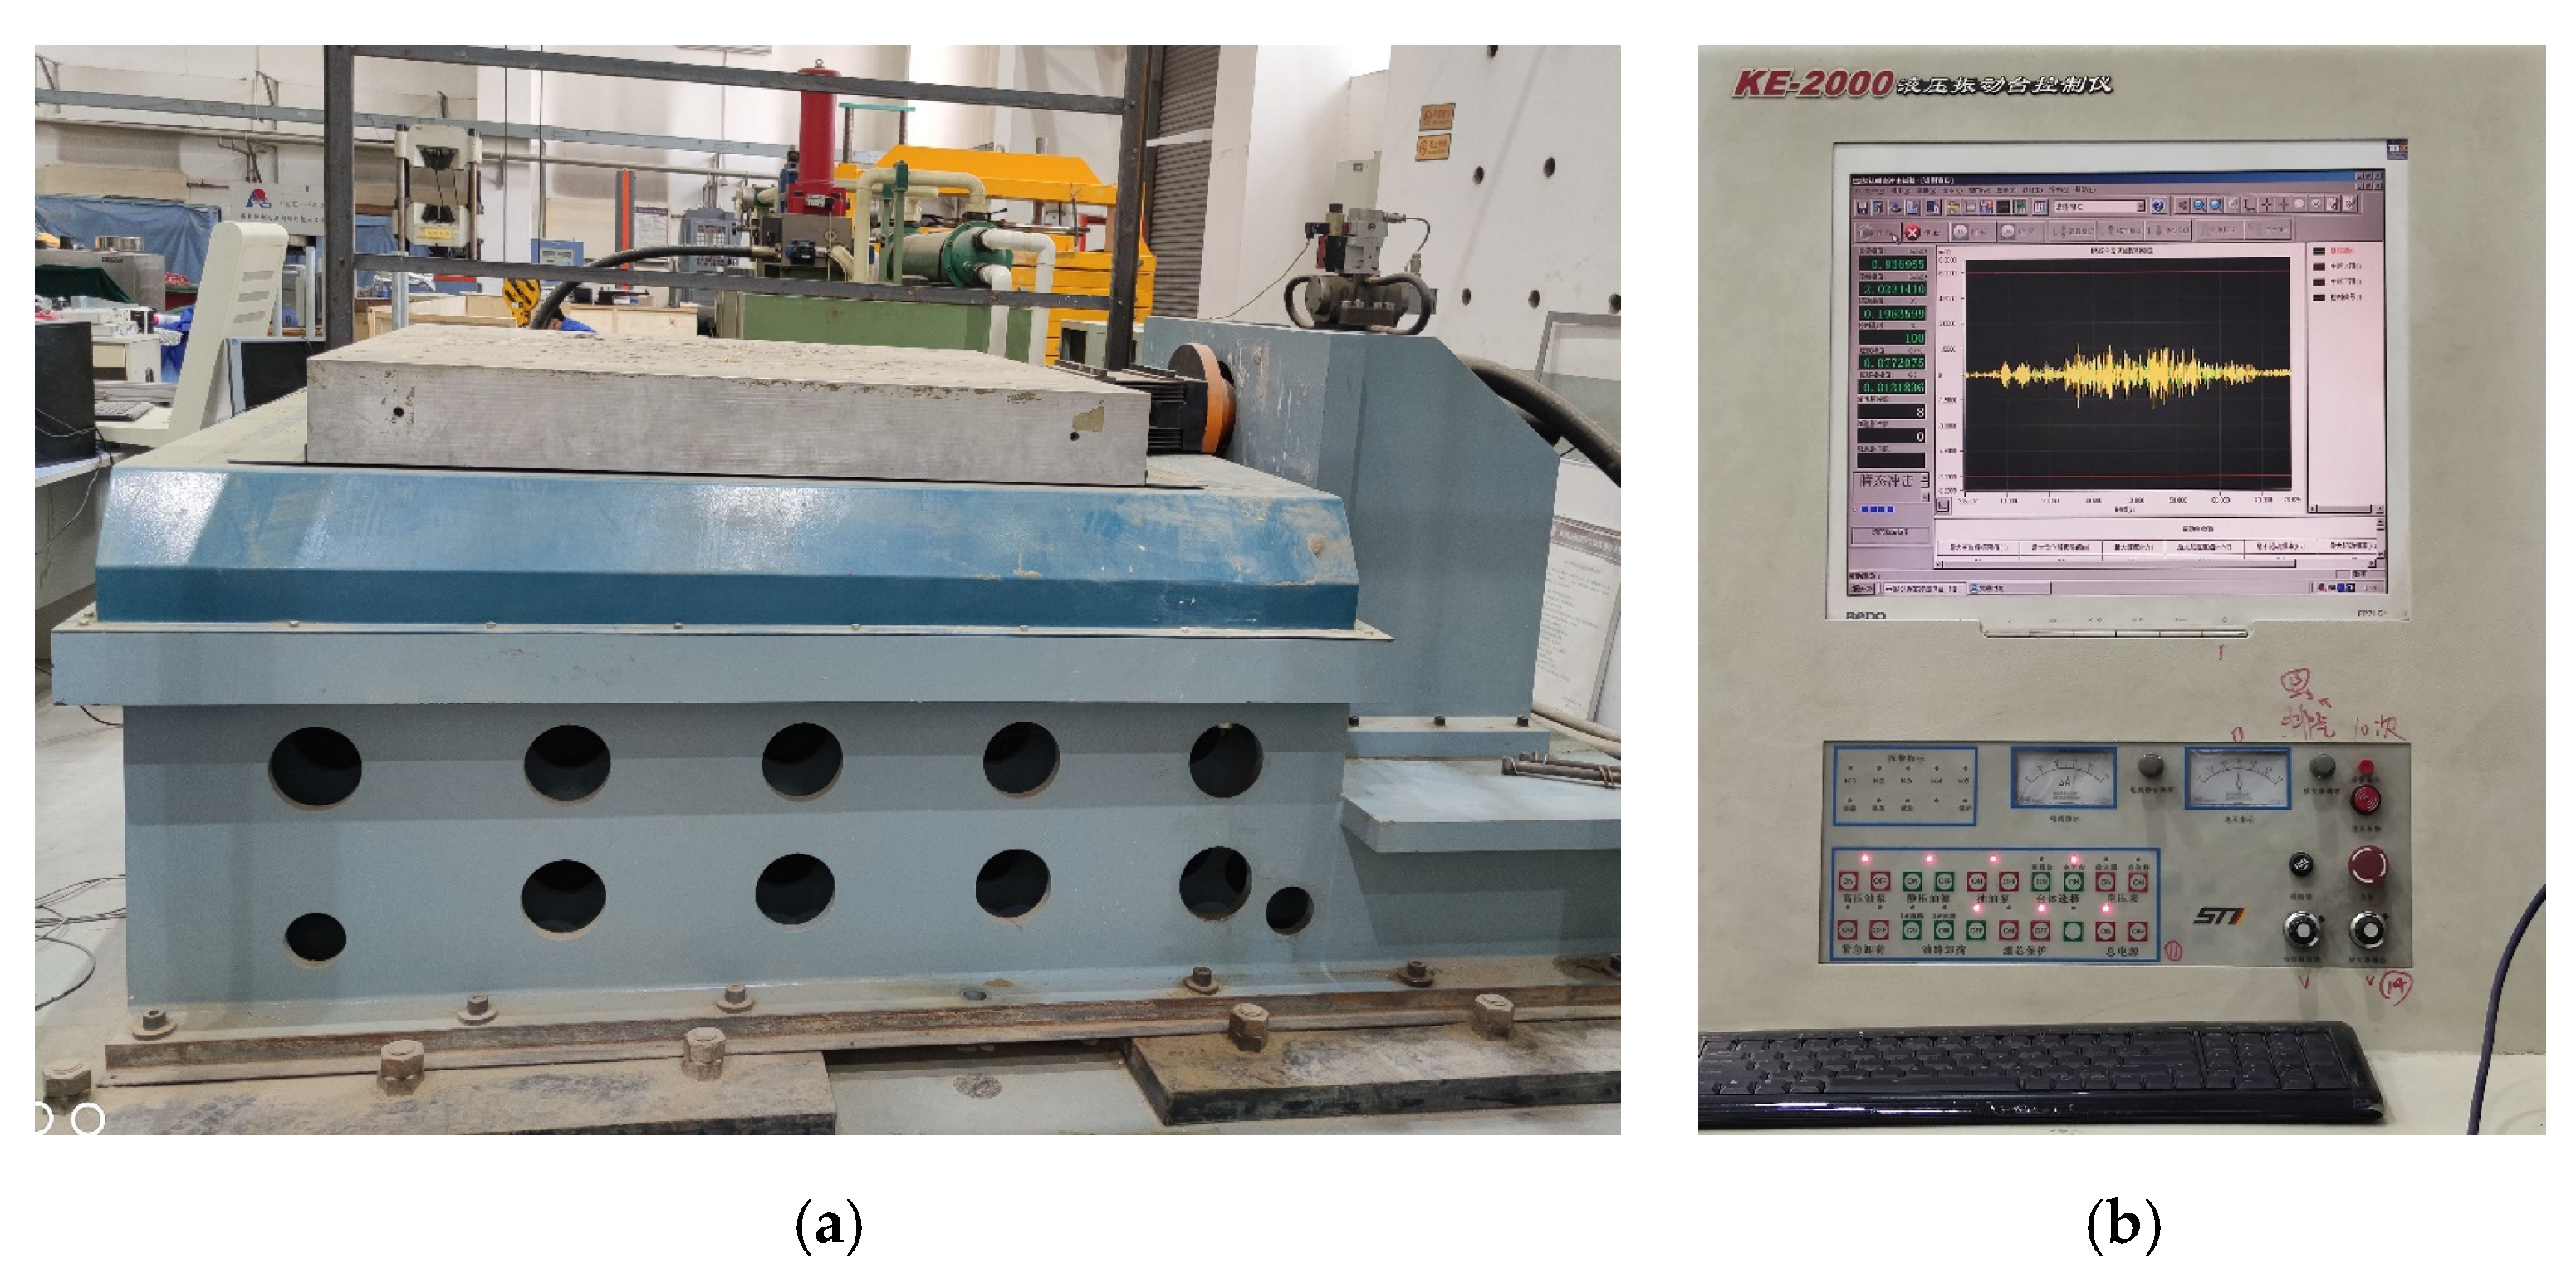
Figure 25.
Hydraulic vibration table control equipment: (a) Hydraulic vibration table; (b) Control equipment.
Figure 25.
Hydraulic vibration table control equipment: (a) Hydraulic vibration table; (b) Control equipment.
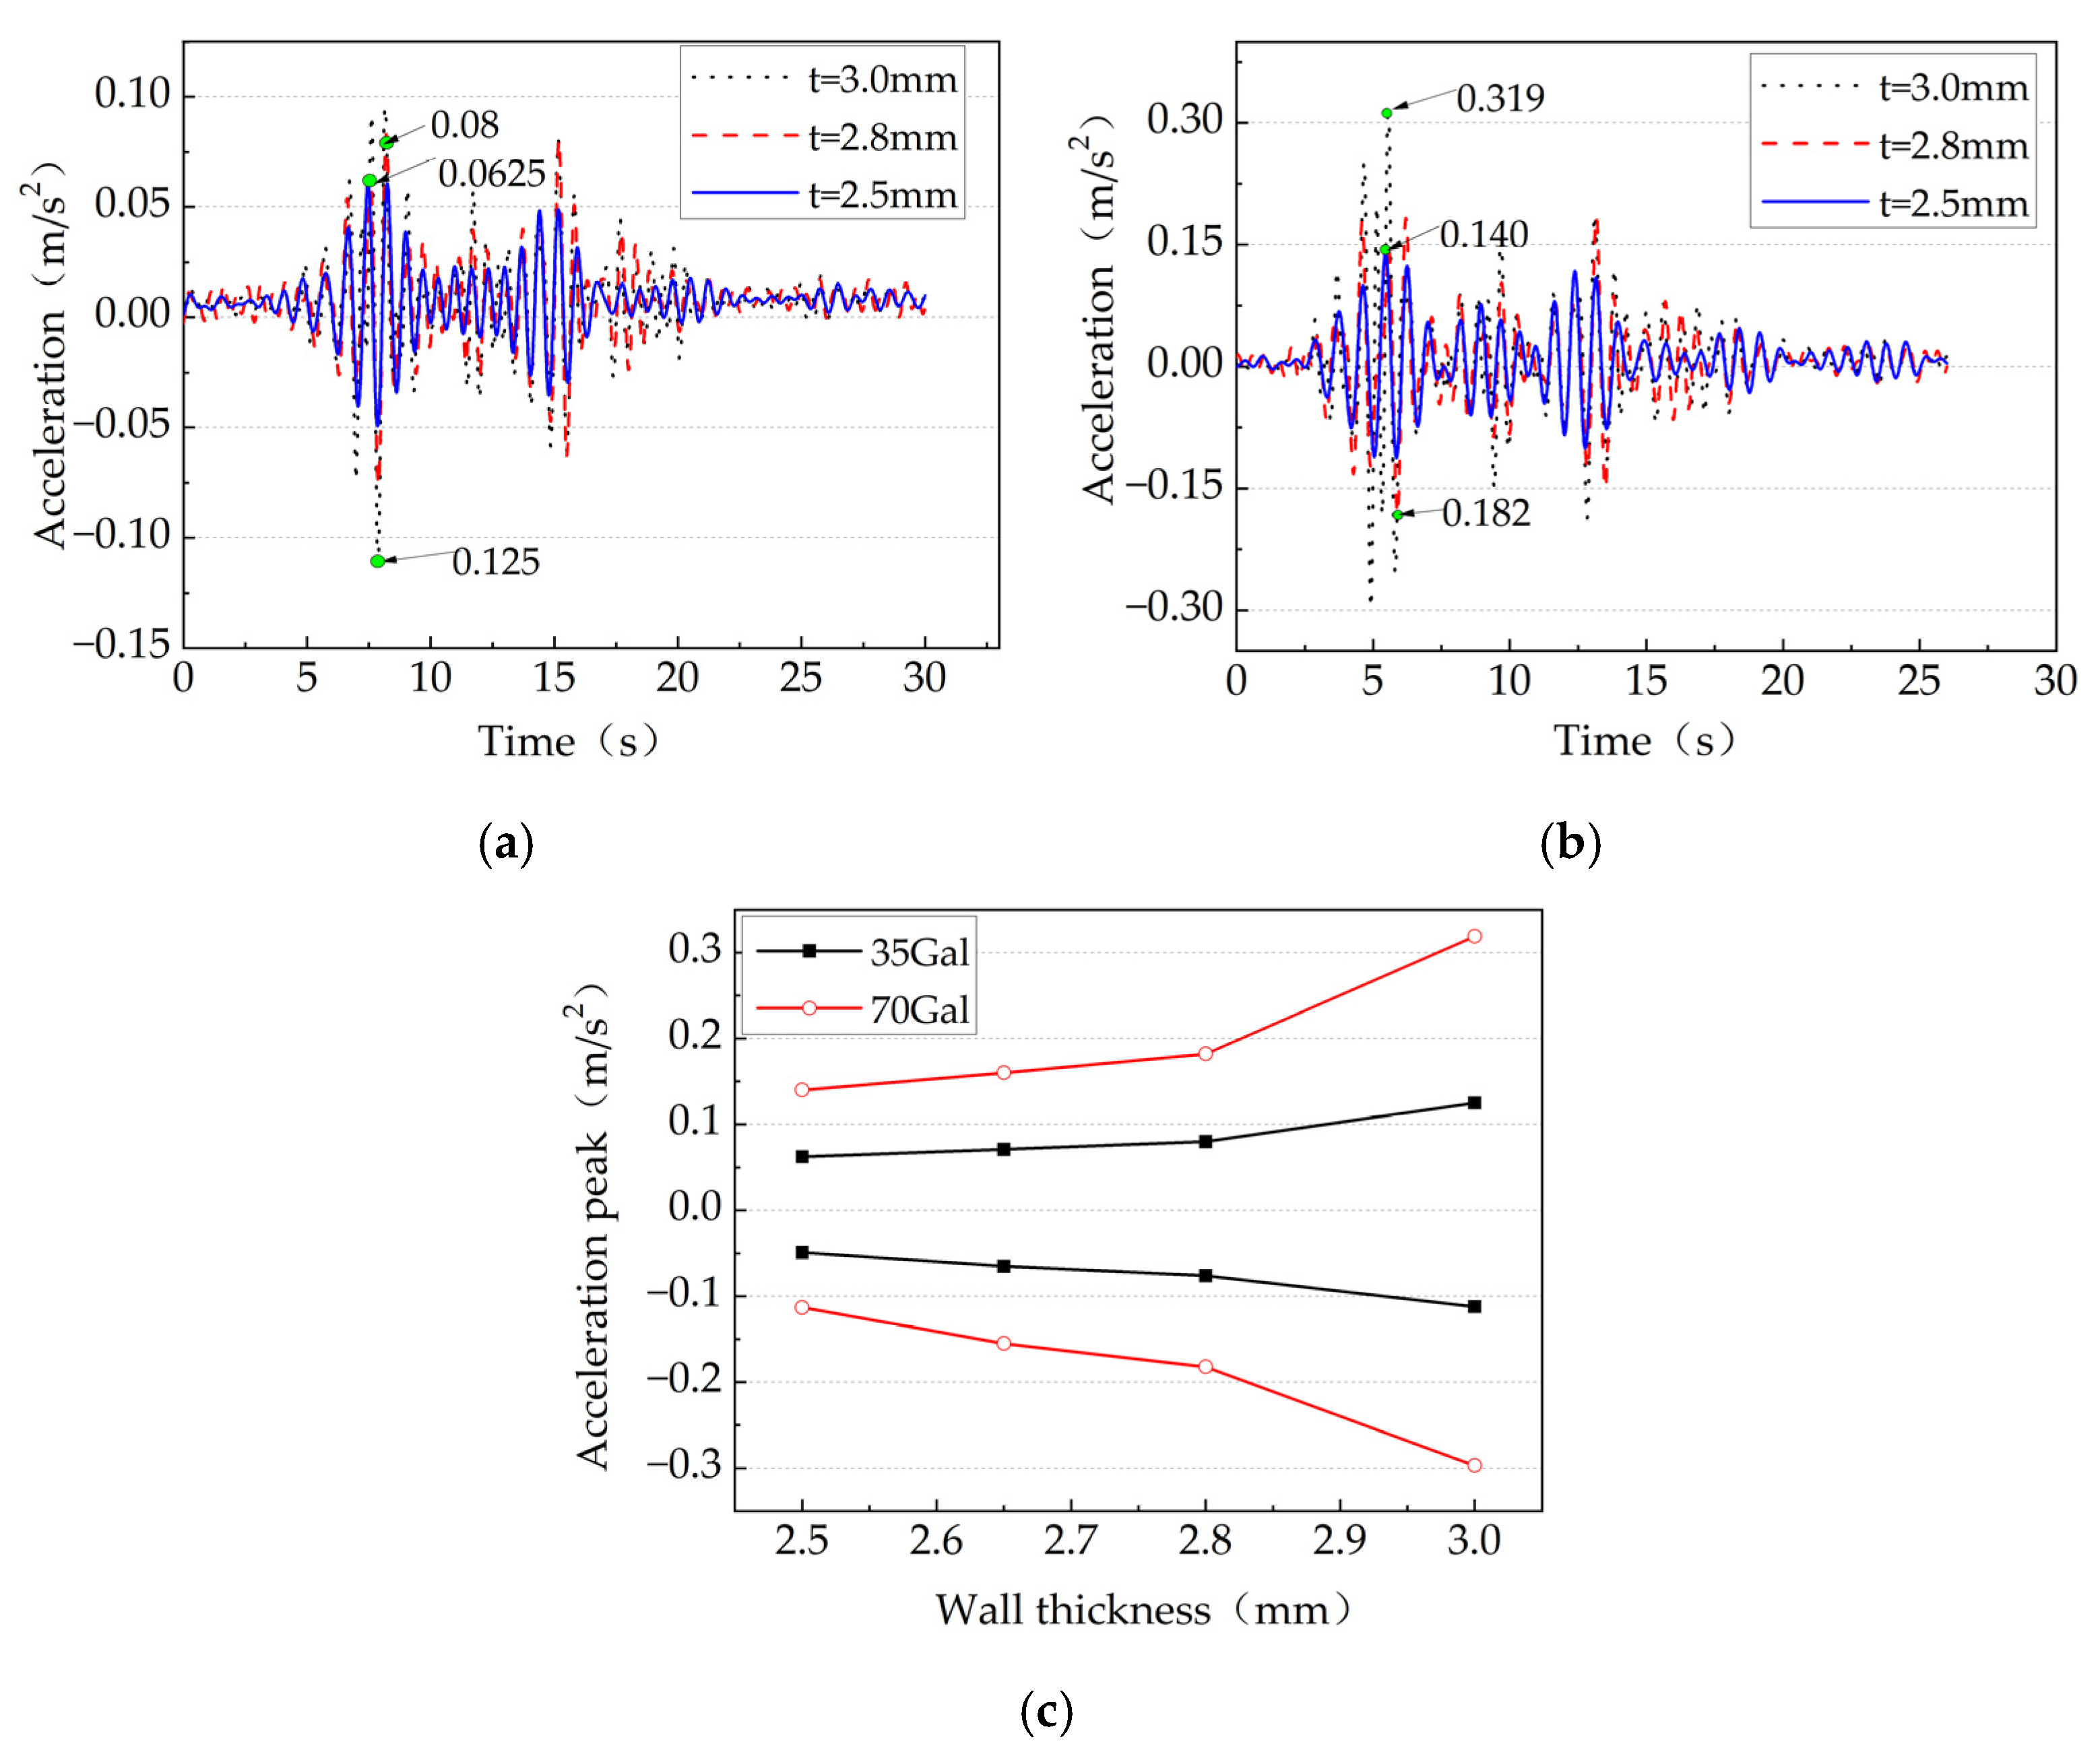
Figure 26.
Comparison of structural accelerations under El Centro earthquake: (a) El Centro 35 Gal; (b) El Centro 70 Gal; (c) Comparison of acceleration peak.
Figure 26.
Comparison of structural accelerations under El Centro earthquake: (a) El Centro 35 Gal; (b) El Centro 70 Gal; (c) Comparison of acceleration peak.
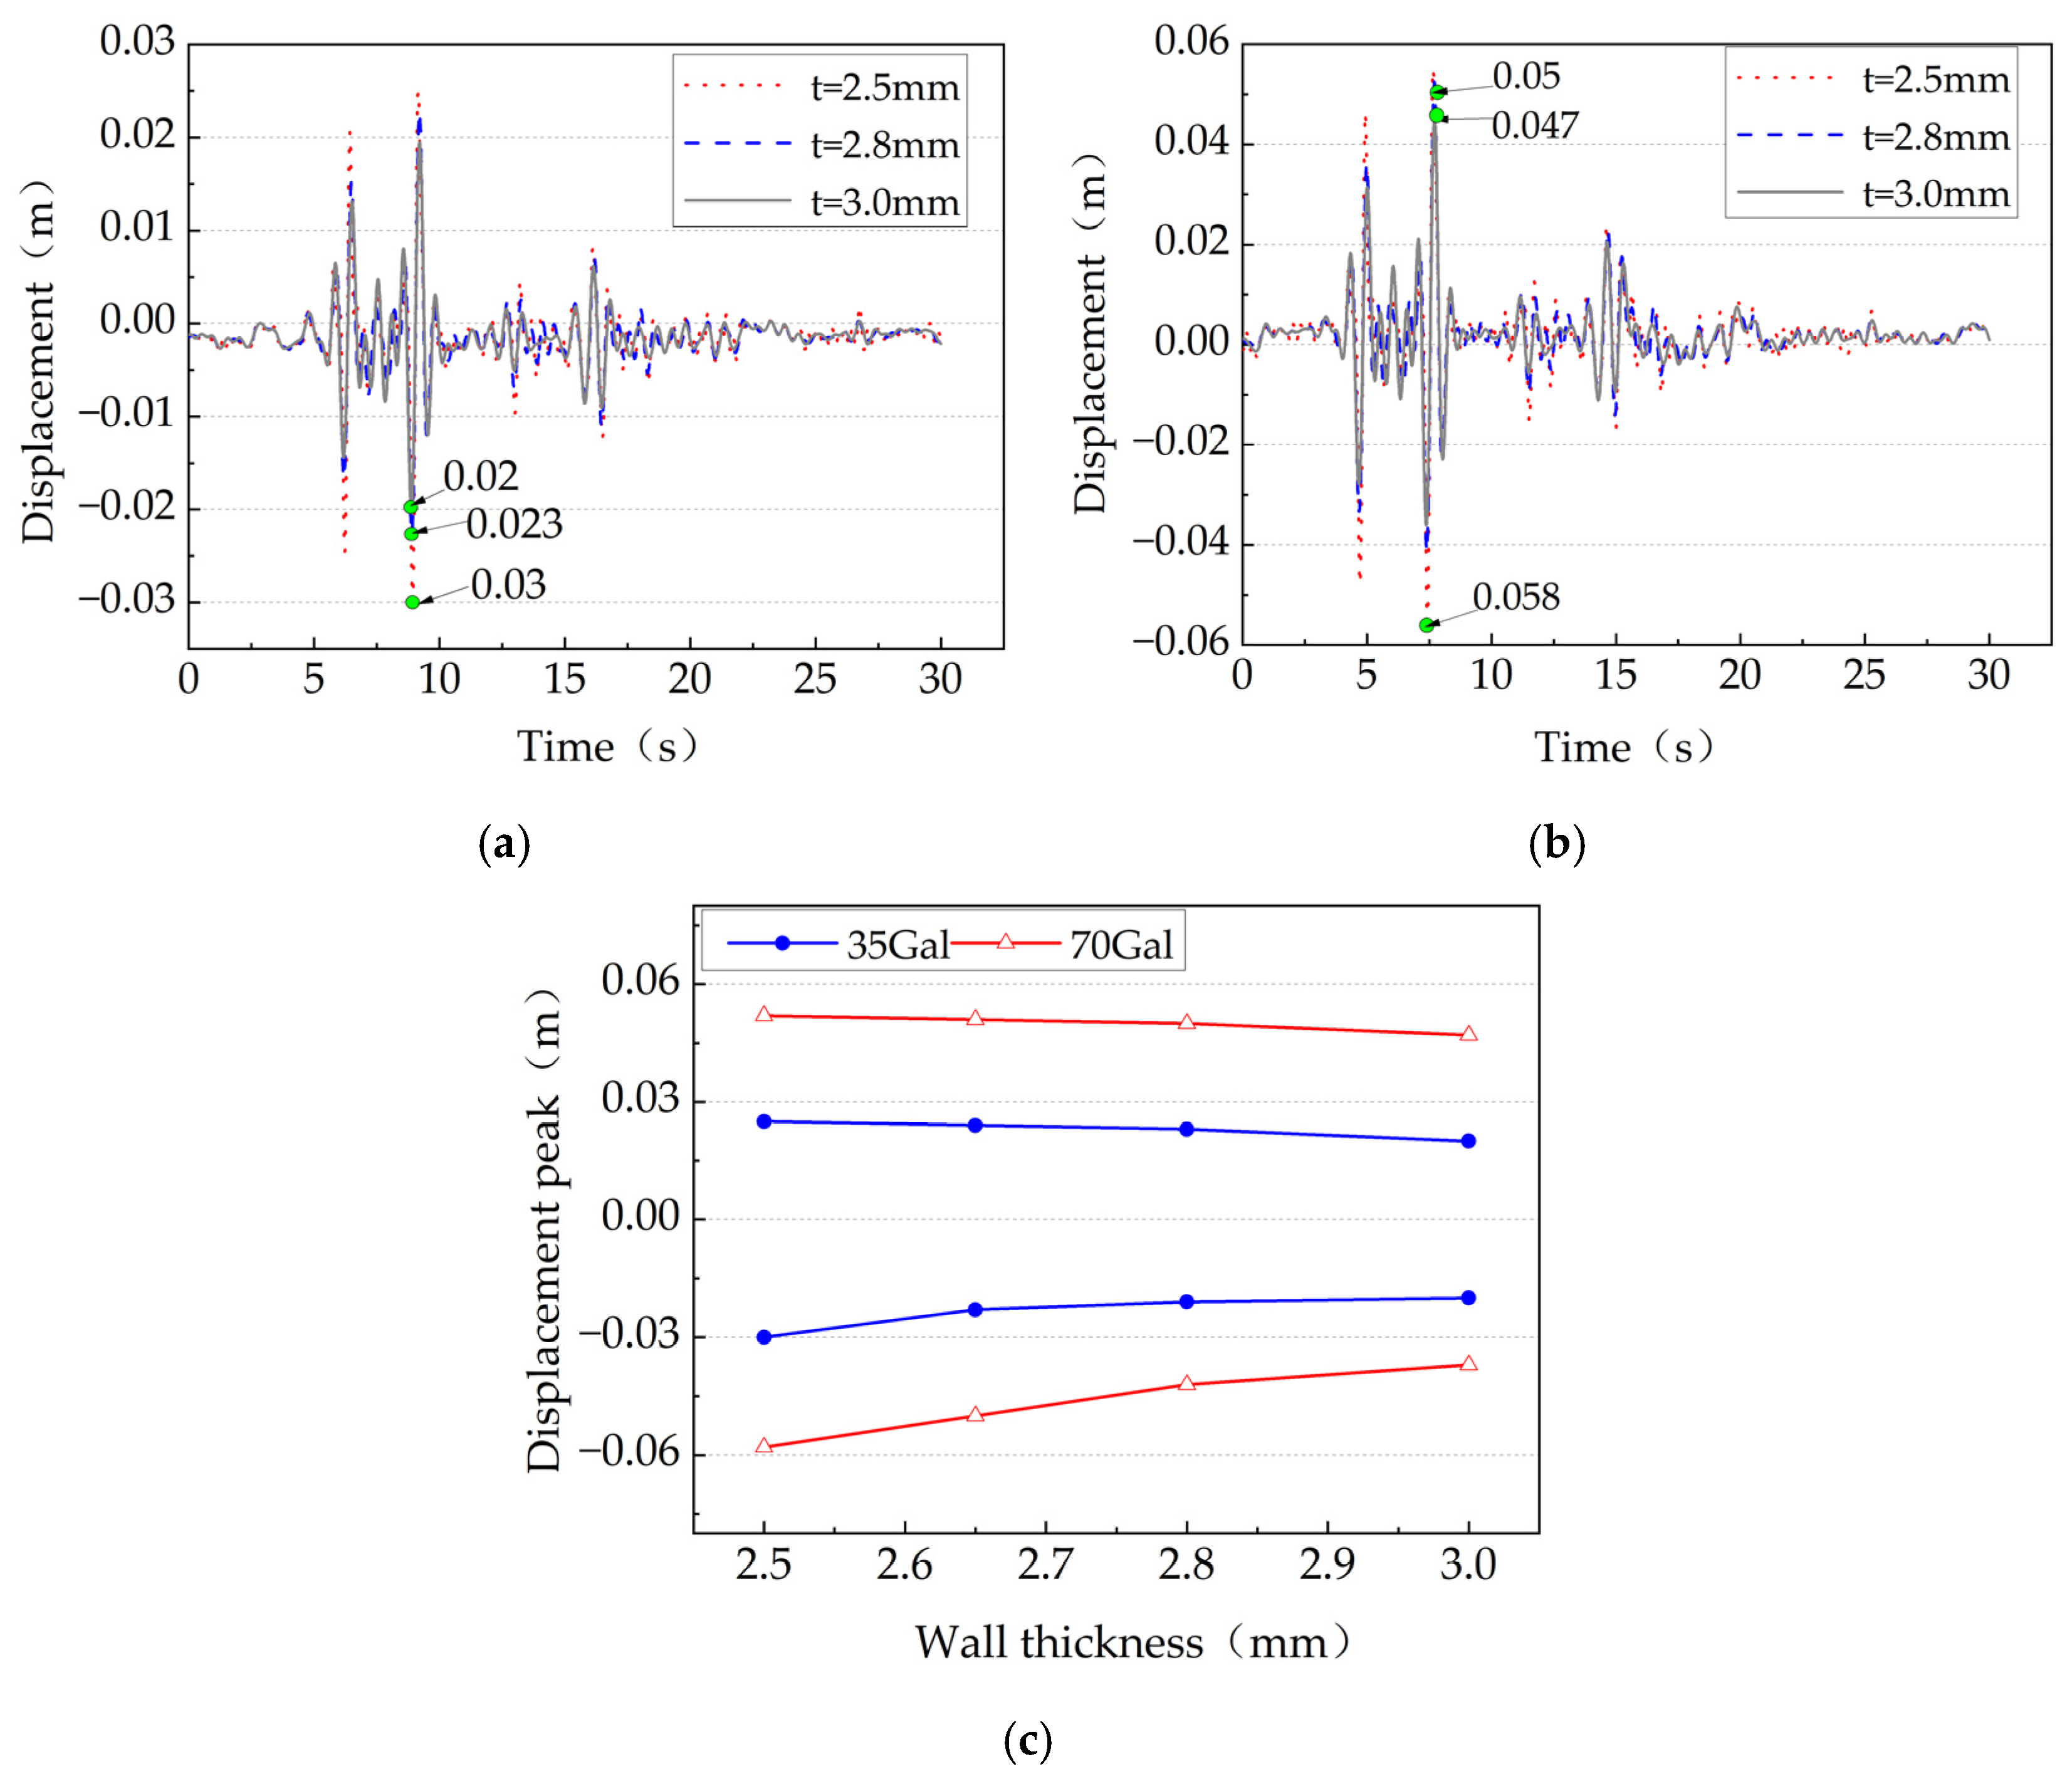
Figure 27.
Displacement comparison under El Centro earthquake; (a) El Centro 35 Gal; (b) El Centro 70 Gal; (c) Comparison of displacement peak.
Figure 27.
Displacement comparison under El Centro earthquake; (a) El Centro 35 Gal; (b) El Centro 70 Gal; (c) Comparison of displacement peak.
Figure 28.
Dynamic response of structure under the Nihonkai-Chubu earthquake: (a) Comparison of acceleration peak; (b) Comparison of displacement peak.
Figure 28.
Dynamic response of structure under the Nihonkai-Chubu earthquake: (a) Comparison of acceleration peak; (b) Comparison of displacement peak.
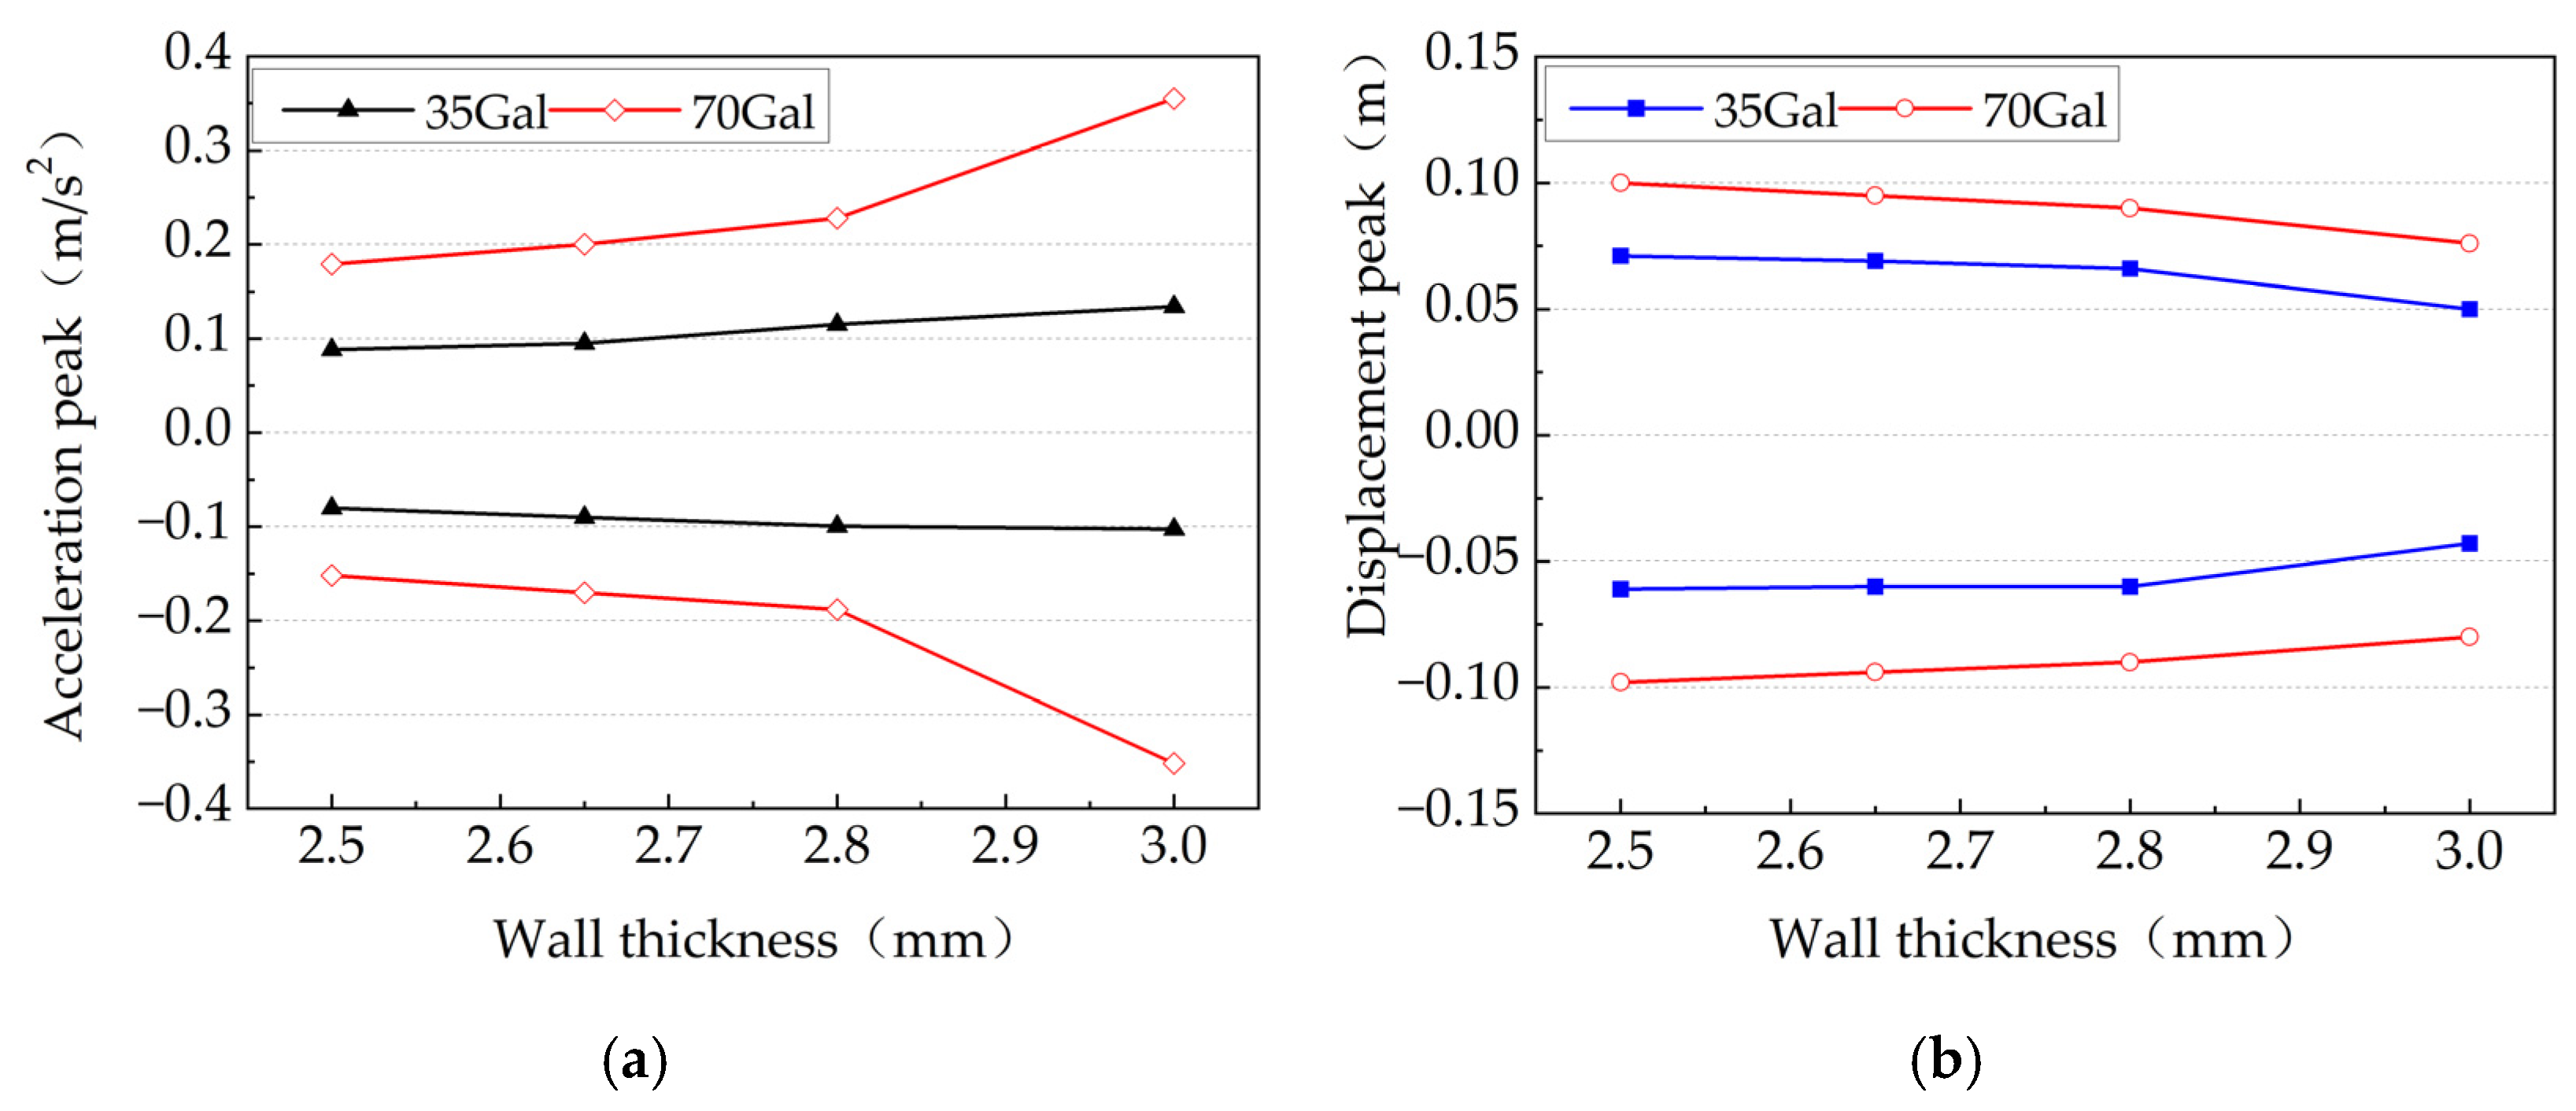
Figure 29.
Dynamic response of structure under the Hyogoken-Nanbu earthquake: (a) Comparison of acceleration peak; (b) Comparison of displacement peak.
Figure 29.
Dynamic response of structure under the Hyogoken-Nanbu earthquake: (a) Comparison of acceleration peak; (b) Comparison of displacement peak.
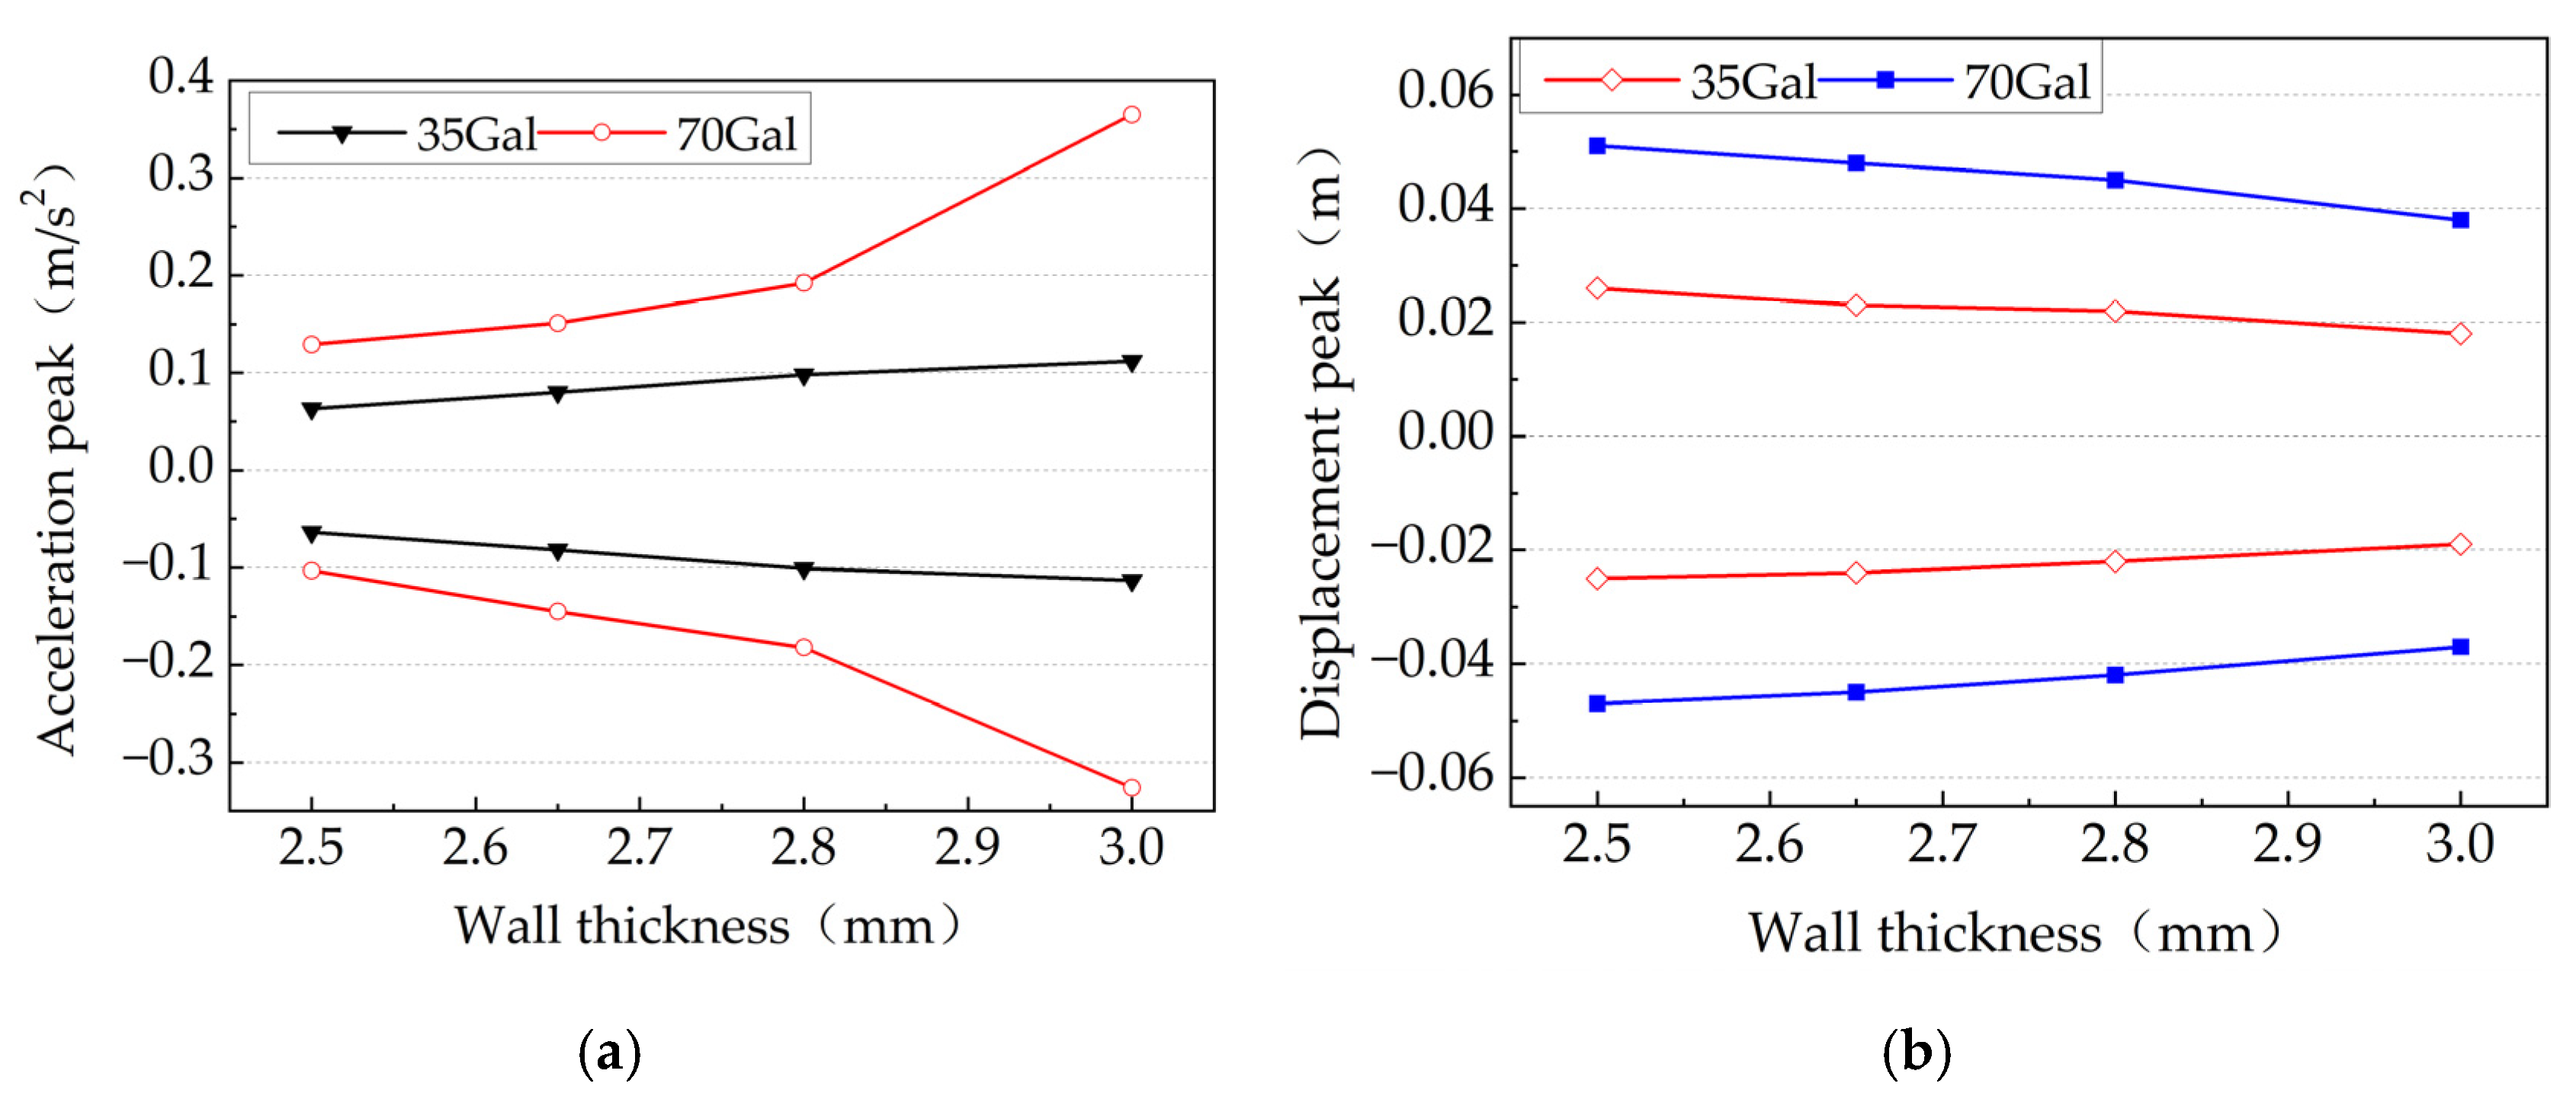
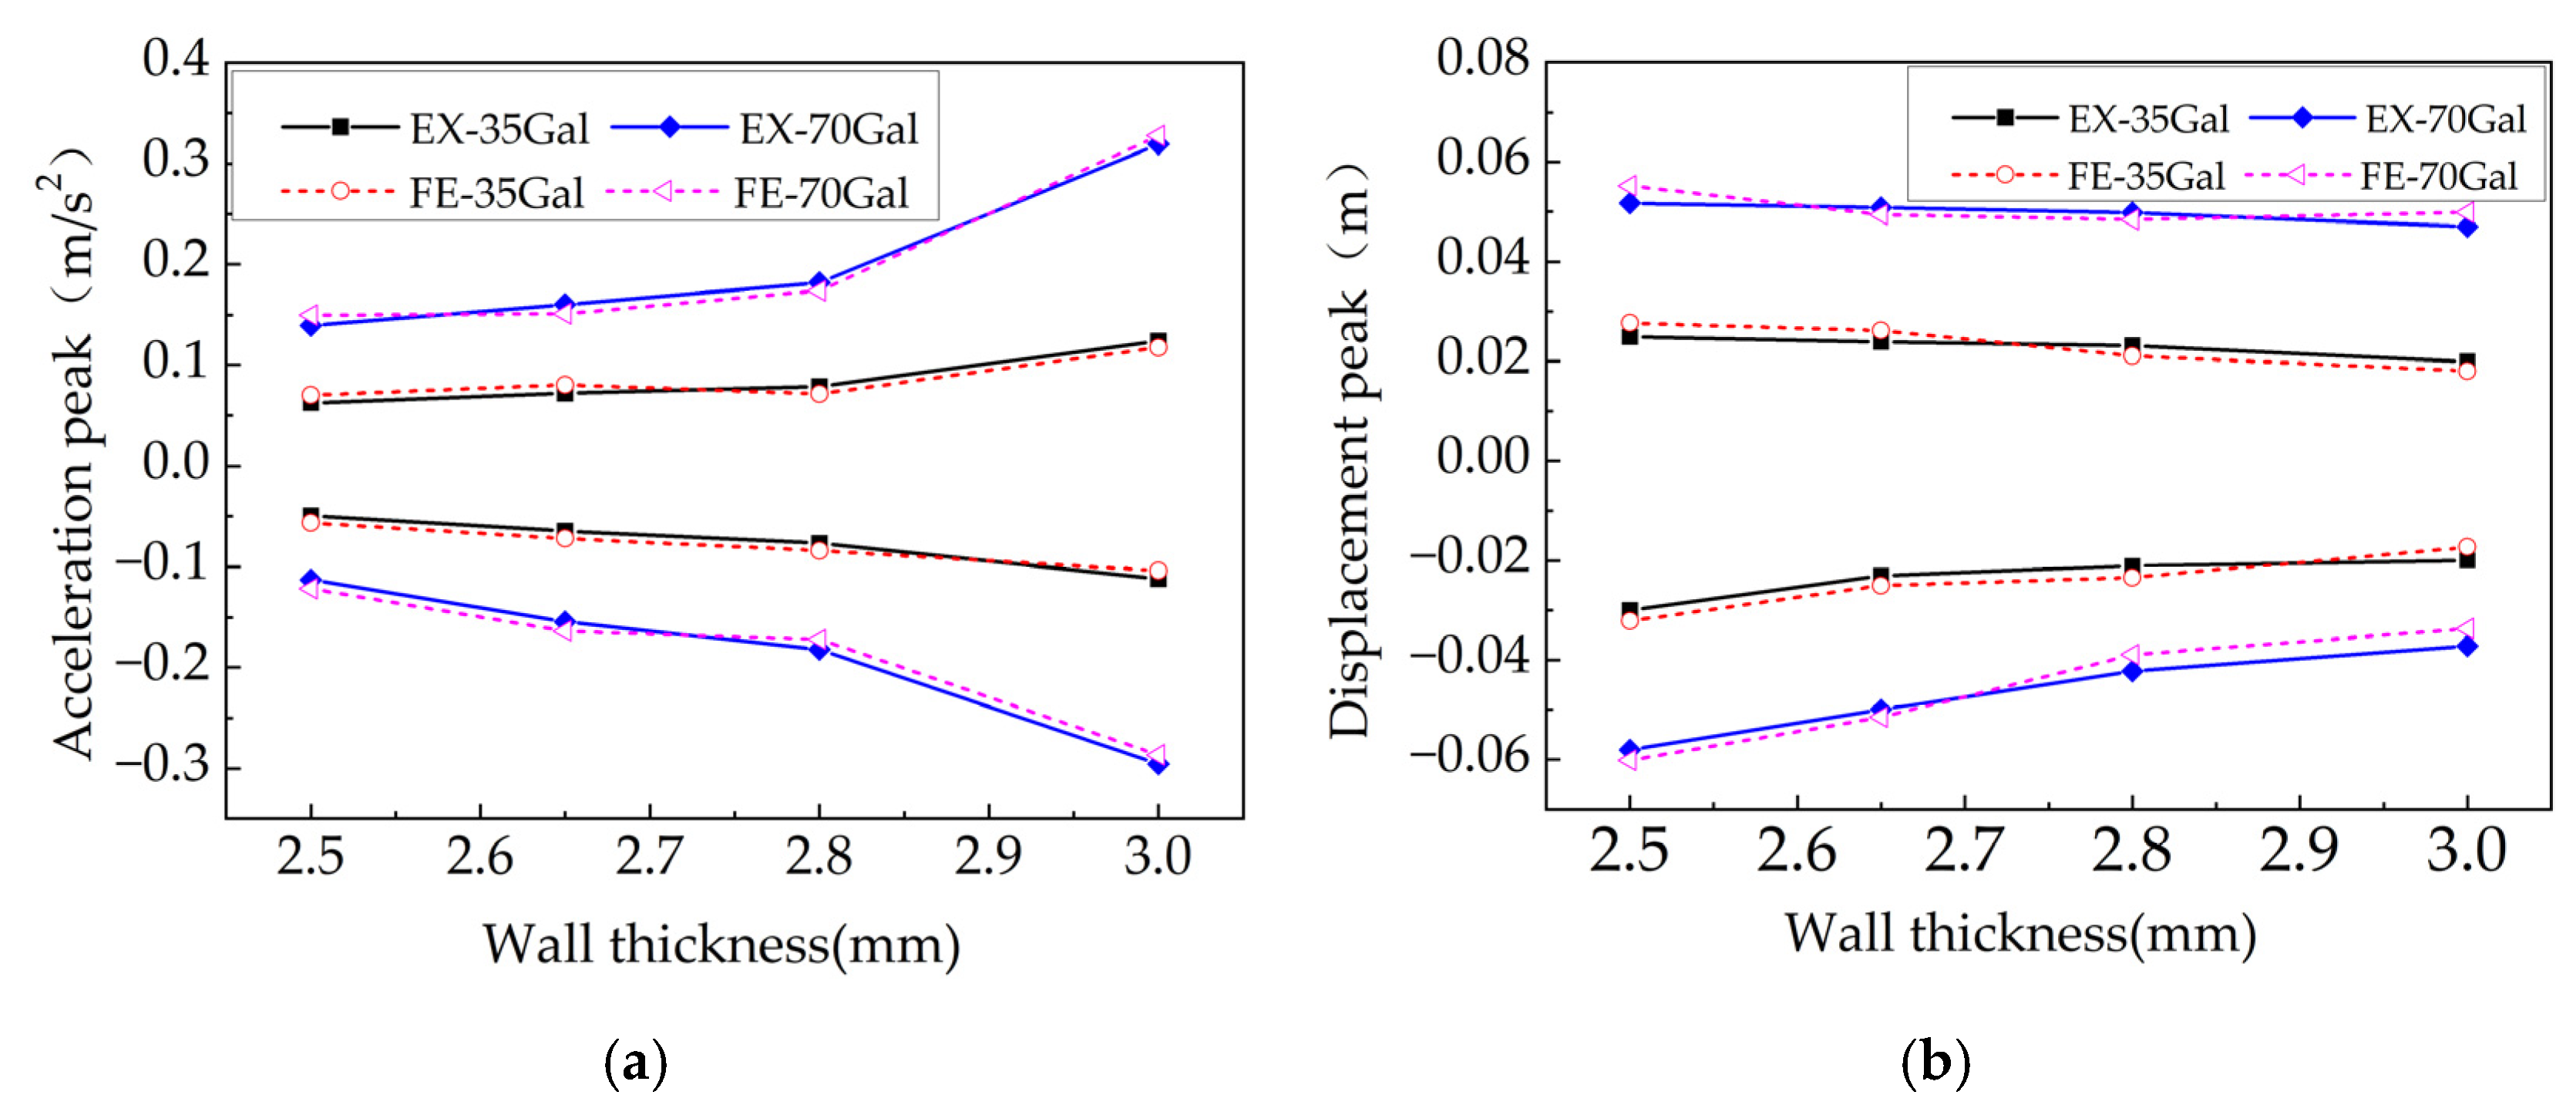
Figure 30.
Comparison of structural dynamic response under El Centro earthquake: (a) Acceleration Peak comparison; (b) Displacement peak comparison.
Figure 30.
Comparison of structural dynamic response under El Centro earthquake: (a) Acceleration Peak comparison; (b) Displacement peak comparison.
Figure 31.
Scale finite element model.
Figure 31.
Scale finite element model.
Figure 32.
Comparison under the El Centro earthquake: (a) Comparison of acceleration peak; (b) Comparison of displacement peak.
Figure 32.
Comparison under the El Centro earthquake: (a) Comparison of acceleration peak; (b) Comparison of displacement peak.
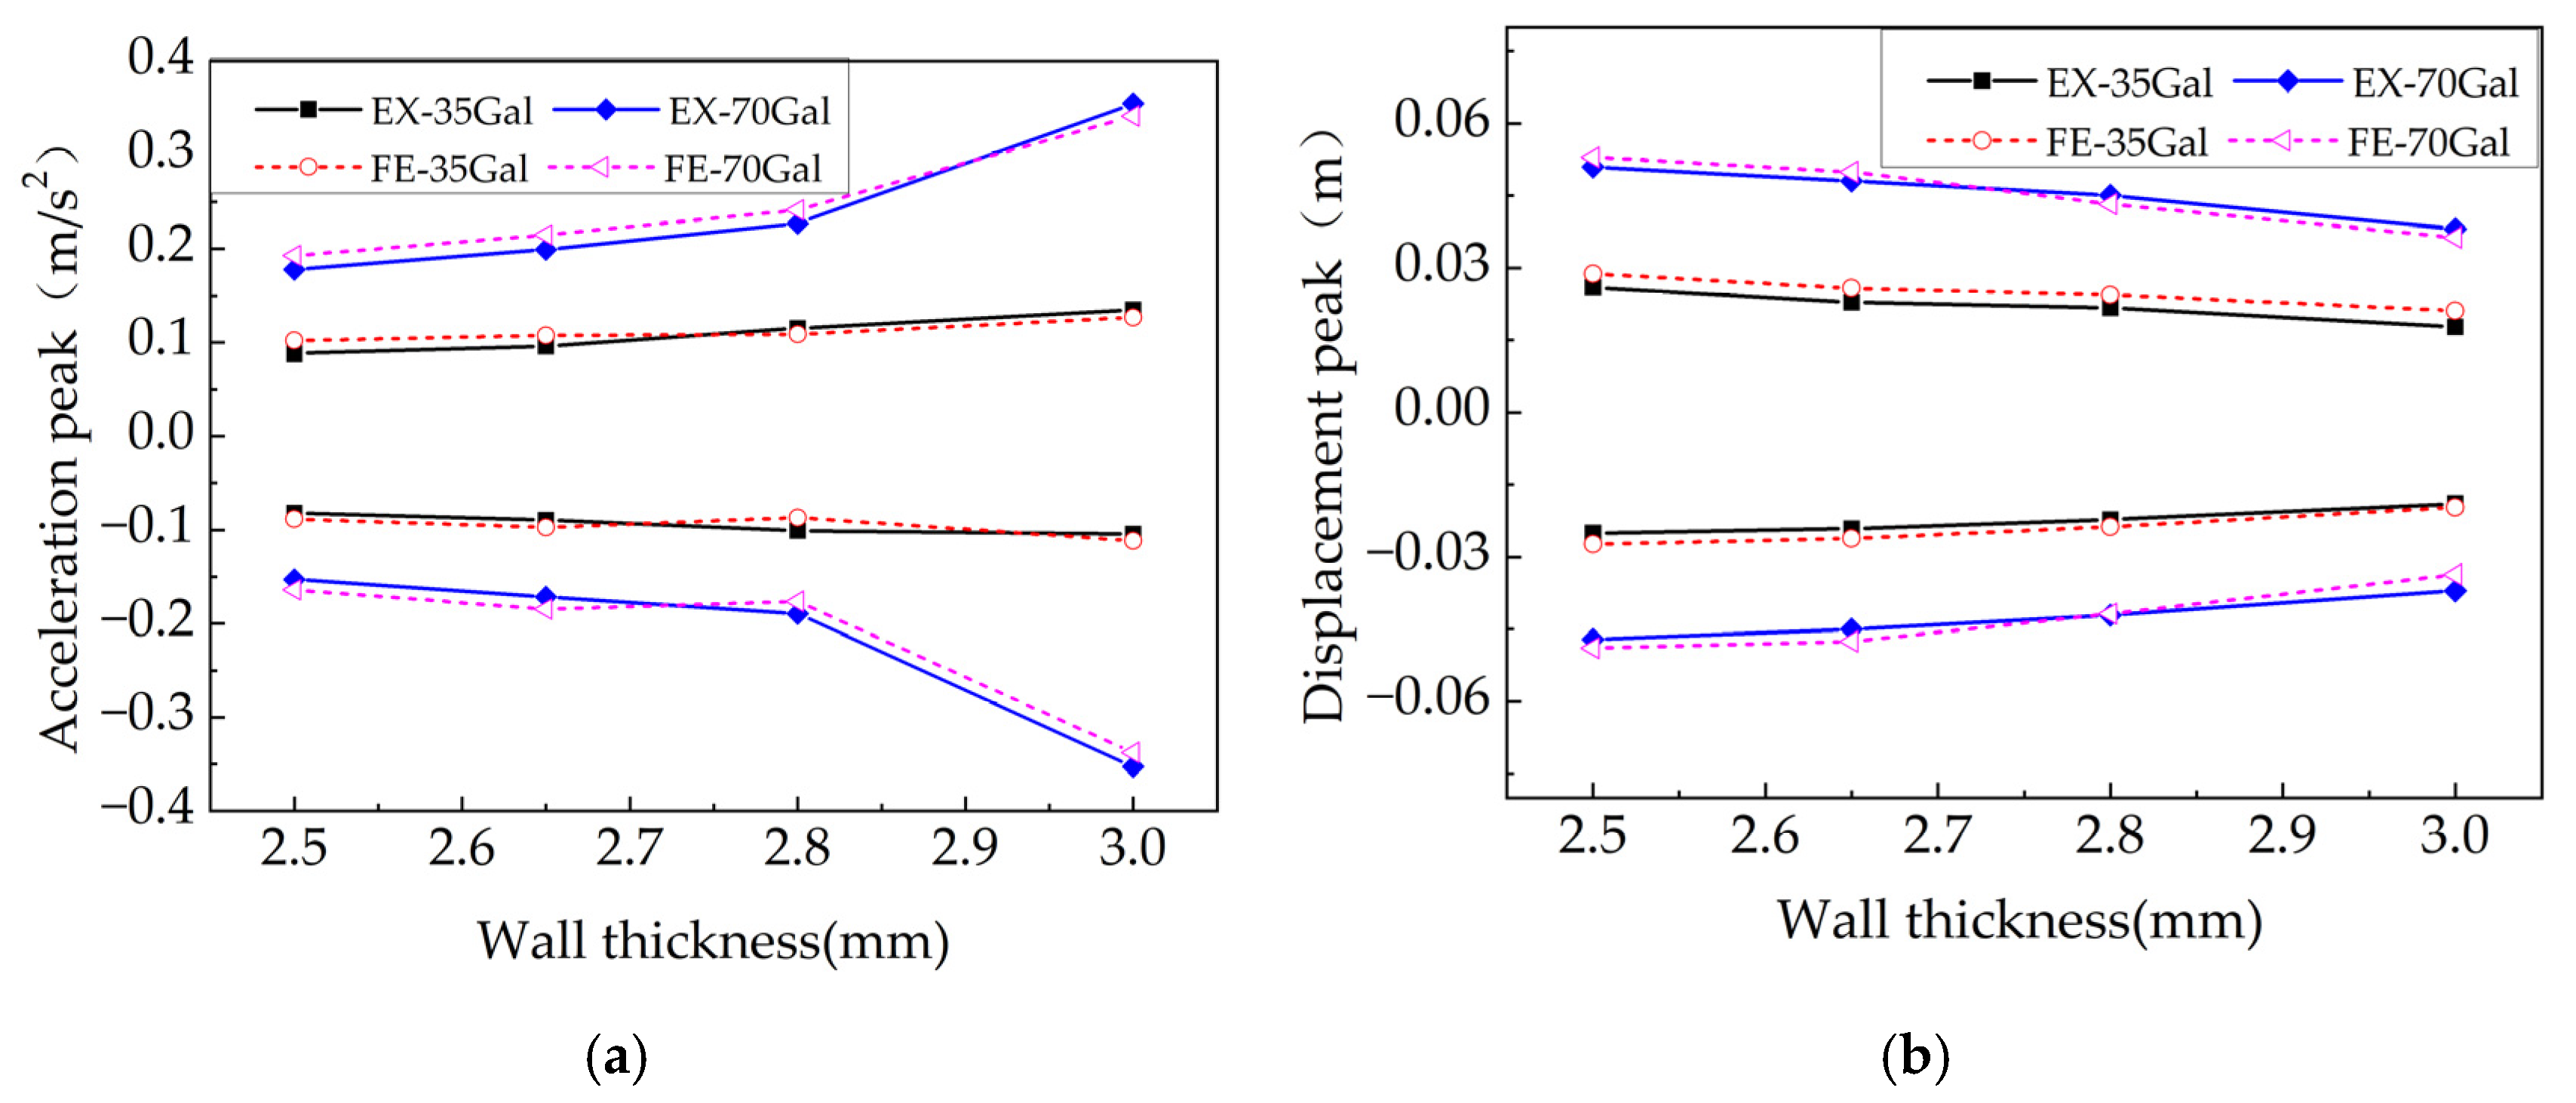
Figure 33.
Comparison under the Nihonkai-Chubu earthquake: (a) Comparison of acceleration peak; (b) Comparison of displacement peak.
Figure 33.
Comparison under the Nihonkai-Chubu earthquake: (a) Comparison of acceleration peak; (b) Comparison of displacement peak.
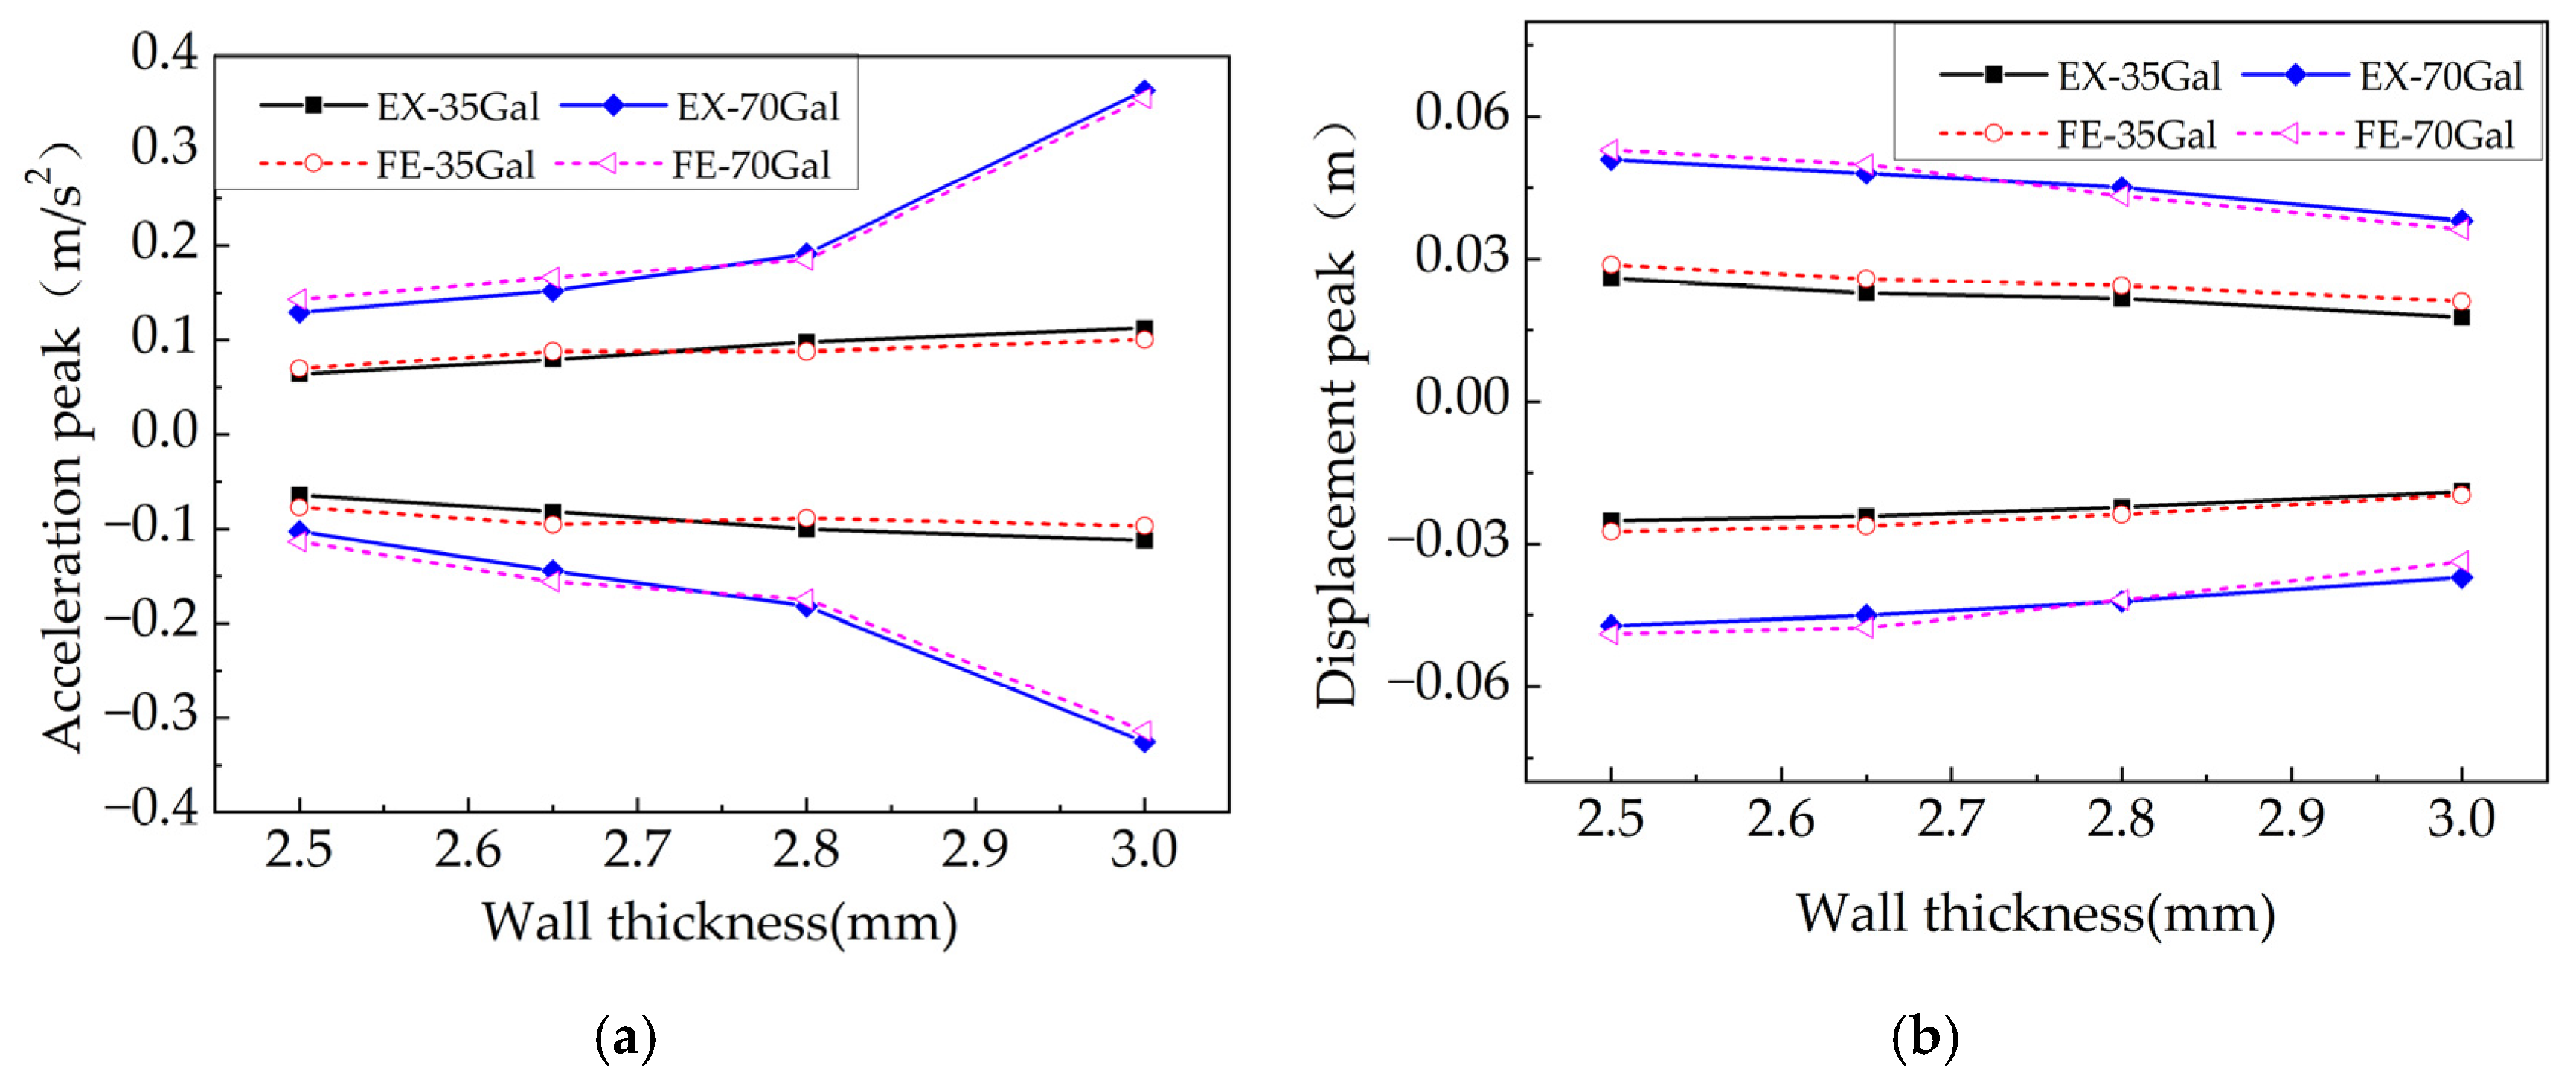
Figure 34.
Comparison under the Hyogoken-Nanbu earthquake: (a) Comparison of acceleration peak; (b) Comparison of displacement peak.
Figure 34.
Comparison under the Hyogoken-Nanbu earthquake: (a) Comparison of acceleration peak; (b) Comparison of displacement peak.
Table 1.
Parameters of the constitutive law of steel.
Table 1.
Parameters of the constitutive law of steel.
| Properties | Values | Properties | Values |
|---|
| Density (kg/m3) | 7850 | Ckin·1 | 7993 |
| Elastic modulus (MPa) | 2.06 × 10⁵ | Ckin·2 | 6773 |
| Poisson’s ratio | 0.28 | Ckin·3 | 2854 |
| Yield strength (MPa) | 345 | γ1 | 175 |
| Yield surface Equivalent stress (MPa) | 429 | γ2 | 116 |
| Hardening parameter | 1.2 | γ3 | 34 |
Table 2.
Statistics of identified natural frequencies and damping ratios.
Table 2.
Statistics of identified natural frequencies and damping ratios.
| Test | 6# Wind Turbine Tower | 15# Wind Turbine Tower |
|---|
| Frequency | Natural Period | Damping Ratio (%) | Frequency | Natural Period | Damping Ratio (%) |
|---|
| 1 | 0.319 | 3.135 | 1.01 | 0.331 | 3.021 | 0.99 |
| 2 | 0.318 | 3.145 | 1.02 | 0.327 | 3.058 | 1.00 |
Table 3.
Comparison of natural frequencies of wind turbine.
Table 3.
Comparison of natural frequencies of wind turbine.
| Wind Turbine Tower | Test | FE Value (Hz) | Measured Value (Hz) | Difference Value (%) |
|---|
| 6# | 1 | 0.351 | 0.319 | 9.1 |
| 2 | 0.351 | 0.318 | 9.4 |
| 15# | 1 | 0.351 | 0.331 | 5.7 |
| 2 | 0.351 | 0.327 | 6.8 |
Table 4.
The characteristics of different earthquake records.
Table 4.
The characteristics of different earthquake records.
| Earthquake | Station Location | Fault Distance (km) | PGA (cm/s2) | PGV/PGA (s) | ML |
|---|
| El Centro | El Centro#9 | 6.09 | 341.7 | 0.10 | 6.9 |
| Nihonkai-Chubu | Akita meteorological station | 14.0 | 58.6 | - | 7.7 |
| Hyogoken-Nanbu | Takarazuka | 16.1 | 818.0 | 0.12 | 7.2 |
Table 5.
Dynamic response of structures under different seismic records.
Table 5.
Dynamic response of structures under different seismic records.
| Case Condition | PGA | HDT (m) | Growth Rate | HAT (m/s2) | Growth Rate |
|---|
| El Centro | 0.07 g | 0.051 | - | 0.388 | - |
| 0.2 g | 0.120 | 136% | 1.240 | 220% |
| 0.4 g | 0.244 | 378% | 2.430 | 526% |
| Nihonkai-Chubu | 0.07 g | 0.210 | - | 1.190 | - |
| 0.2 g | 0.493 | 135% | 3.240 | 172% |
| 0.4 g | 0.988 | 370% | 6.380 | 436% |
| Hyogoken-Nanbu | 0.07 g | 0.031 | - | 0.398 | - |
| 0.2 g | 0.085 | 174% | 1.432 | 260% |
| 0.4 g | 0.170 | 448% | 2.635 | 562% |
Table 6.
CFRP material parameters.
Table 6.
CFRP material parameters.
| Parameters | Values | Parameters | Values |
|---|
| E1/GPa | 235 | XT/MPa | 3400 |
| E2/GPa | 17 | XC/MPa | 1700 |
| v12 | 0.34 | YT/MPa | 62 |
| G12/GPa | 48 | YC/MPa | 190 |
| G13/GPa | 48 | SXY/MPa | 81 |
| G23/GPa | 45 | SYZ/MPa | 81 |
Table 7.
Similarity ratio of experimental model.
Table 7.
Similarity ratio of experimental model.
| Parameter | Prototype | Model | Similarity Ratio (m/p) |
|---|
| σy | 345 MPa | 345 MPa | 1 |
| ε | 1.64 × 10⁻³ m | 1.64 × 10⁻³ m | 1 |
| E | 2.06 × 10¹¹ Pa | 2.06 × 10¹¹ Pa | 1 |
| σu | 490 MPa | 490 MPa | 1 |
| υ | 0.3 | 0.3 | 1 |
| l | 42,500 mm | 2500 mm | 1/17 |
| D | 4500 mm | 270 mm | 1/17 |
| A | 699,004 mm2 | 2418 mm2 | 1/289 |
| P | 2,228,547.5 N | 7711 N | 1/289 |
Table 8.
Loading condition of shaking table test.
Table 8.
Loading condition of shaking table test.
| Loading Condition | Experimental Condition | Wall Thickness/mm | Earthquake Records | PGA/Gal |
|---|
| No. 1 | El-01 | 3 | El Centro | 35 |
| No. 2 | El-02 | 3 | El Centro | 70 |
| No. 3 | Ni-01 | 3 | Nihonkai-Chubu | 35 |
| No. 4 | Ni-02 | 3 | Nihonkai-Chubu | 70 |
| No. 5 | Hy-01 | 3 | Hyogoken-Nanbu | 35 |
| No. 6 | Hy-02 | 3 | Hyogoken-Nanbu | 70 |
| No. 7 | El-03 | 2.8 | El Centro | 35 |
| No. 8 | El-04 | 2.8 | El Centro | 70 |
| No. 9 | Ni-03 | 2.8 | Nihonkai-Chubu | 35 |
| No. 10 | Ni-04 | 2.8 | Nihonkai-Chubu | 70 |
| No. 11 | Hy-03 | 2.8 | Hyogoken-Nanbu | 35 |
| No. 12 | Hy-04 | 2.8 | Hyogoken-Nanbu | 70 |
| No. 13 | El-05 | 2.65 | El Centro | 35 |
| No. 14 | El-06 | 2.65 | El Centro | 70 |
| No. 15 | Ni-05 | 2.65 | Nihonkai-Chubu | 35 |
| No. 16 | Ni-06 | 2.65 | Nihonkai-Chubu | 70 |
| No. 17 | Hy-05 | 2.65 | Hyogoken-Nanbu | 35 |
| No. 18 | Hy-06 | 2.65 | Hyogoken-Nanbu | 70 |
| No. 19 | El-07 | 2.5 | El Centro | 35 |
| No. 20 | El-08 | 2.5 | El Centro | 70 |
| No. 21 | Ni-07 | 2.5 | Nihonkai-Chubu | 35 |
| No. 22 | Ni-08 | 2.5 | Nihonkai-Chubu | 70 |
| No. 23 | Hy-07 | 2.5 | Hyogoken-Nanbu | 35 |
| No. 24 | Hy-08 | 2.5 | Hyogoken-Nanbu | 70 |
| No. 25 | CF-El-09 | 2.8 | El Centro | 35 |
| No. 26 | CF-El-10 | 2.8 | El Centro | 70 |
| No. 27 | CF-Ni-09 | 2.8 | Nihonkai-Chubu | 35 |
| No. 28 | CF-Ni-10 | 2.8 | Nihonkai-Chubu | 70 |
| No. 29 | CF-Hy-09 | 2.8 | Hyogoken-Nanbu | 35 |
| No. 30 | CF-Hy-10 | 2.8 | Hyogoken-Nanbu | 70 |
| No. 31 | CF-El-11 | 2.65 | El Centro | 35 |
| No. 32 | CF-El-12 | 2.65 | El Centro | 70 |
| No. 33 | CF-Ni-11 | 2.65 | Nihonkai-Chubu | 35 |
| No. 34 | CF-Ni-12 | 2.65 | Nihonkai-Chubu | 70 |
| No. 35 | CF-Hy-11 | 2.65 | Hyogoken-Nanbu | 35 |
| No. 36 | CF-Hy-12 | 2.65 | Hyogoken-Nanbu | 70 |
| No. 37 | CF-El-13 | 2.5 | El Centro | 35 |
| No. 38 | CF-El-14 | 2.5 | El Centro | 70 |
| No. 39 | CF-Ni-13 | 2.5 | Nihonkai-Chubu | 35 |
| No. 40 | CF-Ni-14 | 2.5 | Nihonkai-Chubu | 70 |
| No. 41 | CF-Hy-13 | 2.5 | Hyogoken-Nanbu | 35 |
| No. 42 | CF-Hy-14 | 2.5 | Hyogoken-Nanbu | 70 |
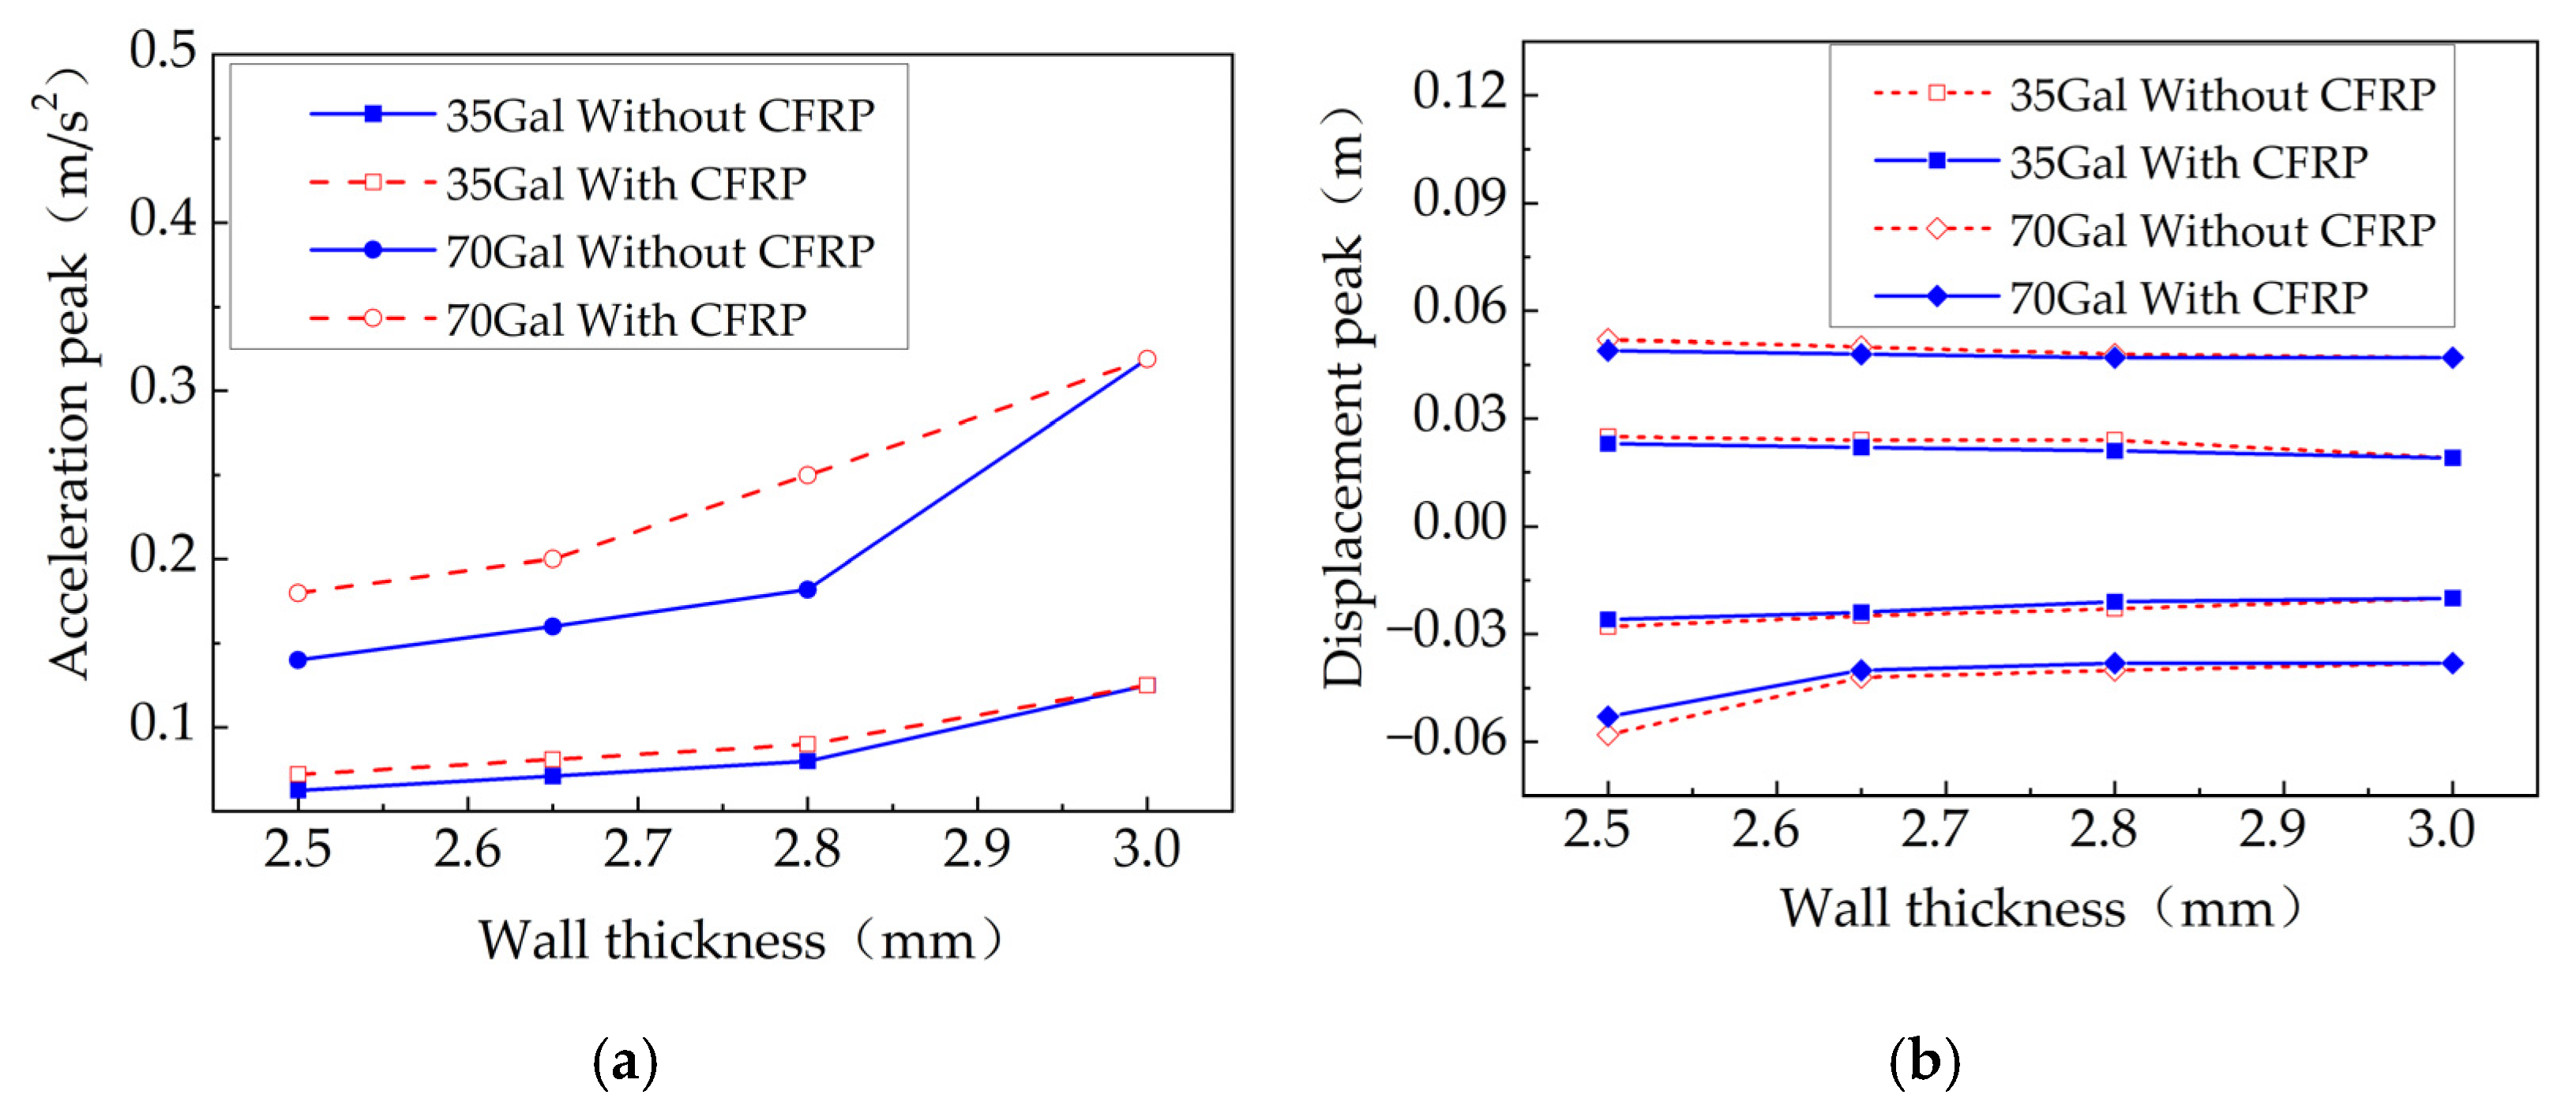
Table 9.
Comparison of structural acceleration response.
Table 9.
Comparison of structural acceleration response.
| Earthquake | Wall Thickness (mm) | 35 Gal | Rate of Change | 70 Gal | Rate of Change |
|---|
| Without CFRP | With CFRP | Without CFRP | With CFRP |
|---|
| El Centro | 2.5 | 0.0625 | 0.072 | 15.20% | 0.14 | 0.165 | 17.90% |
| 2.65 | 0.071 | 0.081 | 14.10% | 0.16 | 0.18 | 12.50% |
| 2.8 | 0.08 | 0.09 | 12.50% | 0.182 | 0.22 | 20.90% |
| 3 | 0.125 | 0.125 | - | 0.319 | 0.319 | - |
| Nihonkai-Chubu | 2.5 | 0.088 | 0.093 | 5.70% | 0.179 | 0.19 | 6.10% |
| 2.65 | 0.095 | 0.1 | 5.30% | 0.2 | 0.23 | 15.00% |
| 2.8 | 0.115 | 0.12 | 4.30% | 0.228 | 0.26 | 14.00% |
| 3 | 0.134 | 0.134 | - | 0.355 | 0.355 | - |
| Hyogoken-Nanbu | 2.5 | 0.063 | 0.075 | 19.00% | 0.129 | 0.15 | 16.30% |
| 2.65 | 0.08 | 0.09 | 12.50% | 0.151 | 0.18 | 19.20% |
| 2.8 | 0.098 | 0.106 | 8.20% | 0.192 | 0.23 | 19.80% |


