Article

Probabilistic Joint Importance-Based Retrofit Strategy for Seismic Risk Mitigation of Transportation Networks

1
Key Lab of Structures Dynamic Behavior and Control of the Ministry of Education, Harbin Institute of Technology, Harbin 150090, China
2
Key Lab of Smart Prevention and Mitigation of Civil Engineering Disasters of the Ministry of Industry and Information Technology, Harbin Institute of Technology, Harbin 150090, China
3
School of Transportation Science and Engineering, Harbin Institute of Technology, Harbin 150090, China
*
Author to whom correspondence should be addressed.
Appl. Sci. 2022, 12(18), 9307; https://doi.org/10.3390/app12189307
Submission received: 22 August 2022 / Revised: 11 September 2022 / Accepted: 13 September 2022 / Published: 16 September 2022
(This article belongs to the Special Issue Advances in Engineering Structural Systems)

Abstract

:
Seismic mitigation of transportation systems has become a worldwide challenge, because identifying an optimal retrofit strategy entails significant computational efforts, especially for large-scale networks with numerous candidate strategies and time-consuming risk assessment processes. An efficient joint importance-based methodology is proposed in this paper to address the challenge. The proposed method selects the component set (e.g., bridges) that is most decisive to the network seismic risk based on only one set of stochastic samples but takes into account the uncertainty of multiple damage states and the interactive effect between different components. The reliability and stability of the proposed method are verified on a hypothetical transportation network under different conditions.

1. Introduction

With the rapid development of urbanization, earthquakes have become one of the most threatening of all natural disasters to human society [1,2,3]. A severe earthquake could damage a large number of buildings and infrastructures, causing serious casualties and economic losses [4,5]. In the post-earthquake environment, the transportation network plays an essential role in sustaining emergency relief and reconstruction efforts [6,7,8]. Therefore, seismic risk mitigation of the transportation network has always been a hot topic of research [9,10,11,12].
Identifying and retrofitting critical components is considered to be the most effective and practical approach for the mitigation of transportation networks [13,14,15]. To cope with potential seismic risk under a limited budget, many researches have formulated stochastic optimization (SO) models to improve the seismic performance of the transportation network [16,17,18,19,20]. However, developing such a model presents two challenges. First, the number of feasible retrofit strategies grows exponentially with the number of candidate components, making the enumeration of all possible strategies impractical when dealing with a multidimensional problem. Some researches have utilized heuristic algorithms to reduce the computation cost [21,22,23,24]. Nevertheless, for large-scale networks, this still requires many repeated calculations of the objective function, and may converge to locally optimal solutions. The second challenge is that the various uncertainties from earthquake scenarios and component vulnerabilities make it quite difficult to exactly estimate the mitigation benefit of a retrofit strategy. In general, instead of considering all damage scenarios, Monte Carlo simulation (MCS) is used to assess the seismic risk of a transportation network [25,26,27,28]. Given that MCS needs a sufficient sample set and that each retrofit strategy needs to be calculated separately, this still faces great computational complexity for large networks.
To address the above challenges, many researches proposed importance-ranking methods as an alternative to the above optimization models. Traditional ranking methods are mainly based on the structural attributes of individual components [29,30,31], and some recent studies have proposed Multi-Criteria Decision-Making (MCDM) methods to integrate the technical and socioeconomic attributes [32,33,34,35]. These methods do not consider the roles of components in the transportation network from a system prospect. Some other researches have prioritized the components according to their spatial importance in network topology (e.g., betweenness centrality [36,37,38]). However, such measures do not correlate well with the functionality of transportation networks. In literature, the importance of a component in the transportation network is most commonly assessed according to the impact of removing that component from the network [39,40,41]. Although all the above methods greatly reduce the computational effort, there could be a gap between their results and the real optimal solution because none of them takes into account the uncertainties in the damage states of network components. Several recent studies have proposed to evaluate the importance of components using conditional probability between component failure and system failure [42,43,44,45]. These methods consider both the vulnerability of a component and its impact on system reliability, which improves the identification of retrofit importance. However, there are still some defects. The post-earthquake condition of a component is usually assumed to be binary (i.e., functional or non-functional), and the effects of multiple potential damage states are rarely considered. More importantly, all the above ranking methods are designed for individual components, and the retrofitted components are selected one by one according to their importance value. However, the set of top-ranked components cannot ensure the largest mitigation benefit since the retrofit benefit from different components are not independent [14].
This paper formulates the general seismic retrofit problem for risk mitigation of transportation networks under multiple uncertainties. To efficiently solve the problem, a probabilistic joint importance-based method is introduced to select the component set with the highest retrofit priority instead of the time-consuming optimization process. This approach transforms the complex SO problem into a feature subset-selection problem associated with the network seismic risk, and the joint importance of component sets can be obtained based on only a limited number of stochastic samples. The proposed method is applied to the seismic mitigation problem of emergency response on a hypothetical transportation network. It should be noted that this approach supports an efficient risk-mitigation decision process, taking into account both multiple uncertainties and the interactive effect between various components. It has a broad application prospect and can be easily extended to other infrastructure systems.
The remainder of this paper is organized as follows. Section 2 formulates the general seismic risk assessment and retrofit decision model for transportation networks. Section 3 presents the probabilistic joint importance-based decision method for seismic risk mitigation. Section 4 introduces the post-earthquake network functionality evaluation process of emergency response used in this paper. Then, in Section 5, a hypothetical transportation network is generated to illustrate the implementation of the proposed methodology. Conclusions are summarized in Section 6.

2. Seismic Risk Assessment and Retrofit Strategy

2.1. Seismic Risk Assessment of Transportation Networks

A typical transportation network is composed of nodes, links, and critical components. Nodes represent the population centers and road intersections, and links represent the road segments connecting the nodes. Critical components usually include bridges, tunnels, and vulnerable road sections.
The seismic risk of a transportation network is determined by the uncertainties in both seismic scenarios and component damage states. The uncertainty of seismic scenarios is modelled by identifying possible earthquake events [46,47] and predicting the ground motion intensities at specific sites [48,49], and the damage uncertainty of a component is generally described by its structural fragility curve [50,51,52]. In this paper, to make the problem simple and clear, the following sections will be specific to the bridge retrofit decision problem, because the impact of bridge damage on post-earthquake network functionality is the most concerned in existing studies [53,54,55]. However, it is noted that the proposed method is a general framework for transportation networks that can be easily expand to the retrofit decision, including also other vulnerable network components.
Considering a transportation network consists of n bridges, let λ = { λ 1 , λ 2 , , λ n } denote the damage-state vector of all the bridges in the network after an earthquake event and λ i denotes the damage state of the i th bridge. Then the joint probability density function (PDF) for λ is computed as:
p ( λ ) = p ( λ | I M ) p ( I M | E Q ) p ( E Q ) d E Q
where p ( λ | I M ) is the PDF for λ associated with a given vector of intensity measures I M = { I M 1 , I M 2 , , I M n } , where I M i denotes the intensity measure at the location of the i th bridge. p ( I M | E Q ) is the PDF for I M , which can be estimated by the ground motion prediction equation under a given earthquake event E Q , and p ( E Q ) is the occurrence probability of the earthquake event. In practical, the above probability transfer process can be approximated by MCS. Considering the number of damage states of a bridge under seismic hazard is n s , the conditional probability of the i th bridge being in damage state D S j can be written as p ( λ i = D S j | I M i ) , for j = 1 , 2 , , n s . In general, the damage states of transportation network components can be divided into five levels [56] (i.e., no damage, slight damage, moderate damage, extensive damage and complete damage). Additionally, it should be noted that the seismic uncertainty model formulated above may not be applicable to complex components, which need to be modelled and analyzed separately, such as suspension bridges [57], cable-stayed bridges [58] and long-span bridges [59]. In the seismic analysis of transportation network, the damage states of bridges can be used to estimate their post-earthquake serviceability [60,61], and the corresponding network functionality is calculated accordingly. Depending on different research concerns, existing post-earthquake functionality assessment methods of the transportation network include connectivity-based [62,63], traffic delay-based [64,65], throughput-based [25,66], etc., and the analysis result of each method will ultimately be reflected in the functionality indicator. For illustration, Section 4 introduces a quantitative method to measure the post-earthquake network functionality in terms of emergency response connectivity, and the method is utilized in the example of Section 5. However, it should be noted that the decision-making framework proposed in this paper is applicable to all kinds of network functionality analysis methods. Given the network damage vector λ , the quality of network functionality is represented by Q ( λ ) . If Q c is assumed to be the control value that is defined by the decision makers, and the post-earthquake network functionality lower than Q c is considered failure, we can use an indicator function φ to record the post-earthquake network functionality status, that is, φ ( λ ) = 1 if Q ( λ ) < Q c and 0 otherwise. Then the seismic risk (i.e., failure probability of the network) can be expressed as:
P F = φ ( λ ) p ( λ ) d λ = φ ( λ ) p ( λ | I M ) p ( I M | E Q ) p ( E Q ) d E Q

2.2. Retrofit Strategy for Risk Mitigation

Due to the constraints of a limited budget, only some of the bridges in a transportation network can in practice be retrofitted. The mitigation problem is to select the optimal set of bridges to minimize the seismic risk of the network. To simplify the problem, the budget constraint is specified as the number of bridges that can be optionally retrofitted. Suppose m bridges can be retrofitted from the total n bridges in a transportation network, and B m = { B 1 , B 2 , , B m } denotes a candidate bridge set. Since retrofitting a bridge means improving its seismic capacity and reducing its damage probability in the context of earthquakes, p ( λ i = D S j | I M i ) for B i B m needs to be updated in the retrofitted network, and the PDF for network damage vector becomes:
p m ( λ ) = p ( λ m ) p ( λ m ¯ ) = i B m p ( λ i ) i B m p ( λ i )
where λ m = { λ B 1 , λ B 2 , , λ B m } represents the damage states of retrofitted bridges, and λ m ¯ represents those of the remaining bridges. Then the seismic risk of the retrofitted network associated with B m can be calculated as:
P F ( B m ) = φ ( λ ) p m ( λ ) d λ = φ ( λ ) p m ( λ | I M ) p ( I M | E Q ) p ( E Q ) d E Q
Subsequently, if each damage-state vector λ of the network is enumerated, and the corresponding network functionality Q ( λ ) is computed, the failure probability for any retrofit strategy can be obtained according to Equations (3) and (4). The optimal solution of the problem can be written as:
B m * = arg min m < n P F ( B m )
However, computing the network functionality of each damage-state vector is often extremely time-consuming. As mentioned previously, researchers tried to reduce the computational cost by MCS and heuristic algorithms [16,23,24]. These approaches will somehow sacrifice the accuracy of the results, and still face considerable computation pressure for multidimensional problems. Instead, in the next section, we will introduce a novel importance-based alternative algorithm for the optimization model, which can significantly reduce the computational cost and still consider the impact of multiple uncertainties and the interactive effect between components.

3. Probabilistic Joint Importance-Based Retrofit Strategy

According to Equation (4), the retrofit benefit of a bridge is jointly determined by the damage uncertainty of the bridge as well as its impact on network performance. However, as reviewed previously, most of existing bridge importance-ranking methods only focus on one aspect, and do not consider the effect of partially damaged bridges on network performance, which is particular significant for post-earthquake transportation network analysis. In addition, according to Equation (3), the benefits of retrofitted bridges are not independent, but a result of the joint damage probability of multiple bridges. The interactive effect between candidate bridges is never considered in network importance-based approaches.
To address the above problems, this section will introduce a novel joint importance-based approach for efficient risk mitigation. This approach ranks the importance of bridges by measuring the impact of their damage uncertainties on the overall seismic risk of the transportation network. The idea is to transform the SO problem into a feature subset selection problem associated with the network seismic risk, and the interactive effect between bridges is measured according to the correlation between features. Then the optimal retrofit strategy is guided by selecting the features (i.e., bridges) that are most decisive to the seismic risk of the system.

3.1. Importance of Individual Bridge

Feature selection is a classic problem in statistics, machine learning, data mining among other research fields to solve large-scale computing problems. The purpose of feature selection is to screen out a feature subset that is most relevant to the target variable, and the process is similar to the selection of a bridge set that is most important for the seismic risk of transportation network. In this paper, an information-based feature selection approach is used to solve the problem of bridge retrofit strategy.
In information theory, the total amount of information in a variable can be measured by the level of uncertainty in its data. The information entropy is a commonly used metric, calculated as:
H ( v ) = p ( v ) log p ( v ) d v
where p ( ν ) is the PDF of variable ν . H ( ν ) can be understood as the expectation of the logarithm of p ( ν ) , and larger value represents more information contained in the variable. Subsequently, the interdependence between two variables can be described as the amount of their common information, named mutual information or information gain. In practice, mutual information is often used to measure the reduced uncertainty of target variable under a given feature, and larger value indicates stronger dependence of target variable on the feature. Herein, the concept of mutual information is extended to the risk mitigation problem illustrated in Section 2. The mutual information between the damage states of a bridge ( λ i ) and the post-earthquake functionality status of the network ( φ ) is written as:
M I ( λ i ; φ ) = p ( λ i , φ ) log [ p ( λ i , φ ) p ( λ i ) p ( φ ) ] d λ i d φ = j = 1 n s φ = 0 1 p ( λ i = D S j , φ ) log [ p ( λ i = D S j , φ ) p ( λ i = D S j ) p ( φ ) ]
where p ( λ i , φ ) is the joint PDF of λ i and φ , considering λ i = [ D S 1 , D S 2 , , D S n s ] and φ = [ 0 , 1 ]. Essentially, M I is the mathematical expectation of the logarithmic difference between p ( λ i , φ ) and p ( λ i ) · p ( φ ) . When λ i and φ are completely independent, there is p ( λ i , φ ) = p ( λ i ) · p ( φ ) and M I ( λ i ; φ ) = 0 . With the increase of their dependence, the value of M I ( λ i ; φ ) goes up but always satisfies M I ( λ i ; φ ) min [ H ( λ i ) , H ( φ ) ] . According to the values of M I , we can rank the importance of bridges that affect the seismic risk of the network. Under the same reinforcement condition, retrofitting a more important bridge could bring more benefit for risk mitigation.

3.2. Joint Importance of Bridge Set

The M I -based importance metric is for individual bridges, since retrofitting the top-ranked bridges may not be the optimal strategy because the second-order effect of a retrofitted bridge on the remaining bridges is not considered. In other words, from the perspective of feature selection, given a selected feature, the dependencies between the remaining features and the target variable will change. Given λ i 1 , the conditional M I between λ i 2 and φ can be computed as:
M I ( λ i 2 ; φ | λ i 1 ) = p ( λ i 2 , λ i 1 , φ ) log [ p ( λ i 2 ; φ | λ i 1 ) p ( λ i 2 | λ i 1 ) p ( φ | λ i 1 ) ] d λ i 2 d λ i 1 d φ
where p ( λ i 2 , λ i 1 , φ ) is the joint PDF of λ i 2 , λ i 1 , and φ ; p ( λ i 2 , φ | λ i 1 ) , p ( λ i 2 | λ i 1 ) , p ( φ | λ i 1 ) are conditional PDF under given λ i 1 . M I ( λ i 2 ; φ | λ i 1 ) indicates the amount of information λ i 2 brings to φ that does not belong to λ i 1 . Then the joint mutual information between { λ i 1 , λ i 2 } and φ can be converted into the following:
J M I ( { λ i 1 , λ i 2 } ; φ ) = M I ( λ i 1 ; φ ) + M I ( λ i 2 ; φ | λ i 1 ) = M I ( λ i 1 ; φ ) + M I ( λ i 2 ; φ ) + M I ( λ i 2 ; φ | λ i 1 ) M I ( λ i 2 ; φ ) I n t e r a c t i o n
where the interaction term represents the interactive effect between λ i 1 and λ i 2 for target variable φ . If the interaction term is positive, it indicates a complementary effect between the two features; a negative interaction term indicates that the two features are redundant. Equation (9) is also known as the additional rule for mutual information, based on which the J M I between multiple features λ m and the target variable φ can be obtained:
J M I ( λ m ; φ ) = p ( λ m ; φ ) log [ p ( λ m ; φ ) p ( λ m ) p ( φ ) ] d λ m d φ = i = 1 m M I ( λ i ; φ | λ 1 , , λ i 1 )
By comparing the values of J M I , we can prioritize the candidate bridge sets for network risk mitigation. The optimization problem of Equation (5) is then transformed into the following feature subset selection problem:
λ m * = arg max m < n J M I ( λ m ; φ )

3.3. Computational Efficiency

For the retrofit problem of the transportation network discussed in this paper, the majority of the computation cost comes from repeated calculation of the network functionality under various damage scenarios, since other numerical calculations are nearly negligible for a computer. In a specific transportation network, the computing time of network functionality under each damage scenario is similar. Therefore, the execution times of the functionality calculation procedure can be used to measure the computational cost of an algorithm, also known as time frequency T ( n ) .
In order to obtain the exact solution of Equation (5) in Section 2, the network functionality of each enumerated damage scenario must be calculated, so the time frequency is T ( n ) = ( n s ) n , considering the n s possible damage states of each bridge. Since the number of bridges is at the exponential position, the computational cost increases significantly with the rise of problem dimension. Then, if MCS is used to estimate the network risk under each retrofit strategy and the sample size is set to be N s , the time frequency becomes T ( n ) = C n m   N s . This is a typical NP-hard problem, so heuristic algorithms are usually needed to find the approximate optimal solutions. Taking the genetic algorithm [67] as an example, the time frequency can be reduced to T ( n ) = N G e n · N C h r o m · N s , where N G e n is the number of genetic generations and N C h r o m is the population number of each generation. However, as the dimension of problem rises, the required values of N G e n , N C h r o m , and N s for computation also increase, which makes the analysis of large-scale transportation networks still unacceptably time-consuming.
In contrast, the method proposed in this paper aims at capturing the internal relationship between bridge damage uncertainties and the network seismic risk, rather than directly comparing the failure probabilities of various retrofit options. Based on the above illustration, the computation of J M I needs to establish P ( λ m ) , P ( φ ) and P ( λ m , φ ) , directly calculating which requires a time-consuming enumeration process. Considering the problem of feature subset selection is typically based on a limited set of data samples, we can also evaluate the importance of bridges based on a representative sample set. Given a set of stochastic samples that takes into account various uncertainties, the above probabilities can be estimated by counting the number of scenarios that match specific conditions in the sample set. This is a similar idea as using MCS to estimate the post-earthquake network functionality level instead of enumerating all damage scenarios. However, the difference is that the proposed joint importance-based method only relies on one set of stochastic samples, rather than re-sampling for each candidate retrofit strategy. So the computing time frequency of the proposed method is T ( n ) = N s , which only depends on the size of the sample. This high computing efficiency makes it easier to scale up to the analysis of large networks. In the following example, we also use the most common MCS for sampling to illustrate the applicability of the proposed method.

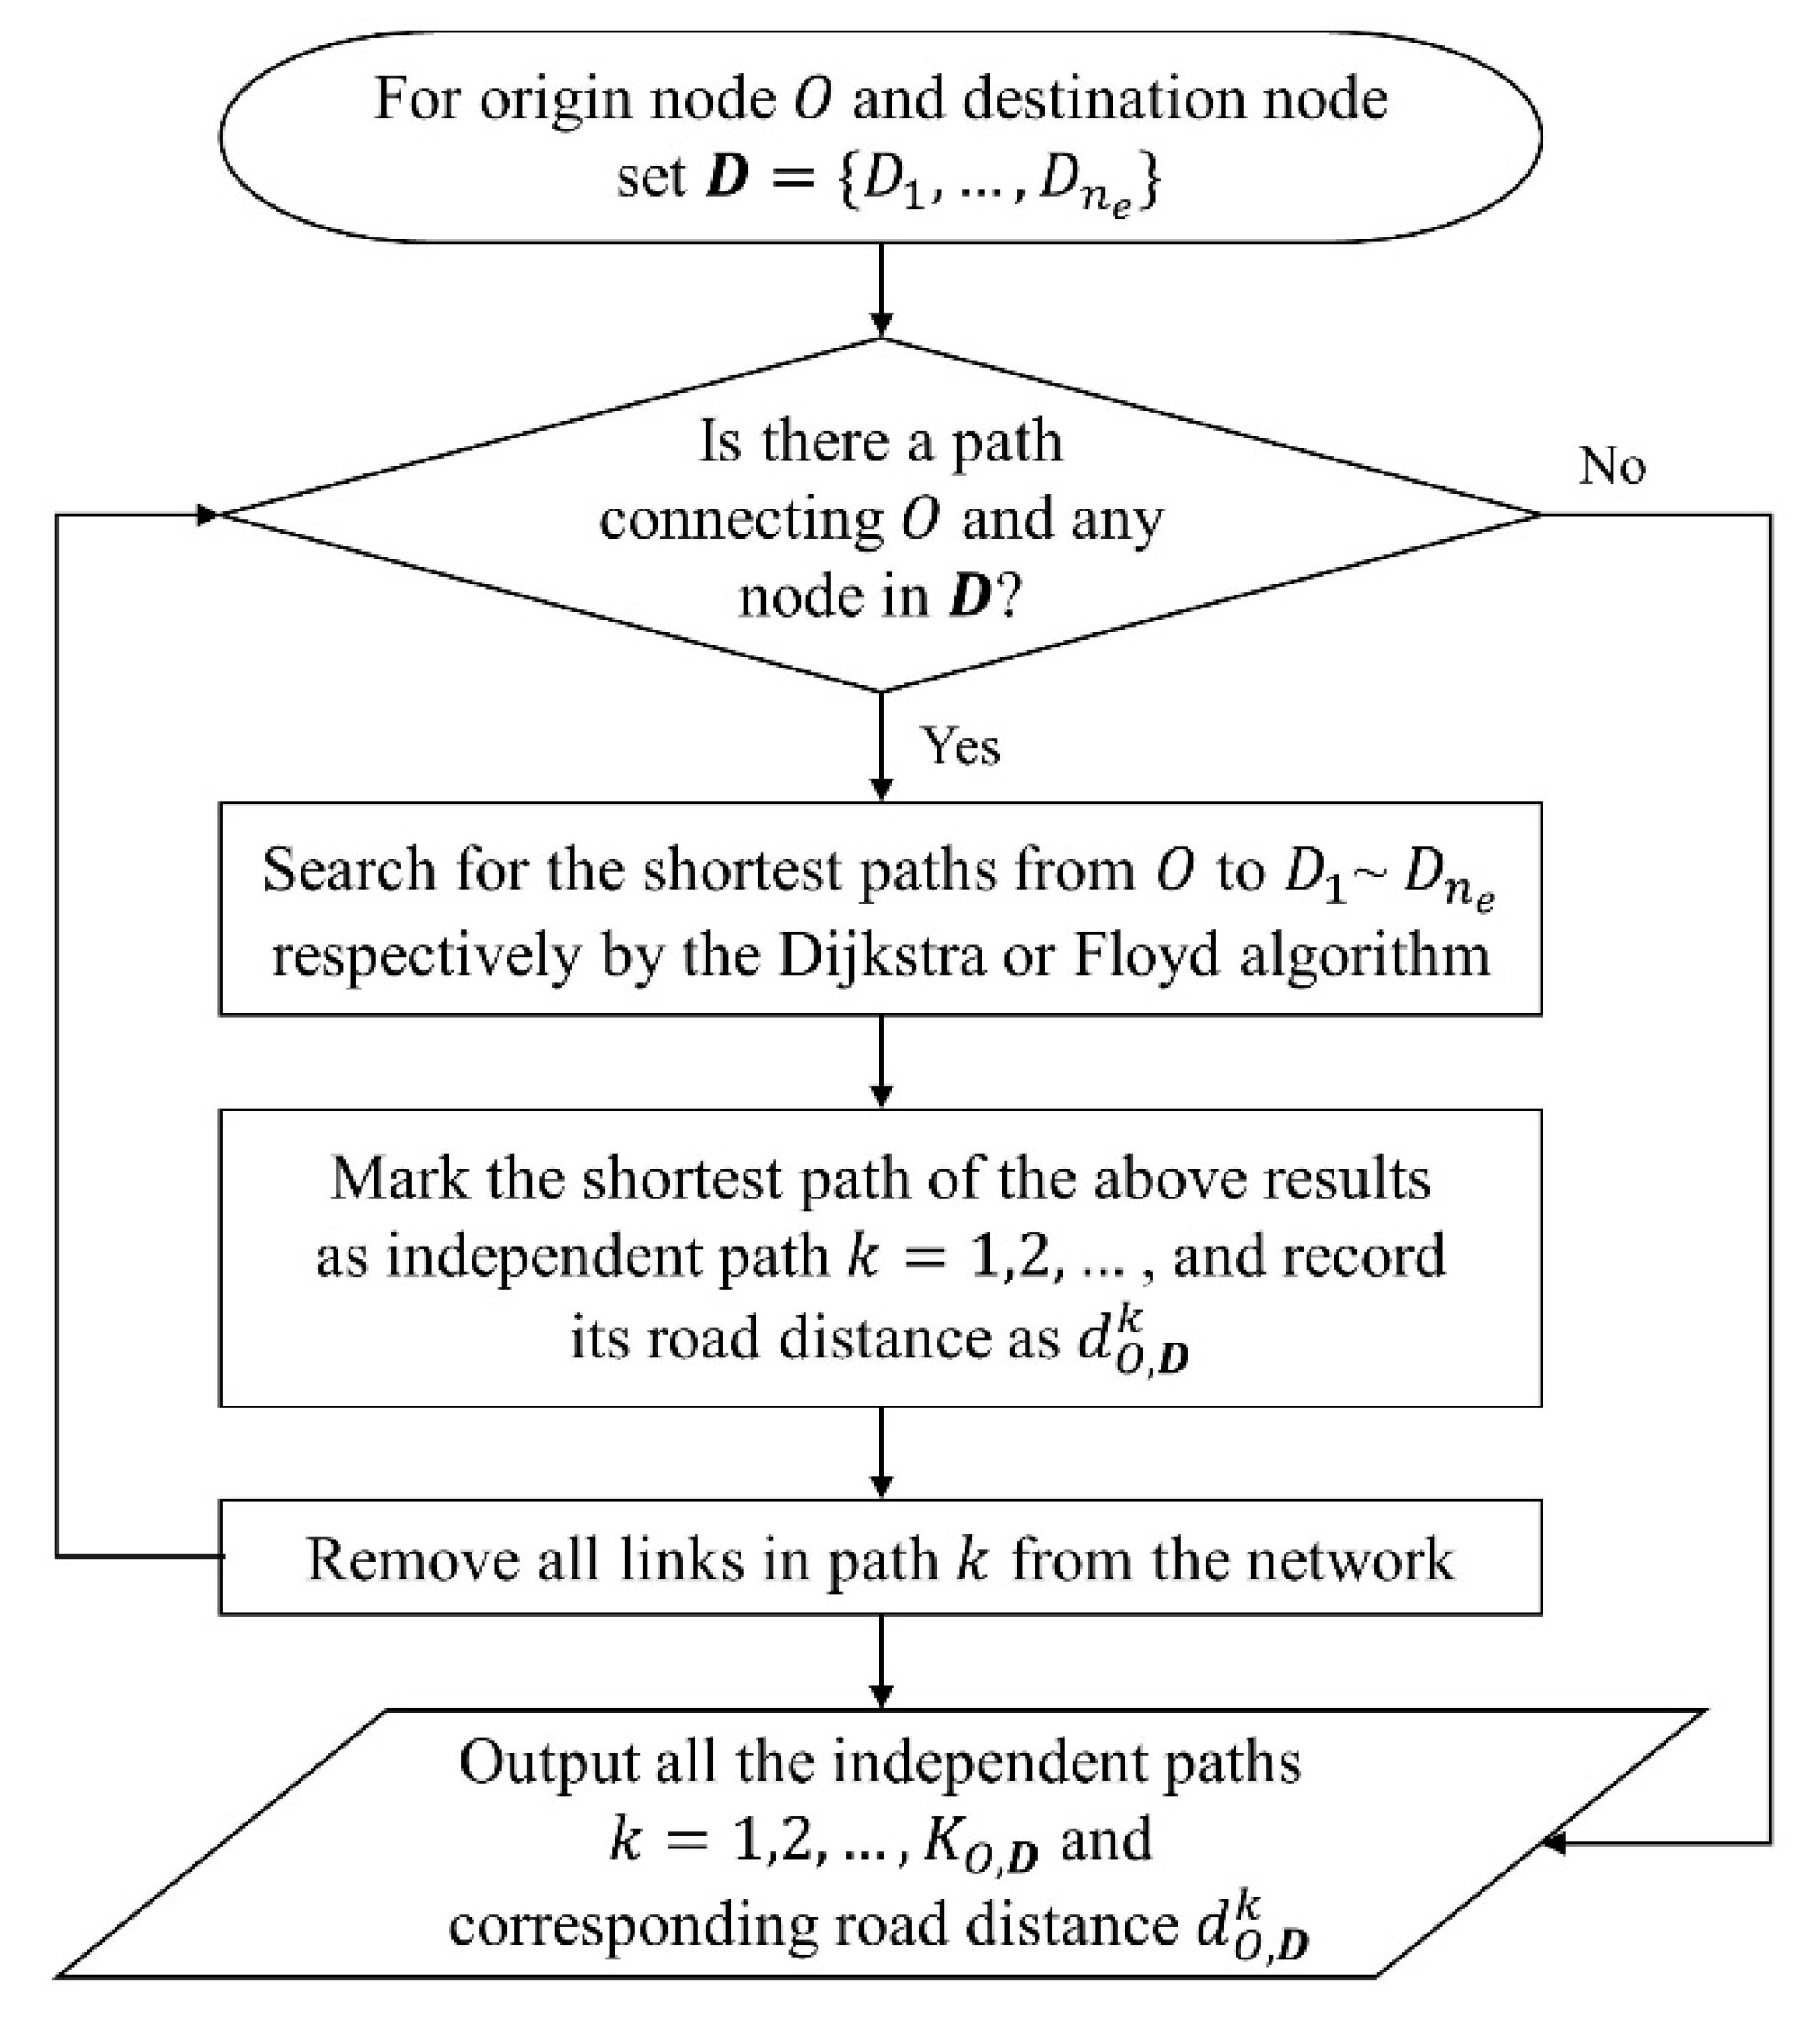
4. Network Functionality of Emergency Response

In the post-earthquake chaotic environment, the transportation network is considered as one of the most significant infrastructure systems to support emergency response activities, and the disruption of transportation networks could lead to additional casualties, economic losses and secondary disasters [43,68,69,70,71]. Maintaining effective connectivity between affected areas and the emergency facilities has always been recognized as the immediate priority following a major earthquake [40,72,73,74]. In this paper, we utilize an improved connectivity-based model to evaluate the post-earthquake network functionality of emergency response [75].

4.1. Network Performance Metric

In transportation networks, the connectivity between origin and destination (OD) is usually measured by their shortest path distance [76,77,78] or number of redundant paths [62,79]. The former is commonly obtained by the Dijkstra [80] or Floyd [81] algorithm, and the latter can be measured by OD-based independent paths, which is considered to be a good measure of network redundancy in recent studies [23,82]. In the following, an improved connectivity-based network performance metric is introduced to take into account both emergency transportation redundancy and path distances.
Considering that there are usually several parallel emergency facilities (e.g., hospitals) in an urban transportation network, the post-earthquake network performance should fully account for the contribution of these emergency resources, rather than considering only the nearest facility. Therefore, a novel path search algorithm that captures the dual redundancy of emergency facilities and network paths is presented as shown in Figure 1. This algorithm could obtain all the independent paths between a rescue demand node O and the emergency destination set D = { D 1 , , D n e } , without reused network links. Furthermore, based on the idea of network efficiency, we measure the contribution of each independent path to the emergency connectivity performance by the reciprocal of its path distance. Then the connectivity performance between origin O and destination set D = { D 1 , , D n e } is defined as:
I P E O , D = k = 1 K O , D 1 d O , D k
where I P E O , D is the independent path-based efficiency, d O , D k is the distance of k th independent path in kilometers, and K O , D is the total number of searched independent paths between O and D . The integral network performance of emergency response is quantified as the average emergency connectivity of all the normal nodes that need emergency rescue in the network:
G = 1 n O O = 1 n O I P E O , D
where n O is the number of normal nodes in the network.

4.2. Post-Earthquake Network Functionality

In seismic analysis of transportation network, it is a common model to map the degraded serviceability of a link according to its damage condition. In this paper, based on the ‘bottleneck’ assumption, the damage state of a network link is considered to be equal to that of the most damaged bridge on the link, and the adopted mapping relationship is given in Table 1. However, in the topology space, it is difficult to consider the impact of multiple damage states on network performance. In this study, a penalty-based approach is used to address the issue. The idea is that it takes longer than normal to get through a degraded link due to bad road conditions and traffic congestions caused by reduced serviceability, which is equivalent to a longer journey for travelers. The length measurement can be incorporated into network connectivity analysis. Specifically, the serviceability of a network link is considered to be equal to that of the most damaged bridge on the link according to the ‘bottleneck’ assumption, and the degraded serviceability is transformed into a penalty for the length of the link in network topology. In this paper, the penalty coefficient of a link is assumed to be inversely proportional to the remaining rates of its traffic capacity and travel speed, and the post-earthquake penalized length of a link, l p , can be computed as:
l p = l 0 r D S j c r D S j s
where l 0 is the physical length of the link; r D S j c and r D S j s are respectively the residual rate of traffic capacity and travel speed, which is referred to Table 1 according to the damage level of links. Then the post-earthquake network performance is calculated based on the converted network topology composed of penalized links. The normalized network functionality measurement is written as:
Q = G p o s t G p r e
where G p o s t and G p r e are the post-earthquake and initial network performance value, respectively. A more detailed formulation and algorithm of the network emergency response functionality can be found in literature [75].

5. Illustrative Example

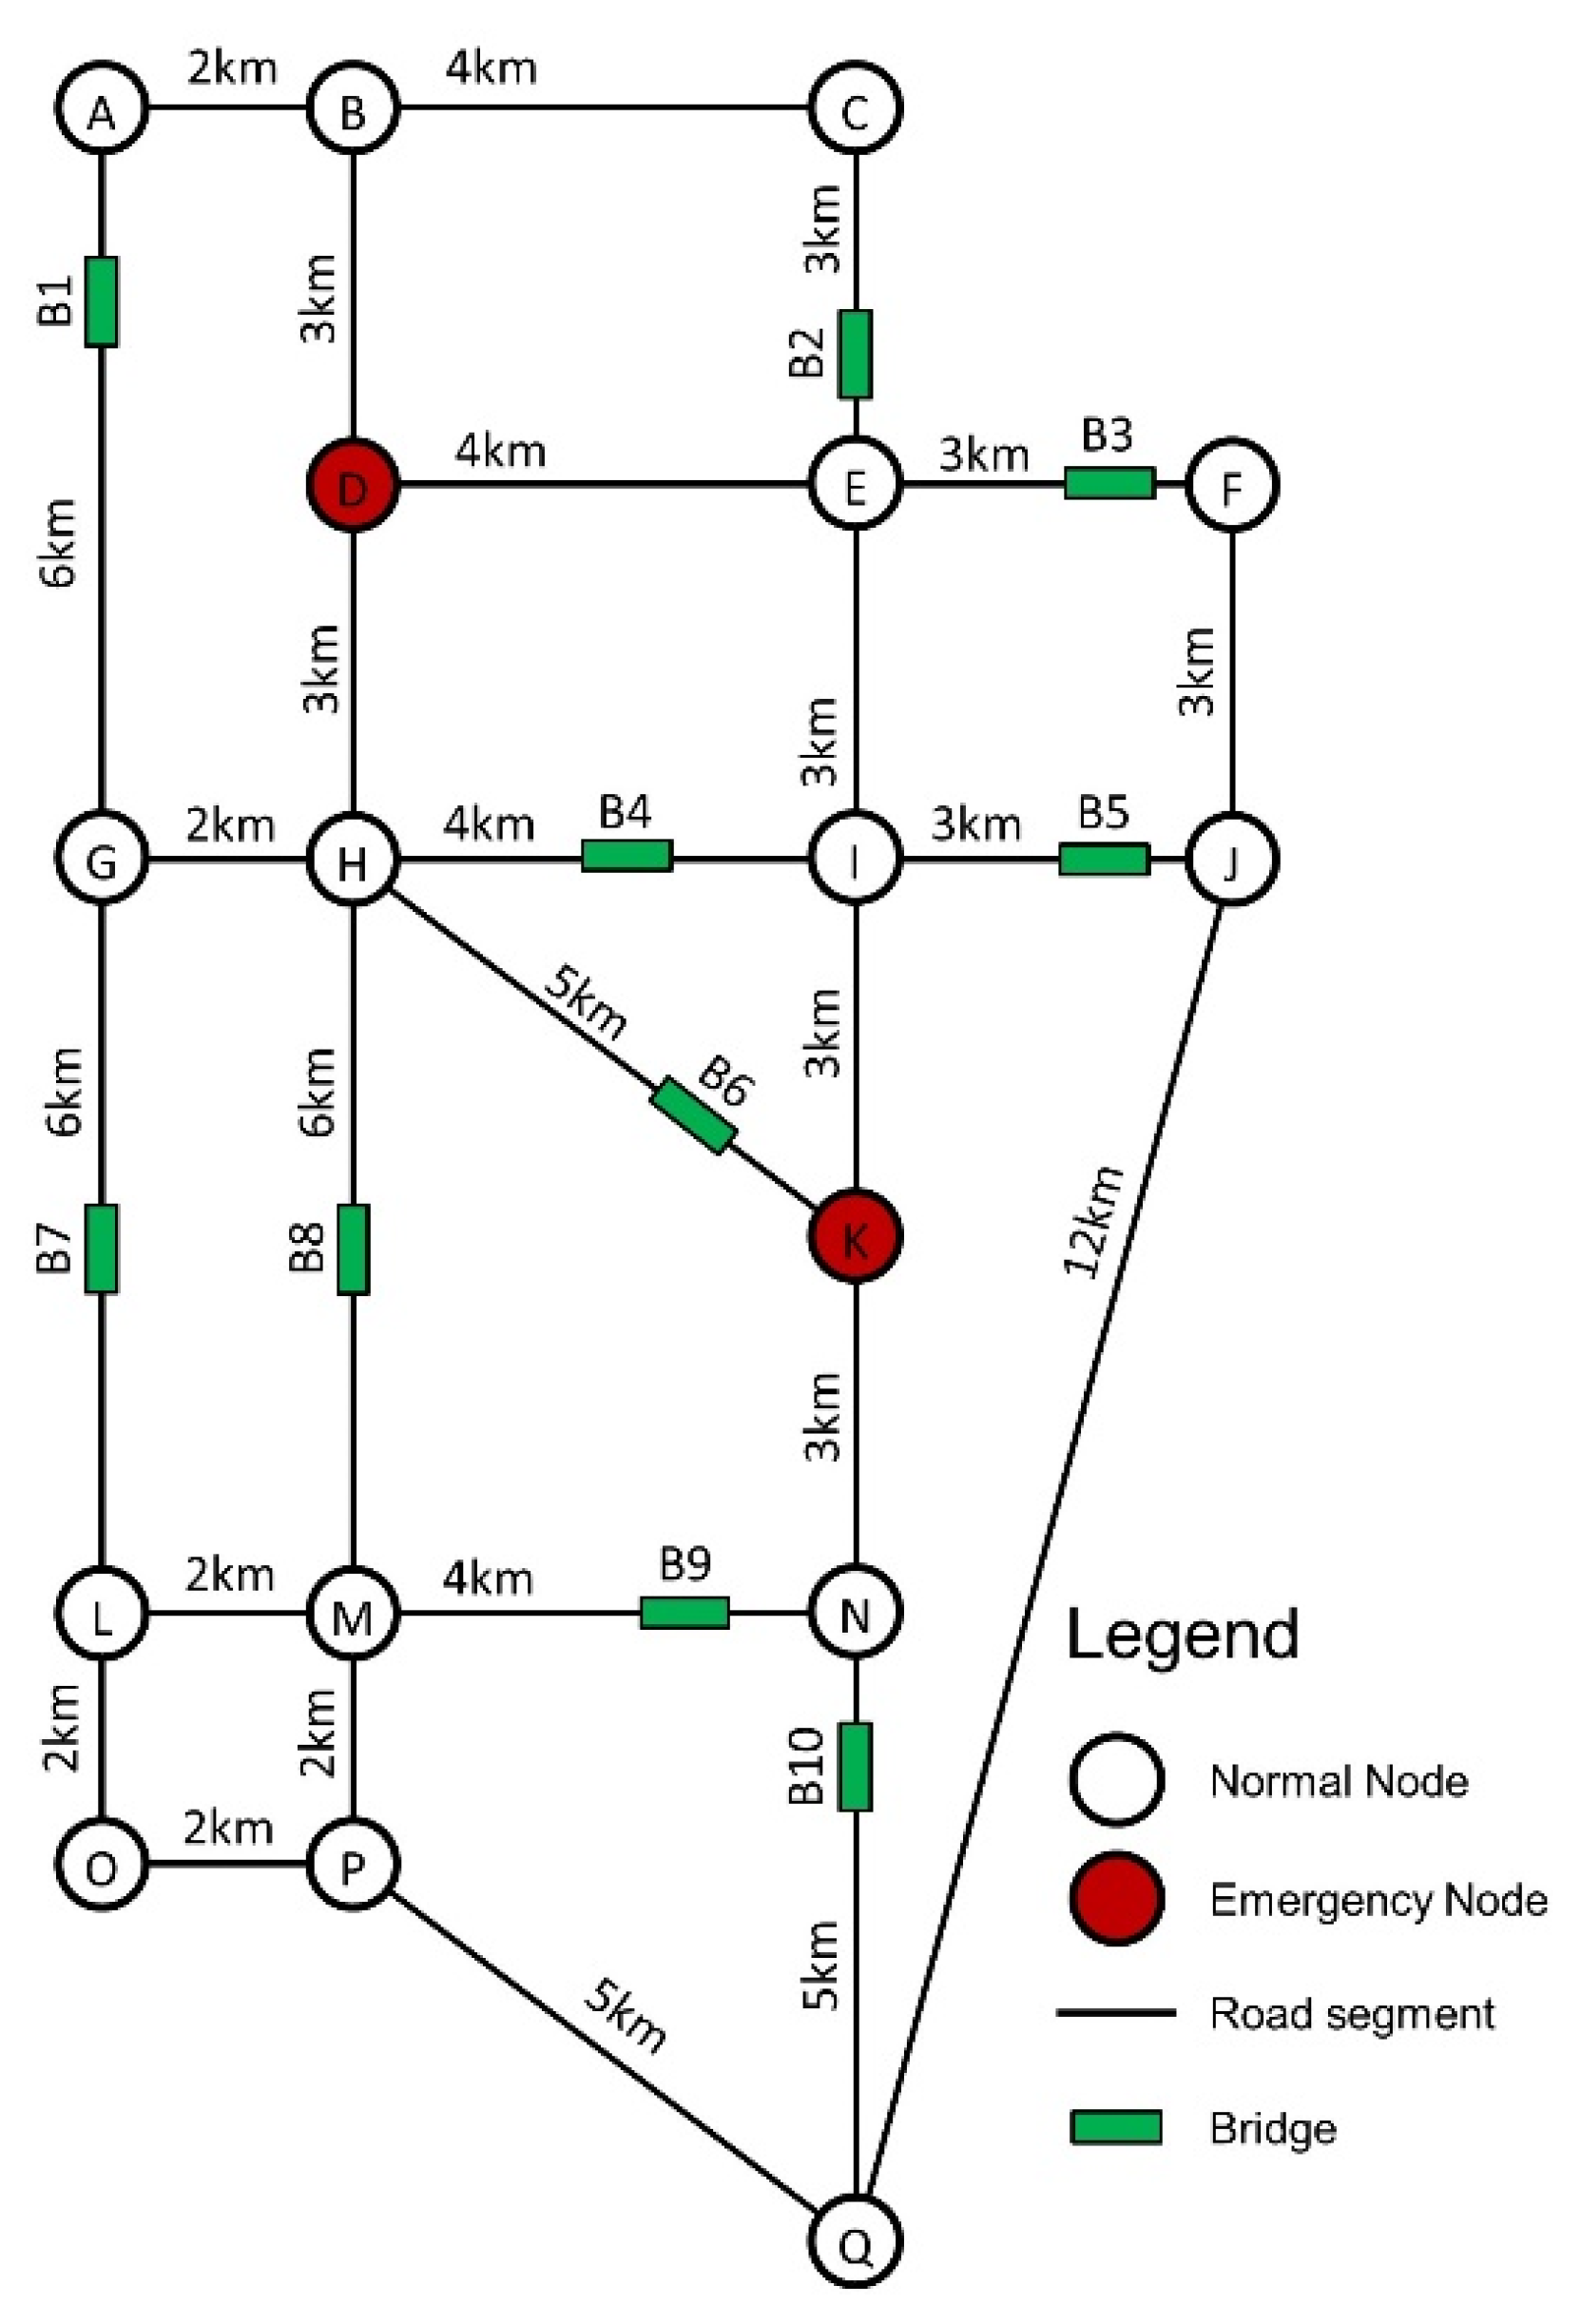
5.1. Transportation Network Parameters

In this section, we utilize a small hypothetical network to implement the enumeration and obtain real optimal solutions for comparison, so as to verify the applicability of the proposed method. The network, consisting of 17 nodes, 26 links, and 10 bridges, as well as the initial length of each link, are shown in Figure 2. In the network, node D and K are the emergency nodes and the others are normal nodes. In the example, the 10 bridges are considered as the only vulnerable components and retrofit candidates in the network. Since bridges often show different seismic vulnerability due to the difference in structural types and construction ages, two classes of fragility parameters are assumed for the bridges as listed in Table 2. On this basis, we construct four network cases with different initial vulnerability conditions to investigate the impact of damage uncertainty on retrofit decisions, as given in Table 3. In the hypothetical transportation network, we consider a global MMI = 7.0 (PGA = 0.27 g) earthquake instead of the PSHA-based earthquake intensity simulation, since this is not the focus of this paper. Therefore, the uncertainty of network damages is completely determined by the vulnerability of bridges, which makes the comparison of different cases easier and clearer.

5.2. Seismic Risk and Mitigation Strategy

The seismic risk of transportation network described by Equation (2) is determined by p ( λ ) and φ ( λ ) . p ( λ ) can be calculated by the ground-motion intensity and vulnerability parameters of bridges, and φ ( λ ) is calculated by assuming that the control value is Q c = 0.9 for MMI = 7.0 in this example. With the assumption, the initial failure probability of each network case is: 75.33% for Case 1, 21.31% for Case 2, 53.45% for Case 3, and 49.90% for Case 4. For risk mitigation, the retrofit behavior of a bridge can be considered by scaling the median value of ground motion intensity in its fragility function [45,83]. In the example, the magnifications for medians are respectively assumed to be 155%, 175%, and 204% for slight, moderate, and extensive damage states, which corresponds to the full steel jacketing reinforcement [84,85].
According to the retrofit decision model in Section 2, we calculate the post-earthquake network functionality of all possible damage scenarios to obtain the real optimal solution of Equation (5). In this example, the total number of enumerated scenarios is 4 10 = 1,048,576 , considering 4 damage levels (i.e., none, slight, moderate, and over extensive) for each bridge based on Table 1. For efficient decision-making on retrofit strategy, we compare the performance of four bridge importance ranking approaches. The first approach is based on the betweenness centrality (BC), which is defined as the sum of the proportions of the shortest paths passing through a bridge to the total number of shortest paths between each node pair. The larger BC value indicates a stronger role of the bridge in the whole network topology. The second approach is based on the removal effect (RE) of individual bridges on the network functionality. The lower the value of residual functionality, the higher the importance of the bridge to maintain the initial functionality of the network. The other two approaches are based on MCS as introduced in Section 3. In this example, the sample size is set to be N s = 10000 , the computational cost of which is about 1/100 of the enumeration method. This number is selected to simulate real engineering applications while ensuring the diversity of samples. Specifically, the third approach is based on the individual importance (MI) of bridges according to Equation (7), and the fourth approach is based on the joint importance (JMI) of bridge sets calculated by Equation (10). In the following, we will analyze and discuss the mitigation performance and strategy accuracy of the four importance ranking approaches in detail.

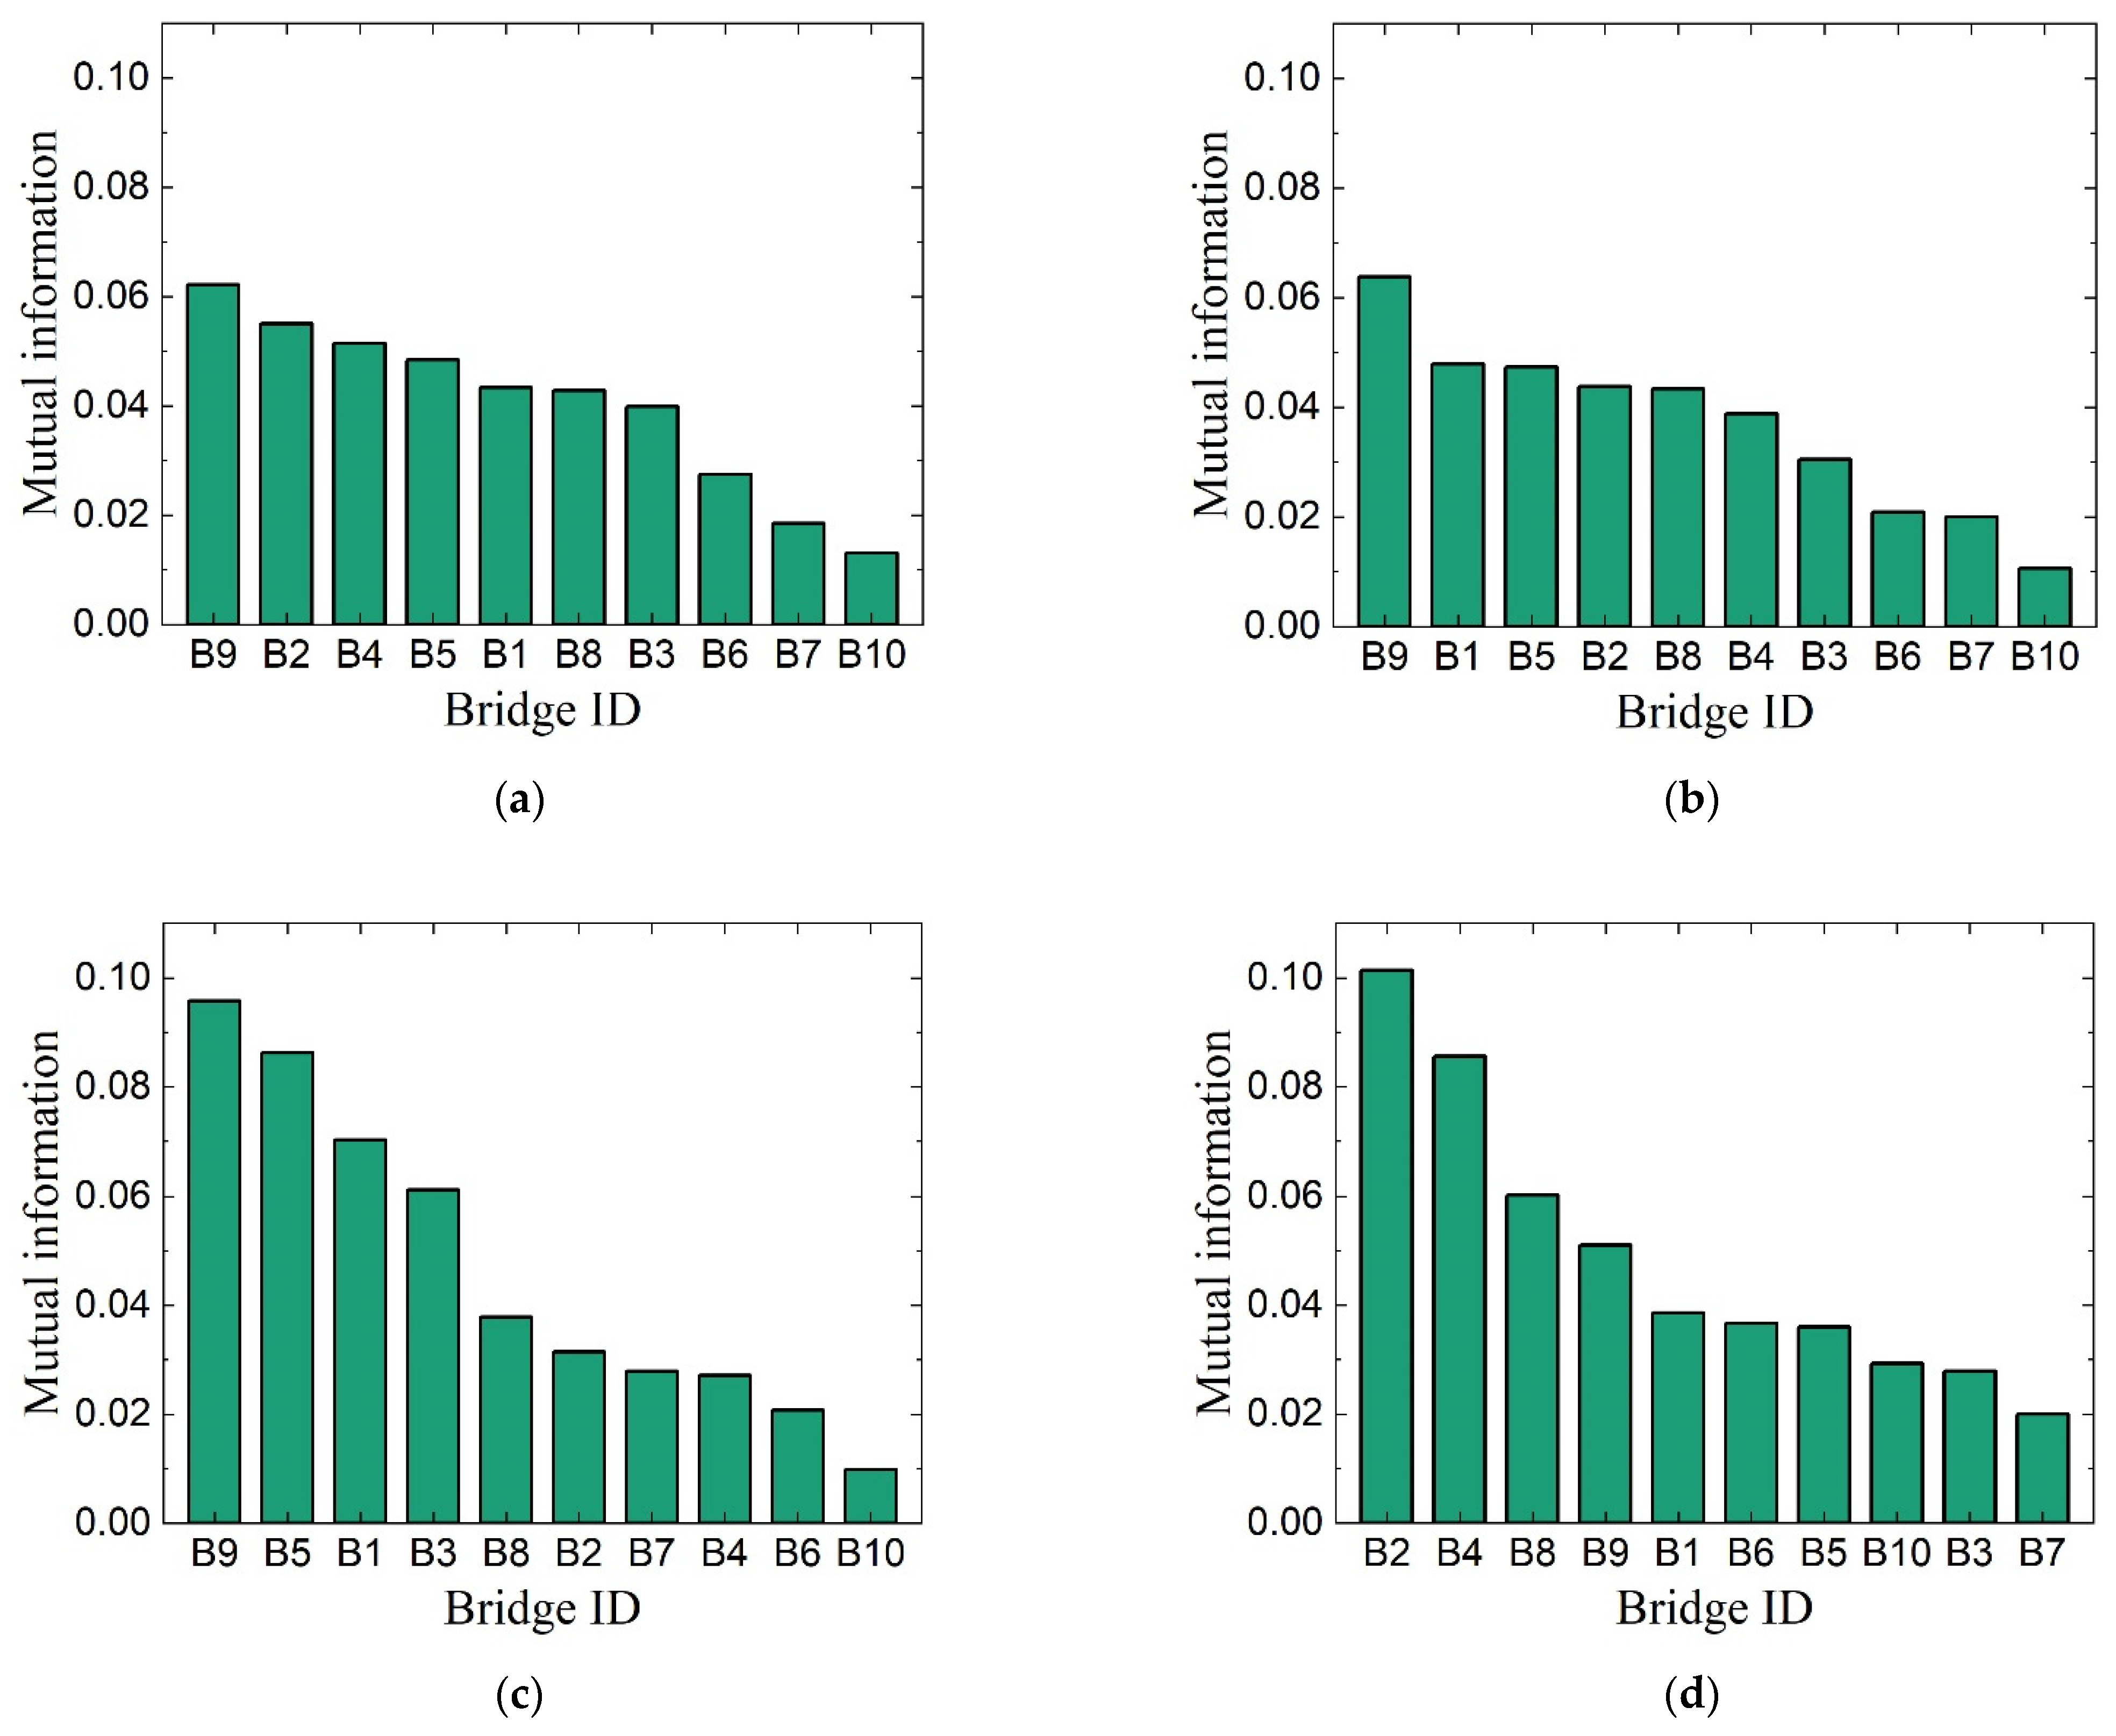
5.3. Importance Ranking of Bridges

The importance ranking of bridges in the transportation network based on betweenness centrality and removal effect are shown in Figure 3. As can be seen that, there is a big difference between the results of these two approaches, because BC-based importance is irrelevant to the network functionality concerned, and RE-based importance is determined by specific network functionality. The results of both approaches do not change from case to case because the impact of damage uncertainty is not considered.
On the contrary, MI-based importance ranking varies in different cases as shown in Figure 4. The results of Case 1 and Case 2 are relatively close, but differ greatly from those of Case 3 and Case 4, indicating that the change of the overall vulnerability of the bridges has little impact on the ranking, and the vulnerability difference between bridges has a dramatic impact on the ranking. Specifically, in Case 3 and Case 4, the MI-based importance of bridges with high vulnerability increase, such as B2 and B4 in Case 4. This means that the MI-based retrofit strategy will give priority to bridges with high vulnerability, which is consistent with the general understanding in engineering practice. Note that the JMI-based importance ranking is not exhibited because it ranks the bridge sets rather than individual bridges, and will be discussed later.

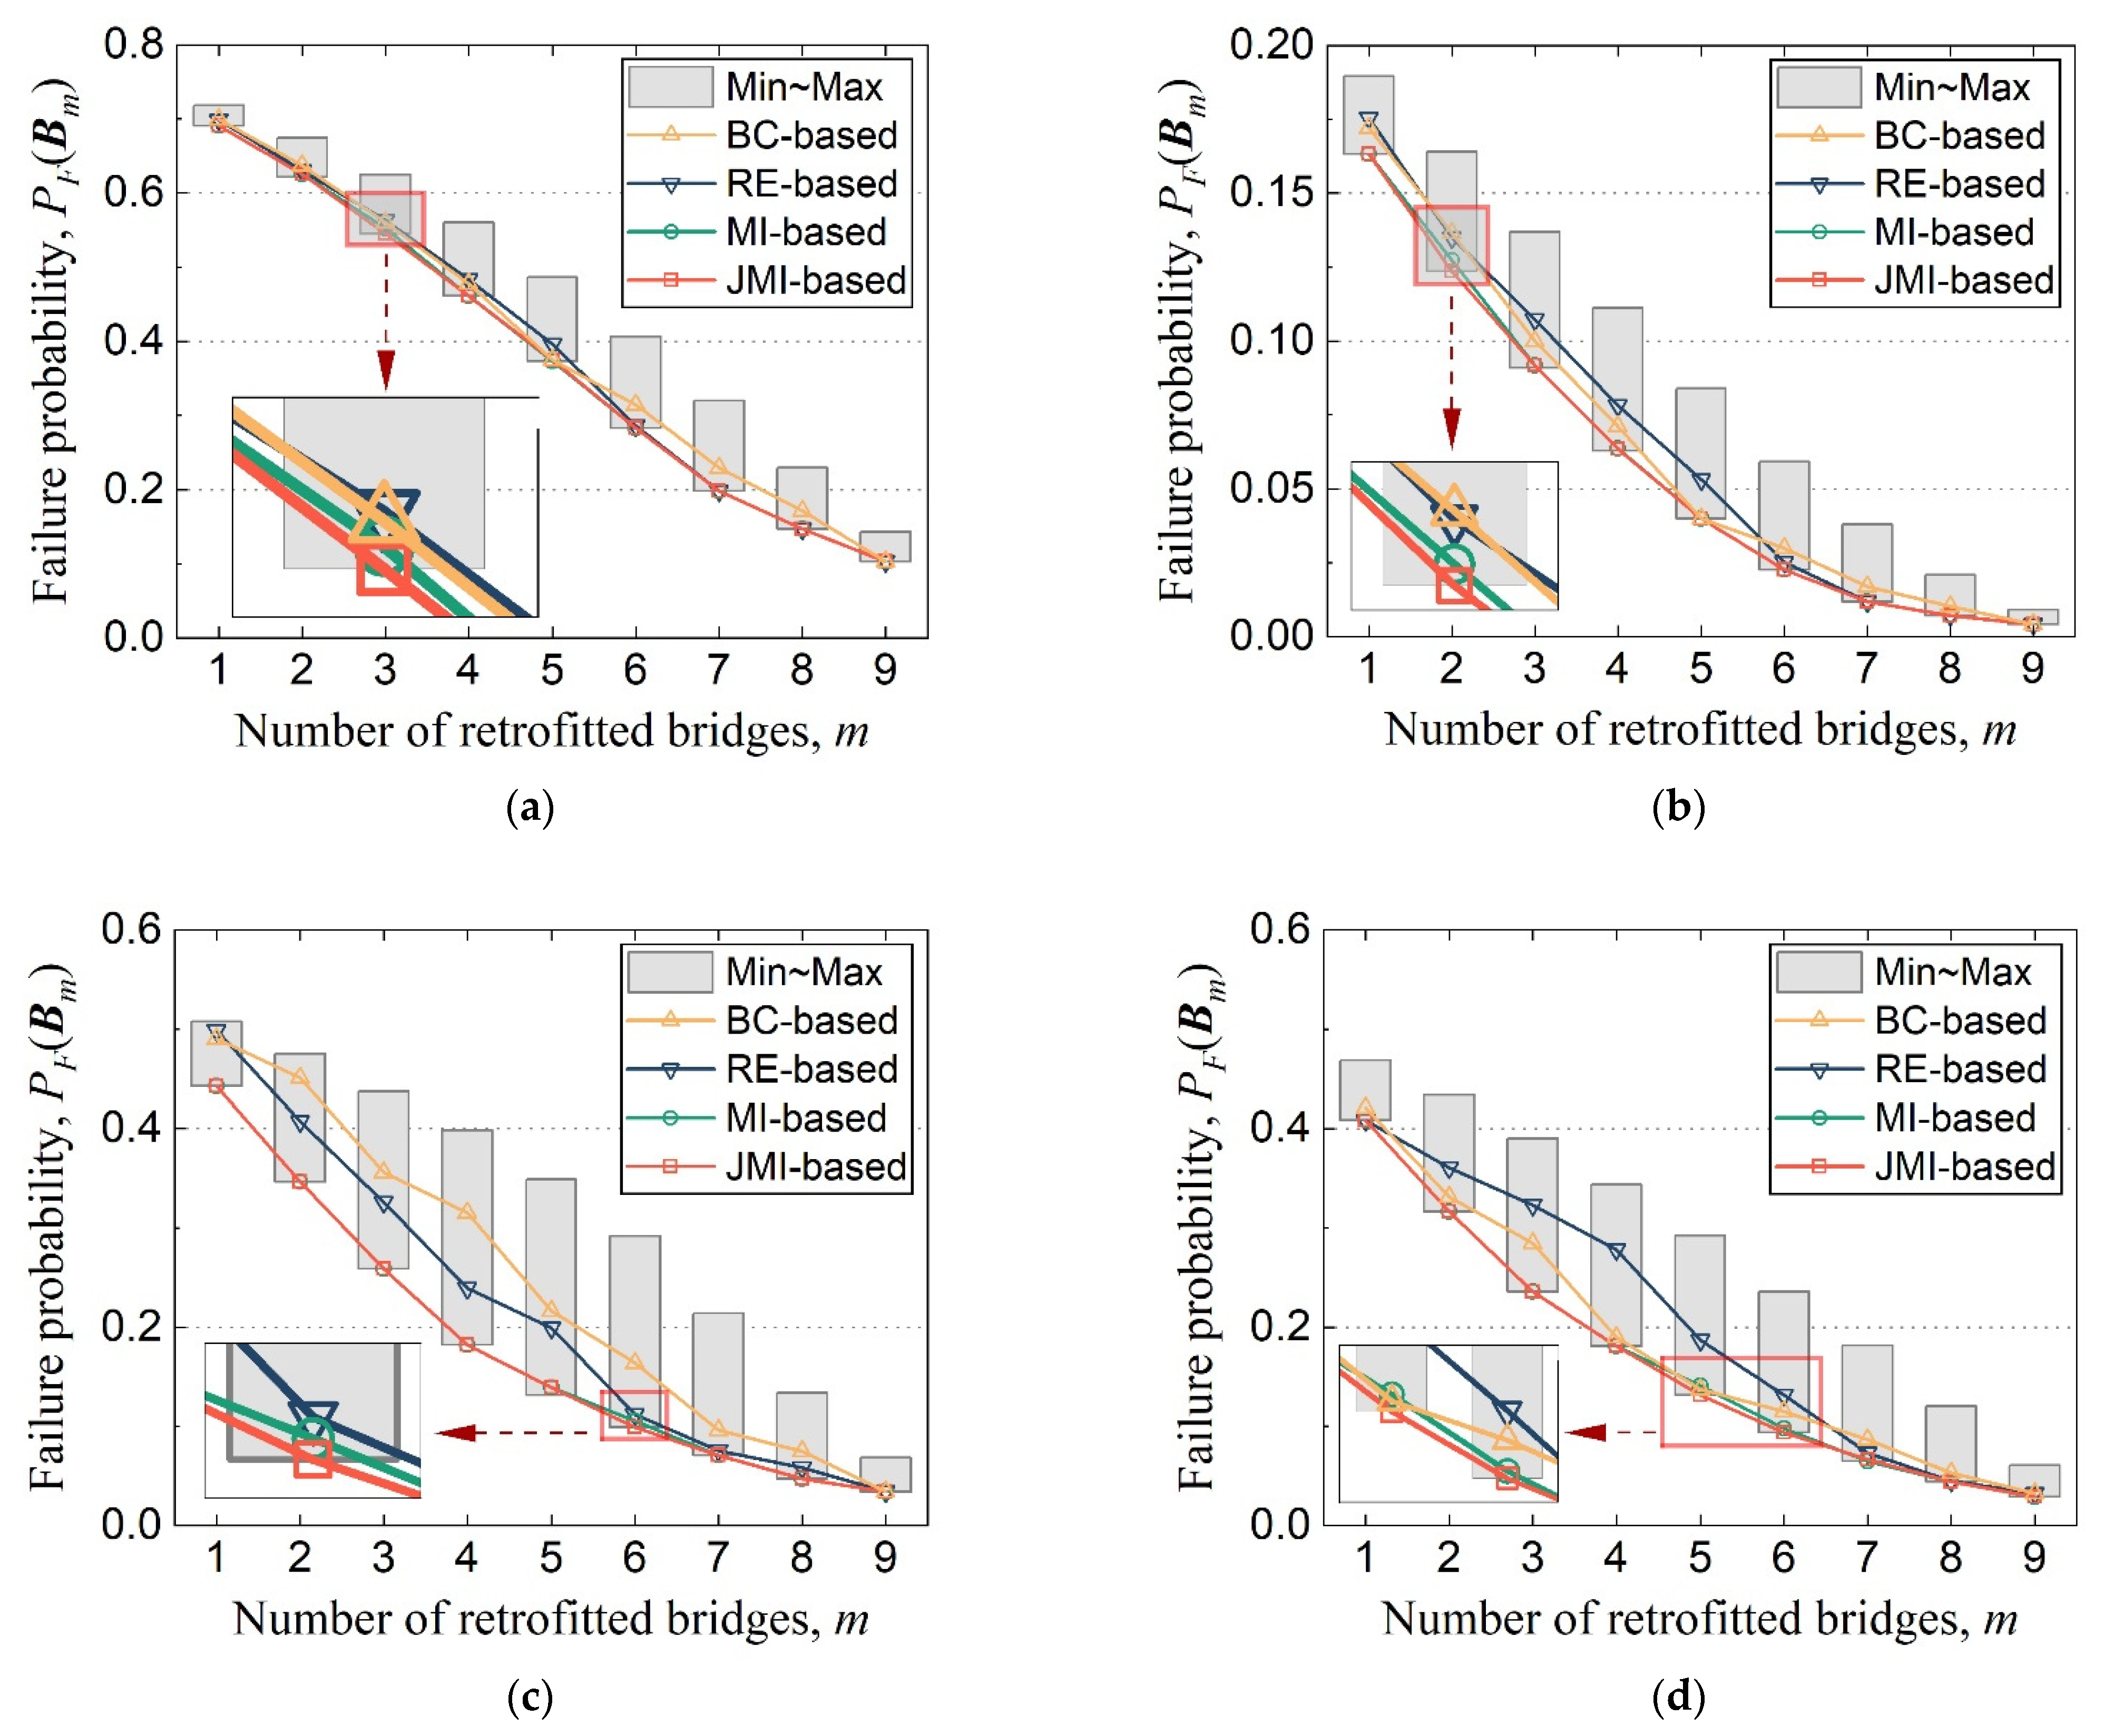
5.4. Performance of Mitigation Strategies

Under a given m , BC-based, RE-based, and MI-based strategies select the bridges one by one according to their importance ranking, and the JMI-based strategy is identified as the bridge set with the highest joint importance value. The most direct way to measure the performance of different mitigation strategies is to compare their effects on reducing the failure probability of the network. The failure probabilities based on the four importance ranking approaches as well as the possible failure probability interval calculated by enumeration are given in Figure 5 under different conditions. It can be seen from the figure that the results of BC-based and RE-based strategies have an obvious gap with the minimum failure probabilities (i.e., optimal solutions), especially in Case 3 and Case 4 with different bridge vulnerabilities. In contrast, both MI-based and JMI-based strategies show good risk mitigation performance in all cases, and the JMI-based strategy performs even better in some situations as enlarged in Figure 5. Indeed, the JMI-based approach can be taken as a revision of the MI-based ranking by considering the second-order interactive effect between the selected bridges and the candidate bridges through Equation (9). For example, under the problem of m = 2 in Case 2, the MI-based approach selects B9 and B1 according to Figure 4b, however, the JMI-based approach selects B9 and B5 because they have better complementary effect, which is reflected in M I ( λ 5 ; φ | λ 9 ) = 0.055 > M I ( λ 1 ; φ | λ 9 ) = 0.053 . Similarly, under the problem of m = 6 in Case 3, the JMI-based approach selects {B1, B3, B5, B7, B8, B9} instead of {B1, B2, B3, B5, B8, B9} because M I ( λ 7 ; φ | { λ 1 , λ 3 ,   λ 5 , λ 8 , λ 9 } ) = 0.098 > M I ( λ 2 ; φ | { λ 1 , λ 3 ,   λ 5 , λ 8 , λ 9 } ) = 0.081 . Table 4 lists the sum of the failure probability gaps between each strategy and the optimal solution, where the total deviation of the MI-based strategy is less than 2% and that of the JMI-based approach is less than 1% in each case.
In addition to the selection of retrofitted bridges, a reasonable budget is also a key concern to decision makers. However, the decision making on budget is often a more complex problem and requires more computation. Taking the problem in this paper as an example, investigating the optimal budget needs to estimate the minimum network failure probability for each value of m . This computational burden is terrible for the resource-constrained decision models that are widely proposed. However, the method presented in this paper could provide an easy access to the problem. Specifically, the JMI values of all m values can be calculated based on the same sample set, and thus generate little extra computation. Considering that the failure probability gap between the JMI-based strategy and the optimal solution is quite small, the investment benefit of a budget can be approximately estimated by JMI analysis combined with MCS within a low computation cost, because only one MCS is needed for the JMI-based strategy per m value, instead of solving the optimization problem at each m value. With the JMI-based curve as shown in Figure 5, the decision makers could know the relationship between the value of m and the mitigation benefit in advance, so as to make a better investment decision.

5.5. Discussion of Efficiency and Accuracy

Among all the approaches tested above, BC-based and RE-based approaches are of the highest efficiency, but the performance of their results is low, especially for cases with different bridge vulnerabilities. On the contrary, MI-based and JMI-based approaches presented in this paper have a significant improvement in mitigation performance but are less efficient. However, as verified in this example, the proposed method could provide a great approximate to the real optimal solution, but the computational cost is only 1/100 of the enumeration method. Given that this is a sample-based method, the number will be much smaller when dealing with multidimensional problems, which is impossible for heuristic algorithms.
In addition to the seismic mitigation performance discussed above, a more detailed comparison is how accurate the JMI-based retrofit strategy is as an alternative to the optimal solution. Table 5 lists the optimal strategy and the JMI-based retrofit strategy in each case, where the different selected bridge ID is shaded. As indicated, the accuracy of the JMI-based retrofit strategy is overall very high, and the slight difference mainly occurs on the bridges with close MI values. Note that the difference comes from two aspects. One is that the proposed method, which greatly increases the decision efficiency, is essentially an approximation approach based on feature selection, the other is that the randomness in MCS could introduce errors in the estimation of MI and JMI values.
The sample size in this example is arbitrarily set as 10,000 to verify the applicability of the proposed method. However, in engineering practice, the users need to decide on a reasonable number of samples to balance the computational efficiency and accuracy, and other refined stochastic sampling algorithms are also recommended, which do not affect the use of the proposed methodology.

6. Conclusions

The seismic retrofit decision on transportation network is a stochastic optimization problem with high dimensional uncertainty. Most current approaches use heuristic algorithms combined with MCS to find the optimal solutions, but still face terrible computational pressure. To address the issue, this paper introduces an efficient alternative methodology that can greatly reduce the computational burden of the retrofit problem. Based on the idea of feature subset selection, the proposed method transforms the complex stochastic optimization problem into the joint importance-ranking problem of bridge sets. Different from traditional importance-based methods, the proposed method integrates the uncertainty of multiple damage states as well as their effects on network functionality. More importantly, it considers the interactive effect between candidate components.
The proposed method is applied to the mitigation problem of seismic emergency risk on a hypothetical transportation network. The results show that, based on only a small set of stochastic samples, the MI- and JMI-based approaches both perform excellently in risk mitigation and the JMI-based strategy provides a great approximation to the real optimal solution. Overall, compared with enumeration and heuristic optimization methods, the proposed method could provide reliable and stable retrofit advice for decision makers with high efficiency, which results in a good engineering application prospect, especially for large-scale transportation networks with high computational complexity.
In addition, this study still has some limitations to be further expanded, for instance, to incorporate seismic analysis of complex components and to explore the impact of the correlation effect between earthquake intensities.

Author Contributions

Investigation, K.L. and C.Z.; Methodology, K.L. and C.Z.; Project administration, C.Z.; Software, K.L.; Supervision, C.Z. and X.M.; Validation, K.L.; Writing—original draft, K.L.; Writing—review and editing, C.Z. and X.M. All authors have read and agreed to the published version of the manuscript.

Funding

This research was funded by the National Natural Science Foundation of China (No. 51938004, 51825801, U1939210, and 51921006), Heilongjiang Postdoctoral Science Foundation (No. LBH-Z16085), and Natural Science Foundation of Heilongjiang Province (No. LH2019G006).

Acknowledgments

The opinions and conclusions presented in this paper are those of the authors and do not necessarily reflect the views of the sponsoring organizations.

Conflicts of Interest

The authors declare no conflict of interest.

References

  1. Goda, K.; Kiyota, T.; Pokhrel, R.M.; Chiaro, G.; Katagiri, T.; Sharma, K.; Wilkinson, S. The 2015 Gorkha Nepal Earthquake: Insights from Earthquake Damage Survey. Front. Built Environ. 2015, 1, 1–8. [Google Scholar] [CrossRef]
  2. Meroni, F.; Squarcina, T.; Pessina, V.; Locati, M.; Modica, M.; Zoboli, R. A Damage Scenario for the 2012 Northern Italy Earthquakes and Estimation of the Economic Losses to Residential Buildings. Int. J. Disaster Risk Sci. 2017, 8, 326–341. [Google Scholar] [CrossRef]
  3. Jacques, C.C.; McIntosh, J.; Giovinazzi, S.; Kirsch, T.D.; Wilson, T.; Mitrani-Reiser, J. Resilience of the Canterbury Hospital System to the 2011 Christchurch Earthquake. Earthq. Spectra 2014, 30, 533–554. [Google Scholar] [CrossRef]
  4. Yuan, Y. Impact of intensity and loss assessment following the great Wenchuan Earthquake. Earthq. Eng. Eng. Vib. 2008, 7, 247–254. [Google Scholar] [CrossRef]
  5. Action Plan for National Recovery and Development of Haiti. Haiti Earthquake PDNA: Assessment of Damage, Losses, General and Sectoral Needs. Assessment 2010. Available online: https://documents1.worldbank.org/curated/en/355571468251125062/pdf/701020ESW0P1190R0Haiti0PDNA020100EN.pdf (accessed on 21 August 2022).
  6. Feng, K.; Li, Q.; Ellingwood, B.R. Post-earthquake modelling of transportation networks using an agent-based model. Struct. Infrastruct. Eng. 2020, 16, 1578–1592. [Google Scholar] [CrossRef]
  7. Zhou, Y.; Wang, J.; Yang, H. Resilience of Transportation Systems: Concepts and Comprehensive Review. IEEE Trans. Intell. Transp. Syst. 2019, 20, 4262–4276. [Google Scholar] [CrossRef]
  8. Rohr, A.; Priesmeier, P.; Tzavella, K.; Fekete, A. System Criticality of Road Network Areas for Emergency Management Services—Spatial Assessment Using a Tessellation Approach. Infrastructures 2020, 5, 99. [Google Scholar] [CrossRef]
  9. Galindo, G.; Batta, R. Review of recent developments in OR/MS research in disaster operations management. Eur. J. Oper. Res. 2013, 230, 201–211. [Google Scholar] [CrossRef]
  10. Shi, Y.; Xiang, Y.; Xiao, H.; Xing, L. Joint optimization of budget allocation and maintenance planning of multi-facility transportation infrastructure systems. Eur. J. Oper. Res. 2020, 288, 382–393. [Google Scholar] [CrossRef]
  11. Li, Y.; Dong, Y.; Frangopol, D.M.; Gautam, D. Long-term resilience and loss assessment of highway bridges under multiple natural hazards. Struct. Infrastruct. Eng. 2020, 16, 626–641. [Google Scholar] [CrossRef]
  12. Toma-Danila, D.; Armas, I.; Tiganescu, A. Network-risk: An open GIS toolbox for estimating the implications of transportation network damage due to natural hazards, tested for Bucharest, Romania. Nat. Hazards Earth Syst. Sci. 2020, 20, 1421–1439. [Google Scholar] [CrossRef]
  13. Gan, L.; Xu, J. Retrofitting Transportation Network Using a Fuzzy Random Multiobjective Bilevel Model to Hedge against Seismic Risk. Abstr. Appl. Anal. 2014, 2014, 1–24. [Google Scholar] [CrossRef]
  14. Liu, C.; Ouyang, M.; Wang, N.; Mao, Z.; Xu, X. A heuristic method to identify optimum seismic retrofit strategies for critical infrastructure systems. Comput. Civ. Infrastruct. Eng. 2021, 36, 996–1012. [Google Scholar] [CrossRef]
  15. Tao, W.; Lin, P.; Wang, N. Optimum life-cycle maintenance strategies of deteriorating highway bridges subject to seismic hazard by a hybrid Markov decision process model. Struct. Saf. 2021, 89, 102042. [Google Scholar] [CrossRef]
  16. Huang, Y.; Parmelee, S.; Pang, W. Optimal Retrofit Scheme for Highway Network under Seismic Hazards. Int. J. Transp. Sci. Technol. 2014, 3, 109–128. [Google Scholar] [CrossRef]
  17. Peeta, S.; Salman, F.S.; Gunnec, D.; Viswanath, K. Pre-disaster investment decisions for strengthening a highway network. Comput. Oper. Res. 2010, 37, 1708–1719. [Google Scholar] [CrossRef]
  18. Du, L.; Peeta, S. A Stochastic Optimization Model to Reduce Expected Post-Disaster Response Time Through Pre-Disaster Investment Decisions. Networks Spat. Econ. 2014, 14, 271–295. [Google Scholar] [CrossRef]
  19. Gomez, C.; Baker, J.W. An optimization-based decision support framework for coupled pre- and post-earthquake infrastructure risk management. Struct. Saf. 2019, 77, 1–9. [Google Scholar] [CrossRef]
  20. Chu, J.C.; Chen, S.-C. Optimization of Transportation-Infrastructure-System Protection Considering Weighted Connectivity Reliability. J. Infrastruct. Syst. 2016, 22, 264. [Google Scholar] [CrossRef]
  21. Bocchini, P.; Frangopol, D.M. Optimal Resilience- and Cost-Based Postdisaster Intervention Prioritization for Bridges along a Highway Segment. J. Bridg. Eng. 2012, 17, 117–129. [Google Scholar] [CrossRef]
  22. Dong, Y.; Frangopol, D.M.; Saydam, D. Pre-Earthquake Multi-Objective Probabilistic Retrofit Optimization of Bridge Networks Based on Sustainability. J. Bridg. Eng. 2014, 19, 04014018. [Google Scholar] [CrossRef]
  23. Zhang, W.; Wang, N. Resilience-based risk mitigation for road networks. Struct. Saf. 2016, 62, 57–65. [Google Scholar] [CrossRef]
  24. Yan, Y.; Hong, L.; He, X.; Ouyang, M.; Peeta, S.; Chen, X. Pre-disaster investment decisions for strengthening the Chinese railway system under earthquakes. Transp. Res. Part E Logist. Transp. Rev. 2017, 105, 39–59. [Google Scholar] [CrossRef]
  25. Chang, L.; Peng, F.; Ouyang, Y.; Elnashai, A.S.; Spencer, B.F. Bridge Seismic Retrofit Program Planning to Maximize Postearthquake Transportation Network Capacity. J. Infrastruct. Syst. 2012, 18, 75–88. [Google Scholar] [CrossRef]
  26. Jayaram, N.; Baker, J.W. Efficient sampling and data reduction techniques for probabilistic seismic lifeline risk assessment. Earthq. Eng. Struct. Dyn. 2010, 39, 1109–1131. [Google Scholar] [CrossRef]
  27. Pitilakis, K.; Argyroudis, S.; Kakderi, K.; Selva, J. Systemic Vulnerability and Risk Assessment of Transportation Systems under Natural Hazards Towards More Resilient and Robust Infrastructures. Transp. Res. Procedia 2016, 14, 1335–1344. [Google Scholar] [CrossRef]
  28. Liu, L.; Yang, D.Y.; Frangopol, D.M. Network-Level Risk-Based Framework for Optimal Bridge Adaptation Management Considering Scour and Climate Change. J. Infrastruct. Syst. 2020, 26, 516. [Google Scholar] [CrossRef]
  29. Federal Highway Administration. Recording, and Coding Guide for the Structure Inventory and Appraisal of the Nation’s Bridges; Federal Highway Administration: Washington, DC, USA, 1995.
  30. Buckle, I.G.; Friedland, I.M. A Seismic Retrofitting Manual for Highway Bridges; United States Federal Highway Administration, Office of Engineering and Highway Operations: Washington, DC, USA, 1994.
  31. Zhang, N.; Alipour, A. A two-level mixed-integer programming model for bridge replacement prioritization. Comput. Civ. Infrastruct. Eng. 2020, 35, 116–133. [Google Scholar] [CrossRef]
  32. Contreras-Nieto, C.; Shan, Y.; Lewis, P.; Hartell, J.A. Bridge maintenance prioritization using analytic hierarchy process and fusion tables. Autom. Constr. 2019, 101, 99–110. [Google Scholar] [CrossRef]
  33. Yousefi, A.; Ahamad, M.S.S.; Majid, T.A. Application of Topsis Method in Prioritization of Highway Bridges for Seismic Retrofitting. Eng. Struct. Technol. 2014, 6, 114–123. [Google Scholar] [CrossRef]
  34. D’Apuzzo, M.; Evangelisti, A.; Nicolosi, V.; Rasulo, A.; Santilli, D.; Zullo, M. A Simplified Approach for the Prioritization of Bridge Stock Seismic Retrofitting. In Proceedings of the Proceedings of the 29th European Safety and Reliability Conference, Hannover, Germany, 26–29 September 2019. [Google Scholar]
  35. Das, R.; Nakano, M. A multi-criteria decision-making model using socio-technical attributes for transportation bridge maintenance prioritisation. Int. J. Constr. Manag. 2021, 1, 1–7. [Google Scholar] [CrossRef]
  36. Dueñas-Osorio, L.; Vemuru, S.M. Cascading failures in complex infrastructure systems. Struct. Saf. 2009, 31, 157–167. [Google Scholar] [CrossRef]
  37. Sun, W.; Zeng, A. Target recovery in complex networks. Eur. Phys. J. B 2017, 90, 10. [Google Scholar] [CrossRef]
  38. Zhao, T.; Sun, L. Seismic resilience assessment of critical infrastructure-community systems considering looped interdependences. Int. J. Disaster Risk Reduct. 2021, 59, 102246. [Google Scholar] [CrossRef]
  39. Ukkusuri, S.V.; Yushimito, W.F. A methodology to assess the criticality of highway transportation networks. J. Transp. Secur. 2009, 2, 29–46. [Google Scholar] [CrossRef]
  40. Chen, M.; Mangalathu, S.; Jeon, J.-S. Bridge fragilities to network fragilities in seismic scenarios: An integrated approach. Eng. Struct. 2021, 237, 112212. [Google Scholar] [CrossRef]
  41. Cui, H.; Wang, F.; Li, X.; Zhu, M. Reinforcement and optimization of seismic connectivity of key transportation hubs based on minimum cost. Phys. A Stat. Mech. its Appl. 2020, 540, 123231. [Google Scholar] [CrossRef]
  42. Rokneddin, K.; Ghosh, J.; Dueñas-Osorio, L.; Padgett, J.E. Bridge retrofit prioritisation for ageing transportation networks subject to seismic hazards. Struct. Infrastruct. Eng. 2013, 9, 1050–1066. [Google Scholar] [CrossRef]
  43. Tak, H.-Y.; Suh, W.; Lee, Y.-J. System-Level Seismic Risk Assessment of Bridge Transportation Networks Employing Probabilistic Seismic Hazard Analysis. Math. Probl. Eng. 2019, 2019, 1–17. [Google Scholar] [CrossRef]
  44. Liu, L.; Frangopol, D.M.; Mondoro, A.; Yang, D.Y. Sustainability-Informed Bridge Ranking under Scour Based on Transportation Network Performance and Multiattribute Utility. J. Bridg. Eng. 2018, 23, 04018082. [Google Scholar] [CrossRef]
  45. Wang, Z.; Jia, G. Efficient sample-based approach for effective seismic risk mitigation of transportation networks. Sustain. Resilient Infrastruct. 2020, 5, 349–364. [Google Scholar] [CrossRef]
  46. Vaziri, P.; Davidson, R.; Apivatanagul, P.; Nozick, L. Identification of Optimization-Based Probabilistic Earthquake Scenarios for Regional Loss Estimation. J. Earthq. Eng. 2012, 16, 296–315. [Google Scholar] [CrossRef]
  47. Kilanitis, I.; Sextos, A. Integrated seismic risk and resilience assessment of roadway networks in earthquake prone areas. Bull. Earthq. Eng. 2019, 17, 181–210. [Google Scholar] [CrossRef]
  48. Campbell, K.W.; Bozorgnia, Y. NGA Ground Motion Model for the Geometric Mean Horizontal Component of PGA, PGV, PGD and 5% Damped Linear Elastic Response Spectra for Periods Ranging from 0.01 to 10 s. Earthq. Spectra 2008, 24, 139–171. [Google Scholar] [CrossRef]
  49. Jayaram, N.; Baker, J.W. Correlation model for spatially distributed ground-motion intensities. Earthq. Eng. Struct. Dyn. 2009, 38, 1687–1708. [Google Scholar] [CrossRef]
  50. Gardoni, P.; Mosalam, K.M.; DER Kiureghian, A. Probabilistic Seismic Demand Models and Fragility Estimates for Rc Bridges. J. Earthq. Eng. 2003, 7, 79–106. [Google Scholar] [CrossRef]
  51. Nielson, B.G.; Desroches, R. Analytical Seismic Fragility Curves for Typical Bridges in the Central and Southeastern United States. Earthq. Spectra 2007, 23, 615–633. [Google Scholar] [CrossRef]
  52. de Silva, F.; Fabozzi, S.; Nikitas, N.; Bilotta, E.; Fuentes, R. Seismic vulnerability of circular tunnels in sand. Geotechnique 2021, 71, 1056–1070. [Google Scholar] [CrossRef]
  53. Capacci, L.; Biondini, F.; Titi, A. Lifetime seismic resilience of aging bridges and road networks. Struct. Infrastruct. Eng. 2020, 16, 266–286. [Google Scholar] [CrossRef]
  54. Liu, K.; Zhai, C.; Dong, Y. Optimal restoration schedules of transportation network considering resilience. Struct. Infrastruct. Eng. 2021, 7, 1141–1154. [Google Scholar] [CrossRef]
  55. Tao, W.; Wang, N.; Ellingwood, B.; Nicholson, C. Enhancing bridge performance following earthquakes using Markov decision process. Struct. Infrastruct. Eng. 2020, 17, 62–73. [Google Scholar] [CrossRef]
  56. Federal Emergency Management Agency (FEMA). Multi-Hazard Loss Estimation Methodology (HAZUS-MH 2.1); Department of Homeland Security, Federal Emergency Management Agency, Mitigation Division: Washington, DC, USA, 2012.
  57. Nikitas, N.; Macdonald, J.H.; Jakobsen, J.B. Identification of flutter derivatives from full-scale ambient vibration measurements of the Clifton Suspension Bridge. Wind Struct. Int. J. 2011, 14, 221–238. [Google Scholar] [CrossRef]
  58. Acampora, A.; Macdonald, J.; Georgakis, C.; Nikitas, N. Identification of aeroelastic forces and static drag coefficients of a twin cable bridge stay from full-scale ambient vibration measurements. J. Wind Eng. Ind. Aerodyn. 2014, 124, 90–98. [Google Scholar] [CrossRef]
  59. Papadopoulos, S.P.; Sextos, A.G. Anti-symmetric mode excitation and seismic response of base-isolated bridges under asynchronous input motion. Soil Dyn. Earthq. Eng. 2018, 113, 148–161. [Google Scholar] [CrossRef]
  60. Chang, S.E.; Shinozuka, M.; Moore, J.E. Probabilistic Earthquake Scenarios: Extending Risk Analysis Methodologies to Spatially Distributed Systems. Earthq. Spectra 2000, 16, 557–572. [Google Scholar] [CrossRef]
  61. Guo, A.; Liu, Z.; Li, S.; Li, H. Seismic performance assessment of highway bridge networks considering post-disaster traffic demand of a transportation system in emergency conditions. Struct. Infrastruct. Eng. 2017, 13, 1523–1537. [Google Scholar] [CrossRef]
  62. Ip, W.H.; Wang, D. Resilience and Friability of Transportation Networks: Evaluation, Analysis and Optimization. IEEE Syst. J. 2011, 5, 189–198. [Google Scholar] [CrossRef]
  63. Zhang, W.; Wang, N.; Nicholson, C. Resilience-based post-disaster recovery strategies for road-bridge networks. Struct. Infrastruct. Eng. 2017, 13, 1404–1413. [Google Scholar] [CrossRef]
  64. Karamlou, A.; Bocchini, P. Optimal Bridge Restoration Sequence for Resilient Transportation Networks. In Proceedings of the Structures Congress, Boston, MA, USA, 3–5 April 2014. [Google Scholar] [CrossRef]
  65. Merschman, E.; Doustmohammadi, M.; Salman, A.M.; Anderson, M. Postdisaster Decision Framework for Bridge Repair Prioritization to Improve Road Network Resilience. Transp. Res. Rec. J. Transp. Res. Board 2020, 2674, 81–92. [Google Scholar] [CrossRef]
  66. Zhang, X.; Miller-Hooks, E.; Denny, K. Assessing the role of network topology in transportation network resilience. J. Transp. Geogr. 2015, 46, 35–45. [Google Scholar] [CrossRef]
  67. Holland, J.H. Genetic Algorithms and Adaptation. In Adaptive Control of Ill-Defined Systems; Springer: Berlin/Heidelberg, Germany, 1984. [Google Scholar]
  68. Franchin, P.; Lupoi, A.; Pinto, P.E. On The Role of Road Networks in Reducing Human Losses after Earthquakes. J. Earthq. Eng. 2006, 10, 195–206. [Google Scholar] [CrossRef]
  69. Dong, Y.; Frangopol, D.M. Probabilistic assessment of an interdependent healthcare–bridge network system under seismic hazard. Struct. Infrastruct. Eng. 2017, 13, 160–170. [Google Scholar] [CrossRef]
  70. Khademi, N.; Balaei, B.; Shahri, M.; Mirzaei, M.; Sarrafi, B.; Zahabiun, M.; Mohaymany, A.S. Transportation network vulnerability analysis for the case of a catastrophic earthquake. Int. J. Disaster Risk Reduct. 2015, 12, 234–254. [Google Scholar] [CrossRef]
  71. Yu, Y.-C.; Gardoni, P. Predicting road blockage due to building damage following earthquakes. Reliab. Eng. Syst. Saf. 2022, 219, 108220. [Google Scholar] [CrossRef]
  72. Hsieh, C.-H.; Feng, C.-M. The highway resilience and vulnerability in Taiwan. Transp. Policy 2020, 87, 1–9. [Google Scholar] [CrossRef]
  73. Karamlou, A.; Bocchini, P. Sequencing algorithm with multiple-input genetic operators: Application to disaster resilience. Eng. Struct. 2016, 117, 591–602. [Google Scholar] [CrossRef]
  74. Giovinazzi, S.; Nicholson, A. Transport Network Reliability in Seismic Risk Analysis and Management. In Proceedings of the 14th European Conference on Earthquake Engineering, Ohrid, Macedonia, 30 August–3 September 2010; p. 933. [Google Scholar]
  75. Liu, K.; Zhai, C.; Dong, Y.; Meng, X. Post-Earthquake Functionality Assessment of Urban Road Network Considering Emergency Response. J. Earthq. Eng. 2022, 1, 1–26. [Google Scholar] [CrossRef]
  76. Chang, S.; Nojima, N. Measuring post-disaster transportation system performance: The 1995 Kobe earthquake in comparative perspective. Transp. Res. Part A Policy Pr. 2001, 35, 475–494. [Google Scholar] [CrossRef]
  77. Sohn, J. Evaluating the significance of highway network links under the flood damage: An accessibility approach. Transp. Res. Part A Policy Pr. 2006, 40, 491–506. [Google Scholar] [CrossRef]
  78. Günneç, D.; Salman, F.S. Assessing the reliability and the expected performance of a network under disaster risk. OR Spektrum 2011, 33, 499–523. [Google Scholar] [CrossRef]
  79. Dueñas-osorio, L.A. Interdependent Response of Networked Systems to Natural Hazards and Intentional Disruptions Inter-dependent Response of Networked Systems to Natural Hazards and Intentional Disruptions. Public Policy 2005. Ph.D. Thesis, Georgia Institute of Technology, Atlanta, GA, USA, 2005. [Google Scholar]
  80. Dijkstra, E.W. A note on two problems in connexion with graphs. Numer. Math. 1959, 1, 269–271. [Google Scholar] [CrossRef]
  81. Floyd, R.W. Algorithm 97: Shortest path. Commun. ACM 1962, 5, 345. [Google Scholar] [CrossRef]
  82. Kurauchi, F.; Uno, N.; Sumalee, A.; Seto, Y. Network Evaluation Based on Connectivity Vulnerability. In Transportation and Traffic Theory 2009: Golden Jubilee; Springer: Berlin/Heidelberg, Germany, 2009; pp. 637–649. [Google Scholar]
  83. Padgett, J.E.; Desroches, R. Retrofitted Bridge Fragility Analysis for Typical Classes of Multispan Bridges. Earthq. Spectra 2009, 25, 117–141. [Google Scholar] [CrossRef]
  84. Shinozuka, M.; Zhou, Y.; Kim, S.; Murachi, Y.; Banerjee, S.; Cho, S.; Chung, H. Socio-Economic Effect of Seismic Retrofit Im-Plemented on Bridges in the Los Angeles Highway Network; California Department of Transportation: Sacramento, CA, USA, 2005. [Google Scholar]
  85. Dong, Y.; Frangopol, D.; Sabatino, S. Optimizing Bridge Network Retrofit Planning Based on Cost-Benefit Evaluation and Multi-Attribute Utility Associated with Sustainability. Earthq. Spectra 2015, 31, 2255–2280. [Google Scholar] [CrossRef]
Figure 1. Flowchart of emergency path search algorithm.
Applsci 12 09307 g001
Figure 2. Hypothetical transportation network.
Applsci 12 09307 g002
Figure 3. BC-based and RE-based importance ranking results. (a) Betweenness value of each bridge; (b) Residual functionality of removing each bridge.
Applsci 12 09307 g003
Figure 4. MI-based importance ranking results. (a) Case 1; (b) Case 2; (c) Case 3; (d) Case 4.
Applsci 12 09307 g004
Figure 5. Network failure probability under different approaches and conditions. (a) Case 1; (b) Case 2; (c) Case 3; (d) Case 4.
Applsci 12 09307 g005
Table 1. Relationship between damage level and residual serviceability of link.
Damage LevelResidual Rate
Traffic CapacityTravel Speed
None100%100%
Slight70%75%
Moderate30%50%
Over extensive0%0%
Table 2. Fragility parameters for bridges.
Damage StateSlightModerateExtensive
ParametersMedianDispersionMedianDispersionMedianDispersion
Class 10.30.60.40.60.50.6
Class 20.40.60.60.60.80.6
Table 3. Classification of bridges in different network cases.
No. of CaseBridge ID of Class 1Bridge ID of Class 2
Case 11, 2, 3, 4, 5, 6, 7, 8, 9, 10None
Case 2None1, 2, 3, 4, 5, 6, 7, 8, 9, 10
Case 31, 3, 5, 7, 92, 4, 6, 8, 10
Case 42, 4, 6, 8, 101, 3, 5, 7, 9
Table 4. Sum of failure probability gaps between each approach and optimal solution.
No. of Case Sum   of   P F   Gap   from   m = 1   to   m = 9
BC-BasedRE-BasedMI-BasedJMI-Based
Case 114.58%8.33%1.20%0.66%
Case 25.42%7.07%0.52%0.11%
Case 358.53%33.74%1.40%0.76%
Case 414.61%33.47%1.41%0.21%
Table 5. Optimal and JMI-based seismic retrofit strategies.
ID   of   Selected   Bridges   B m = { B 1 , B 2 , , B m }
m Case 1Case 2
OptimalJMI-BasedOptimalJMI-Based
19999
25, 92, 95, 95, 9
32, 5, 92, 5, 95, 8, 91, 5, 9
42, 4, 5, 92, 4, 5, 92, 5, 8, 91, 5, 8, 9
51, 2, 4, 5, 92, 4, 5, 8, 91, 2, 5, 8, 91, 2, 5, 8, 9
61, 2, 4, 5, 8, 91, 2, 4, 5, 8, 91, 2, 4, 5, 8, 91, 2, 4, 5, 8, 9
71, 2, 3, 4, 5, 8, 91, 2, 3, 4, 5, 8, 91, 2, 3, 4, 5, 8, 91, 2, 3, 4, 5, 8, 9
81, 2, 3, 4, 5, 7, 8, 91, 2, 3, 4, 5, 6, 8, 91, 2, 3, 4, 5, 6, 8, 91, 2, 3, 4, 5, 6, 8, 9
91, 2, 3, 4, 5, 6, 7, 8, 91, 2, 3, 4, 5, 6, 7, 8, 91, 2, 3, 4, 5, 6, 7, 8, 91, 2, 3, 4, 5, 6, 7, 8, 9
m Case 3Case 4
OptimalJMI-BasedOptimalJMI-Based
19922
25, 95, 92, 42, 4
31, 5, 91, 5, 92, 4, 82, 4, 8
41, 3, 5, 91, 3, 5, 92, 4, 6, 82, 4, 8, 9
51, 3, 5, 7, 91, 3, 5, 8, 92, 4, 6, 8, 92, 4, 6, 8, 9
61, 3, 5, 7, 8, 91, 3, 5, 7, 8, 92, 4, 5, 6, 8, 92, 4, 5, 6, 8, 9
71, 2, 3, 5, 7, 8, 91, 2, 3, 5, 7, 8, 91, 2, 4, 5, 6, 8, 92, 4, 5, 6, 8, 9, 10
81, 2, 3, 4, 5, 7, 8, 91, 2, 3, 4, 5, 7, 8, 91, 2, 4, 5, 6, 8, 9, 101, 2, 4, 5, 6, 8, 9, 10
91, 2, 3, 4, 5, 6, 7, 8, 91, 2, 3, 4, 5, 6, 7, 8, 91, 2, 3, 4, 5, 6, 8, 9, 101, 2, 3, 4, 5, 6, 8, 9, 10
Publisher’s Note: MDPI stays neutral with regard to jurisdictional claims in published maps and institutional affiliations.

