Article

An Automated Design Method for Plane Trusses Based on User Preference Information

1
College of Civil Engineering, Tongji University, Shanghai 200092, China
2
Shanghai Qi Zhi Institute, Shanghai 200232, China
*
Author to whom correspondence should be addressed.
Appl. Sci. 2023, 13(3), 1543; https://doi.org/10.3390/app13031543
Submission received: 8 January 2023 / Revised: 20 January 2023 / Accepted: 23 January 2023 / Published: 25 January 2023
(This article belongs to the Special Issue Advances in Engineering Structural Systems)

Abstract

:
Structural design is a complicated decision-making process involving multiple qualitative and quantitative factors. Currently, most automated design methods consider only quantitative objectives and constraints, ignoring the qualitative design information that is difficult define mathematically, such as the user preference for structural shapes. This limits the functionality and efficiency of such design methods. In this study, a design method named STSA-P is proposed for plane trusses to incorporate user preference into the automatic design process. Two main problems are addressed, i.e., how to quantify user preference information and how to coordinate it with other quantitative design objectives. A prediction model of user preference is developed for the first problem by generating the data set and selecting an appropriate machine learning (ML) algorithm. Specifically, a set of truss features quantitatively representing the structural shapes are identified for the truss sample population. Furthermore, an interactive system is developed for collecting user evaluation information as data labels. Strategies for reducing user fatigue are also considered during the evaluation process. A set of numerical experiments are conducted to select the suitable ML algorithm. Regarding the second problem, the physical programming method is modified to construct a new aggregate function which effectively coordinates user preference with other design objectives. A cost function is designed by considering the design constraints. On this basis, the prediction model is incorporated into the Structural Topology and Shape Annealing (STSA) method to form the STSA-P method. Two students are invited to perform a design case using the STSA-P method. It is demonstrated that the results verify the practicality and validity of the proposed method.

1. Introduction

Computational methods have been widely applied in various aspects of structural design, including both structural analysis and construction drawings. To further improve design quality and efficiency, plenty of automated design methods, which focused on performing conceptual design independently, have been developed in recent years. A representative one is Structural Topology and Shape Annealing (STSA) [1], which simulates the truss design process well and has been successfully used in engineering practice [2,3]. However, most automated methods such as STSA consider only quantitative objectives and constraints that can be defined mathematically, e.g., minimum weight or stress limit. The ability to analyze qualitative factors reflecting the designer’s intuition, experience, and preference is limited. One example is the user’s subjective preference for structural shapes. Thus, the qualitative factors can only be considered by designers, which limits the functionality and efficiency of the automated design methods. To overcome this limitation, two main problems are to be solved: first, how to quantify the effects of qualitative design factors so that they can be considered in computational methods; and second, how to coordinate different design goals, including both subjective and objective, so that they can guide the search towards an optimal design.
This study aims at solving these two problems and proposing an innovative conceptual design method for plane trusses based on user preference. Note that, in this paper, user preference means the subjective satisfaction with the design appearance. Considering the first problem, a prediction model that can quantify user preference is proposed to transform the qualitative information into a quantifiable objective. Regarding the second problem, a cost function based on modified physical programming (MPP) is introduced. It coordinates different design objectives effectively and integrates the prediction model into a multi-objective optimization procedure (STSA). This paper is organized as follows: Section 2 reviews the related studies on applying user preference and multi-objective optimization methods. Section 3 gives the main steps to build a prediction model for user preference. The cost function is described in Section 4. After that, a design example is given to demonstrate the effectiveness of the proposed method in Section 5. Finally, conclusions are presented in Section 6.

2. Related Work

2.1. Research on User Design Preference

User design preference is one of the typical qualitative factors. It plays a significant role in the design process. Considerable studies have been devoted to studying the effects of user preference, including research on modeling and quantifying the preference information. In earlier research, user preference was abstracted as some simple rules such as balance, rhythm, and proportionality [4]. Among these rules, the golden ratio is the best-known one and has been widely applied in architectural design. In the field of industrial design, the Kansei Engineering method [5,6] is a popular design method that assesses user preference via questionnaires, interviews, etc., and utilizes the information to meet the user’s expectations in the product design. This method provides a reference for the quantitative research of subjective information in other fields.
The research on user preference in structural design can be grossly divided into two categories according to the application form of the information. Some researchers believe that the preference information is almost impossible to quantify. Thus, they integrate the user into the optimization system to replace the fitness function. The preference information is expressed through the user’s judgments and choices during the optimization process. Interactive evolutionary computation (IEC) is a typical method of this category, which combines human subjective evaluation with an evolutionary optimization algorithm [7]. Von Buelow et al. [8,9] performed an interactive design for discrete structures with a genetic algorithm (GA). During the process, a user can select some preferred solutions in every generation as the parents for the subsequent generation until the optimal design is achieved. Muller et al. [10,11] extended this method to the design of rigid frame structures. Other than GA, other heuristic algorithms were also used. Felkner et al. [12] proposed an interactive framework for truss design based on the particle swarm optimization (PSO) algorithm. Within the framework, a user can use NURBS curves to draw the initial design and evaluate the solutions iteratively through an interface until the final design is completed [12,13,14].
Other researchers tend to use user preference as fundamental information and quantify it into formulas or models before the search process. Furuta et al. [15] developed a supporting system for the aesthetic design of dam structures. They used the analytic hierarchy process (AHP) method to represent the user preference in a fitness function. Chikata et al. [16] simulated user aesthetic evaluation information in the design of concrete retaining walls based on neural networks. For the design of discrete structures, a remarkable work was conducted by Bailey and Raich [17]. The authors modeled the user preference based on neural networks and combined it with the GA method for generating Pareto-optimal designs.
There are some disadvantages to the interactive design research. Firstly, user preference is not quantified nor modeled, thus the preference information cannot be reused. Secondly, the lengthy interaction can cause user fatigue problems, which reduce the design quality and efficiency [18]. By contrast, the quantitative research can avoid these problems. But how to ensure the accuracy of the user preference represented by the formulas or models is still challenging. Therefore, it seems viable to develop a model that can accurately predict user preference and then incorporate the preference information into the structural design process.

2.2. Multi-Objective Optimization Methods

The essence of coordinating different design objectives is to solve a multi-objective optimization problem (MOP) [19]. Inevitable conflicts between different objectives often make it difficult to find an optimal solution that performs best in all objectives. Thus, the solution of MOPs is generally a set of compromise solutions, i.e., the so-called Pareto optimal solutions or non-dominated solutions. There are a variety of methods for solving MOPs, which can be classified based on different criteria [19,20,21,22]. Regarding the number of solutions when the search process terminates, some methods obtain only one solution, and these one-solution methods solve the problem mainly through three ways. Firstly, all objective functions are converted into a single objective function, e.g., the weighted-sum method and utopia point method. Secondly, the objective functions are optimized one by one in order of importance, e.g., the hierarchical method [23]. Thirdly, users are allowed to participate in the search process, e.g., interactive optimization methods [10,12]. The other methods obtain more than one solution at the end of the search process. These multi-solution methods are commonly used to provide the Pareto-optimal set (or subset) for user selection, including not only the classical methods such as the normal boundary intersection method [24] and the normal constraint method [25], but also the evolutionary multi-objective optimization methods such as MOGA [26], SPEA [27], and NSGA-II [28].
The difference between the two types of methods is whether the user information works during the search process. In the multi-solution methods, the user information works only when the optimization ends, that is, users select a satisfying solution from the optimal set. This study expects the user information to play a positive role to guide the search process. Therefore, the one-solution methods are more suitable. However, such methods have some limitations, including the difficulty in determining parameters and the sensitivity to the shape or continuity of the Pareto optimal front (objective values of Pareto optimal set) [19]. Taking the weighted-sum method as an example, it is rather difficult for users to determine the weighting values that integrate all objectives with different physical meanings and orders of magnitude, especially when a MOP involves both subjective and qualitative objectives. Furthermore, it is not possible to obtain the solutions on the non-convex portion of the Pareto optimal front by the weighted-sum method [29]. To solve this problem, physical programming (PP) was proposed [30]. Instead of setting the weights, PP enables users to express their ideas or expectations on each objective in an understandable and meaningful way. Based on this information, the class functions for all objectives are built on the same numerical scale. These functions are combined into one function named the aggregate function. Thus, a MOP is transformed into a single-objective optimization problem (SOP). More details about PP are described in Section 4.1. Owing to its simplicity and ability to represent the complete Pareto optimal set [31,32], PP has been applied in various engineering problems [33,34].

3. User Preference Prediction Model

A suitable machine learning (ML) technique and a valid data set for training and testing the model are two essential components of developing a prediction model using artificial intelligence. A data set generally comprises a number of samples with features and labels. The features, which are often represented as a vector, reflect a set of sample attributes of concern. The labels generally represent the target in terms of values or categories. The samples considered in this study are a group of plane truss structures. Accordingly, the features need to reflect the geometric information, and the labels are expected to show the user evaluation information. This section presents the steps of developing a prediction model of user preference for plane truss designs, mainly including generating samples, identifying features, obtaining labels while reducing user fatigue, and selecting an ML technique.

3.1. Generation of Random Samples

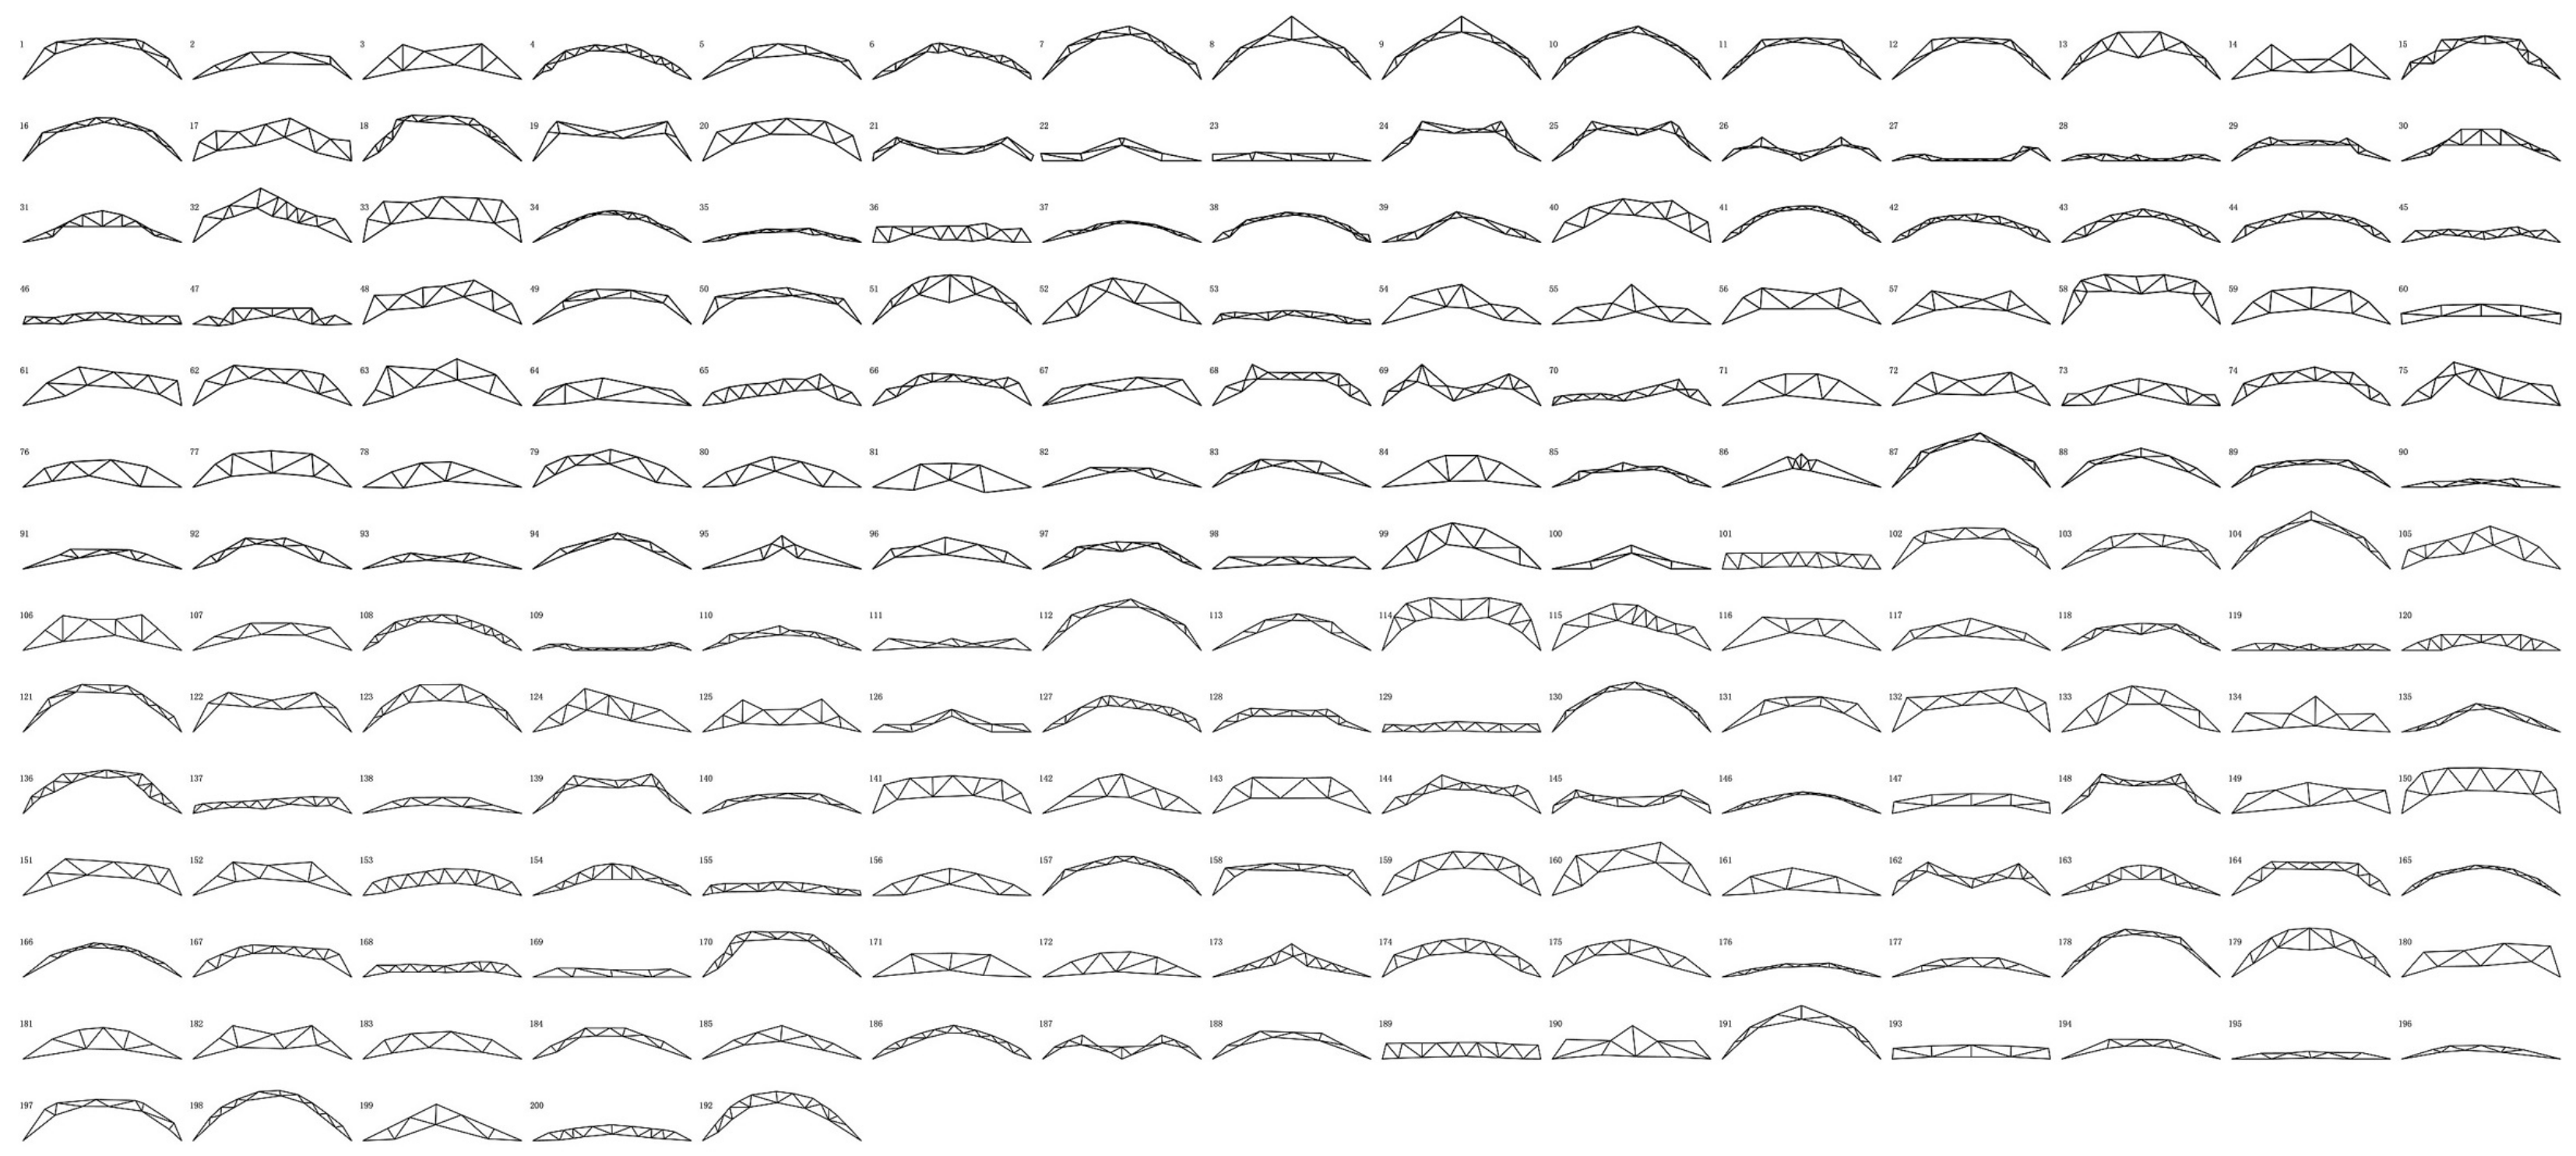
The user preference for plane truss shapes is of concern in this study; thus, a diversity of truss shapes is necessary for the generation of samples. The truss samples are generated by the STSA method in a search space of 2000-unit length and 1000-unit height. In order to meet the shape requirement and generate the universal samples, random loadings with random direction, value, and distribution range are adopted. Figure 1 shows the sample population with 200 truss structures.

3.2. Identification of Truss Features

Visual discrimination is the basis of expressing user preference for truss shapes. Hence, the selected features are required to reflect the geometric characteristics of truss shapes clearly. Then, the users can visually discern the difference between truss samples based on these features. In this study, 26 initial features are defined, and a selection method is proposed to get a group of effective features that adequately represent the truss shapes.
Each feature is defined as a dimensionless value to reflect one aspect of geometric shapes. It can be calculated using structural information such as node coordinates. The definition of the features can be as simple as height-span ratio (HSR), as shown in Equation (1). It can also be as complicated as symmetry rate (SyR), which describes the symmetry of structures, as defined in Equation (2). Figure 2 illustrates the calculation of symmetry rate. A truss structure is divided into two parts by the central axis. The overlapping area can be calculated by folding one part to the other along the central axis. Then, the ratio of the overlapping area to the maximum area of the two parts can be obtained. It is evident that the larger the ratio, the higher the similarity between the two parts, and the more symmetrical the truss structure.
H S R = h max L s p a n ,
where hmax = maximum height of truss nodes, Lspan = span of truss structures.
S y R = S o max ( S L , S R ) ,
where So = overlapping area, SL = area on the left side of the central axis, and SR = area on the right side of the central axis.
To find the effective features, the K-means clustering method [35] is applied to classify the sample population into nine groups. The classification is based on each truss feature separately. Note that the value of each feature is normalized to 0–1. In addition, the average and the standard deviation of the feature value for each group are calculated. A resulting graph (Figure 3) is plotted as an auxiliary evaluation tool, in which the truss samples belonging to the same group are collected. The truss features are evaluated one by one. Three structural designers were invited to participate in the evaluation process. There are three criteria to select an effective feature. Firstly, visually identifiable similarities should exist between the truss samples within the same group, whereas visually identifiable differences should exist between different groups. Secondly, the average for each group needs to be evenly distributed and the standard deviation needs to be as small as possible. Thirdly, suggestions from the designers need to be taken into account.
Taking HSR as an example, Figure 3 shows a part of the resulting graph of the feature. The maximum height of truss samples gradually decreases from group 1 to group 9, whereas the samples in the same group have similar heights. On the other hand, the average for each group is evenly distributed between 0 and 1, and the standard deviation of each group is small. This indicates the good numerical performance of the feature. Furthermore, the designers had no objection to the definition of the feature and affirmed its value to structural design. Therefore, HSR is identified as an effective feature.
After evaluating all the initial features, nine effective features are identified and included in a feature vector, summarized in Table 1.
These features describe five geometric attributes of truss shapes (basic size, complexity, mid-span width, flatness, and symmetry), in which Number of Members (NM), Mid-span Clear Height (MCH), and Average Length of Web Members (AL) can be easily calculated from the basic structural information. Besides, other effective features are expressed by Equations (3)–(5).
T D = i = 1 n t h tb i + j = 1 n b h bt j n t + n b 1 L s p a n ,
where nt = number of top chord nodes, nb = number of bottom chord nodes, htbi = vertical distance from the ith top chord node to the bottom chord, and hbtj = vertical distance from the jth bottom chord node to the top chord.
Truss Depth (TD) can be calculated by using Equation (3), which reflects the average width of a truss sample. Lspan is introduced in the equation to eliminate the size effect. Dispersion of Nodes (DN, Equation (4)) presents the maximum deviation from the average height among all the top and bottom nodes, which reflects the local width of a truss sample. Note that fixed nodes at both ends are excluded from the calculation.
D N = max ( max 1 i n t | h t i i = 1 n t h t i + j = 1 n b h b j n t + n b | , max 1 j n b | h b j i = 1 n t h t i + j = 1 n b h b j n t + n b | ) 1 L s p a n ,
where hti = height of the ith top chord node, and hbj = height of the jth bottom chord node.
T H D = ( i = 2 n t | h t i h t i 1 | + h t 1 + h t n t ) 1 L s p a n ,
Top Chord Height Differences (THD, Equation (5)) sums the absolute value of the difference in heights between two adjacent nodes (including the two fixed nodes) along the top chord. This feature reflects the flatness of the top chord. Bottom Chord Height Differences (BHD) is defined similarly.

3.3. Strategies for Reducing User Fatigue

Getting the evaluation information of user preference is an interactive process. It is well-known that user fatigue is a huge obstacle to obtaining effective information during this evaluation process. To solve such a problem, two measures are taken, i.e., limiting the number of interactions and reducing the interaction complexity. This section focuses on the former measure and the latter one will be introduced in Section 3.4.
Previous studies have demonstrated that users prefer to group the samples based on their similarity before evaluation [36,37]. Therefore, the user evaluation method “choose first, evaluate later” is proposed. This means that the users first choose a preferred group of samples. Then, they only evaluate the samples in this group. This effectively reduces the number of interactions. Thus, it is vital to find an appropriate clustering method to group the truss sample population before the user evaluation. This study selects six specific clustering methods as candidates, including K-means, DBSCAN [38], CLIQUE [39], K-medoids [40], SOM [41], and CURE [42] methods. These methods are evaluated from two perspectives, including subjective consistency and numerical performance.
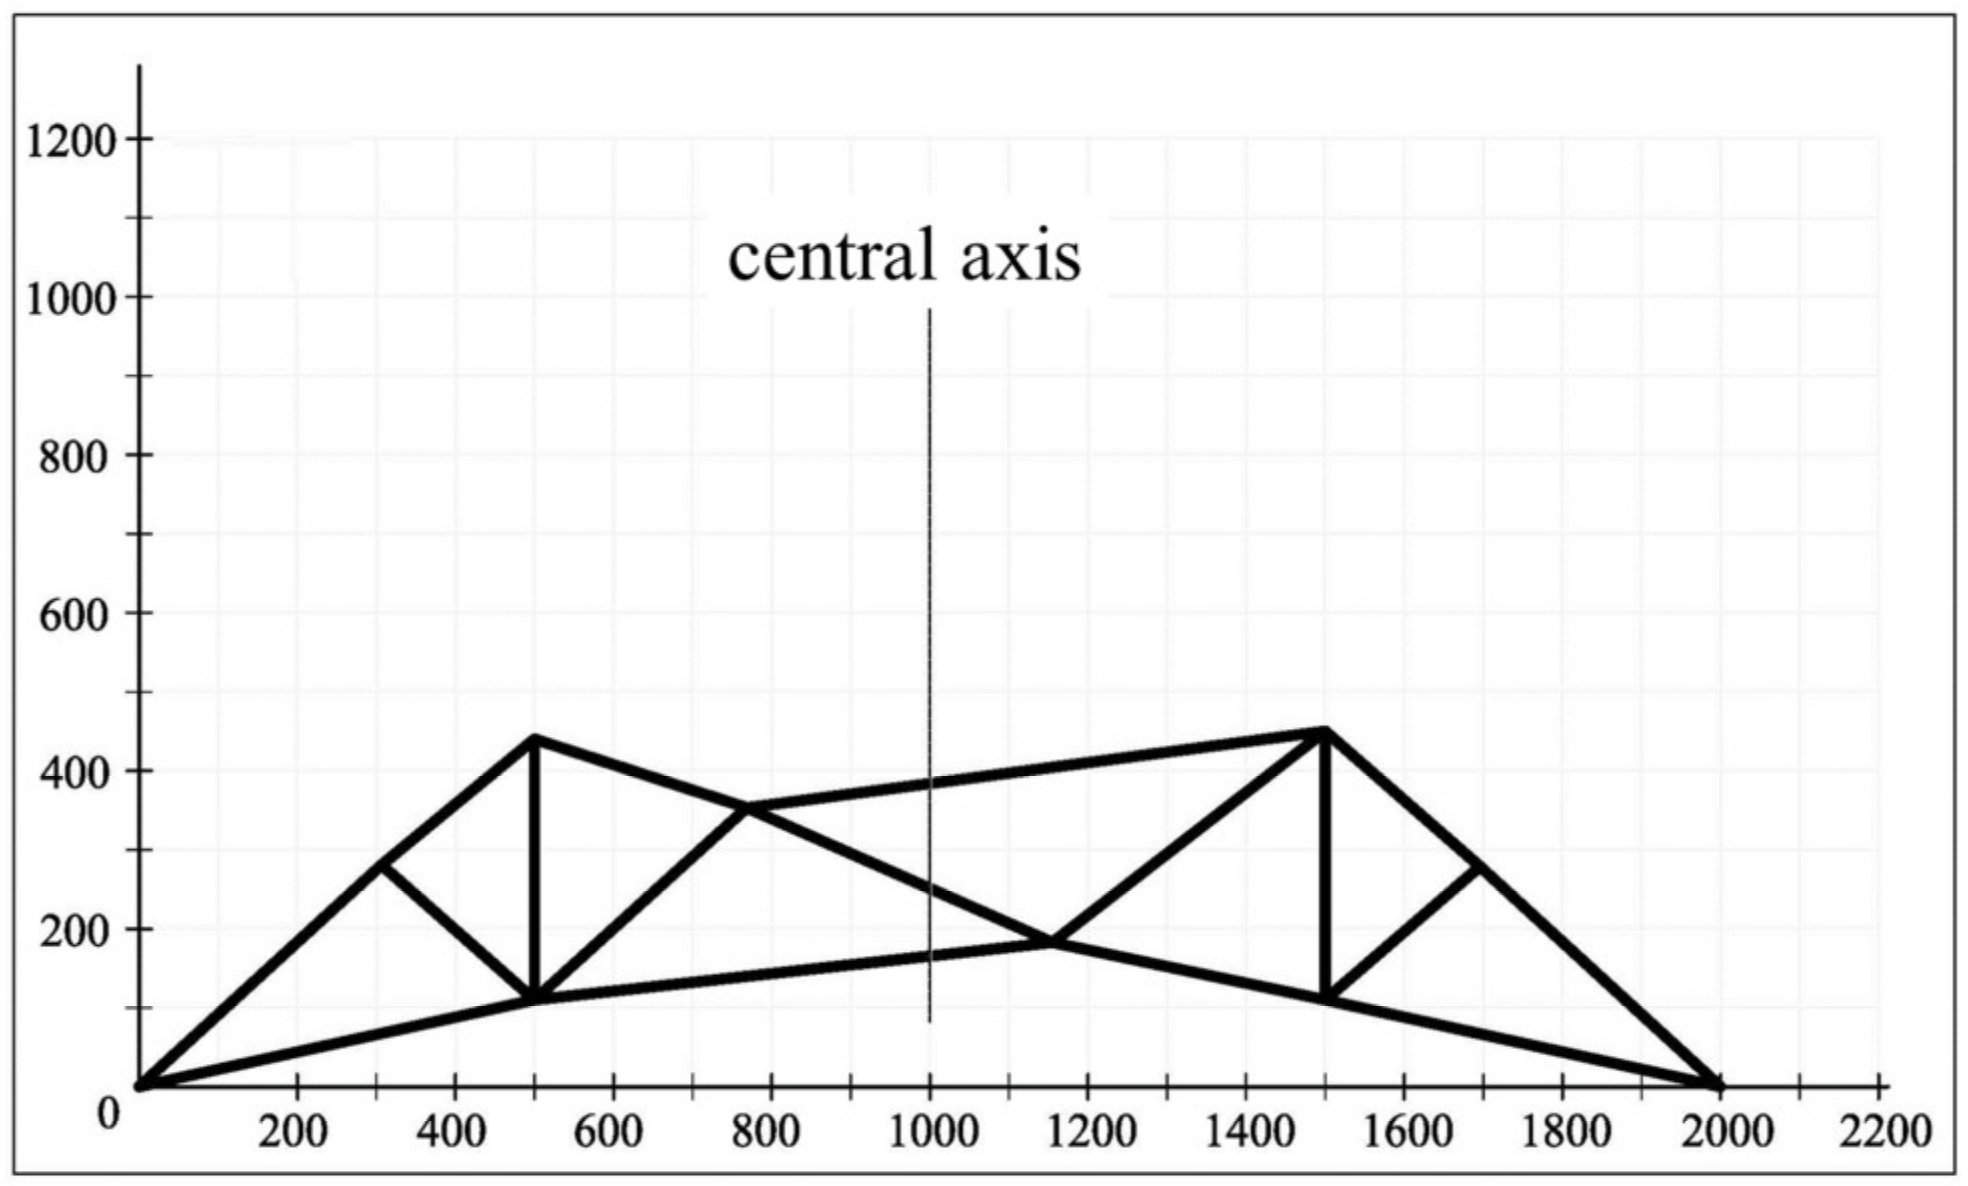
To detect the consistency of the clustering results with user judgment, a subjective evaluation experiment is conducted. Seven students of civil engineering or computer science were invited to compare the truss samples in pairs and rate them based on their similarities. The score varies from 1 to 5. A value of 5 means that the two samples are highly similar, whereas 1 means that they are completely different. The truss samples are randomly selected from the sample population. In total, five random groups (numbered from 1 to 5) are generated, each of which contains 20 samples. Each student needs to evaluate all the groups, in which the samples are presented in the form of pictures, as shown in Figure 4. The final score of each sample pair is calculated from the average of the seven students’ scores.
After the experiment, the candidate methods are used to cluster the truss samples of each random group. A rating rule is presented to evaluate the clustering results according to the experimental results. Assigning a similar sample pair with a higher score to the same group will result in a better reward, e.g., a clustering method will get 5 points if it assigns a 5-score sample pair to the same group; otherwise it will lose 5 points. Based on this rule, the grade of each candidate method can be calculated. The higher the grade, the better the performance.
The evaluation results are summarized in Table 2. The SOM method achieves the highest grade in groups 1, 3, 4, and 5, whereas the K-means method obtains the highest grade in group 2. By contrast, the CLIQUE method shows the worst performance, with the lowest grades in groups 2, 3, and 4. Generally speaking, the SOM method consistencies most consistent with user judgment.
Regarding the numerical performance, the existing indexes for evaluating clustering results are generally based on two criteria, i.e., Compactness and Separation [43]. Few indexes consider Uniformity, which measures the consistency of the sample size for each cluster. Uniformity is an important evaluation criterion because a large difference in the sample size between clusters can lead to some problems: for example, too little information will be obtained from a small cluster, whereas user fatigue can be caused by a large cluster. Therefore, a new index, named the Coefficient of Variation and Maximum of Manhattan Distance (CV-MMD), is proposed to evaluate the performance of the candidate methods. It can be computed as follows:
C V - M M D = C V M M D ,
C V = σ ( n ) n ¯ ,
M M D = max k N [ 1 n k i = 1 n k d M d ( x k , i , c k ) ] ,
where s(n) = standard deviation of the number of samples in each cluster, n ¯ = average of the number of samples in each cluster, nk = number of samples in the kth cluster, ck = center of the kth cluster, xk,i = the ith sample in the kth cluster, and dMd(x,y) = Manhattan distance between x and y.
The CV-MMD index consists of two parts. CV calculates the coefficient of variation of the sample size to measure the difference in sample size between clusters, whereas MMD calculates the maximum average Manhattan distance of all clusters to reflect the compactness of clustering results. The reason for using the Manhattan distance instead of the more commonly used Euclidean distance is that the latter is easier to fail in multi-dimensional space. Note that a lower value means better performance for both CV and MMD.
The truss sample population is divided into nine groups by each candidate method. Table 3. summarizes the results evaluated by the CV-MMD index.
The SOM method achieves the minimum value of the CV-MMD index, which indicates the best numerical performance. The K-means and K-medoids methods also have relatively good performance in the CV-MMD index. Regarding the performance of sub-indexes, the SOM method achieves the minimum CV value and performs best in Uniformity, whereas the K-means method performs best in Compactness with a minimum MMD value. In contrast, the CLIQUE and DBSCAN methods get large CV values, which implies that the clustering results are unreasonable. This is most likely relates to the algorithm principles. Both CLIQUE and DBSCAN methods are density-based. In these methods, samples in two adjacent regions are gathered to the same cluster if t numbers of samples in the two regions meet the pre-set quantity requirement. This can easily lead to the generation of some small clusters and super clusters. Therefore, these methods’ performance in both Compactness and Uniformity is poor.
Considering the results of both the two evaluation measures, the SOM method has an outstanding performance. Hence, it is selected as the effective clustering method for the subsequent sections.

3.4. Collection of User Preference Information

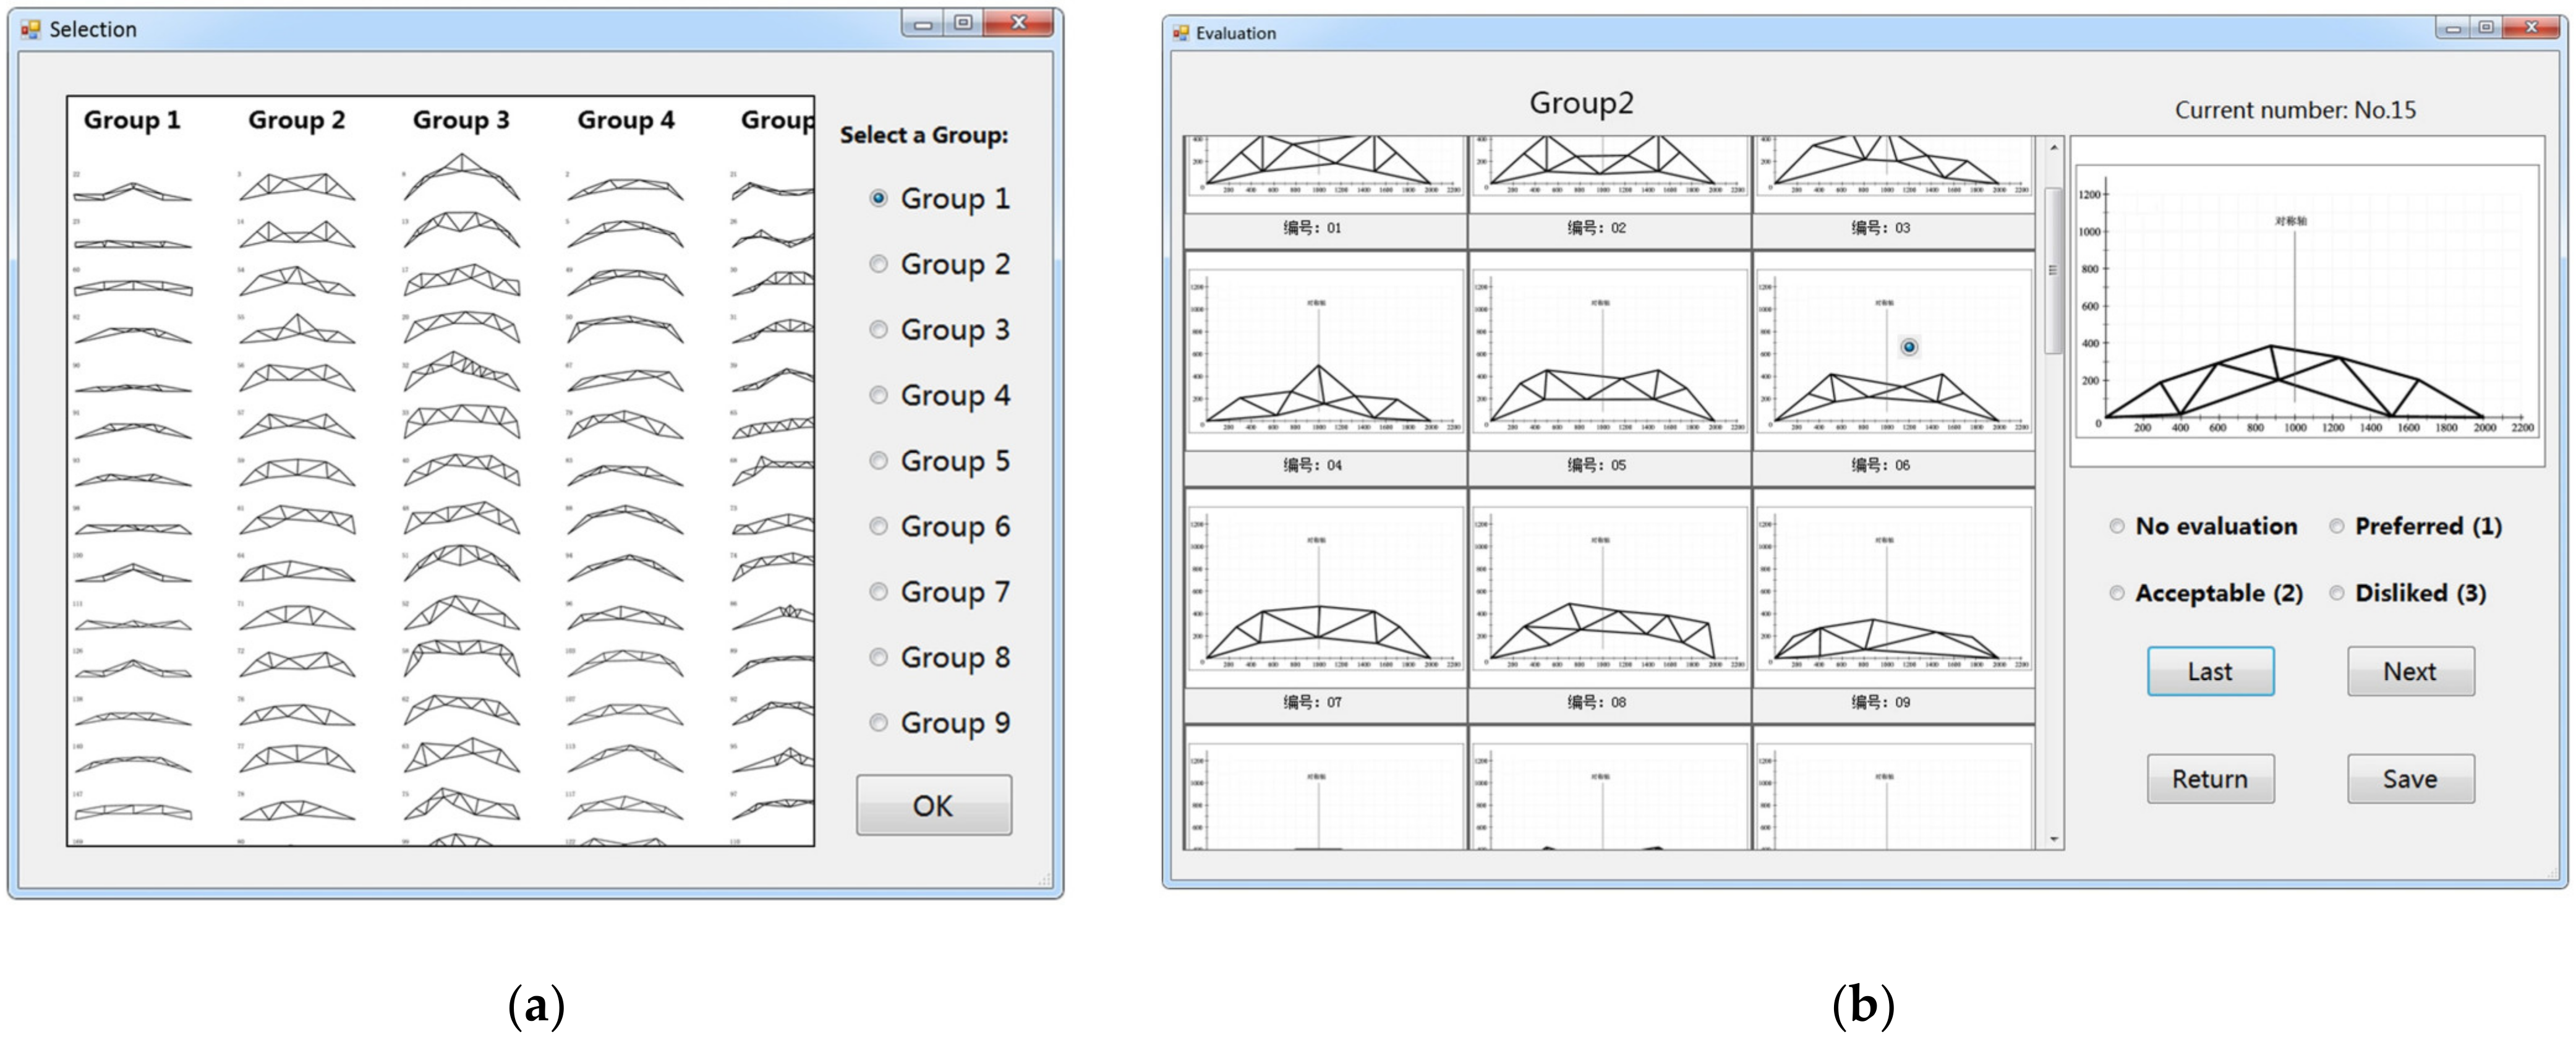
To collect the user preference information effectively and reduce the interaction complexity, a user preference interaction system written in the C# programming language is designed (Figure 5).
Corresponding to the principle of “choose first, evaluate later”, the main user interfaces of the system includes both the Selection interface and the Evaluation interface. In the Selection interface (Figure 5a), users can preview the clustering results of the SOM method, where the image can be zoomed or dragged. After that, users need to select a preferred group. Then, it is moved to the Evaluation interface (Figure 5b), in which users need to evaluate every sample in the selected group. Three simple evaluation options, i.e., “Preferred”, “Acceptable” and “Disliked”, which correspond to 1, 2, and 3 points, are set. Users can choose an appropriate option for the current sample. For reference, all the truss samples in the group are presented in the left window. To ensure the effectiveness of the evaluation information, the current sample is presented in a random order, and some samples will be presented twice. The two evaluation results for the repeated sample will be checked for consistency to judge the validity of the evaluation information.
When the interaction process ends, a training group with labels is automatically output. Furthermore, the proportion of the importance of each truss feature is calculated by the permutation importance method [44]. It is also output to analyze the user preference information.
Five students (numbered from 1 to 5) were invited to participate in the interaction process, which was divided into two phases. In the first phase, each student selected a preferred group and evaluated the samples via the interactive system. Then, another 30 truss samples, similar to the samples in the preferred group, were generated randomly and evaluated by the same student to form a validation group. Furthermore, the range of their feature values needed to be consistent with the ones in the preferred group, which is called Permissible Feature Range (PFR). In the second phase, each student needed to evaluate the remaining eight groups and their pertinent validation groups. Finally, a total of 90 training and validation groups were obtained.

3.5. Selection of Machine Learning (ML) Techniques

To develop the prediction models of preference, two classical ML techniques, i.e., back propagation neural network (BPNN) and random forest (RF), are used. They are briefly explained in the following.
BPNN is a common type of artificial neural network. The basic network structure of BPNN includes an input layer, one or more hidden layers, and an output layer. Each layer contains several neurons that connect to neurons in the adjacent layers with connection weights. During the training phase, the input data is presented to the input neurons. The signals received by each neuron are processed through a weighted sum and converted as an output by an activation function. Then, the output is transmitted to the neurons in the adjacent layer. This process continues until the outputs are produced through the output neurons [45]. BPNN uses a function to gradually reduce the error between the actual outputs and the target outputs (labels in this study) by adjusting the connection weights.
RF [46] is an ensemble learning method composed of a number of decision trees. Each tree is constructed based on a subset of features that are randomly selected and a data subset that is randomly selected from the training data set. The output of RF is the majority or the average of the results of all decision trees. RF shows effective and robust performance since it can overcome the overfitting problem of decision trees.
Both BPNN and RF use the 45 training groups to generate the prediction models. In order to compare the performance between the two methods, two numerical experiments are conducted. In the first one, the reappearance ability of the methods is evaluated. The training groups are employed as input again for the corresponding prediction models to get the outputs, which are continuous values ranging from 1 to 3. On the one hand, the mean square error (MSE) between the predicted and targeted outputs is calculated (Equation (9)). On the other hand, the outputs are rounded to integers and then compared with the labels to obtain the reappearance accuracy (RA, Equation (10)).
M S E = i = 1 N ( y i y i ^ ) 2 N ,
R A = n c N × 100 % ,
where N = number of samples, yi = targeted value of the ith sample, y i ^ = predicted value of the ith sample, and nc = number of correct predictions.
In the second experiment, the validation groups are used as input to evaluate the prediction ability of the methods. Besides the MSE index, prediction accuracy (PA), which has a similar definition to RA, and preference accuracy (PreA, Equation (11)) are also calculated. PreA focuses on the model’s ability to correctly identify the “Preferred” and “Acceptable” samples for users, which is conducive to generating satisfactory structures.
P r e A = n p c n p × 100 % ,
where np = number of samples with “Preferred” or “Acceptable” labels, and npc = number of samples that are correctly predicted.
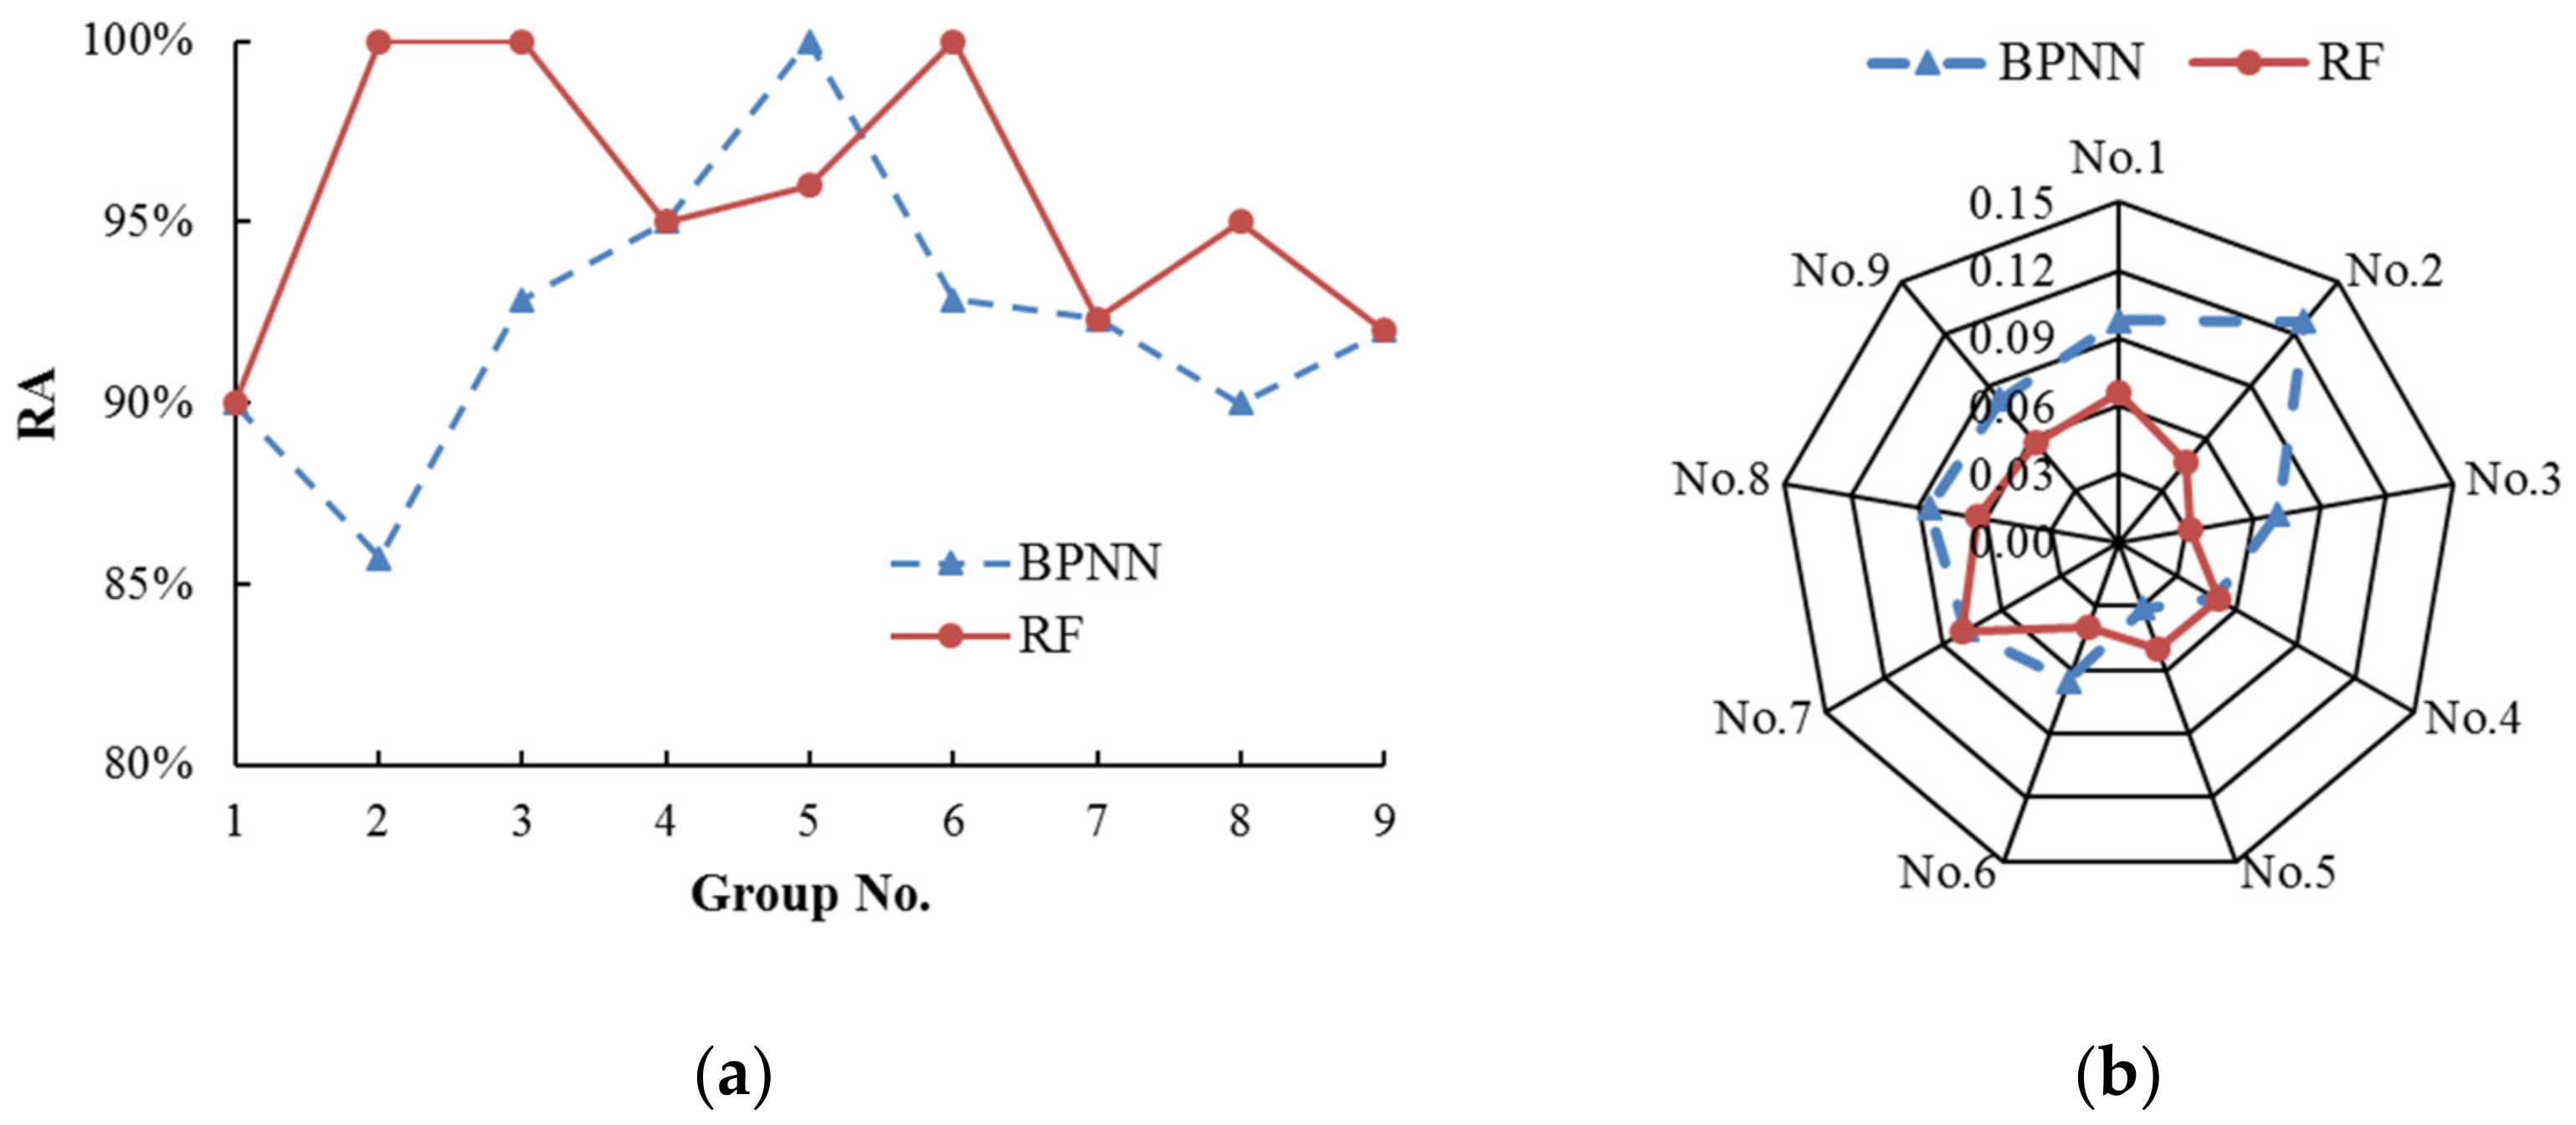
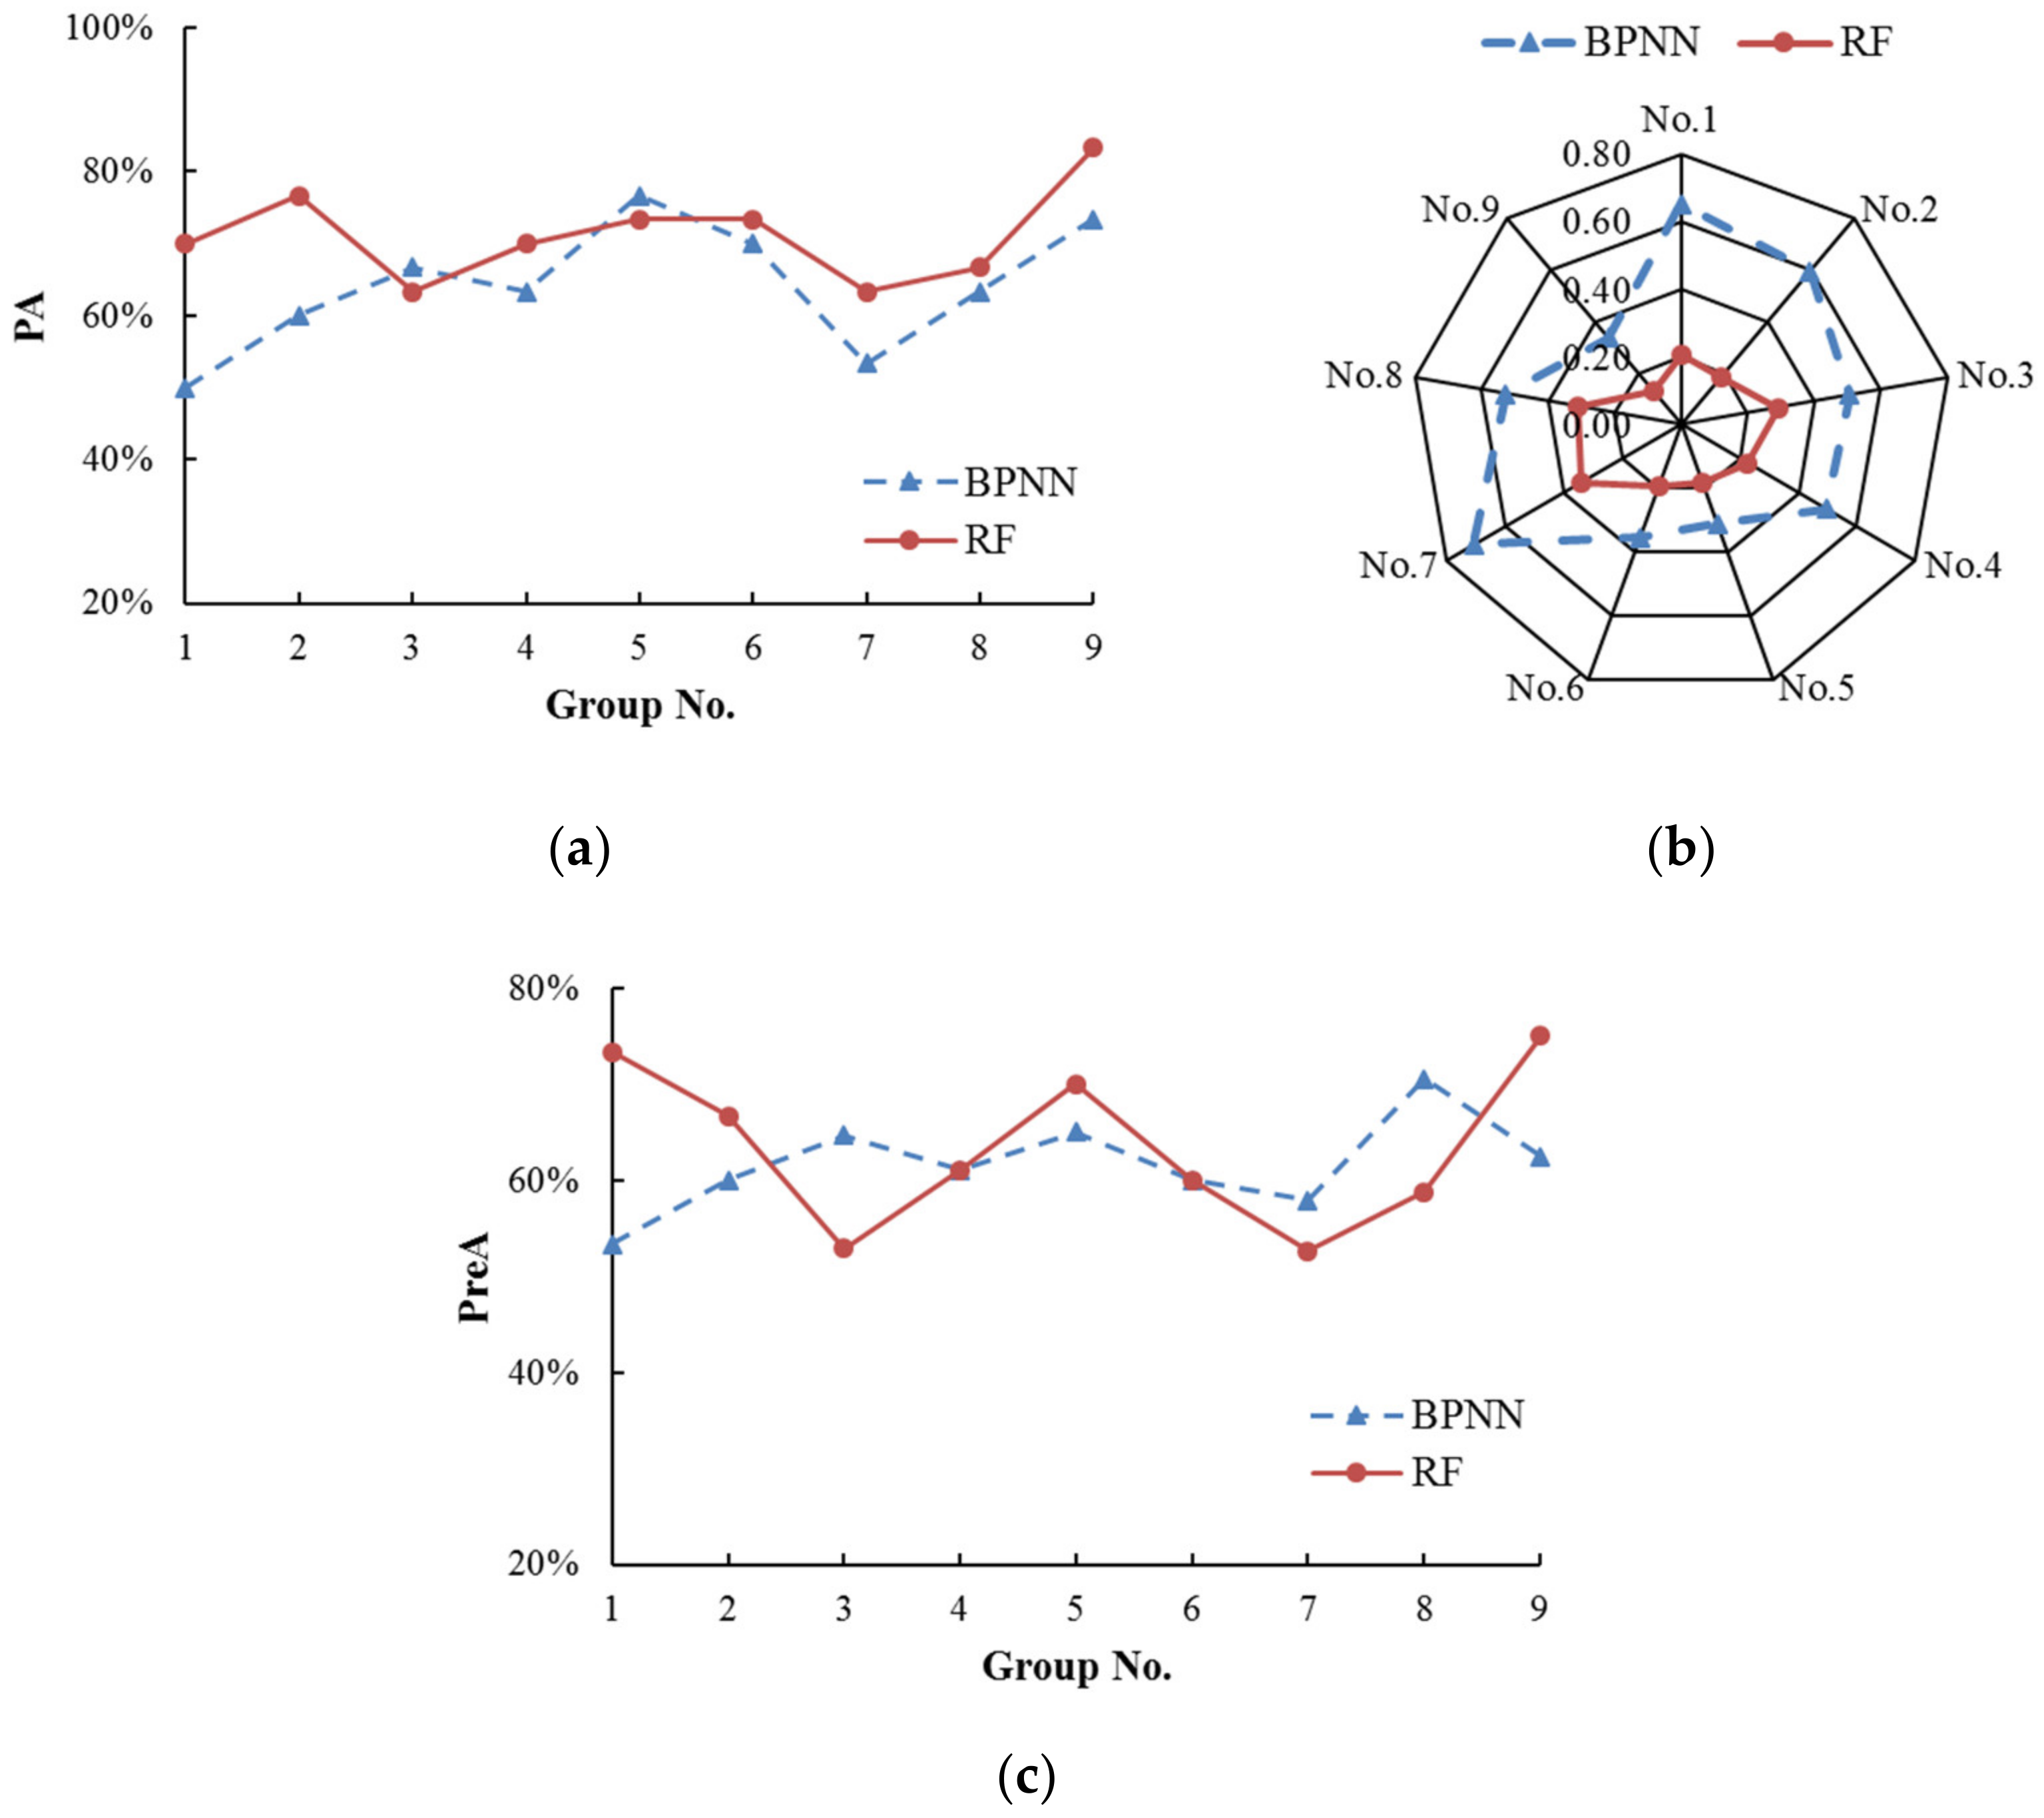
Based on the evaluation information provided by the students, the results of the indexes are summarized for each experiment. Taking the No.2 student as an example, Figure 6 illustrates the index values calculated with the nine training groups in the first experiment, whereas Figure 7 depicts the results based on the nine validation groups in the second experiment.
Figure 6 compares the reappearance ability of the two methods based on the No. 2 student’s evaluation information. It is observed in Figure 6a that the PA values of the RF models are not less than those of the BPNN models in eight groups. The BPNN model achieves a higher PA value only in Group 5. In Figure 6b, obvious differences exist in the MSE values between the two methods for Group 2 and Group 5. This is consistent with the performance of the two methods indicated by the RA index. The MSE values of the BPNN models are generally greater than the ones of the RF models. Figure 7 displays the evaluation results of the prediction ability of the two methods. As seen in Figure 7a, RF models have better performance indicated by higher values of the PA index for seven groups. Similarly, the RF models are advantageous over the BPNN models due to the lower MSE values for all nine groups (Figure 7b). Regarding the PreA index, the RF models also obtain better results than the BPNN models. The RF models obtain a higher PreA value in one more group than the BPNN models (Figure 7c).
To show the evaluation results comprehensively, the average index values of all nine groups are calculated for each student. The results of the two experiments are summarized in Table 4 and Table 5. The RF models are overall advantageous over the BPNN models in all indexes due to higher RA, PA, and PreA values and lower MSE values. This indicates better reappearance and prediction abilities. Besides, the parameters of the RF models are more general than those of the BPNN models. Nearly all the RF models use the same parameters, whereas the parameters have to be adjusted for each BPNN model. Therefore, RF is selected in this study.
In addition, a redundant feature elimination criterion is proposed to improve the accuracy of the prediction model. When a student finishes the evaluation in the first phase (Section 3.4), the proportion of the importance of each feature can be obtained. There would be some features with small proportions of importance, which affect the model performance. In order to explore this effect, the preferred group of each student obtained in the first phase is converted into three groups. The first group includes all nine features, whereas the second and third group eliminate the minimum proportion feature and the last two minimum proportion features. The three groups are used to train the prediction models, respectively. The corresponding validation group is used as input to calculate the PA values. Based on the results, a conservative criterion is obtained, namely, if the proportion of the minimum proportion feature is less than 1%, it can be identified as a redundant feature and eliminated. Using this conservative criterion, the redundant feature is automatically checked and eliminated when a user finishes the evaluation. After that, the prediction model of user preference can be developed.

4. Cost Function Based on Modified Physical Programming (MPP)

This section focuses on the combination of the prediction model of user preference and the STSA method. An aggregate function based on MPP is constructed to coordinate the user preference objective with other objectives, such as structural weight. On this basis, a cost function is further designed by taking the design constraints into account. Finally, an innovative design method named STSA-P is proposed.

4.1. Physical Programming (PP) Synopsis

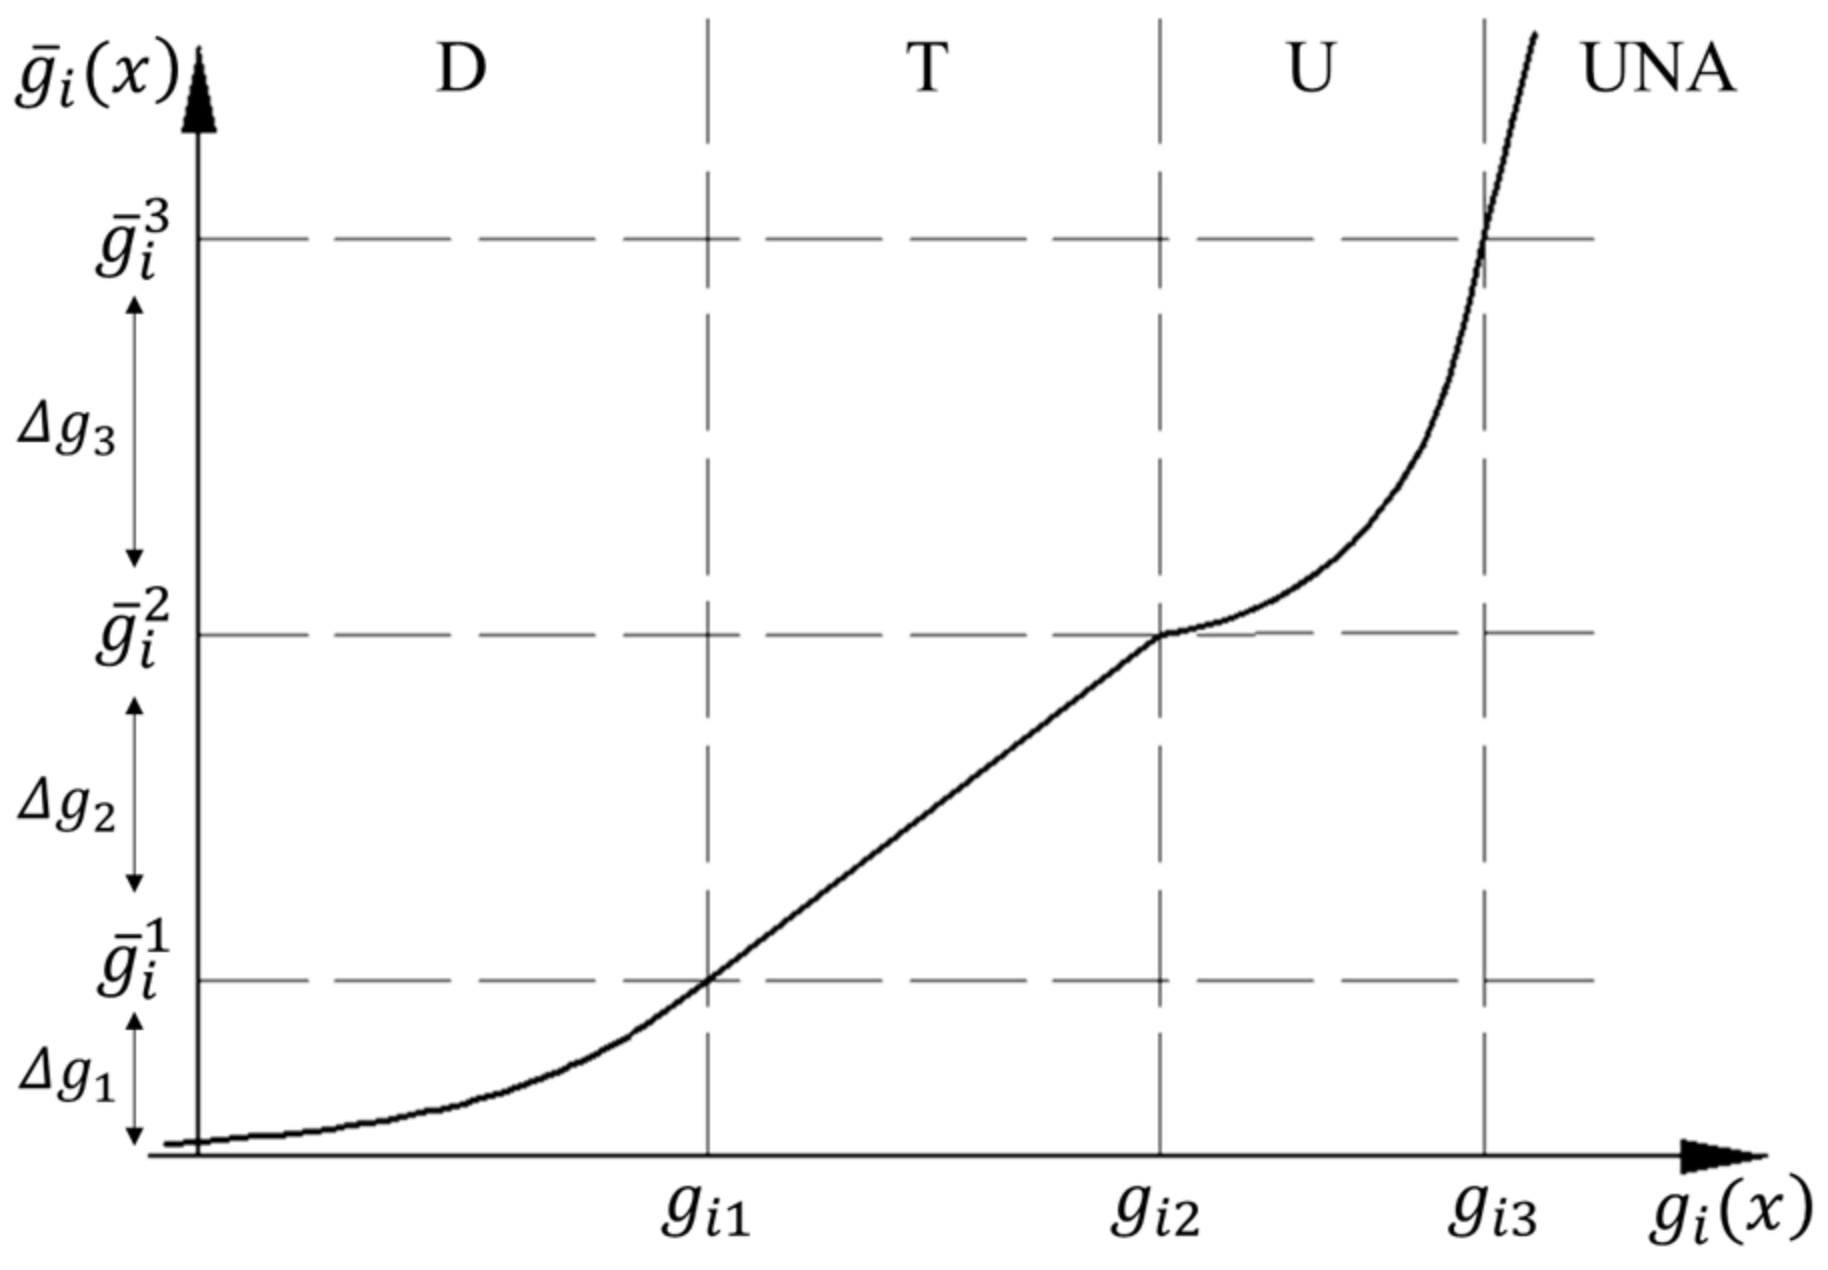
PP is a user-friendly multi-objective optimization method that eliminates the process of assigning subjective weights. According to the PP procedure, the users’ expectations for design objectives can be classified into four classes: smaller is better (Class 1), larger is better (Class 2), value is better (Class 3) and range is better (Class 4). Each class comprises two cases, hard (H) and soft (S), depending on the sharpness of the expectations [31]. In the soft classes, users need to specify several ranges for each objective to show the degrees of satisfaction. A corresponding class function is built to map the objective function to a non-dimensional space, where all the objectives with different physical meanings and orders of magnitude have the same numerical scale. Figure 8. shows one possible class function of 1-S (soft case of Class 1).
The objective function   g i ( x ) is illustrated on the horizontal axis. The corresponding class function g ¯ i ( x ) is shown on the vertical axis. Six ranges for the objective are given: highly desirable (HD), desirable (D), tolerable (T), undesirable (U), highly undesirable (HU), and unacceptable (UNA). The parameters g i 1 to g i 5 are the boundary values of the ranges, which are specified by users and directly reflect the users’ expectations. To ensure the same scale for each class function, the parameters g ¯ i 1 to g ¯ i 5 , corresponding to g i 1 to g i 5 , should be the same for different class functions. These parameters can be calculated as:
g ¯ i 1 = Δ g 1 ,   take   a   small   value
Δ g k = β n s c Δ g k 1 ,   k = 2 ,   3 ,   4 ,   5
g ¯ i k = g ¯ i k 1 + Δ g k ,   k = 2 ,   3 ,   4 ,   5 ,
where nsc = number of objective functions, and β = parameter of convexity, generally greater than 1.
The curve of the 1-S class function has two parts. The first part, in the HD range ( g i ( x ) < g i 1 ), is represented by a decaying exponential. The second part, in the D, T, U and HU ranges, takes the form of a spline segment. The class function should meet the requirements including continuous first derivative and strictly positive second derivative [30]. These settings are beneficial for gradient-based methods in searching for the optimal solution [47]. However, they also lead to complicated calculations of the class function.
The aggregate function G(x) is formed by combing all the class functions (Equation (15)). Thus, a MOP can be transformed into an SOP.
min G ( x ) = lg ( 1 n s c i = 1 n s c g ¯ i [ g i ( x ) ] ) ,
subject to
g i ( x ) g i 5   ( for   1 - S ) .

4.2. Coordination of Multiple Objectives with MPP

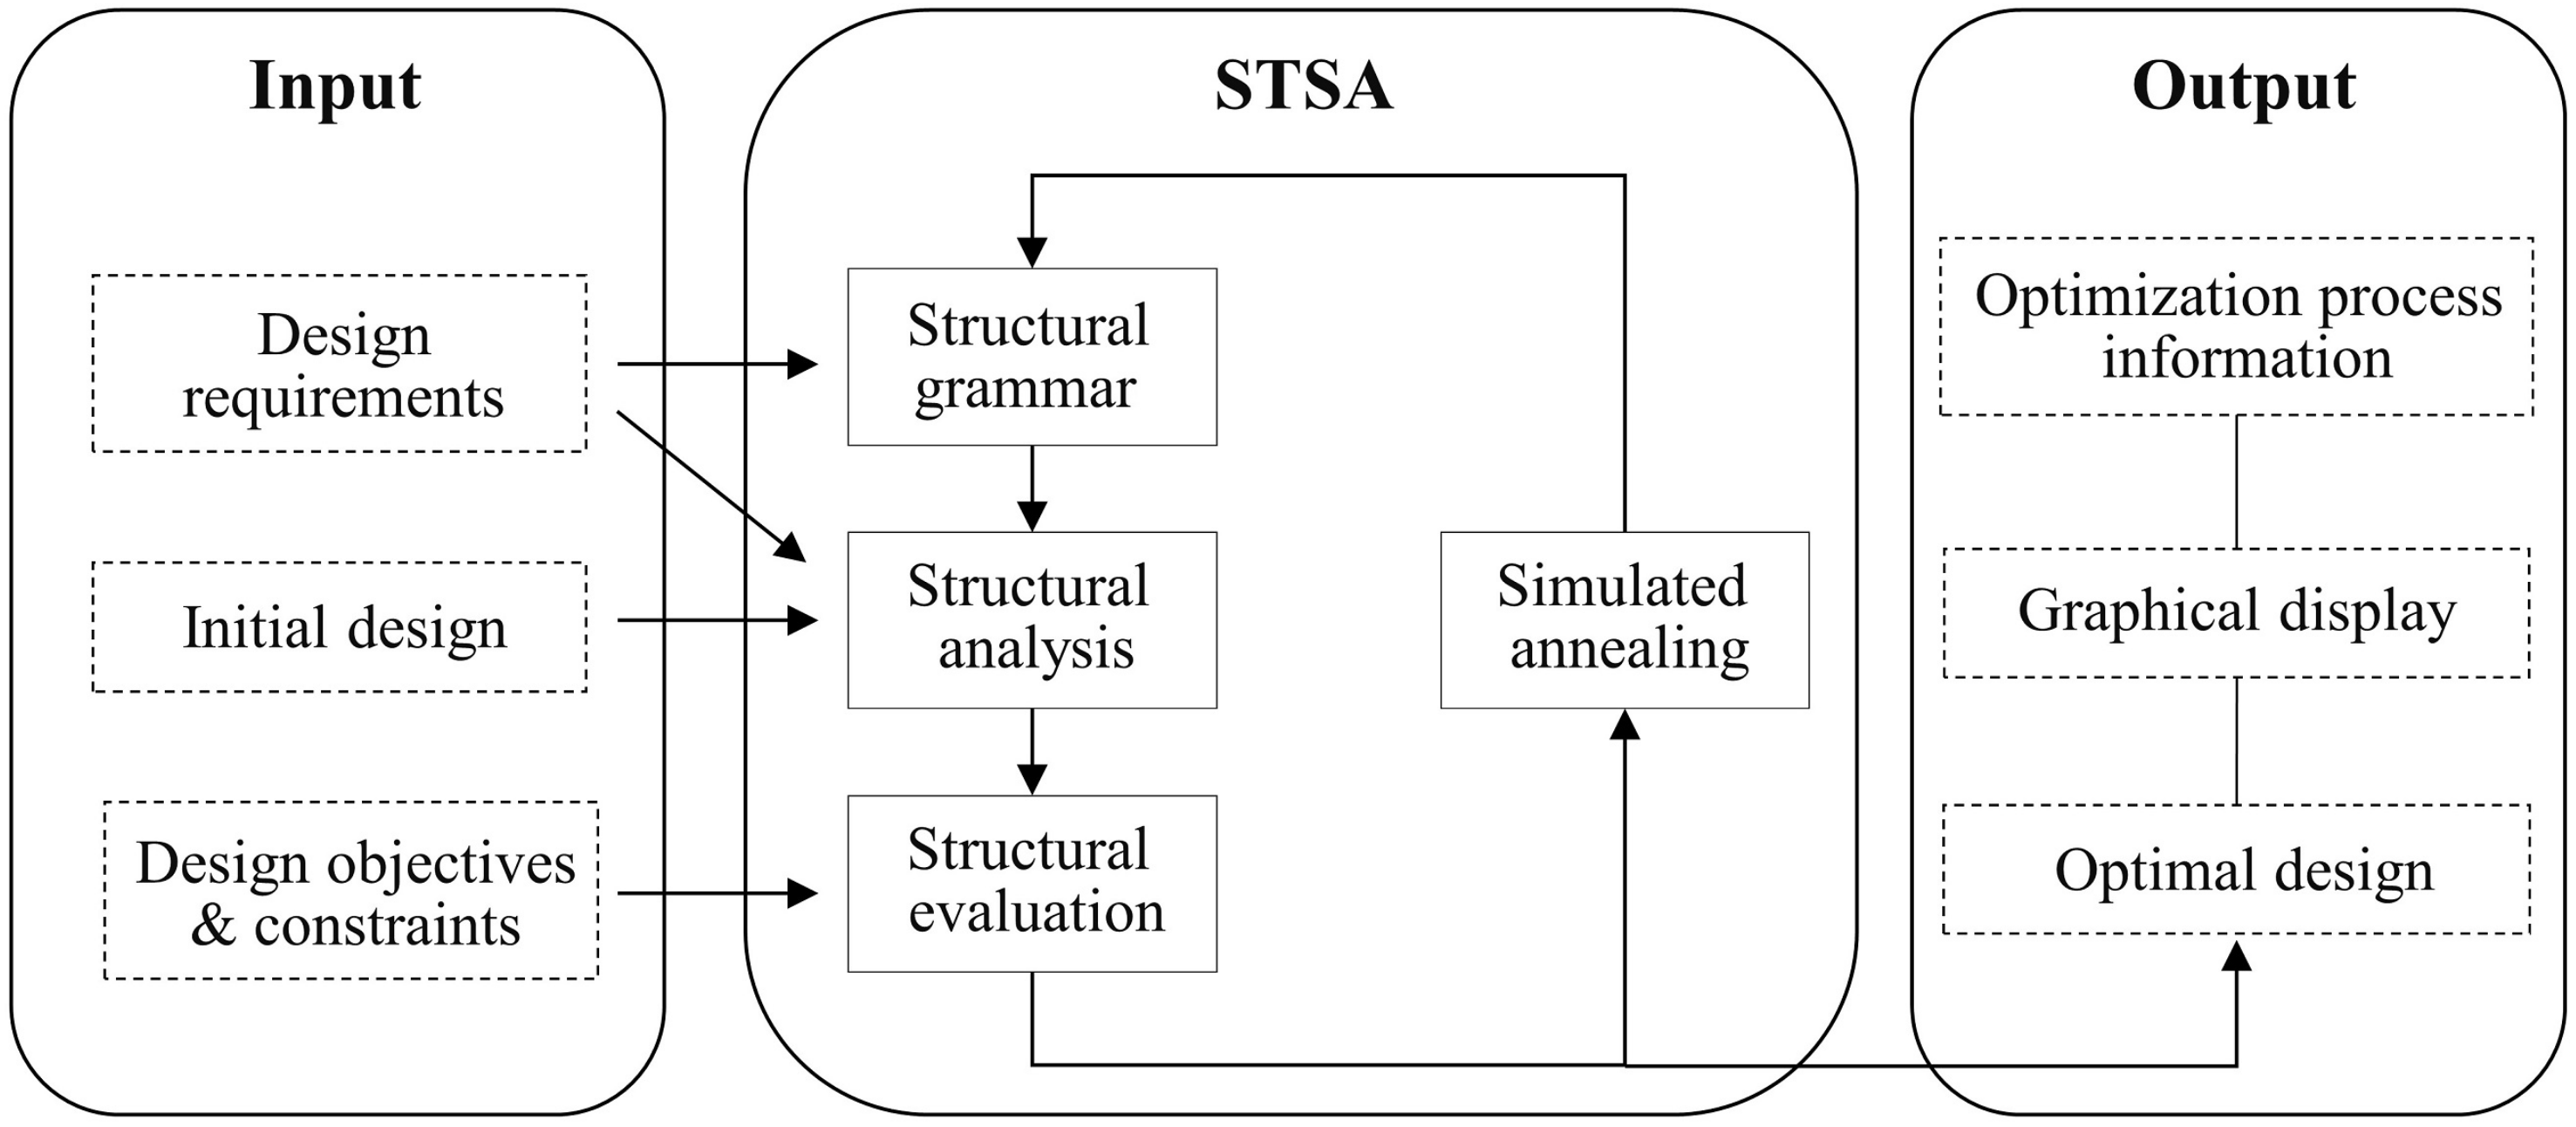
The prediction model of user preference is integrated into the STSA method to guide the generation of a satisfactory structure. The STSA method combines structural grammar and performance evaluation with a stochastic optimization technique (simulated annealing, SA) [1]. It can be used for topology generation and optimization of discrete structures. Structural grammar defines the basic units (e.g., triangles in 2D, tetrahedrons in 3D) and rules for the structural modification in sectional size, global shape, and topology, which can modify and transform the structures more flexibly. Similarly to human languages, the basic units can form a structure based on structural grammar. STSA improves the initial design continuously with structural grammar based on the feedback from performance evaluation until the final design meets the design goals of safety, efficiency, and economy. The workflow is shown in Figure 9 [1].
Generally, many design factors, such as weight, displacement, stiffness, stress, frequency, etc., can be employed as the design objectives when STSA is applied to design structures. In this study, weight and displacement are selected as the first and second design objectives. Meanwhile, user preference is introduced as a third objective based on the prediction model. These objective functions are defined as follows:
g 1 = min i = 1 n ρ l i s i ,
g 2 = min [ max 1 j m ( d i s p j ) ] ,
g 3 = min p r e f ,
where ρ = material density, n = number of members, li = length of the ith member, si = sectional area of the ith member, m = number of nodes, dispj = displacement of the jth node, and pref = preference prediction value of the structure.
Structural weight (Equation (17)) is a classical design objective in structural optimization. The smaller the weight, the better the structure. The objective of node displacement (Equation (18)) minimizes the maximum displacement at all the structural nodes. Similarly, the user preference objective (Equation (19)) minimizes the preference prediction value of the generated structures. A smaller value means a higher user satisfaction with the structural appearance. All three objectives conform to the feature of “smaller is better”, which can be represented by 1-S.
For the objectives of structural weight and node displacement, the class function of the PP method is redesigned and shown in Figure 10.
The number of ranges for each objective is simplified to four (D, T, U, UNA), in which D, T, and U are pertinent to the evaluation options “Preferred”, “Acceptable” and “Disliked” in the interactive system, respectively. The curve of the new class function expands to the UNA range, which is originally regarded as the “infeasible region” in the PP method. This is beneficial for the full exploration of the optimal structure, especially in the early optimization phase. The new class function contains three expressions. The first one is represented by a continuous quadratic function in the U and UNA ranges, where the objective value is expected to enter the U range from the UNA range quickly at a larger slope. Then the slope at the left boundary of the U range becomes smaller to reduce the impact of the current objective. It is conducive to the uniform optimization of all objectives. The second expression in the T range is set to be a linear function to keep a high slope throughout the range. This makes the objective values move quickly to the D range. The third expression in the D range is represented by an exponential function. The curves in the D and T ranges are continuous and have the same slope at the boundary. The new class function is defined as:
g ¯ i ( x ) = { g ¯ i 2 + Δ g 3 [ g i ( x ) g i 2 g i 3 g i 2 ] 2     , g i ( x ) > g i 2 Δ g 2 g i 2 g i 1 [ g i ( x ) g i 1 ] + g ¯ i 1   , g i 1 g i ( x ) g i 2 g ¯ i 1 exp { Δ g 2 ( g i 2 g i 1 ) g ¯ i 1 [ g i ( x ) g i 1 ] }   , g i ( x ) < g i 1
The parameters   g i 1 to g i 3 need to be specified by users, whereas the parameters on the vertical axis are calculated by Equations (12)–(14).
For the user preference objective, the expressions of class function are the same as those of the weight and displacement objectives in the D, T, and U ranges, whereas a special expression is used in the UNA range. The boundary values g i 1 , g i 2 and g i 3 are determined as 1.5, 2.5, and 3, according to the evaluation options and the rounding rule. The prediction model runs only when all the feature values of the current structure are in the Permissible Feature Range (PFR, defined in Section 3.4) of the training data. Therefore, the class function in the UNA range is constructed based on the differences between the feature values and PFR:
g ¯ i ( x ) = g ¯ i 3 + ξ + j = 1 N f v j 2   ,   x j [ x min j , x max j ] ,
v j = { η x j x max j x max j x min j   , x j > x max j 0     , x min j x j x max j η x min j x j x max j x min j   , x j < x min j ,
where Nf = number of features without redundant features, ξ= a penalty constant, η= a penalty coefficient, xj = value of the jth feature of the current structure, x max j = maximum value of the jth feature of the samples in the training group, and x min j = minimum value of the jth feature of the samples in the training group.
Equation (22) calculates the difference between the jth feature of the current structure and PFR. Then, the result is substituted into Equation (21) to calculate the value of the class function in the UNA range. The parameters ξ and η generally take large values to penalize the structure when feature values are outside the PFR. The class function of the user preference objective is defined as:
g ¯ i ( x ) = { g ¯ i 3 + ξ + j = 1 N f v j 2 , x j [ x min j , x max j ] g ¯ i 2 + Δ g 3 [ g i ( x ) g i 2 g i 3 g i 2 ] 2   , g i 2 < g i ( x ) g i 3 Δ g 2 g i 2 g i 1 [ g i ( x ) g i 1 ] + g ¯ i 1   , g i 1 g i ( x ) g i 2 g ¯ i 1 exp { Δ g 2 ( g i 2 g i 1 ) g ¯ i 1 [ g i ( x ) g i 1 ] }   , g i ( x ) < g i 1
A simplified form is adopted for the aggregate function:
min G ( x ) = i = 1 n s c g ¯ i [ g i ( x ) ] ,
subject to
r n r ( x ) 0 ,
where nr = number of constraint functions, and r n r ( x ) = the nrth inequality constraint function.
During the original design process of the PP method, if the final design result or the performance of an objective fails to meet the user’s needs, the user can improve them by adjusting or resetting the boundary values. However, this manner has some drawbacks. Firstly, the adjusted boundary values may be against the original expectations of the user. Secondly, the boundary values for some objectives are unchangeable. For example, the boundary values for the user preference objective are fixed according to the rounding rule and the evaluation options in the interactive system. To solve this problem, an adjustment coefficient α is introduced to avoid the modification of boundary values. Then, the modified aggregate function G(x) is given as:
min G ( x ) = i = 1 n s c α i g ¯ i [ g i ( x ) ] ,
subject to
r n r ( x ) 0 .
Each objective corresponds to one adjustment coefficient. The default value is 1. A user can improve the performance of an objective by increasing the pertinent coefficient, which is equivalent to increasing the weight of the objective. To verify the effectiveness of the coefficient, a simple numerical example is presented:
min g ( x ) = [ g 1 ( x ) , g 2 ( x ) , g 3 ( x ) ] ,
subject to
x 1 + x 2 + x 3 8 ,   0 x i 5 ,   i = 1 , 2 , 3 ,
where
g 1 ( x ) = 2 x 1 3 2 x 2 2 x 3 2 + 1 ,
g 2 ( x ) = 3 x 2 3 x 1 2 2 x 3 2 2 ,
g 3 ( x ) = 4 x 3 3 3 x 1 2 x 2 2 4 ,
The class function for the three objectives can be calculated by Equation (20). The boundary values are given in Table 6. The SA method is used to solve the optimization problem. The results are shown in Equations (33) and (34).
(x1, x2, x3) = (0.9921, 0.4639, 1.0061),
g(x)= (1.5103, −4.7093, −3.0941).
According to Equation (34) and Table 6 the three objective values lie in the U, D, and T ranges, respectively. The result of the first objective g1(x) in the U range is not satisfactory. Therefore, the user can increase the adjustment coefficient of g1(x). Then, the new results are shown in Equations (35) and (36).
(x1, x2, x3) = (0.6893, 0.6460, 1.1625),
g(x)= (−0.5310, −4.3690, −0.4408).
It is observed that the three objective values lie in the T, D, and T ranges, respectively. Compared to the initial results, the first objective is significantly improved, whereas the other two objective values still lie in good ranges. Thus, the adjustment coefficient can improve the result effectively without changing the boundary values.

4.3. Treatment of Design Constraints

Many design constraints, e.g., stress constraints and geometric constraints, need to be considered in the design process of truss structures. Generally, these design constraints are regarded as hard constraints, i.e., they cannot be violated. This study tends to handle the constraints as soft constraints, which means that they can be violated during the optimization process. Meanwhile, the final result needs to satisfy the constraints. This is beneficial to the full exploration of the optimal result.
The penalty parameter r of constraint violation (Equation (37)) is set to be associated with the iteration steps. In the early stage of optimization, the penalty for the constraint violation is small, i.e., the value of r is small. As the optimization progresses, the value of r gradually increases, which indicates a larger penalty for the constraint violation. At the late stage of optimization, the penalty is sufficiently large to make the final result satisfy the constraints.
r = T 2 ,
where T = number of the current step of STSA during the iteration.
For the ith constraint, the constraint violation vi(x) is defined as the proportion of the current constraint value exceeding the constraint limit:
v i ( x ) = { k max ( v a l k v a l l i m i t 1 , 0 )   , if   v a l l i m i t   is   the   upper   limit   value k max ( 1 v a l k v a l l i m i t , 0 )   , if   v a l l i m i t   is   the   lower   limit   value   ,
where valk = value of constraint function of the kth unit, for example, the tensile stress of the kth member, vallimit = value of constraint limit.
Thus, the penalty term V(x) of constraint violation is defined by Equation (39):
V ( x ) = 1 + r i = 1 n r v i ( x ) ,
min c o s t = V ( x ) G ( x ) = [ 1 + r i = 1 n r v i ( x ) ] j = 1 n s c α j g ¯ j [ g j ( x ) ] .
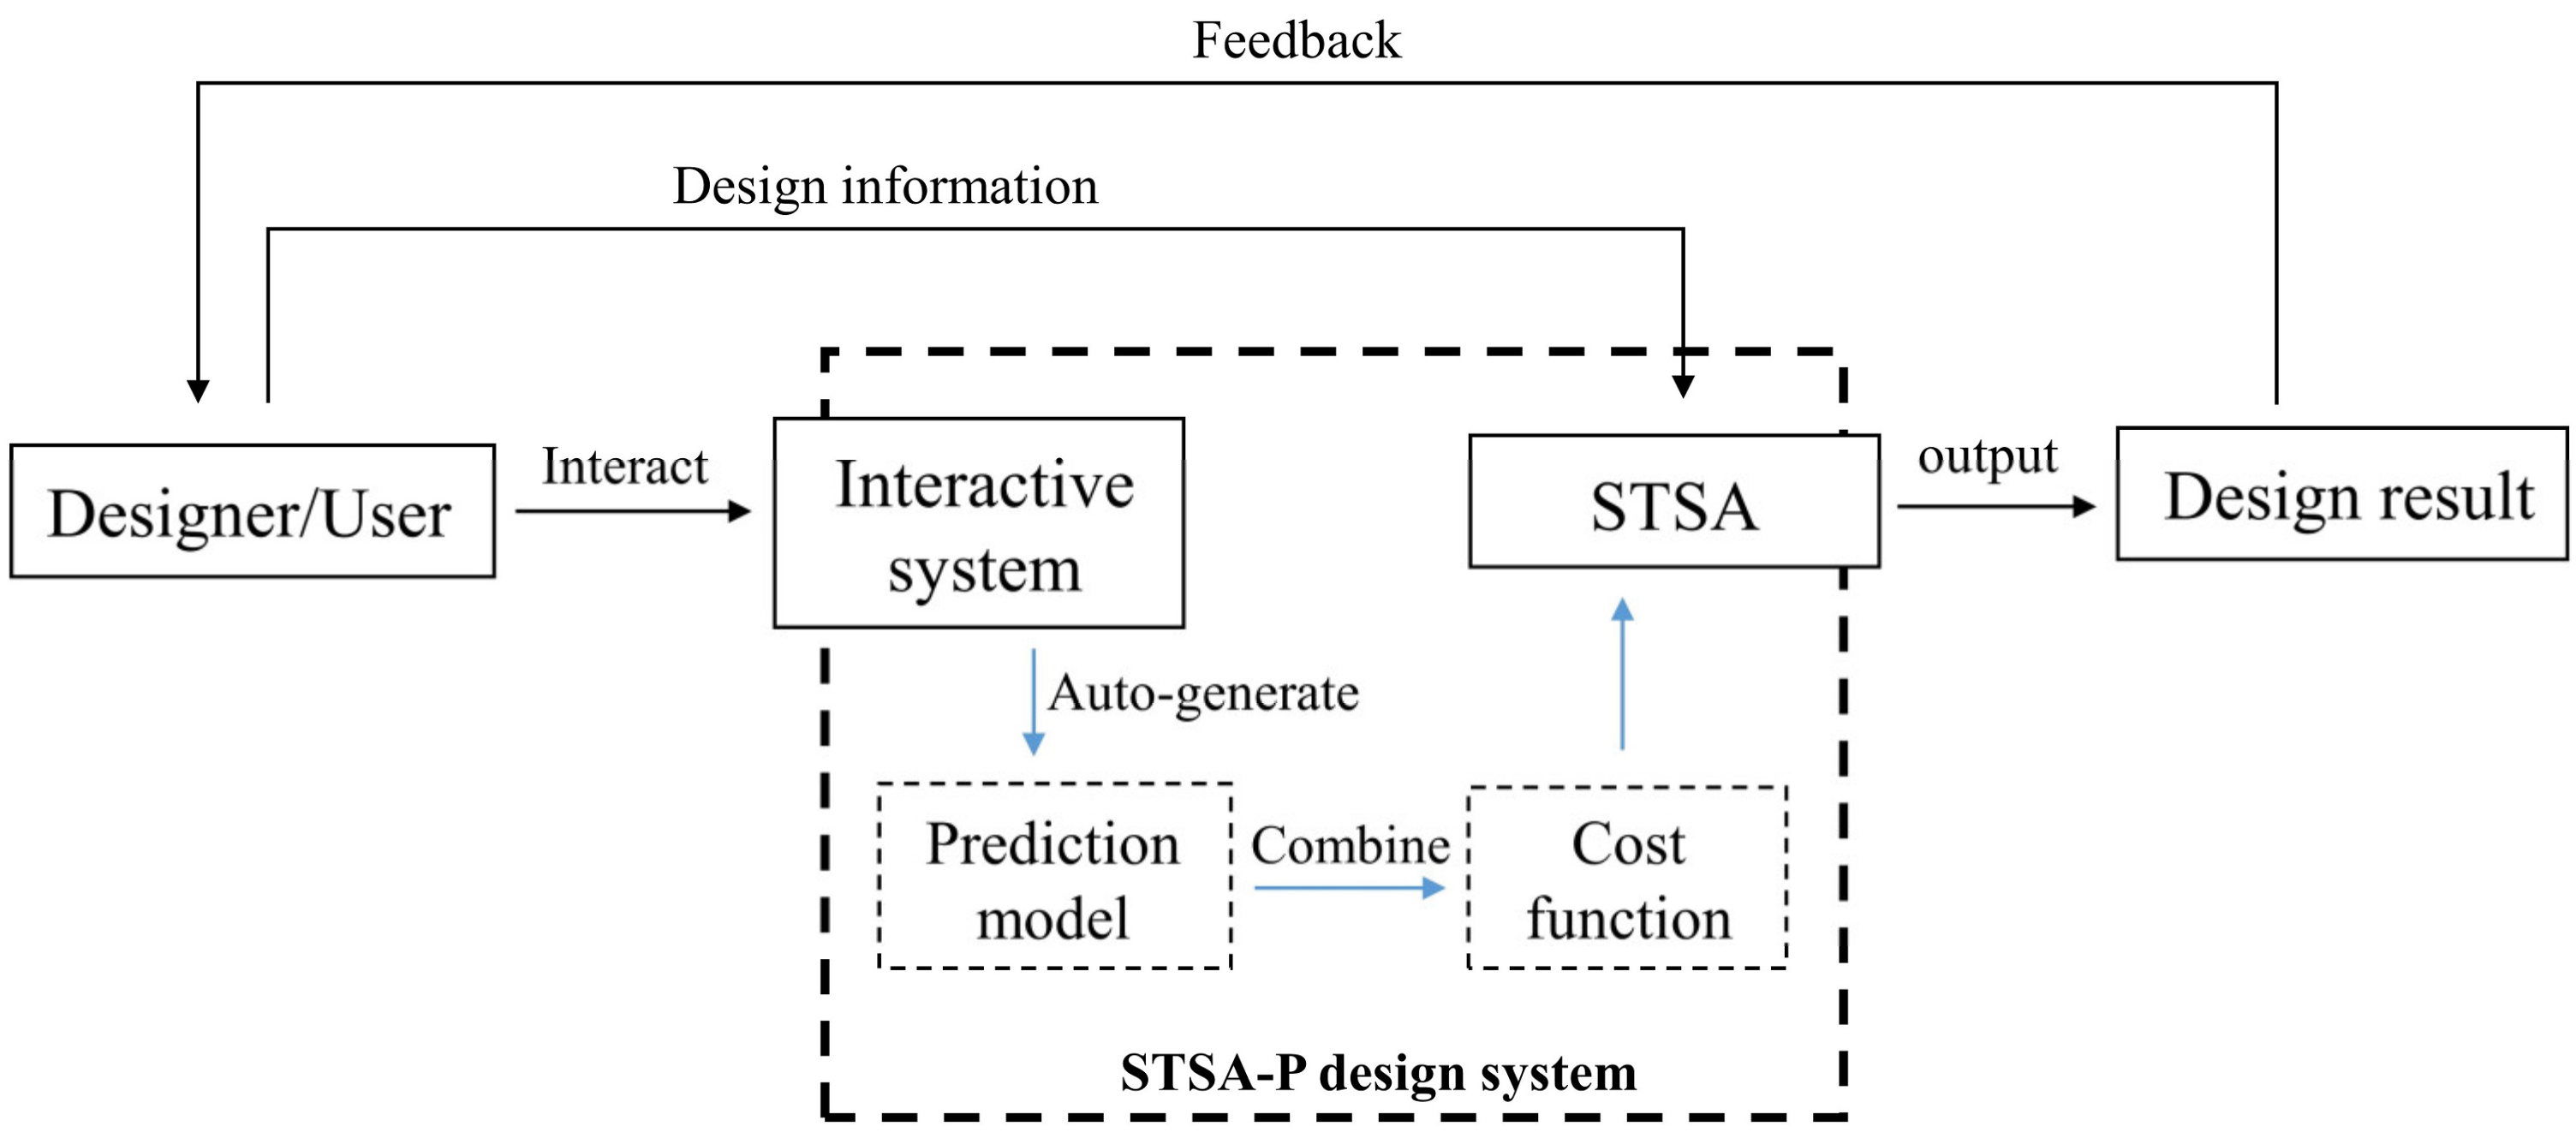
The new cost function (Equation (40)) is obtained by multiplying V(x) and G(x), which describes the quality of a new design during the optimization process. It combines the prediction model with the STSA method. On this basis, a new automated design method named STSA-P is established for the plane trusses, which applies user preference information. The design process using STSA-P is shown in Figure 11.
The combination of the interactive system and the STSA algorithm forms the STSA-P design system. Designing a truss structure with this system, designers or users can preset some design information, such as boundary values, and they need to complete the evaluation using the interactive system. Then, the prediction model of user preference is automatically developed and combined with the cost function. After that, the optimization process starts. Finally, the design result is obtained. if the result fails to meet the user’s needs, the designer or user can improve the result by modifying the adjustment coefficient until a satisfactory result is achieved.
5. Design Example

To verify the practicality of the STSA-P method, a design example of a plane truss structure is presented. Five students were invited to participate in the design process. In fact, the design results generated by the STSA-P method include only two conditions, no matter how many students were surveyed. In the former, students obtain a satisfactory result without any adjustment. In the latter, students are not satisfied with the initial result and they modify the adjustment coefficient α (proposed in Section 4.2) to get the satisfactory result. Therefore, only two students’ results representing the two conditions are presented, for brevity.

5.1. Case Information

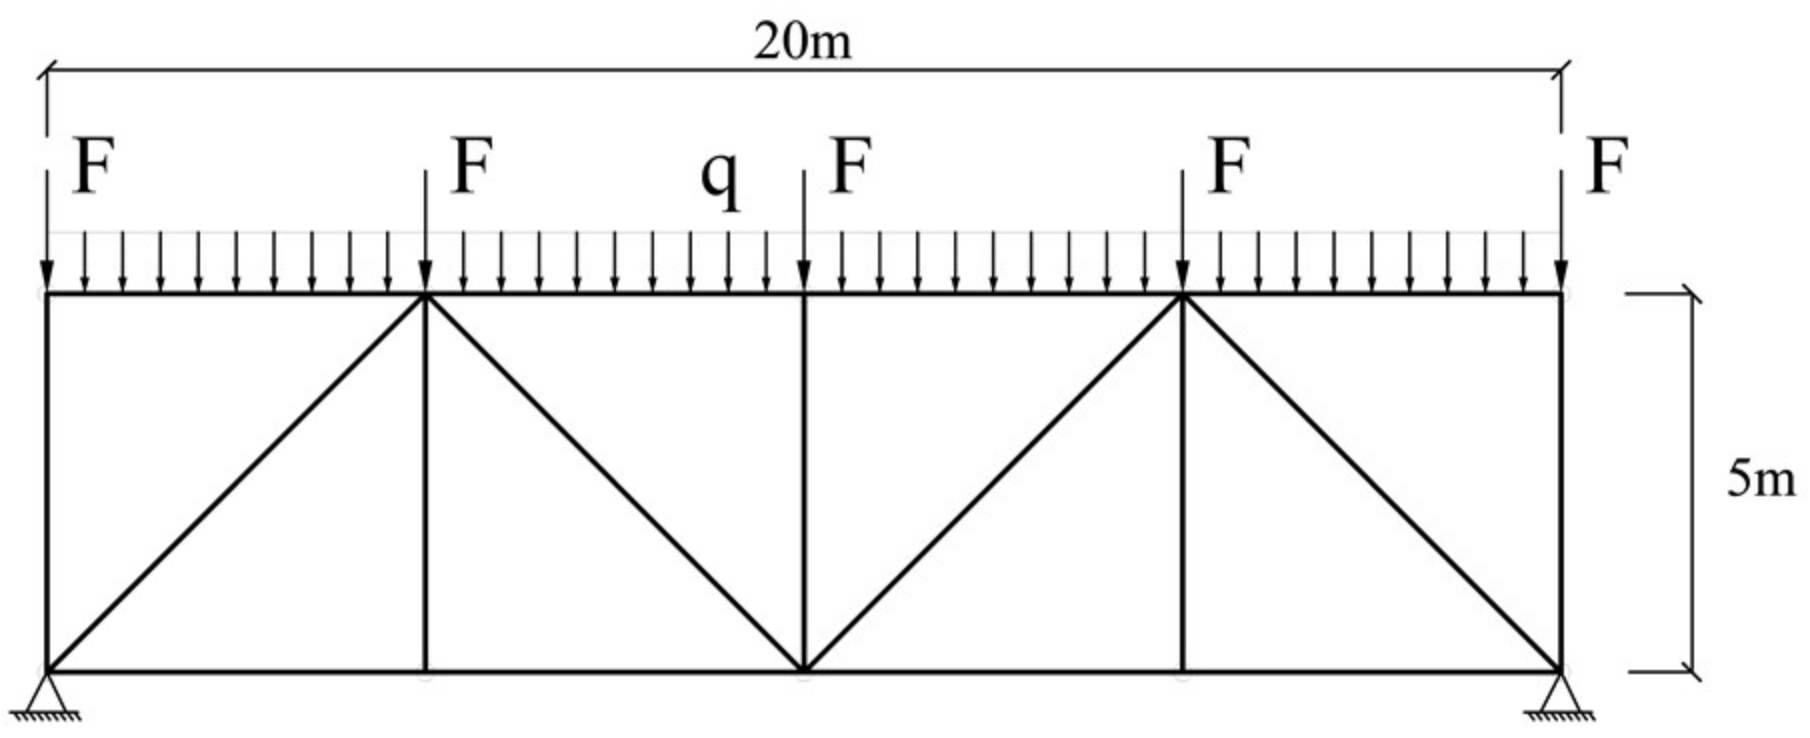
Figure 12 shows the initial steel truss structure with a span of 20 m. Both the concentrated and distributed loads are applied to the top chord. Note that the loading points can move freely during the optimization process. The design objectives include minimizing the structural weight, node displacement, and user preference. The detailed information is summarized in Table 7.
The two students completed the interactive evaluation independently. The user preference information was analyzed and no redundant feature was found based on the evaluation results of both students. The boundary values of the four ranges (D, T, U, UNA) of each objective are summarized in Table 8.

5.2. Design Results

Table 9 shows the proportion of importance of the truss features based on the evaluation results of the two students. Both students pay more attention to the symmetry of the truss structure, although they selected different groups to evaluate. MCH obtains the minimum proportion of 2.14% according to the first student’s preference, whereas NM obtains the minimum proportion of 4.83% for the second student. Since both the two proportions are more than 1%, there is no redundant feature.
For the first student, the design results are summarized in Table 10. The final truss structure is shown in Figure 13.
It is seen that all the objective values are within the proper ranges, in which the displacement objective values lie in the D range. The truss structure is arched with strong top chord members, which conforms to the mechanical requirements. In addition, the whole structure has a certain degree of symmetry. In general, the student is satisfied with the design of this truss structure.
The results of the second student are shown in Table 11 and Figure 14. Note that an asymmetric optimization result can be generated (e.g., in Figure 14a) since the loading point of the initial structure can move freely and become asymmetric during the optimization process.
All the objective values of the initial results are in the T range. However, the symmetry of the truss structure is poor, as shown in Figure 14a, and the student is not satisfied with the structure, especially the structural shape. Thus, the adjustment coefficient of the user preference objective is changed to improve the results. The new result achieves a great improvement in the user preference objective. The value of the objective enters into the D range from the T range, whereas the values of the other two objectives become greater, but still in the T range. As depicted in Figure 14b, the symmetry of the new structure is better than the initial one. In addition, the strong members also form an arch. Finally, the student is satisfied with the new truss structure.
To measure the impact of user preference on the optimization results, a simple index named Influence Degree (I) is proposed. It is calculated based on the change in the structural weight with and without the consideration of the user preference under the same displacement limit:
I = m p m o m o × 100 % ,
where mp = structural weight with the consideration of user preference, mo = structural weight without the consideration of user preference.
The index I reflects the cost of considering the user preference. Taking the two design results mentioned above as examples, the index I is summarized in Table 12.
Regarding the result of the first student, the weight of the structure considering the user preference is 57.11% more than the one without considering the user preference. This indicates a large increase in construction costs. By contrast, the value is 15.19% based on the results of the second student. Index I can help the users weigh the cost and decide whether to accept the design result.

6. Conclusions

This paper proposes a new design method named STSA-P for plane trusses which incorporates user preference into the structural design process. The design method quantifies the preference information by developing a prediction model which transforms the information into an additional design objective. It realizes the coordination of multiple qualitative and quantitative objectives, allowing user preference to guide the search process to explore various designs. The user only needs to set boundary values and perform a short interaction via the interactive system. Then, the final design is generated automatically. Due to the short interaction and the reusable preference information, this method effectively reduces user fatigue and dependence on users. A design example is illustrated to confirm the effectiveness of the proposed method.
Specifically, the construction of the prediction model is split into two steps, i.e., generating a valid data set and selecting an appropriate machine learning (ML) technique. A series of subjective and numerical experiments are designed and carried out to ensure the rationality of the steps and the accuracy of the prediction model. To coordinate user preference with other objectives of structural performance, an aggregate objective function is proposed based on the Modified Physical Programming (MPP) method. In addition, the cost function is further designed by considering design constraints, which effectively incorporates the prediction model into the STSA method.
Besides the user preference objective, only two structural performance objectives, i.e., structural weight and displacement, are considered in the STSA-P method. In order to extend the functionality of the method, further studies can be carried out by incorporating more design objectives, such as structural stiffness and natural frequency, into the STSA-P method.

Author Contributions

Conceptualization, T.Z. and X.Z.; methodology, T.Z. and W.X.; software, T.Z.; validation, T.Z., X.Z. and W.X.; formal analysis, T.Z.; investigation, T.Z.; resources, X.Z.; data curation, T.Z.; writing—original draft preparation, T.Z.; writing—review and editing, W.X. and X.Z.; visualization, T.Z. and W.X.; supervision, W.X. and X.Z.; project administration, X.Z.; funding acquisition, X.Z. All authors have read and agreed to the published version of the manuscript.

Funding

This research was funded by Shanghai Qi Zhi Institute, grant number SYXF0120020110.

Institutional Review Board Statement

Not applicable.

Informed Consent Statement

Not applicable.

Data Availability Statement

The data used to support the findings of this study are available from the corresponding author upon request.

Conflicts of Interest

The authors declare no conflict of interest. The funders had no role in the design of the study; in the collection, analyses, or interpretation of data; in the writing of the manuscript; or in the decision to publish the results.

References

  1. Shea, K.; Smith, I.; Asce, F. Improving Full-Scale Transmission Tower Design through Topology and Shape Optimization. J. Struct. Eng. 2006, 132, 781–790. [Google Scholar] [CrossRef] [Green Version]
  2. Shea, K.; Zhao, X. A novel noon mark cantilever support: From design generation to realization. In Proceedings of the IASS 2004: Shell and Spatial Sturctures from Models to Realization, Montpellier, France, 20–24 September 2004. [Google Scholar]
  3. Zhao, X.; Shea, K. Intelligent generation and design of spatial truss structures. J. Build. Struct. 2010, 31, 63–69. [Google Scholar]
  4. Kelly, J.C.; Maheut, P.; Petiot, J.; Papalambros, P.Y. Incorporating user shape preference in engineering design optimisation. J. Eng. Des. 2011, 22, 627–650. [Google Scholar] [CrossRef]
  5. Nagamachi, M. Kansei engineering approach to automotive. J. Soc. Automot. Eng. Jpn. 1989, 43, 94–100. [Google Scholar]
  6. Nagamachi, M. An image technology expert system and its application to design consultation. Int. J. Hum.-Comput. Interact. 1991, 3, 267–279. [Google Scholar] [CrossRef]
  7. Takagi, H. Interactive evolutionary computation: Fusion of the capabilities of EC optimization and human evaluation. Proc. IEEE 2001, 89, 1275–1296. [Google Scholar] [CrossRef] [Green Version]
  8. Von Buelow, P. Suitability of genetic based exploration in the creative design process. Digit. Creat. 2008, 19, 51–61. [Google Scholar] [CrossRef]
  9. Turrin, M.; Von Buelow, P.; Stouffs, R. Design explorations of performance driven geometry in architectural design using parametric modeling and genetic algorithms. Adv. Eng. Inform. 2011, 25, 656–675. [Google Scholar] [CrossRef]
  10. Mueller, C.; Ochsendorf, J. An Interactive Evolutionary Framework for Structural Design. In Proceedings of the 7th International Seminar of the IASS Structural Morphology Group, London, UK, 17–18 September 2011. [Google Scholar]
  11. Mueller, C.T.; Ochsendorf, J.A. Combining structural performance and designer preferences in evolutionary design space exploration. Autom. Constr. 2015, 52, 70–82. [Google Scholar] [CrossRef] [Green Version]
  12. Felkner, J.; Chatzi, E.; Kotnik, T. Interactive particle swarm optimization for the architectural design of truss structures. In Proceedings of the 2013 IEEE Symposium on Computational Intelligence for Engineering Solutions (CIES), Singapore, 16–19 April 2013; IEEE: Piscataway, NJ, USA, 2013. [Google Scholar]
  13. Felkner, J.; Chatzi, E.; Kotnik, T. Architectural feedback in the structural optimization process. In Structures and Architecture: Concepts, Applications and Challenges; CRC Press: London, UK, 2013. [Google Scholar]
  14. Felkner, J.; Chatzi, E.; Kotnik, T. Interactive truss design using Particle Swarm Optimization and NURBS curves. J. Build. Eng. 2015, 4, 60–74. [Google Scholar] [CrossRef]
  15. Furuta, H.; Hase, H.; Watanabe, E.; Tonegawa, T.; Morimoto, H. Applications of genetic algorithm to aesthetic design of dam structures. Adv. Eng. Softw. 1996, 25, 185–195. [Google Scholar] [CrossRef]
  16. Chikata, Y.; Yasuda, N.; Matsushima, M.; Kobori, T. Inverse analysis of aesthetic evaluation of planted concrete structures by neural networks. Comput. -Aided Civ. Infrastruct. Eng. 1998, 13, 255–264. [Google Scholar] [CrossRef]
  17. Bailey, B.; Raich, A.M. Modeling of user design preferences in multiobjective optimization of roof trusses. J. Comput. Civil. Eng. 2012, 26, 584–596. [Google Scholar] [CrossRef]
  18. Machwe, A.T.; Parmee, I.C. Reducing user fatigue within an interactive evolutionary design system using clustering and case-based reasoning. Eng. Optimiz. 2009, 41, 871–887. [Google Scholar] [CrossRef]
  19. Jaimes, A.L.; Martınez, S.Z.; Coello, C.A.C. An introduction to multiobjective optimization techniques. In Optimization in Polymer Processing; Nova Science Publishers: Hauppage, NY, USA, 2009; pp. 29–57. [Google Scholar]
  20. Marler, R.T.; Arora, J.S. Survey of multi-objective optimization methods for engineering. Struct. Multidiscip. Optim. 2004, 26, 369–395. [Google Scholar] [CrossRef]
  21. Deb, K. Multi-objective optimization. In Search Methodologies; Springer: Berlin/Heidelberg, Germany, 2014; pp. 403–449. [Google Scholar]
  22. Gunantara, N. A review of multi-objective optimization: Methods and its applications. Cogent Eng. 2018, 5, 1502242. [Google Scholar] [CrossRef]
  23. Taylor, S. Multicriterion Optimization in Engineering: Andrzej Osyczka; John Wiley & Sons: New York, NY, USA, 1984; Pergamon: Bergama, Turkey, 1985. [Google Scholar]
  24. Das, I.; Dennis, J.E. Normal-boundary intersection: A new method for generating the Pareto surface in nonlinear multicriteria optimization problems. SIAM J. Optim. 1998, 8, 631–657. [Google Scholar] [CrossRef] [Green Version]
  25. Messac, A.; Ismail-Yahaya, A.; Mattson, C.A. The normalized normal constraint method for generating the Pareto frontier. Struct. Multidiscip. Optim. 2003, 25, 86–98. [Google Scholar] [CrossRef]
  26. Fonseca, C.M.; Fleming, P.J. Genetic Algorithms for Multiobjective Optimization: Formulation Discussion and Generalization. In Proceedings of the ICGA-93: Fifth International Conference on Genetic Algorithms, San Mateo, CA, USA, 17–22 July 1993. [Google Scholar]
  27. Zitzler, E.; Thiele, L. Multiobjective evolutionary algorithms: A comparative case study and the strength Pareto approach. IEEE Trans. Evol. Comput. 1999, 3, 257–271. [Google Scholar] [CrossRef] [Green Version]
  28. Deb, K.; Pratap, A.; Agarwal, S.; Meyarivan, T. A fast and elitist multiobjective genetic algorithm: NSGA-II. IEEE Trans. Evol. Comput. 2002, 6, 182–197. [Google Scholar] [CrossRef] [Green Version]
  29. Das, I.; Dennis, J.E. A closer look at drawbacks of minimizing weighted sums of objectives for Pareto set generation in multicriteria optimization problems. Struct. Optim. 1997, 14, 63–69. [Google Scholar] [CrossRef] [Green Version]
  30. Messac, A. Physical Programming: Effective Optimization for Computational Design. AIAA J. 1996, 34, 149–158. [Google Scholar] [CrossRef] [Green Version]
  31. Messac, A.; Sukam, C.P.; Melachrinoudis, E. Mathematical and pragmatic perspectives of physical programming. AIAA J. 2001, 39, 885–893. [Google Scholar] [CrossRef]
  32. Messac, A.; Mattson, C.A. Generating well-distributed sets of Pareto points for engineering design using physical programming. Optim. Eng. 2002, 3, 431–450. [Google Scholar] [CrossRef]
  33. Messac, A.; Van Dessel, S.; Mullur, A.A.; Maria, A. Optimization of large-scale rigidified inflatable structures for housing using physical programming. Struct. Multidiscip. Optim. 2004, 26, 139–151. [Google Scholar] [CrossRef]
  34. Ilgın, M.A. Aircraft selection using linear physical programming. J. Aeronaut. Space Technol. 2019, 12, 121–128. [Google Scholar]
  35. Macqueen, J.B. Some Methods for Classification and Analysis of Multivariate Observations. In Proceedings of the Fifth Berkeley Symposium on Mathematical Statistics and Probability, Los Angeles, CA, USA, 21 June–18 July 1965. [Google Scholar]
  36. Ohsaki, M.; Takagi, H. Improvement of presenting interface by predicting the evaluation order to reduce the burden of human interactive EC operators. In Proceedings of the SMC’98 IEEE International Conference on Systems, Man, and Cybernetics (Cat. No. 98CH36218), San Diego, CA, USA, 14 October 1998; IEEE: Piscataway, NJ, USA, 1998. [Google Scholar]
  37. Bailey, B.; Raich, A. Capturing user aesthetic design preferences during multi-objective roof truss optimization. In Proceedings of the Joint International Conference on Computing and Decision Making in Civil and Building Engineering (ICCCBE), Montreal, QC, Canada, 14–16 June 2006. [Google Scholar]
  38. Ester, M.; Kriegel, H.; Sander, J.; Xu, X. A density-based algorithm for discovering clusters in large spatial databases with noise. In Proceedings of the Second International Conference on Knowledge Discovery and Data Mining (KDD-96), Portland, OR, USA, 2–4 August 1996. [Google Scholar]
  39. Agrawal, R.; Gehrke, J.E.; Gunopulos, D.; Raghavan, P. Automatic Subspace Clustering of High Dimensional Data for data mining applications. Data Min. Knowl. Discov. 1998, 27, 94–105. [Google Scholar]
  40. Lacko, D.; Huysmans, T.; Vleugels, J.; De Bruyne, G.; Van Hulle, M.M.; Sijbers, J.; Verwulgen, S. Product sizing with 3D anthropometry and k-medoids clustering. Comput.-Aided Des. 2017, 91, 60–74. [Google Scholar] [CrossRef]
  41. Kohonen, T. The self-organizing map. Proc. IEEE 1990, 78, 1464–1480. [Google Scholar] [CrossRef]
  42. Guha, S. CURE: An efficient clustering algorithm for large databases. In Proceedings of the SIGMOD’98, Seattle, WA, USA, 2–4 June 1998. [Google Scholar]
  43. Liu, Y.; Li, Z.; Xiong, H.; Gao, X.; Wu, J. Understanding of internal clustering validation measures. In Proceedings of the 2010 IEEE International Conference on Data Mining, Sydney, NSW, Australia, 13–17 December 2010; IEEE: Piscataway, NJ, USA, 2010. [Google Scholar]
  44. Altmann, A.; Toloşi, L.; Sander, O.; Lengauer, T. Permutation importance: A corrected feature importance measure. Bioinformatics 2010, 26, 1340–1347. [Google Scholar] [CrossRef] [Green Version]
  45. Suliman, A.; Zhang, Y. A review on back-propagation neural networks in the application of remote sensing image classification. J. Earth Sci. Eng. 2015, 5, 52–65. [Google Scholar]
  46. Breiman, L. Random forests. Mach. Learn. 2001, 45, 5–32. [Google Scholar] [CrossRef] [Green Version]
  47. Sanchis, J.; Martínez, M.A.; Ferragud, X.B.; Reynoso-Meza, G. Modeling preferences in multi-objective engineering design. Eng. Appl. Artif. Intell. 2010, 23, 1255–1264. [Google Scholar] [CrossRef]
Figure 1. Sample population of truss structures.
Applsci 13 01543 g001
Figure 2. Principle of symmetry rate.
Applsci 13 01543 g002
Figure 3. Part of the resulting graph of height-span ratio (HSR).
Applsci 13 01543 g003
Figure 4. Picture of a truss sample.
Applsci 13 01543 g004
Figure 5. Screenshots of the interaction system: (a) Selection interface; (b) Evaluation interface.
Applsci 13 01543 g005
Figure 6. Index results of the No. 2 student in the first experiment: (a) RA; (b) MSE.
Applsci 13 01543 g006
Figure 7. Index results of the No. 2 student in the second experiment: (a) PA; (b) MSE; (c) PreA.
Applsci 13 01543 g007
Figure 8. A class function of 1-S.
Applsci 13 01543 g008
Figure 9. Flow chartof STSA.
Applsci 13 01543 g009
Figure 10. Class function for objectives of weight and displacement.
Applsci 13 01543 g010
Figure 11. Design process based on STSA-P.
Applsci 13 01543 g011
Figure 12. Initial layout of the truss structure.
Applsci 13 01543 g012
Figure 13. Truss structure for the first student.
Applsci 13 01543 g013
Figure 14. Truss structures for the second student: (a) initial result; (b) improved result.
Applsci 13 01543 g014
Table 1. Feature vector.
Basic SizeComplexityMid-Span WidthFlatnessSymmetry
Height-Span RatioNumber of MembersTruss DepthTop Chord Height DifferencesSymmetry Rate
Mid-span Clear HeightAverage Length of Web MembersDispersion of NodesBottom Chord Height Differences
Table 2. Evaluation results based on the rating rule.
Random GroupCLIQUECUREDBSCANK-meansK-medoidsSOM
1611642642635599666
2594619619669629656
3550639639650627653
4632662666677650681
5429415480504497510
Table 3. Evaluation results based on CV-MMD index.
IndexCLIQUECUREDBSCANK-meansK-medoidsSOM
CV-MMD4.12161.18814.68880.29520.30920.2675
CV2.30491.32642.65360.32640.30800.2922
MMD1.78821.57591.76700.90431.00400.9153
Table 4. Evaluation results of BPNN and RF models in the first experiment.
Student No.BPNNRF
MSERAMSERA
10.069893.84%0.057196.48%
20.080792.30%0.054095.59%
30.079694.67%0.043498.10%
40.077493.07%0.047797.11%
50.069193.75%0.046698.05%
Table 5. Evaluation results of BPNN and RF models in the second experiment.
Student No.BPNNRF
MSEPAPreAMSEPAPreA
10.364462.96%58.61%0.214174.44%69.25%
20.498664.07%61.68%0.230371.11%63.39%
30.454466.67%59.95%0.258671.48%69.54%
40.406462.22%60.38%0.264071.85%68.16%
50.462862.59%60.82%0.336669.26%68.47%
Table 6. Boundary values of objectives.
Objective FunctionTypeBoundary Values
D ←gi1← T →gi2← U →gi3→ UNA
g1(x)1-S−505
g2(x)1-S−416
g3(x)1-S−7410
Table 7. Design parameters.
TypeNameValueNameValue
Material and geometrical propertiesMaterial density7.85 g/cm3Elasticity modulus210 Gpa
Cross section typeSolid cylinderInitial cross-sectional area100 cm2
SA parametersInitial temperature2000Final temperature0.0001
Number of iterations170Number of designs per iteration150
Loading parametersConcentrated load150 kNDistributed load100 N/cm
Self-weight loadYesLoading typeDead load
Design constraintsMinimum member length100 cmMaximum member length15 m
Minimum area10 cm2Maximum area1084 cm2
Maximum connections per node20Minimum angle 20°
Maximum compressive stress31 kN/cm2Maximum tension stress31 kN/cm2
Maximum height20 mMaximum number of members60
Intersections between membersNoMovable loading nodeYes
Table 8. Boundary values of objective functions.
Objective FunctionTypeBoundary Values
D ←gi1← T →gi2← U →gi3→ UNA
Weight1-S1500 kg2100 kg2500 kg
Displacement1-S2 cm5 cm8 cm
User Preference1-S1.52.53
Table 9. Proportion of importance of the truss features.
FeatureFirst Student Second Student
HSR5.75%8.90%
MCH2.14%8.50%
NM2.89%4.83%
AL21.81%15.25%
TD16.30%6.68%
DN4.92%12.28%
THD4.71%9.32%
BHD2.78%7.22%
SyR38.71%27.02%
Table 10. Objective information for the first student.
ObjectiveValue Range
Weight 1817.365 kgT
Displacement 1.385 cmD
Preference 1.798T
Table 11. Objective information for the second student.
ObjectiveInitial ResultImproved Result
ValueRangeValueRange
Weight1842.368 kgT1896.065 kgT
Displacement2.614 cmT4.259 cmT
Preference2.396T1.335D
Table 12. Index I of the results for both students.
Student No.Disp LimitmpmoI
14.259 cm1896.065 kg1206.802 kg57.11%
21.385 cm1817.365 kg1577.735 kg15.19%
Disclaimer/Publisher’s Note: The statements, opinions and data contained in all publications are solely those of the individual author(s) and contributor(s) and not of MDPI and/or the editor(s). MDPI and/or the editor(s) disclaim responsibility for any injury to people or property resulting from any ideas, methods, instructions or products referred to in the content.