Article

RobustATR: Substrate-Integrated Hollow Waveguide Coupled Infrared Attenuated Total Reflectance Sensors

1
Institute of Analytical and Bioanalytical Chemistry, Ulm University, 89081 Ulm, Germany
2
Hahn-Schickard, 89077 Ulm, Germany
*
Author to whom correspondence should be addressed.
Appl. Sci. 2022, 12(19), 10019; https://doi.org/10.3390/app121910019
Submission received: 3 August 2022 / Revised: 13 September 2022 / Accepted: 18 September 2022 / Published: 6 October 2022
(This article belongs to the Special Issue Molecular Sensing Technologies)

Abstract

:

Featured Application

With RobustATR, we have developed an exceedingly compact and robust infrared attenuated total reflectance (IR-ATR) accessory uniquely integrating substrate-integrated hollow waveguides (iHWG) facilitating efficient coupling to quantum cascade laser (QCL) light sources. This sensing platform is particularly suited for real-world application scenarios.

Abstract

Small and compact mid-infrared devices are of increasing importance, as there are several applications demanding on-site and real-time measurements in harsh real-world scenarios. The RobustATR, an innovative infrared attenuated total reflectance (IR-ATR) accessory, has been developed and tested with exemplary analytes integrating a single-wavelength Fabry–Pérot quantum cascade laser as light source for testing the feasibility of a potentially miniaturized overall sensor design. Successful direct coupling of the laser radiation via substrate-integrated hollow waveguide (iHWG) coupling elements to the sensor interface could be shown, whereby exemplary analytes of environmental and medical relevance were tested, revealing the future potential for real-world applications.

1. Introduction

In recent decades, protecting and safeguarding the environment has become an increasingly important issue, leading to a demand for more advanced analytical sensing devices suitable for molecular monitoring at extreme environmental conditions in a wide range of scenarios, e.g., pollution arising from the fuel and oil industry, CO2 geo-sequestration, deep-sea gas sensing, and water resource management. For example, oil spillage may arise after events such as the Deepwater Horizon accident, whereby petroleum entered into the marine environment and affected marine and coastal inhabitants. Likewise, tanker wrecks, oil spill events, and pipeline leaks caused by sabotage or aging may cause similar problems. Even natural seeps lead to a continuous release of oil-related compounds into the environment. Once petroleum is released into the environment, local oil spills spread across a wide area via wind and waves, whereby the oil droplets emulsify and are entrapped. Oil droplets can be furthermore reduced in size due to oil-dispersing agents. These water/oil mixtures have higher viscosity, and once fresh oil interacts with older slicks, which could already form a waxy crust, fresh oil does not mix with the older one [1,2,3,4,5,6,7,8,9]. Dissolved volatile organic compounds (VOCs) including indicator molecules such as benzene, toluene, and the xylenes [10,11,12] (also known as, BTEX—benzene, toluene, ethylbenzene, total xylenes) are found as a result of these mineral oil spill events. Thus, monitoring, understanding, and predicting environmental changes is crucial to prevent ecological or human health problems [13]. For online and/or in-field monitoring—especially in environmental analysis—miniaturized sensors with reduced weight and energy consumption, as well as the required in-field robustness are needed. In harsh environments and in-field scenarios, reliable measurements of shock and vibration stability along with reasonable sensor response times provide close to real-time information [5,14,15].
Not only must the sensor size and weight be taken into account, but the marine environment itself may also be challenging. Corrosion processes are certainly enhanced due to the presence of electrolytes—in particular, chloride ions—and amplified by the presence of living organisms or dissolved gases. Hence, sensor devices suitable for applications in marine environments should, in addition to the required performance metrics, be corrosion- and temperature-resistant, facilitating extended deployment periods [16].
Ethanol, serving as an exemplary environmentally relevant analyte in the present study, is a small molecule used in a wide variety of application scenarios. For example, ethanol is used as a high-performance fuel in internal combustion engines. If ethanol is burned, fewer pollutants are emitted, when compared to gasoline [17]. Adding a small amount of ethanol into petroleum is a common strategy leading to enhanced engine fuel efficiency and reduced gasoline consumption. Furthermore, ethanol is considered a ‘green chemical’ which may be produced from grains and sugar or lingo-cellulosic biomass [18], and may also be derived from biological systems via dark fermentation of marine alga. Another natural source of ethanol is derived from microalgae that may fixate CO2, which beneficially leads to a decrease of atmospheric CO2, providing ethanol in turn [19]. Interestingly, naturally grown seaweed used for natural pigments and phycocolloids (i.e., sugar polymers) may also be used for sugar hydrolysis, and consecutively for ethanol production, with a constant net balance of CO2 [20]. Methanol is less flammable compared to gasoline and—as a biofuel—certainly competitive with ethanol. It is a key intermediate for liquid fuels, and may also reduce the number of air pollutants upon combustion [21,22]. Although methanol is known to be toxic to humans, a small amount of methanol is already present in the human body, and a concentration of up to 500 mg per day to adult humans is considered non-harmful. Methanol is also naturally released in the environment due to the decomposition of plants and animals [22].
Besides environmental application scenarios, healthcare is another important field that requires portable and robust analytical devices, e.g., for the non-invasive and real-time identification of diseases and their biomarkers [23]. As an example, tryptophan is an indispensable amino acid that cannot be produced by mammals and has to be supplied by dietary protein. About 600 to 900 mg of tryptophan should be consumed on a daily basis [24,25]. As an exemplary molecule, tryptophan was selected for the present study. Tryptophan is a metabolite of serotonin, which can be synthesized in the gut and brain, where it is relevant for several disorders including growth, mood, behavior, and immune response [24]. Furthermore, it is under consideration as a biomarker for depression, which usually appears together with other mood disorders such as anxiety [25]. Once synthesized, tryptophan is bound to plasma albumin, and part of it is taken up in the brain. Foodstuffs containing a large number of proteins, such as cheese, fish, or meat, therefore also contain tryptophan [26].
In both scenarios—environmental analysis and sensing in health-related applications—the direct analysis of selected tracer molecules in aqueous environmental systems and human secretion (e.g., saliva or urine), online and close to real-time measurements are demanded. In harsh in-field conditions (e.g., elevated pressure and/or temperature, vibrations due to portable use, etc.) only few studies have reported the utility of IR-ATR techniques at elevated pressure and temperature conditions [27,28], e.g., based on compact Fourier transform infrared (FTIR) devices for various molecular monitoring scenarios [5,29,30,31,32,33,34]. Devices based on FTIR systems use broadband emitters enabling access to the entire MIR range (i.e., usually 2.5 to 25 µm) [35,36,37,38]. Although compact FTIR systems are commercially available, the potential for miniaturization is limited. In turn, IR sensors based on laser light sources cover only a limited spectral window, but facilitate exceedingly compact device dimensions. Therefore, some IR sensors currently utilizing broadly tunable quantum and interband cascade lasers (QCLs and ICLs) provide an improved signal-to-noise ratio (SNR) along with high energy density within a distinct spectral emission window [39,40,41,42]. Fabry–Pérot lasers—as applied in the present study—are based on an optical cavity placed in the middle of the waveguide, and provide a broad gain bandwidth along with significant emission powers frequently coupled to external tuning mechanisms [42,43]. For ensuring the emission stability, such lasers are commonly integrated with a thermoelectric cooler (TEC) inside a sealed high-heat load (HHL) package for suppressing mode hopping during wavelength tuning via controlling of the operating temperature of the chip. For analytical application scenarios, these lasers are usually operated in a quasi-continuous wave (QCW) modality, delivering several tens of milliwatts of output power at room temperature. Furthermore, they exhibit low power consumption, and can therefore be integrated into portable sensor devices.
Attenuated total reflection (ATR) is a sensing concept ensuring reproducible and intimate interaction of photons with a sample at the interface between a high-refractive-index waveguide and the—usually liquid or solid—sample. If light propagates within an internal reflection element (IRE)—here, a zinc selenide (ZnSe) crystal—an evanescent field is generated, which exponentially decays in intensity into the surrounding medium (i.e., sample) with a wavelength-dependent penetration of up to several micrometers [44,45,46].
In the present study, we report a compact and exceedingly robust IR-ATR sensor concept termed RobustATR, which was coupled to a quantum cascade laser light source, facilitating future studies in real-world in-field application scenarios. This sensor concept combines the advantage of IR-ATR spectroscopy with robust optical coupling elements based on substrate-integrated hollow waveguides ensuring permanent alignment of light source, transducer (i.e., ATR sensing interface) and detector, facilitating applications in clinical analysis as well as in environmental monitoring.

2. Materials and Methods

Absolute ethanol (96%) and methanol were purchased from VWR Chemicals, Germany, and tryptophan from VWR (VWR International, Leuven, Belgium). A 1 w% tryptophan solution was freshly prepared with deionized water (18.0 MO cm, Elga Labwater; VWS, Deutschland, Germany), while absolute ethanol and methanol were directly used.
To characterize the laser emission spectra, the QCL provided by mirSense (uniMir, mirSense, Palaiseau, France) was coupled to a Vertex 70 FTIR spectrometer (Bruker Optik GmbH, Ettlingen, Germany), as schematically shown in Figure 1. The laser emission spectrum was then recorded using the FTIR at a spectral resolution of 2 cm−1.
For analytical measurements, the experimental setups shown in Figure 2 were used. The RobustATR transducer was based on a device developed by Teuber et al. [16], which uses a horizontal ZnSe waveguide (Spectral Systems LLC, New York, USA) coupled to iHWG structures at the in- and outcoupling facet for efficient and robust IR radiation propagation. In one configuration, an additional hollow-core fiber was used to couple the laser radiation into input-iHWG of the RobustATR assembly, while the detector (MCT detector, Vigo, Poland) at the distal end was directly coupled to RobustATR assembly without any additional optical elements in between (see Figure 2a). The hollow-core fiber had a length of approximately 38 cm. The ATR crystal is placed onto a thin lead sheet, which provides a reasonably soft embedment of the ZnSe crystal, and a reflective surface for the laser beam bouncing inside the ATR crystal. Substrate-integrated hollow waveguides (iHWG) were first introduced by the team of Mizaikoff in 2013 [47], and have since emerged as robust multi-purpose hollow waveguide structures with numerous applications. Here, a 3D-printed iHWG structure was tailored to ensure that IR radiation is guided directly to center of the ZnSe crystal incoupling facet, as reported in detail elsewhere [16]. ZnSe crystals were used, as they have a broad spectral window, are used for daily routine scenarios, and are less costly than other IRE, e.g., diamond. As a detector, a TE-cooled MCT detector (PCI-3TE-13/MIP-10-1M-F-M4, Vigo Systems S.A., Mazowiecki, Poland) was used. Data acquisition was performed via a custom-written LabView script (National Instruments, Austin, USA) [48]. Data evaluation was conducted using OriginLab (Origin 2019b). An alternative setup was realized as shown in Figure 2b. Here, the laser radiation was directly coupled into the incoupling iHWG structure without using a hollow-core fiber. Again, the detector also remained directly coupled to the RobustATR assembly. In Figure 2b, the propagation of the laser beam is schematically shown; however, the iHWG’s coupling structures are omitted for clarity.

3. Results and Discussion

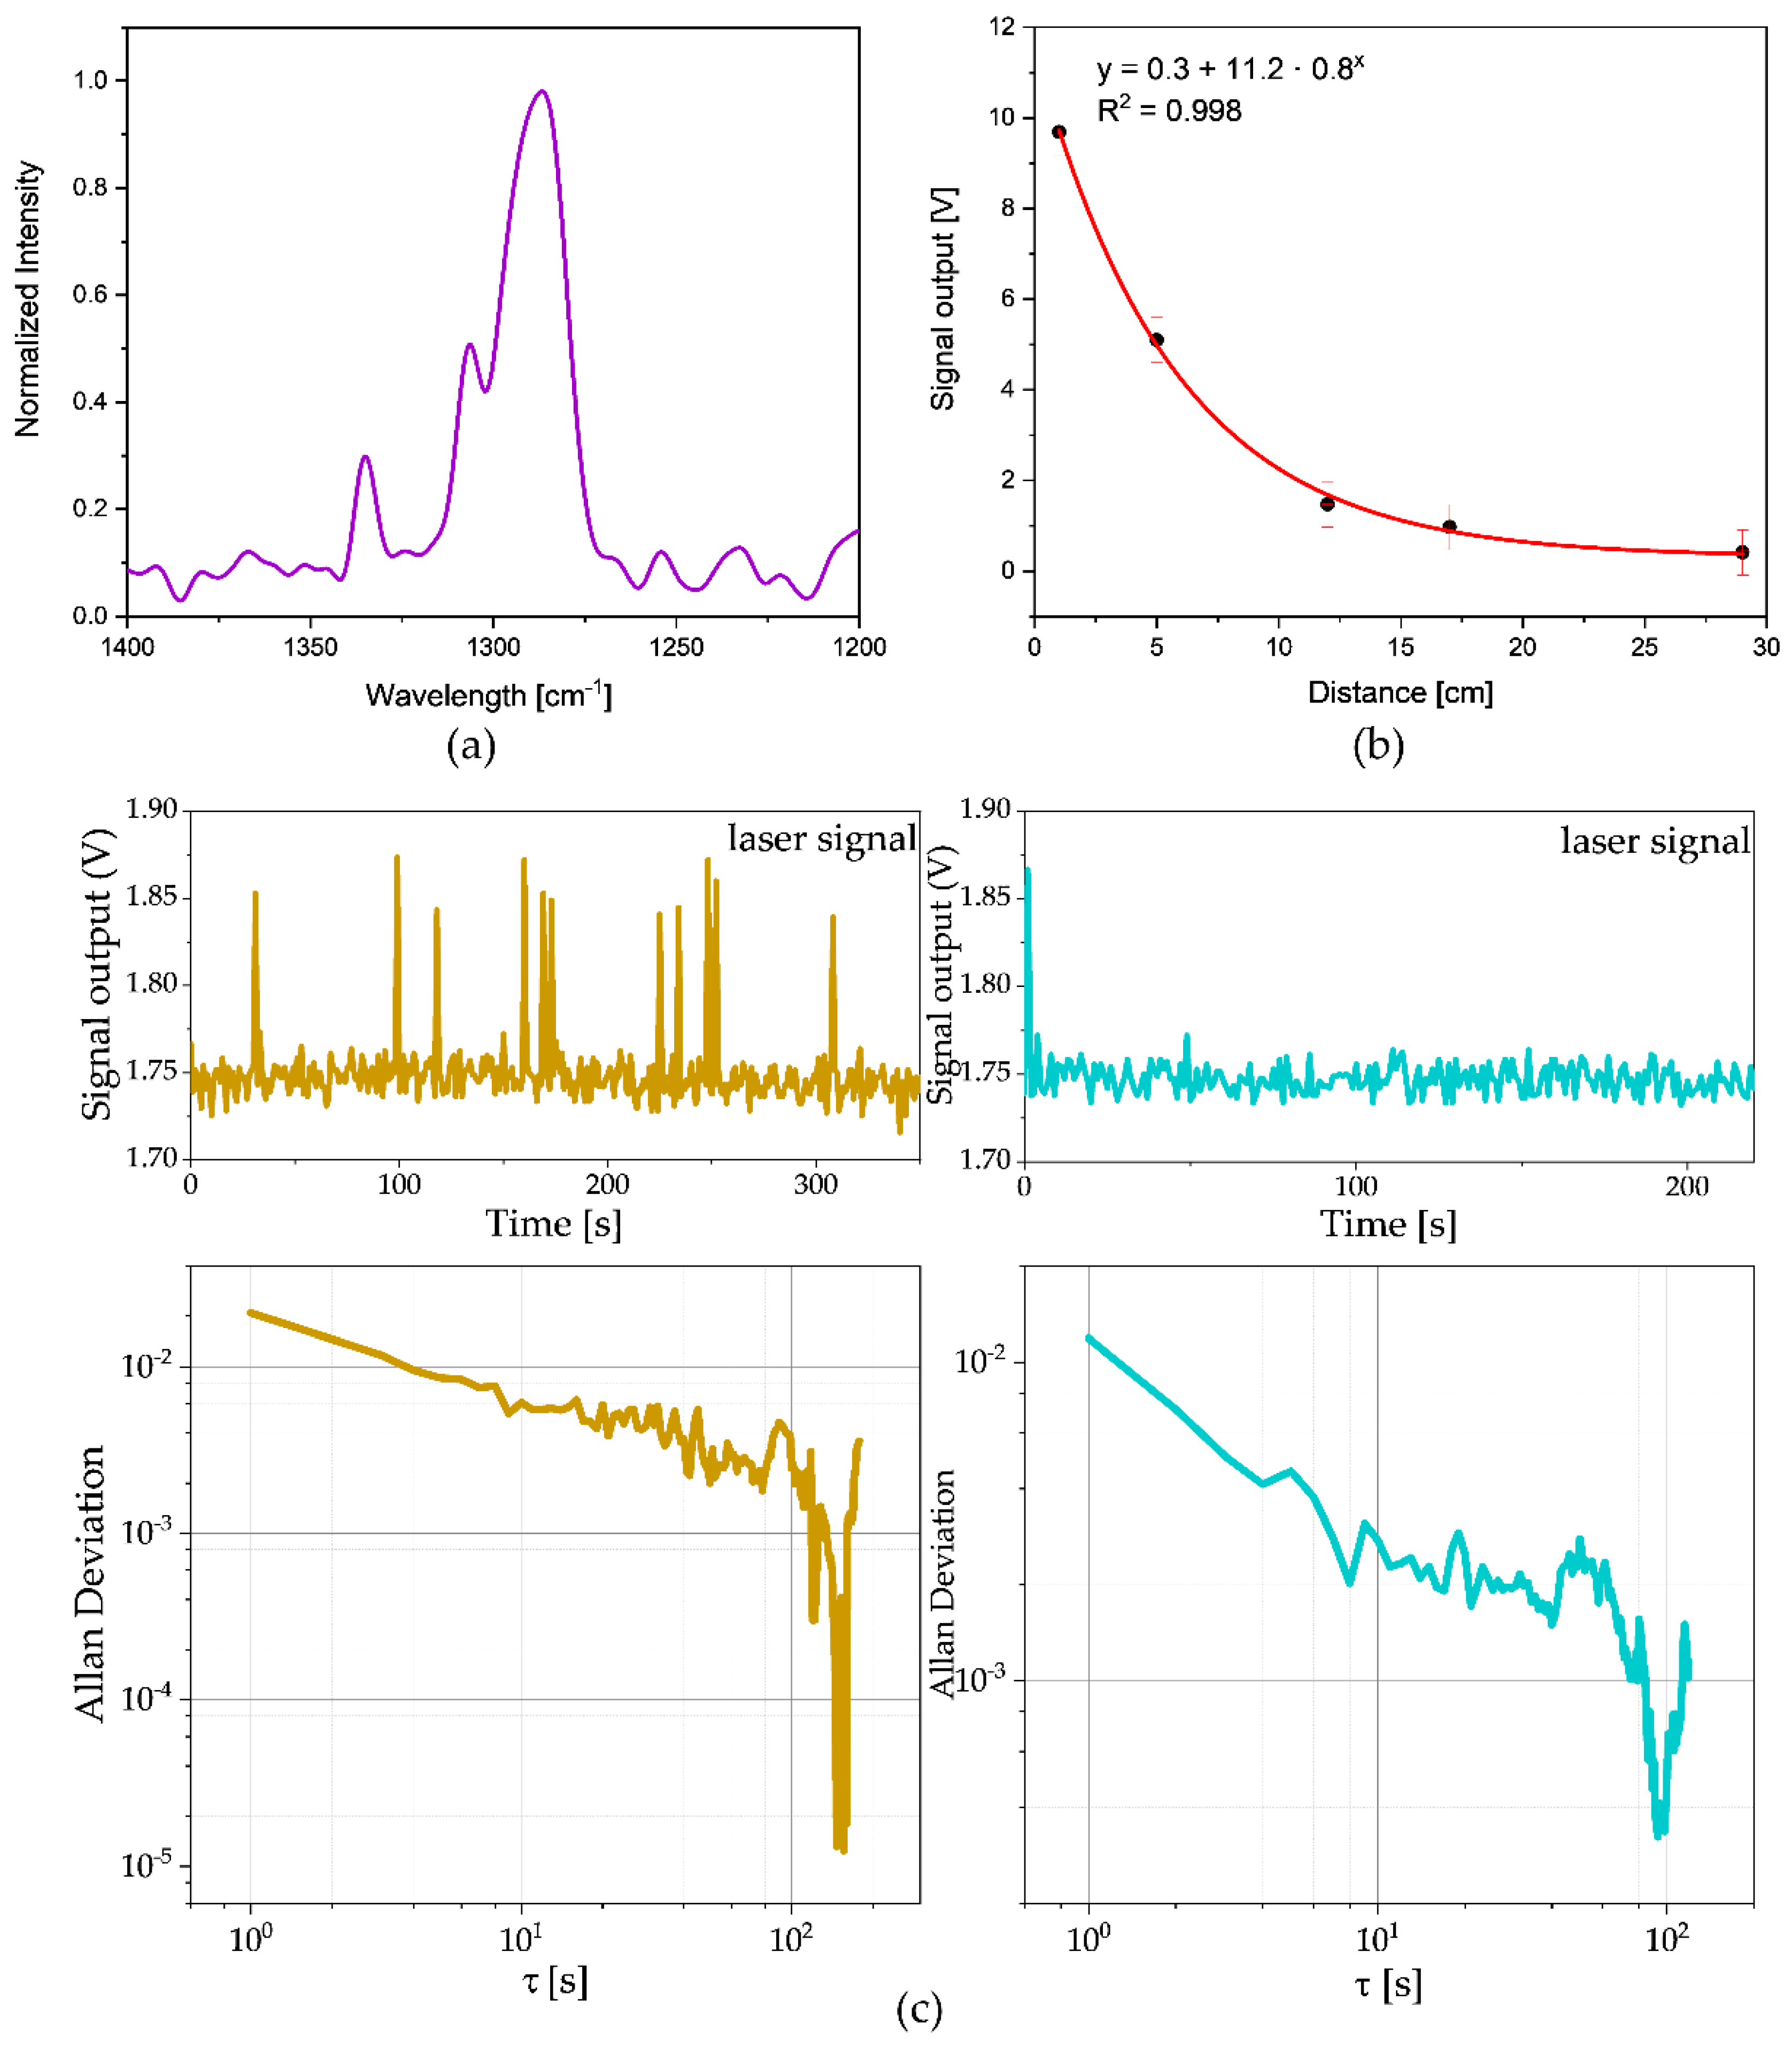
3.1. QCL Characterization

The laser emission spectrum in a wavelength range between 1400 cm−1 and 1200 cm−1 is shown in Figure 3a. A seven-point FFT filter was used to remove noise and to highlight the pure signal. The spectrum is plotted with the power normalized to the highest peak equal to one. The peak maximum is located at 1287 cm−1 with a peak width of approximately 15 cm−1. Two further peaks appear at 1307 cm−1 and 1335 cm−1, whereby the peak at 1307 cm−1 overlaps with the main peak and broadens the main peak. Therefore, the laser does not strictly show single wavelength emission, which can be also explained by the Fabry–Pérot cavity. As the main goal of this study is to show the feasibility of combining QCLs with the developed sensor assembly, no further laser beam characterization has been conducted. The laser was operated just above the recommended threshold current.
However, if needed, a higher signal output can be achieved by adjusting the duty circle, voltage, or pulse length. Since a hollow-core fiber was placed in between the QCL and the sensor assembly, the initial beam shape is altered; hence, no further studies on the beam shape were performed. It should be noted that no further beam-shaping optics were used.
As a measure of efficiency, the dependence between the laser signal and distance to the detector has been recorded by manual adjustment. The anticipated exponential decay of the emitted radiation intensity has been recorded and is shown in Figure 3b. Error bars were obtained via the standard deviation of a 40 s measurement period, and an assumed reading error was obtained by measuring the distance between laser and detector using a ruler.
To evaluate the sensor stability, an Allan variance study was used. Originally, the Allan variance is used as a time domain measurement of frequency stability. The Allan variance is an increasingly adopted measure for characterizing noise, whereby the log-log plot of Allan deviation vs. cluster time τ is used, providing direct access to characterize different sources of noise. White noise, for example, has a slope of 1 / 2   [49,50,51,52]. As the detection limit and the confidence interval of measured data are dependent on the variance of the measured data, averaging of the data is relevant. In white noise-dominated systems, the Allan variance is equivalent to the variance of the mean and, therefore, may be used to predict the detection limit. In turn, the minimum of the Allan variance plot provides the optimum integration time for the recording sample and background spectra [51,53]. The Allan variance obtained using the developed sensor assembly is shown in Figure 3c. Interestingly, although the tryptophan measurements illustrated in Figure 4b show different noise levels when evaluating raw data, the Allan variance does not vary significantly between the two measurements, showing a small frequency fluctuation. The tryptophan measurements were executed directly in a consecutive fashion; therefore, the different noise levels were taken into account. The optimum integration time was approximately 70 s for the noisier spectra, and 40 s for the less noisy spectra.

3.2. QCL Coupled to the RobustATR Assembly with and without Hollow-Core Fiber

The developed sensor assembly has already been successfully used during previous studies [16]. Here, the RobustATR is coupled to a QCL (uniMir, mirSense, Palaiseau, France) pack aged within a miniature housing facilitating future portable sensing applications. As shown in Figure 2a, the laser is coupled via a hollow-core fiber to the developed sensor assembly and the detector is directly located at the distal end of the transducer. To test the feasibility of this setup, analytes with vibrational signatures around 1300 cm−1 have been selected. As an example of environmentally relevant analytes, ethanol was selected as the model constituent. Although ethanol does not have its most characteristic peaks in this wavelength regime, it exhibits some broad features. Characteristic ethanol signatures in this region are the peaks at 1391 cm−1 [54], which corresponds to the OH bending mode, and 1242 cm−1 [54], which is associated with the CH3 bending mode. To record the signal change between the background and the analyte, the analyte was added onto the IRE while data was recorded (see Figure 4a). Applying ethanol onto the crystal leads to a decrease of the signal output. However, the ethanol signal is still higher than the background noise at a value of approximately 0.03 V.
As an example of a medically relevant analyte, tryptophan was used. The same measurement procedure was followed as for the ethanol measurements. Here, a significant dampening of the laser signal was also observed after applying the analyte onto the IRE.
Regarding the level of noise during the measurements, two sets of experiments were used. In Figure 3, the laser was in operation during the entire measurement time (i.e., blank measurement, analyte measurement, and cleaning cycle), while in Figure 4, the laser was turned off after each measurement, yielding similar results. Using an Allan variance plot, the optimum averaging time for each measurement routine can be derived.
While the optical setup used herein was already quite compact, an even more integrated version can be achieved if the laser is placed directly in front of the sensor assembly without additional coupling fiber. Using this setup without beam-shaping lenses in between (Figure 3b), the intensity shows the expected exponential decrease with distance. Placing the laser directly in front of the sensor assembly ensures that a sufficient fraction of the emitted radiation is directly coupled into the RobustATR assembly. Figure 4c shows an exemplary recording of the laser signal propagated through the device without analyte present at the IRE surface, and in presence of an analyte (i.e., either ethanol or methanol). Methanol has a broad vibrational absorption at 1346 cm−1 [54], which is characteristic of the OH vibration.

4. Conclusions

The RobustATR assembly, a compact and—mechanically—exceedingly robust transducer, has been successfully coupled to a quantum cascade laser light source. Owing to its compact footprint, this IR sensor system has demonstrated potential as a promising analytical device for real-time measurements aiming at in-field application scenarios. The utility of the system for analyzing relevant components was exemplarily demonstrated with ethanol (environmental) and tryptophan (medical) serving as model molecular constituents.

Author Contributions

Conceptualization, A.T.; methodology, A.T.; validation, A.T.; investigation, A.T.; data curation, A.T.; writing—original draft preparation, A.T.; writing—review and editing, A.T. and B.M.; visualization, A.T.; supervision B.M.; project administration B.M.; funding acquisition, B.M. All authors have read and agreed to the published version of the manuscript.

Funding

This research received no external funding.

Institutional Review Board Statement

Not applicable.

Informed Consent Statement

Not applicable.

Data Availability Statement

The technical drawings presented herein, the LabView script used, as well as the raw data, cannot be provided.

Acknowledgments

The authors acknowledge the excellent collaboration with the Workshop at Ulm University during the development of the RobustATR assembly.

Conflicts of Interest

The authors declare no conflict of interest.

References

  1. Kuráň, P.; Soják, L. Environmental analysis of volatile organic compounds in water and sediment by gas chromatography. J. Chromatogr. A 1996, 733, 119–141. [Google Scholar] [CrossRef]
  2. Stach, R.; Pejcic, B.; Crooke, E.; Myers, M.; Mizaikoff, B. Mid-infrared spectroscopic method for the identification and quantification of dissolved oil components in marine environments. Anal. Chem. 2015, 87, 12306–12312. [Google Scholar] [CrossRef] [PubMed]
  3. Heath, C.; Myers, M.; Pejcic, B. The effect of pressure and temperature on mid-infrared sensing of dissolved hydrocarbons in water. Anal. Chem. 2017, 89, 13391–13397. [Google Scholar] [CrossRef] [PubMed]
  4. Sumaila, U.R.; Cisneros-Montemayor, A.M.; Dyck, A.; Huang, L.; Cheung, W.; Jacquet, J.; Kleisner, K.; Lam, V.; McCrea-Strub, A.; Swartz, W.; et al. Impact of the deepwater horizon well blowout on the economics of US gulf fisheries. Can. J. Fish. Aquat. Sci. 2012, 69, 499–510. [Google Scholar] [CrossRef] [Green Version]
  5. Pejcic, B.; Eadington, P.; Ross, A. Environmental monitoring of hydrocarbons: A chemical sensor perspective. Environ. Sci. Technol. 2007, 41, 6333–6342. [Google Scholar] [CrossRef]
  6. Chen, H.; Buric, M.; Ohodnicki, P.R.; Nakano, J.; Liu, B.; Chorpening, B.T. Review and perspective: Sapphire optical fiber cladding development for harsh environment sensing. Appl. Phys. Rev. 2018, 5, 011102. [Google Scholar] [CrossRef]
  7. Ghosh, A.; Zhang, C.; Shi, S.Q.; Zhang, H. High-temperature gas sensors for harsh environment applications: A review. CLEAN Soil Air Water 2019, 47, 1800491. [Google Scholar] [CrossRef]
  8. Leifer, I.; Lehr, W.J.; Simecek-Beatty, D.; Bradley, E.; Clark, R.; Dennison, P.; Hu, Y.; Matheson, S.; Jones, C.E.; Holt, B.; et al. State of the art satellite and airborne marine oil spill remote sensing: Application to the BP deepwater horizon oil spill. Remote Sens. Environ. 2012, 124, 185–209. [Google Scholar] [CrossRef] [Green Version]
  9. Beyer, J.; Trannum, H.C.; Bakke, T.; Hodson, P.V.; Collier, T.K. Environmental effects of the deepwater horizon oil spill: A review. Mar. Pollut. Bull. 2016, 110, 28–51. [Google Scholar] [CrossRef] [Green Version]
  10. Schädle, T.; Pejcic, B.; Myers, M.; Mizaikoff, B. Fingerprinting oils in water via their dissolved VOC pattern using mid-infrared sensors. Anal. Chem. 2014, 86, 9512–9517. [Google Scholar] [CrossRef]
  11. Pérez-Caballero, G.; Andrade, J.M.; Muniategui, S.; Prada, D. Comparison of single-reflection near-infrared and attenuated total reflection mid-infrared spectroscopies to identify and monitor hydrocarbons spilled in the marine environment. Anal. Bioanal. Chem. 2009, 395, 2335–2347. [Google Scholar] [CrossRef] [PubMed]
  12. Fingas, M.F.; Brown, C.E. Review of oil spill remote sensing. Spill Sci. Technol. Bull. 1997, 4, 199–208. [Google Scholar] [CrossRef] [Green Version]
  13. Joe, H.-E.; Yun, H.; Jo, S.-H.; Jun, M.B.G.; Min, B.-K. A review on optical fiber sensors for environmental monitoring. Int. J. Precis. Eng. Manuf. Technol. 2018, 5, 173–191. [Google Scholar] [CrossRef]
  14. Daham, B.; Andrews, G.E.; Li, H.; Ballesteros, R.; Bell, M.C.; Tate, J.; Ropkins, K. Application of a portable FTIR for measuring on-road emissions. In Proceedings of the SAE 2005 World Congress & Exhibition, Detroit, MI, USA, 11–14 April 2005. [Google Scholar] [CrossRef] [Green Version]
  15. Lieberzeit, P.A.; Dickert, F.L. Sensor technology and its application in environmental analysis. Anal. Bioanal. Chem. 2006, 387, 237–247. [Google Scholar] [CrossRef]
  16. Teuber, A.; Stach, R.; Haas, J.; Mizaikoff, B. Innovative substrate-integrated hollow waveguide coupled attenuated total reflection sensors for quantum cascade laser based infrared spectroscopy in harsh environments. Appl. Spectrosc. 2021, 76, 000370282110643. [Google Scholar] [CrossRef]
  17. Lynd, L.R. Overview and evaluation of fuel ethanol from cellulosic biomass: Technology, economics, the environment, and policy. Annu. Rev. Energy Environ. 1996, 21, 403–465. [Google Scholar] [CrossRef]
  18. Goldsworthy, L. Fumigation of a heavy duty common rail marine diesel engine with ethanol-water mixtures. Exp. Therm. Fluid Sci. 2013, 47, 48–59. [Google Scholar] [CrossRef]
  19. Ueno, Y.; Kurano, N.; Miyachi, S. Ethanol production by dark fermentation in the marine green alga, Chlorococcum littorale. J. Ferment. Bioeng. 1998, 86, 38–43. [Google Scholar] [CrossRef]
  20. Sudhakar, M.P.; Jegatheesan, A.; Poonam, C.; Perumal, K.; Arunkumar, K. Biosaccharification and ethanol production from spent seaweed biomass using marine bacteria and yeast. Renew. Energy 2017, 105, 133–139. [Google Scholar] [CrossRef]
  21. Iaquaniello, G.; Centi, G.; Salladini, A.; Palo, E. Methanol economy: Environment, demand, and marketing with a focus on the waste-to-methanol process. In Methanol; Elsevier: Amsterdam, The Netherlands, 2018; pp. 595–612. [Google Scholar]
  22. Zhen, X.; Wang, Y. An overview of methanol as an internal combustion engine fuel. Renew. Sustain. Energy Rev. 2015, 52, 477–493. [Google Scholar] [CrossRef]
  23. Tütüncü, E.; Nägele, M.; Becker, S.; Fischer, M.; Koeth, J.; Wolf, C.; Köstler, S.; Ribitsch, V.; Teuber, A.; Gröger, M.; et al. Advanced photonic sensors based on interband cascade lasers for real-time mouse breath analysis. ACS Sens. 2018, 3, 1743–1749. [Google Scholar] [CrossRef] [PubMed]
  24. Le Floc’h, N.; Otten, W.; Merlot, E. Tryptophan metabolism, from nutrition to potential therapeutic applications. Amino Acids 2011, 41, 1195–1205. [Google Scholar] [CrossRef]
  25. Comai, S.; Bertazzo, A.; Brughera, M.; Crotti, S. Tryptophan in health and disease. In Advances in Clinical Chemistry; Elsevier: Amsterdam, The Netherlands, 2020; pp. 165–218. [Google Scholar]
  26. Sainio, E.-L.; Pulkki, K.; Young, S.N. L-Tryptophan: Biochemical, nutritional and pharmacological aspects. Amino Acids 1996, 10, 21–47. [Google Scholar] [CrossRef] [PubMed]
  27. Lu, R.; Sheng, G.; Li, W.; Yu, H.; Raichlin, Y.; Katzir, A.; Mizaikoff, B. IR-ATR chemical sensors based on planar silver halide waveguides coated with an ethylene/propylene copolymer for detection of multiple organic contaminants in water. Angew. Chem. 2013, 125, 2321–2324. [Google Scholar] [CrossRef]
  28. Bak, J.; Clausen, S. FTIR emission spectroscopy methods and procedures for real time quantitative gas analysis in industrial environments. Meas. Sci. Technol. 2002, 13, 150–156. [Google Scholar] [CrossRef]
  29. Pejcic, B.; Myers, M.; Ross, A. Mid-infrared sensing of organic pollutants in aqueous environments. Sensors 2009, 9, 6232–6253. [Google Scholar] [CrossRef] [Green Version]
  30. Mizaikoff, B. Mid-infrared evanescent wave sensors—A novel approach for subsea monitoring. Meas. Sci. Technol. 1999, 10, 1185–1194. [Google Scholar] [CrossRef]
  31. Gabriel, J.-C.P. A promising portable tool for the continuous, online, and field monitoring of pressured processes. ACS Cent. Sci. 2016, 2, 188–189. [Google Scholar] [CrossRef] [Green Version]
  32. Walsh, J.E.; MacCraith, B.D.; Meaney, M.; Vos, J.G.; Regan, F.; Lancia, A.; Artjushenko, S. Sensing of chlorinated hydrocarbons and pesticides in water using polymer coated mid-infrared optical fibres. Analyst 1996, 121, 789. [Google Scholar] [CrossRef]
  33. Blommaerts, N.; Dingenen, F.; Middelkoop, V.; Savelkouls, J.; Goemans, M.; Tytgat, T.; Verbruggen, S.W.; Lenaerts, S. Ultrafast screening of commercial sorbent materials for VOC adsorption using real-time FTIR spectroscopy. Sep. Purif. Technol. 2018, 207, 284–290. [Google Scholar] [CrossRef]
  34. Jung, M.R.; Horgen, F.D.; Orski, S.V.; Rodriguez, C.V.; Beers, K.L.; Balazs, G.H.; Jones, T.T.; Work, T.M.; Brignac, K.C.; Royer, S.-J.; et al. Validation of ATR FT-IR to identify polymers of plastic marine debris, including those ingested by marine organisms. Mar. Pollut. Bull. 2018, 127, 704–716. [Google Scholar] [CrossRef] [PubMed]
  35. Kim, S.-S.; Young, C.; Mizaikoff, B. Miniaturized mid-infrared sensor technologies. Anal. Bioanal. Chem. 2008, 390, 231–237. [Google Scholar] [CrossRef] [PubMed] [Green Version]
  36. Haas, J.; Catalán, E.V.; Piron, P.; Karlsson, M.; Mizaikoff, B. Infrared spectroscopy based on broadly tunable quantum cascade lasers and polycrystalline diamond waveguides. Analyst 2018, 143, 5112–5119. [Google Scholar] [CrossRef] [PubMed] [Green Version]
  37. Griffiths, P.R. Fourier Transform Infrared Spectrometry: Theory and Instrumentation. In Transform techniques in chemistry; Springer: New York, NY, USA, 1978; pp. 109–139. [Google Scholar]
  38. Tittel, F.K.; Richter, D.; Fried, A. Mid-infrared laser applications in spectroscopy. In Solid-State Mid-Infrared Laser Sources; Springer: Berlin/Heidelberg, Germany, 2003; pp. 458–529. [Google Scholar]
  39. Stach, R.; Mizaikoff, B. Fuel performance specifications, mid-infrared analysis of. In Encyclopedia of Analytical Chemistry; John Wiley & Sons, Ltd: Chichester, UK, 2017; pp. 1–16. ISBN 9780470027318. [Google Scholar]
  40. Rassel, S.; Xu, C.; Zhang, S.; Ban, D. Noninvasive blood glucose detection using a quantum cascade laser. Analyst 2020, 145, 2441–2456. [Google Scholar] [CrossRef] [PubMed]
  41. Schwaighofer, A.; Brandstetter, M.; Lendl, B. Quantum cascade lasers (QCLs) in biomedical spectroscopy. Chem. Soc. Rev. 2017, 46, 5903–5924. [Google Scholar] [CrossRef] [PubMed] [Green Version]
  42. Teuber, A.; Mizaikoff, B. Cascade Laser Infrared Spectroscopy. In Encyclopedia of Analytical Chemistry; Wiley: Hoboken, NJ, USA, 2021; pp. 1–45. [Google Scholar]
  43. Patel, C.K.N. Advances in Fabry-Perot and tunable quantum cascade lasers. In Proceedings of the Micro- and Nanotechnology Sensors, Systems, and Applications IX, Anaheim, CA, USA, 11–14 September 2017. [Google Scholar]
  44. Harrick, N.J. Total internal reflection and its application to surface studies. Ann. N. Y. Acad. Sci. 1963, 101, 928–959. [Google Scholar] [CrossRef]
  45. Fahrenfort, J. Attenuated total reflection. Spectrochim. Acta 1961, 17, 698–709. [Google Scholar] [CrossRef]
  46. Averett, L.A.; Griffiths, P.R.; Nishikida, K. Effective path length in attenuated total reflection spectroscopy. Anal. Chem. 2008, 80, 3045–3049. [Google Scholar] [CrossRef]
  47. Wilk, A.; Chance Carter, J.; Chrisp, M.; Manuel, A.M.; Mirkarimi, P.; Alameda, J.B.; Mizaikoff, B. Substrate-integrated hollow waveguides: A new level of integration in mid-infrared gas sensing. Anal. Chem. 2013, 85, 11205–11210. [Google Scholar] [CrossRef]
  48. Haas, J.; Stach, R.; Sieger, M.; Gashi, Z.; Godejohann, M.; Mizaikoff, B. Sensing chlorinated hydrocarbons via miniaturized GaAs/AlGaAs thin-film waveguide flow cells coupled to quantum cascade lasers. Anal. Methods 2016, 8, 6602–6606. [Google Scholar] [CrossRef] [Green Version]
  49. Szczęsna, A.; Skurowski, P.; Lach, E.; Pruszowski, P.; Pęszor, D.; Paszkuta, M.; Słupik, J.; Lebek, K.; Janiak, M.; Polański, A.; et al. Inertial motion capture costume design study. Sensors 2017, 17, 612. [Google Scholar] [CrossRef] [PubMed] [Green Version]
  50. Wang, L.; Zhang, C.; Gao, S.; Wang, T.; Lin, T.; Li, X. Application of fast dynamic allan variance for the characterization of FOGs-based measurement while drilling. Sensors 2016, 16, 2078. [Google Scholar] [CrossRef] [PubMed] [Green Version]
  51. Riley, W.; Howe, D. Handbook of Frequency Stability Analysis; NIST: Gaithersburg, MD, USA, 2008. [Google Scholar]
  52. Allan, D.W. Statistics of atomic frequency standards. Proc. IEEE 1966, 54, 221–230. [Google Scholar] [CrossRef] [Green Version]
  53. Werle, P.; Mücke, R.; Slemr, F. The limits of signal averaging in atmospheric trace-gas monitoring by tunable diode-laser absorption spectroscopy (TDLAS). Appl. Phys. B Photophysics Laser Chem. 1993, 57, 131–139. [Google Scholar] [CrossRef]
  54. Plyler, E.K. Infrared spectra of methanol, ethanol, and n-propanol. J. Res. Natl. Bur. Stand. 1952, 48, 281. [Google Scholar] [CrossRef]
Figure 1. Schematic of the setup used for determining the emission characteristics of the QCL used in the present study. The QCL is essentially used as the light source in lieu of the black body emitter and modulated via the interferometer of the FTIR spectrometer. (Elements in the Figure not to scale).
Applsci 12 10019 g001
Figure 2. Schematics of the used analytical setups. (a) The QCL is coupled via a hollow-core fiber to the RobustATR assembly with the detector directly coupled to the distal end; (b) the QCL is also directly coupled to the RobustATR assembly. It should be noted that the iHWG in- and outcoupling structures integrated into the RobustATR assembly are not shown, for clarity, and that the laser beam path is therefore only schematically indicated. This light propagation does not show the real path. (Elements in the Figure not to scale).
Applsci 12 10019 g002
Figure 3. Characteristics of the Fabry–Pérot laser. (a) The emission spectrum of the laser treated with a seven-point FFT filter; (b) Signal decay as a function of distance between laser and detector. (c) Exemplary tryptophan spectra (top) and Allan variance of the laser (bottom). The colors are in accordance with Figure 4b, indicating the different measurements (yellow is the third measurement in Figure 4b and blue is the second measurement in Figure 4b).
Applsci 12 10019 g003
Figure 4. Measurements were executed with the hollow waveguide coupled RobustATR assembly of (a) ethanol and (b) 1 w% tryptophan deposited at the IRE surface. Data were treated using a five-point FFT filter; (c) measurements were performed with the QCL directly coupled into the sensor assembly (i.e., without fiber coupling); no data treatment was used.
Applsci 12 10019 g004
Publisher’s Note: MDPI stays neutral with regard to jurisdictional claims in published maps and institutional affiliations.

