
Vastus Lateralis and Vastus Intermedius as Predictors of Quadriceps Femoris Muscle Hypertrophy after Strength Training

 ,
,  ,
,  , and
, and 
Abstract
:1. Introduction
2. Materials and Methods
2.1. Expiremental Design
2.2. Subjects
2.3. Training Intervention
2.4. Evaluation of 1-RM Strength
2.5. Muscle Ultrasonography
2.6. Statistical Analysis
3. Results
4. Discussion
5. Conclusions
Author Contributions
Funding
Institutional Review Board Statement
Informed Consent Statement
Data Availability Statement
Acknowledgments
Conflicts of Interest
References
- Pasta, G.; Nanni, G.; Molini, L.; Bianchi, S. Sonography of the quadriceps muscle: Examination technique, normal anatomy, and traumatic lesions. J. Ultrasound 2010, 13, 76–84. [Google Scholar] [CrossRef] [PubMed]
- Lieber, R. Skeletal Muscle Structure, Function, and Plasticity, 2nd ed.; Lippincott, Williams & Wilkins: Baltimore, MD, USA, 2010. [Google Scholar]
- Kokotis, P.; Papadimas, G.; Zouvelou, V.; Zambelis, T.; Manta, P.; Karandreas, N. Electrodiagnosis and muscle biopsy in asymptomatic hyperckemia. Int. J. NeuroSci. 2016, 126, 514–519. [Google Scholar] [CrossRef] [PubMed]
- Methenitis, S.; Karandreas, N.; Spengos, K.; Zaras, N.; Stasinaki, A.N.; Terzis, G. Muscle Fiber Conduction Velocity, Muscle Fiber Composition, and Power Performance. Med. Sci. Sports Exerc. 2016, 48, 1761–1771. [Google Scholar] [CrossRef] [PubMed]
- Methenitis, S.; Spengos, K.; Zaras, N.; Stasinaki, A.N.; Papadimas, G.; Karampatsos, G.; Arnaoutis, G.; Terzis, G. Fiber Type Composition and Rate of Force Development in Endurance and Resistance Trained Individuals. J. Strength Cond. Res. 2019, 33, 2388–2397. [Google Scholar] [CrossRef] [PubMed]
- Mpampoulis, T.; Methenitis, S.; Papadopoulos, C.; Papadimas, G.; Spiliopoulou, P.; Stasinaki, A.N.; Bogdanis, G.; Karampatsos, G.; Terzis, G. Weak Association between Vastus Lateralis Muscle Fiber Composition and Fascicle Length in Young Untrained Females. Sports 2021, 9, 56. [Google Scholar] [CrossRef] [PubMed]
- Wright, C.R.; Brown, E.L.; Della Gatta, P.A.; Fatouros, I.G.; Karagounis, L.G.; Terzis, G.; Mastorakos, G.; Michailidis, Y.; Mandalidis, D.; Spengos, K.; et al. Regulation of Granulocyte Colony-Stimulating Factor and Its Receptor in Skeletal Muscle Is Dependent Upon the Type of Inflammatory Stimulus. J. Interferon Cytokine Res. 2015, 35, 710–719. [Google Scholar] [CrossRef] [PubMed]
- Alkner, B.; Tesch, P.; Berg, H. Quadriceps EMG/force relationship in knee extension and leg press. Med. Sci. Sports Exerc. 2000, 32, 459–463. [Google Scholar] [CrossRef]
- Blazevich, A.; Gill, N.; Zhou, S. Intra-and intermuscular variation in human quadriceps femoris architecture assessed in vivo. J. Anat. 2006, 209, 289–310. [Google Scholar] [CrossRef]
- Coratella, G.; Longo, S.; Rampichini, S.; Limonta, E.; Shokohyar, S.; Bisconti, A.; Cè, E.; Esposito, F. Quadriceps and Gastrocnemii Anatomical Cross-Sectional Area and Vastus Lateralis Fascicle Length Predict Peak-Power and Time-To-Peak-Power. Res. Q Exerc. Sport 2020, 91, 158–165. [Google Scholar] [CrossRef]
- Place, N.; Casartelli, N.; Glatthorn, J.F.; Maffiuletti, N.A. Comparison of quadriceps inactivation between nerve and muscle stimulation. Muscle Nerve 2010, 42, 894–900. [Google Scholar] [CrossRef]
- El-Ansary, D.; Marshall, C.; Farragher, J.; Annoni, R.; Schwank, A.; McFarlane, J.; Bryant, A.; Han, J.; Webster, M.; Zito, G. Architectural anatomy of the quadriceps and the relationship with muscle strength: An observational study utilising real-time ultrasound in healthy adults. J. Anat. 2021, 239, 847–855. [Google Scholar] [CrossRef] [PubMed]
- Kwah, L.K.; Pinto, R.; Diong, J.; Herbert, R. Reliability and validity of ultrasound measurements of muscle fascicle length and pennation in humans: A systematic review. J. Appl. Physiol. 2013, 114, 761–769. [Google Scholar] [CrossRef] [PubMed]
- Mayes, S.; Baird-Colt, P.; Cook, J. Ultrasound imaging is a valid method of measuring the cross-sectional area of the quadratus femoris muscle. J. Dance Med. Sci. 2015, 19, 3–10. [Google Scholar] [CrossRef] [PubMed]
- Walton, J.; Roberts, N.; Whitehouse, G. Measurement of the quadriceps femoris muscle using magnetic resonance and ultrasound imaging. Br. J. Sports Med. 1997, 31, 59–64. [Google Scholar] [CrossRef] [PubMed]
- Noorkoiv, M.; Nosaka, K.; Blazevich, A.J. Assessment of quadriceps muscle cross-sectional area by ultrasound extended-field-of-view imaging. Eur. J. Appl. Physiol. 2010, 109, 631–639. [Google Scholar] [CrossRef] [PubMed]
- Noorkoiv, M.; Stavnsbo, A.; Aagaard, P.; Blazevich, A. In vivo assessment of muscle fascicle length by extended field-of-view ultrasonography. J. Appl. Physiol. 2010, 109, 1974–1979. [Google Scholar] [CrossRef] [PubMed]
- Tsitkanou, S.; Spengos, K.; Stasinaki, A.N.; Zaras, N.; Bogdanis, G.; Papadimas, G.; Terzis, G. Effects of high-intensity interval cycling performed after resistance training on muscle strength and hypertrophy. Scand J. Med. Sci. Sports 2017, 27, 1317–1327. [Google Scholar] [CrossRef]
- Earp, J.; Newton, R.; Cormie, P.; Blazevich, A. Inhomogeneous quadriceps femoris hypertrophy in response to strength and power training. Med. Sci. Sports Exerc. 2015, 47, 2389–2397. [Google Scholar] [CrossRef]
- Zaras, N.; Stasinaki, A.-N.; Spiliopoulou, P.; Mpampoulis, T.; Hadjicharalambous, M.; Terzis, G. Effect of Inter-Repetition Rest vs. Traditional Strength Training on Lower Body Strength, Rate of Force Development, and Muscle Architecture. Appl. Sci. 2021, 11, 45. [Google Scholar] [CrossRef]
- Stasinaki, A.N.; Zaras, Ν.; Methenitis, S.; Bogdanis, G.; Terzis, G. Rate of force development and muscle architecture after fast and slow velocity eccentric training. Sports 2019, 7, 41. [Google Scholar] [CrossRef] [Green Version]
- Zacharia, E.; Spiliopoulou, P.; Methenitis, S.; Stasinaki, A.N.; Zaras, N.; Papadopoulos, C.; Papadimas, G.; Karampatsos, G.; Bogdanis, G.; Terzis, G. Changes in muscle power and muscle morphology with different volumes of fast eccentric half-squats. Sports 2019, 7, 164. [Google Scholar] [CrossRef] [PubMed]
- Zaras, N.; Stasinaki, A.N.; Krase, A.; Methenitis, S.; Karampatsos, G.; Georgiadis, G.; Spengos, K.; Terzis, G. Effects of tapering with light vs. heavy loads on track and field throwing performance. J. Strength Cond. Res. 2014, 28, 3484–3495. [Google Scholar] [CrossRef] [PubMed]
- Franchi, M.; Longo, S.; Mallinson, J.; Quinlan, J.; Taylor, T.; Greenhaff, P.; Narici, M. Muscle thickness correlates to muscle cross-sectional area in the assessment of strength training-induced hypertrophy. Scand. J. Med. Sci. Sports 2018, 28, 846–853. [Google Scholar] [CrossRef] [PubMed]
- Zaras, N.; Stasinaki, A.N.; Methenitis, S.; Krase, A.; Karampatsos, G.; Georgiadis, G.; Spengos, K.; Terzis, G. Rate of force development, muscle architecture, and performance in young competitive track and field throwers. J. Strength Cond. Res. 2016, 30, 81–92. [Google Scholar] [CrossRef] [PubMed]
- Suarez, D.; Mizuguchi, S.; Hornsby, W.; Cunanan, A.; Marsh, D.; Stone, M. Phase-specific changes in rate of force development and muscle morphology throughout a block periodized training cycle in weightlifters. Sports 2019, 7, 129. [Google Scholar] [CrossRef] [PubMed]
- Sterczala, A.; Miller, J.; Dimmick, H.; Wray, M.; Trevino, M.; Herda, T. Eight weeks of resistance training increases strength, muscle cross-sectional area and motor unit size, but does not alter firing rates in the vastus lateralis. Eur. J. Appl. Physiol. 2020, 120, 281–294. [Google Scholar] [CrossRef] [PubMed]
- Anousaki, E.; Zaras, N.; Stasinaki, A.-N.; Panidi, I.; Terzis, G.; Karampatsos, G. Effects of a 25-week periodized training macrocycle on muscle strength, power, muscle architecture and performance in well-trained track and field throwers. J. Strength Cond. Res. 2021, 35, 2728–2736. [Google Scholar] [CrossRef]
- Zaras, N.; Stasinaki, A.N.; Methenitis, S.; Karampatsos, G.; Fatouros, I.; Hadjicharalambous, M.; Terzis, G. Track and field throwing performance prediction: Training intervention, muscle architecture adaptations and field tests explosiveness ability. J. Phys. Educ. Sport 2019, 19, 436–443. [Google Scholar]
- Trappe, T.; Lindquist, D.; Carrithers, J. Muscle-specific atrophy of the quadriceps femoris with aging. J. Appl. Physiol. 2001, 90, 2070–2074. [Google Scholar] [CrossRef]
- Place, N.; Maffiuletti, N.; Martin, A.; Lepers, R. Assessment of the reliability of central and peripheral fatigue after sustained maximal voluntary contraction of the quadriceps muscle. Muscle Nerve 2007, 35, 486–495. [Google Scholar] [CrossRef]
- Zabaleta-Korta, A.; Fernández-Peña, E.; Santos-Concejero, J. Regional hypertrophy, the inhomogeneous muscle growth: A systematic review. Strength Cond. J. 2020, 42, 94–101. [Google Scholar] [CrossRef]
- Spiliopoulou, P.; Zaras, N.; Methenitis, S.; Papadimas, G.; Papadopoulos, C.; Bogdanis, G.; Terzis, G. The effect of concurrent power training and high intensity interval cycling on muscle morphology and performance. J. Strength Cond. Res. 2021, 35, 2464–2471. [Google Scholar] [CrossRef] [PubMed]
- Methenitis, S.; Mpampoulis, T.; Spiliopoulou, P.; Papadimas, G.; Papadopoulos, C.; Chalari, E.; Evangelidou, E.; Stasinaki, A.N.; Nomikos, T.; Terzis, G. Muscle fiber composition, jumping performance and rate of force development adaptations induced by different power training volumes in females. Appl. Physiol. Nutr. Metab. 2020, 45, 996–1006. [Google Scholar] [CrossRef]
- Methenitis, S.; Nomikos, T.; Mpampoulis, T.; Kontou, E.; Kiourelli, K.M.; Evangelidou, E.; Papadopoulos, C.; Papadimas, G.; Terzis, G. Different eccentric based Power Training volumes improve glycemic, lipidemic profile and body composition of females in a dose-dependent manner. Associations with muscle fibers composition adaptations. Eur. J. Sport Sci. 2022, 1–10. [Google Scholar] [CrossRef] [PubMed]
- Atkinson, G.; Nevill, A.M. Statistical methods for assessing measurement error (reliability) in variables relevant to Sports Med. Sports Med. 1998, 26, 217–238. [Google Scholar] [CrossRef] [PubMed]
- Bland, M.J.; Altman, D.G. Statistical methods for assessing agreement between two methods of clinical measurement. Lancet 1986, 327, 307–310. [Google Scholar] [CrossRef]
- Bruton, A.; Conway, J.; Holgate, S. Reliability: What is it, and how is it measured? Physiotherapy 2000, 86, 94–99. [Google Scholar] [CrossRef]
- Hopkins, W. Measures of reliability in sports medicine and science. Sports Med. 2000, 30, 1–15. [Google Scholar] [CrossRef]
- Kottner, J.; Audige, L.; Brorson, S.; Donner, A.; Gajewski, B.J.; Hrobjartsson, A.; Roberts, C.; Shoukri, M.; Streiner, D.L. Guidelines for Reporting Reliability and Agreement Studies (GRRAS) were proposed. J. Clin. Epidemiol. 2011, 64, 96–106. [Google Scholar] [CrossRef]
- Watkins, M.P.; Portney, L. Foundations of Clinical Research: Applications to Practice; Pearson/Prentice Hall: Hoboken, NJ, USA, 2009. [Google Scholar]
- Methenitis, S.; Karandreas, N.; Terzis, G. Reliability of resting intramuscular fiber conduction velocity evaluation. Scand. J. Med. Sci. Sports 2018, 28, 48–56. [Google Scholar] [CrossRef]
- Ema, R.; Wakahara, T.; Miyamoto, N.; Kanehisa, H.; Kawakami, Y. Inhomogeneous architectural changes of the quadriceps femoris induced by resistance training. Eur. J. Appl Physiol. 2013, 113, 2691–2703. [Google Scholar] [CrossRef] [PubMed]
- Housh, D.; Housh, T.; Johnson, G.; Chu, W. Hypertrophic response to unilateral concentric isokinetic resistance training. J. Appl. Physiol. 1992, 73, 65–70. [Google Scholar] [CrossRef] [PubMed]
- Narici, M.V.; Hoppeler, H.; Kayser, B.; Landoni, L.; Claassen, H.; Gavardi, C.; Conti, M.; Cerretelli, P. Human quadriceps cross-sectional area, torque and neural activation during 6 months strength training. Acta Physiol. Scand. 1996, 157, 175–186. [Google Scholar] [CrossRef] [PubMed]
- Narici, M.V.; Roi, G.S.; Landoni, L.; Minetti, A.E.; Cerretelli, P. Changes in force, cross-sectional area and neural activation during strength training and detraining of the human quadriceps. Eur. J. Appl. Physiol. Occup Physiol. 1989, 59, 310–319. [Google Scholar] [CrossRef] [PubMed]
- Sahinis, C.; Kellis, E.; Galanis, N.; Dafkou, K.; Ellinoudis, A. Intra-and inter-muscular differences in the cross-sectional area of the quadriceps muscles assessed by extended field-of-view ultrasonography. Med. Ultrason. 2020, 22, 152–158. [Google Scholar] [CrossRef] [PubMed] [Green Version]


| Quadriceps vs. Vastus Lateralis | Quadriceps vs. Rectus Femoris | Quadriceps vs. Vastus Medialis | Quadriceps vs. Vastus Intermedious | ||
|---|---|---|---|---|---|
| p Value of the Contrast | 0.706 | 0.009 | 1.000 | 1.000 | |
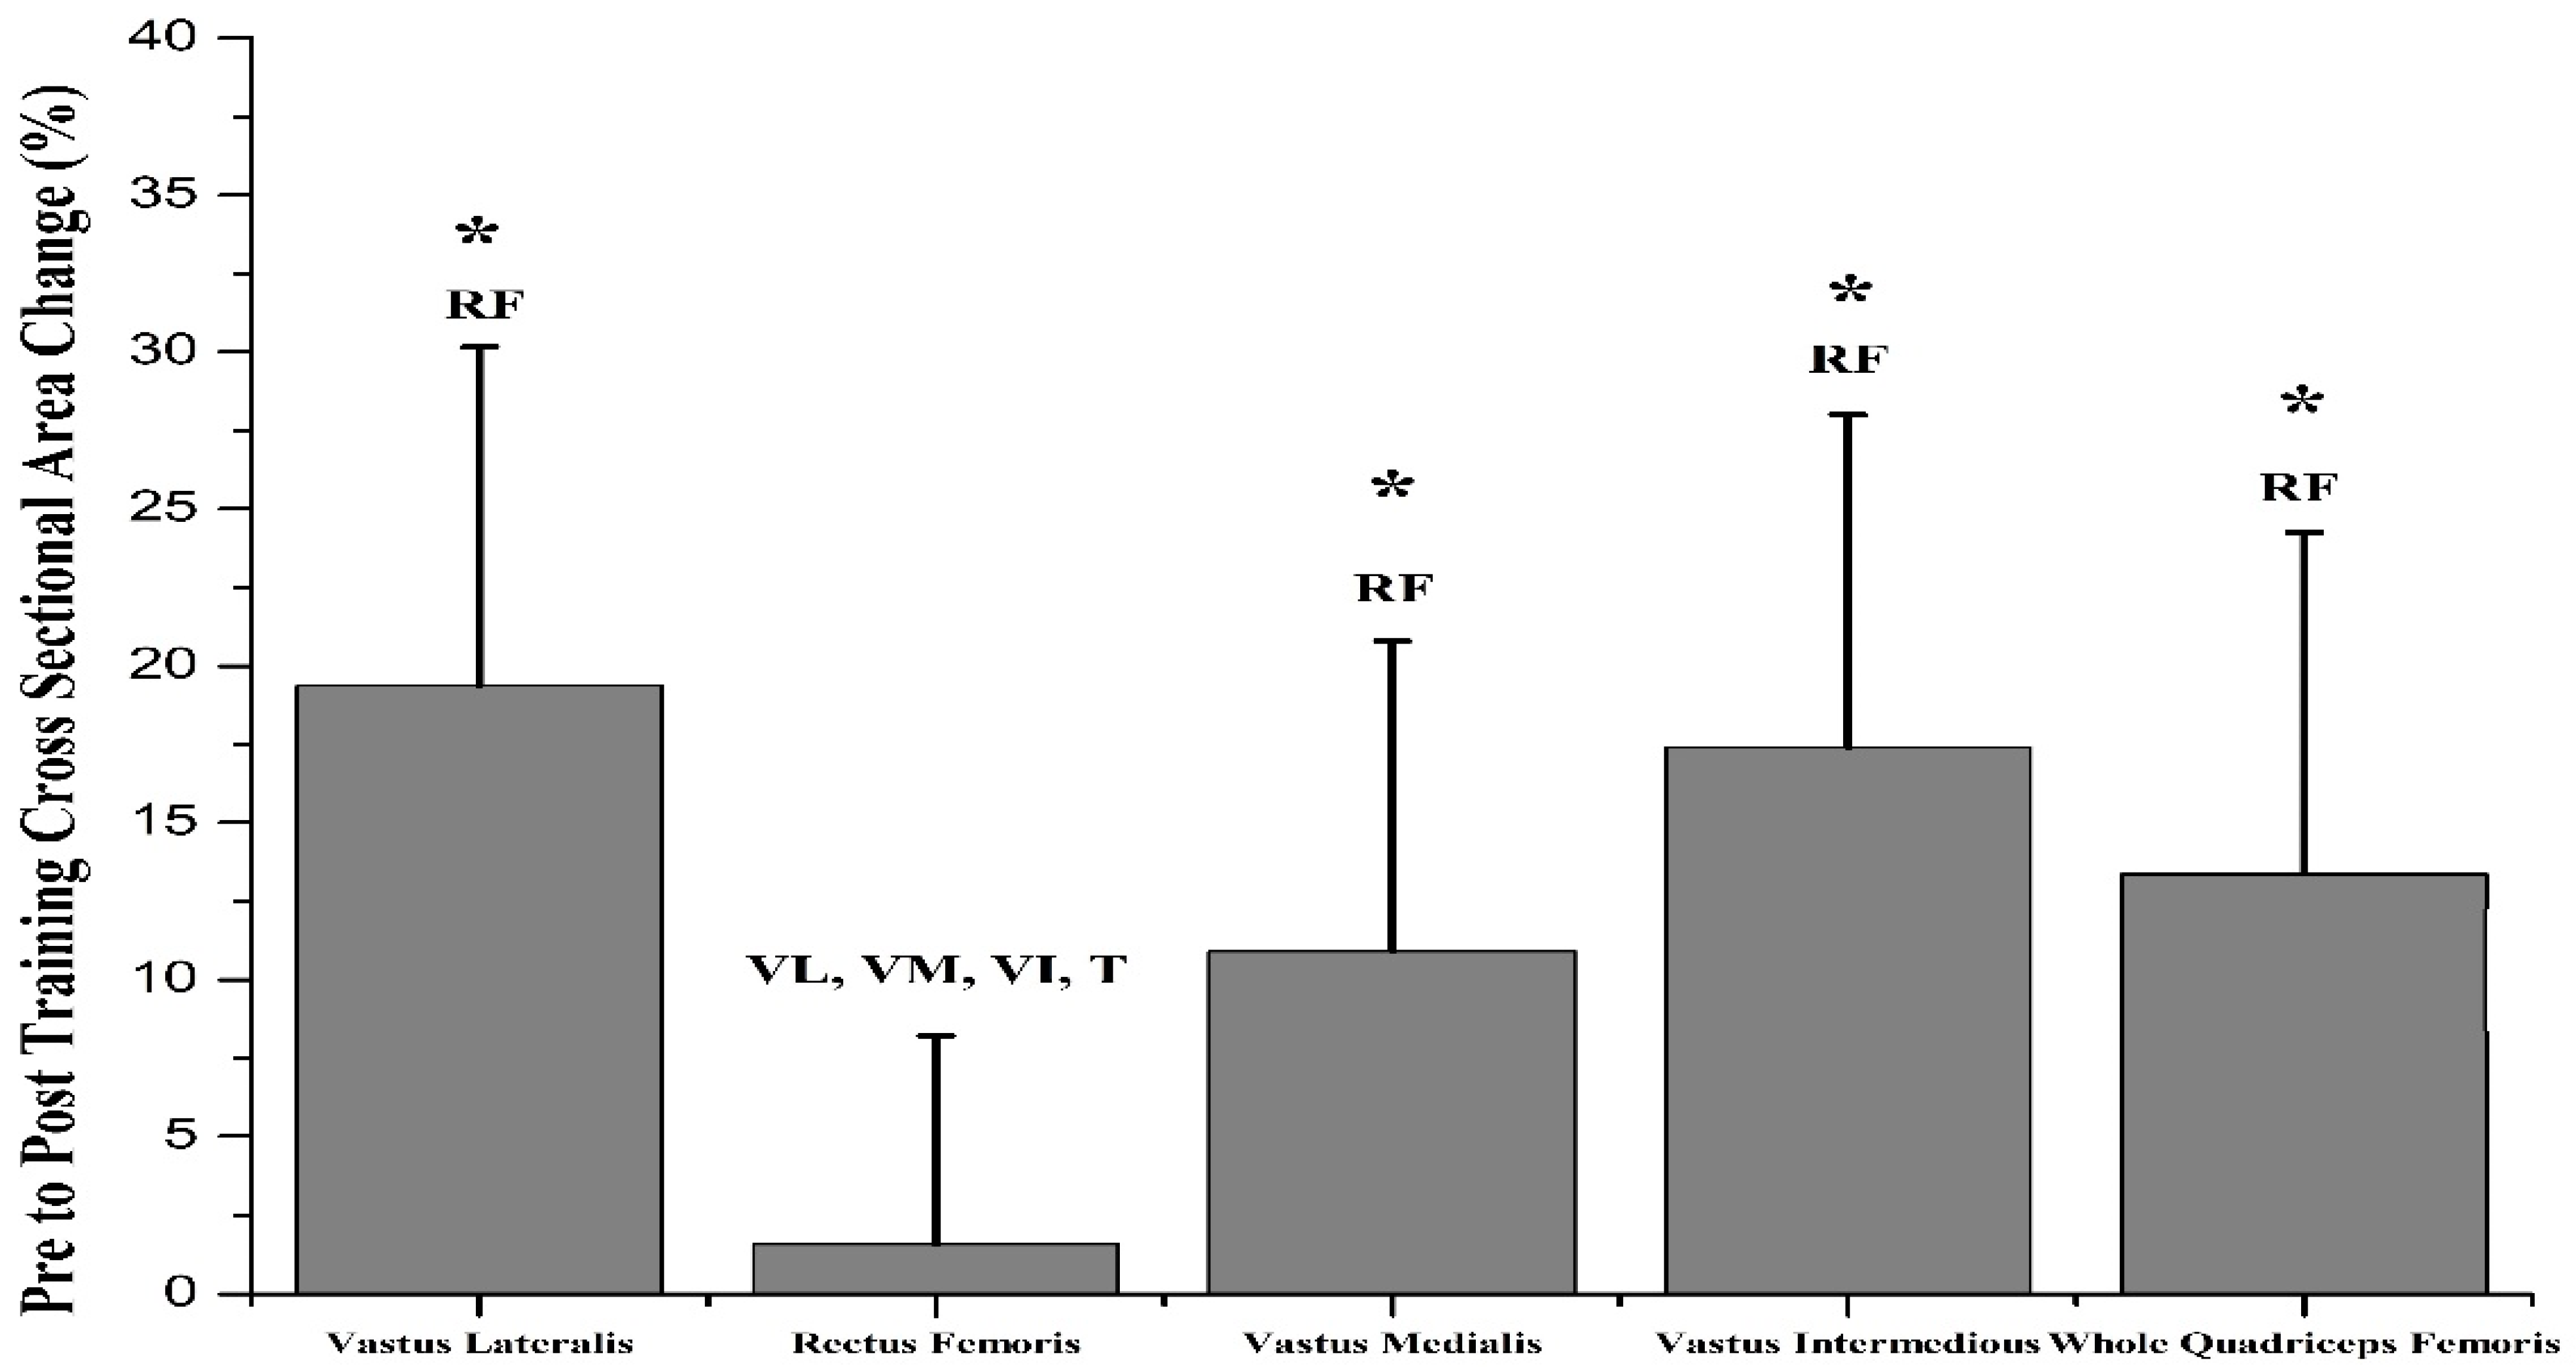
| Grand Mean ± SD (%) | 17.2 ± 12.4 | 7.7 ± 13.6 | 10.9 ± 15.7 | 15.6 ± 14.8 | |
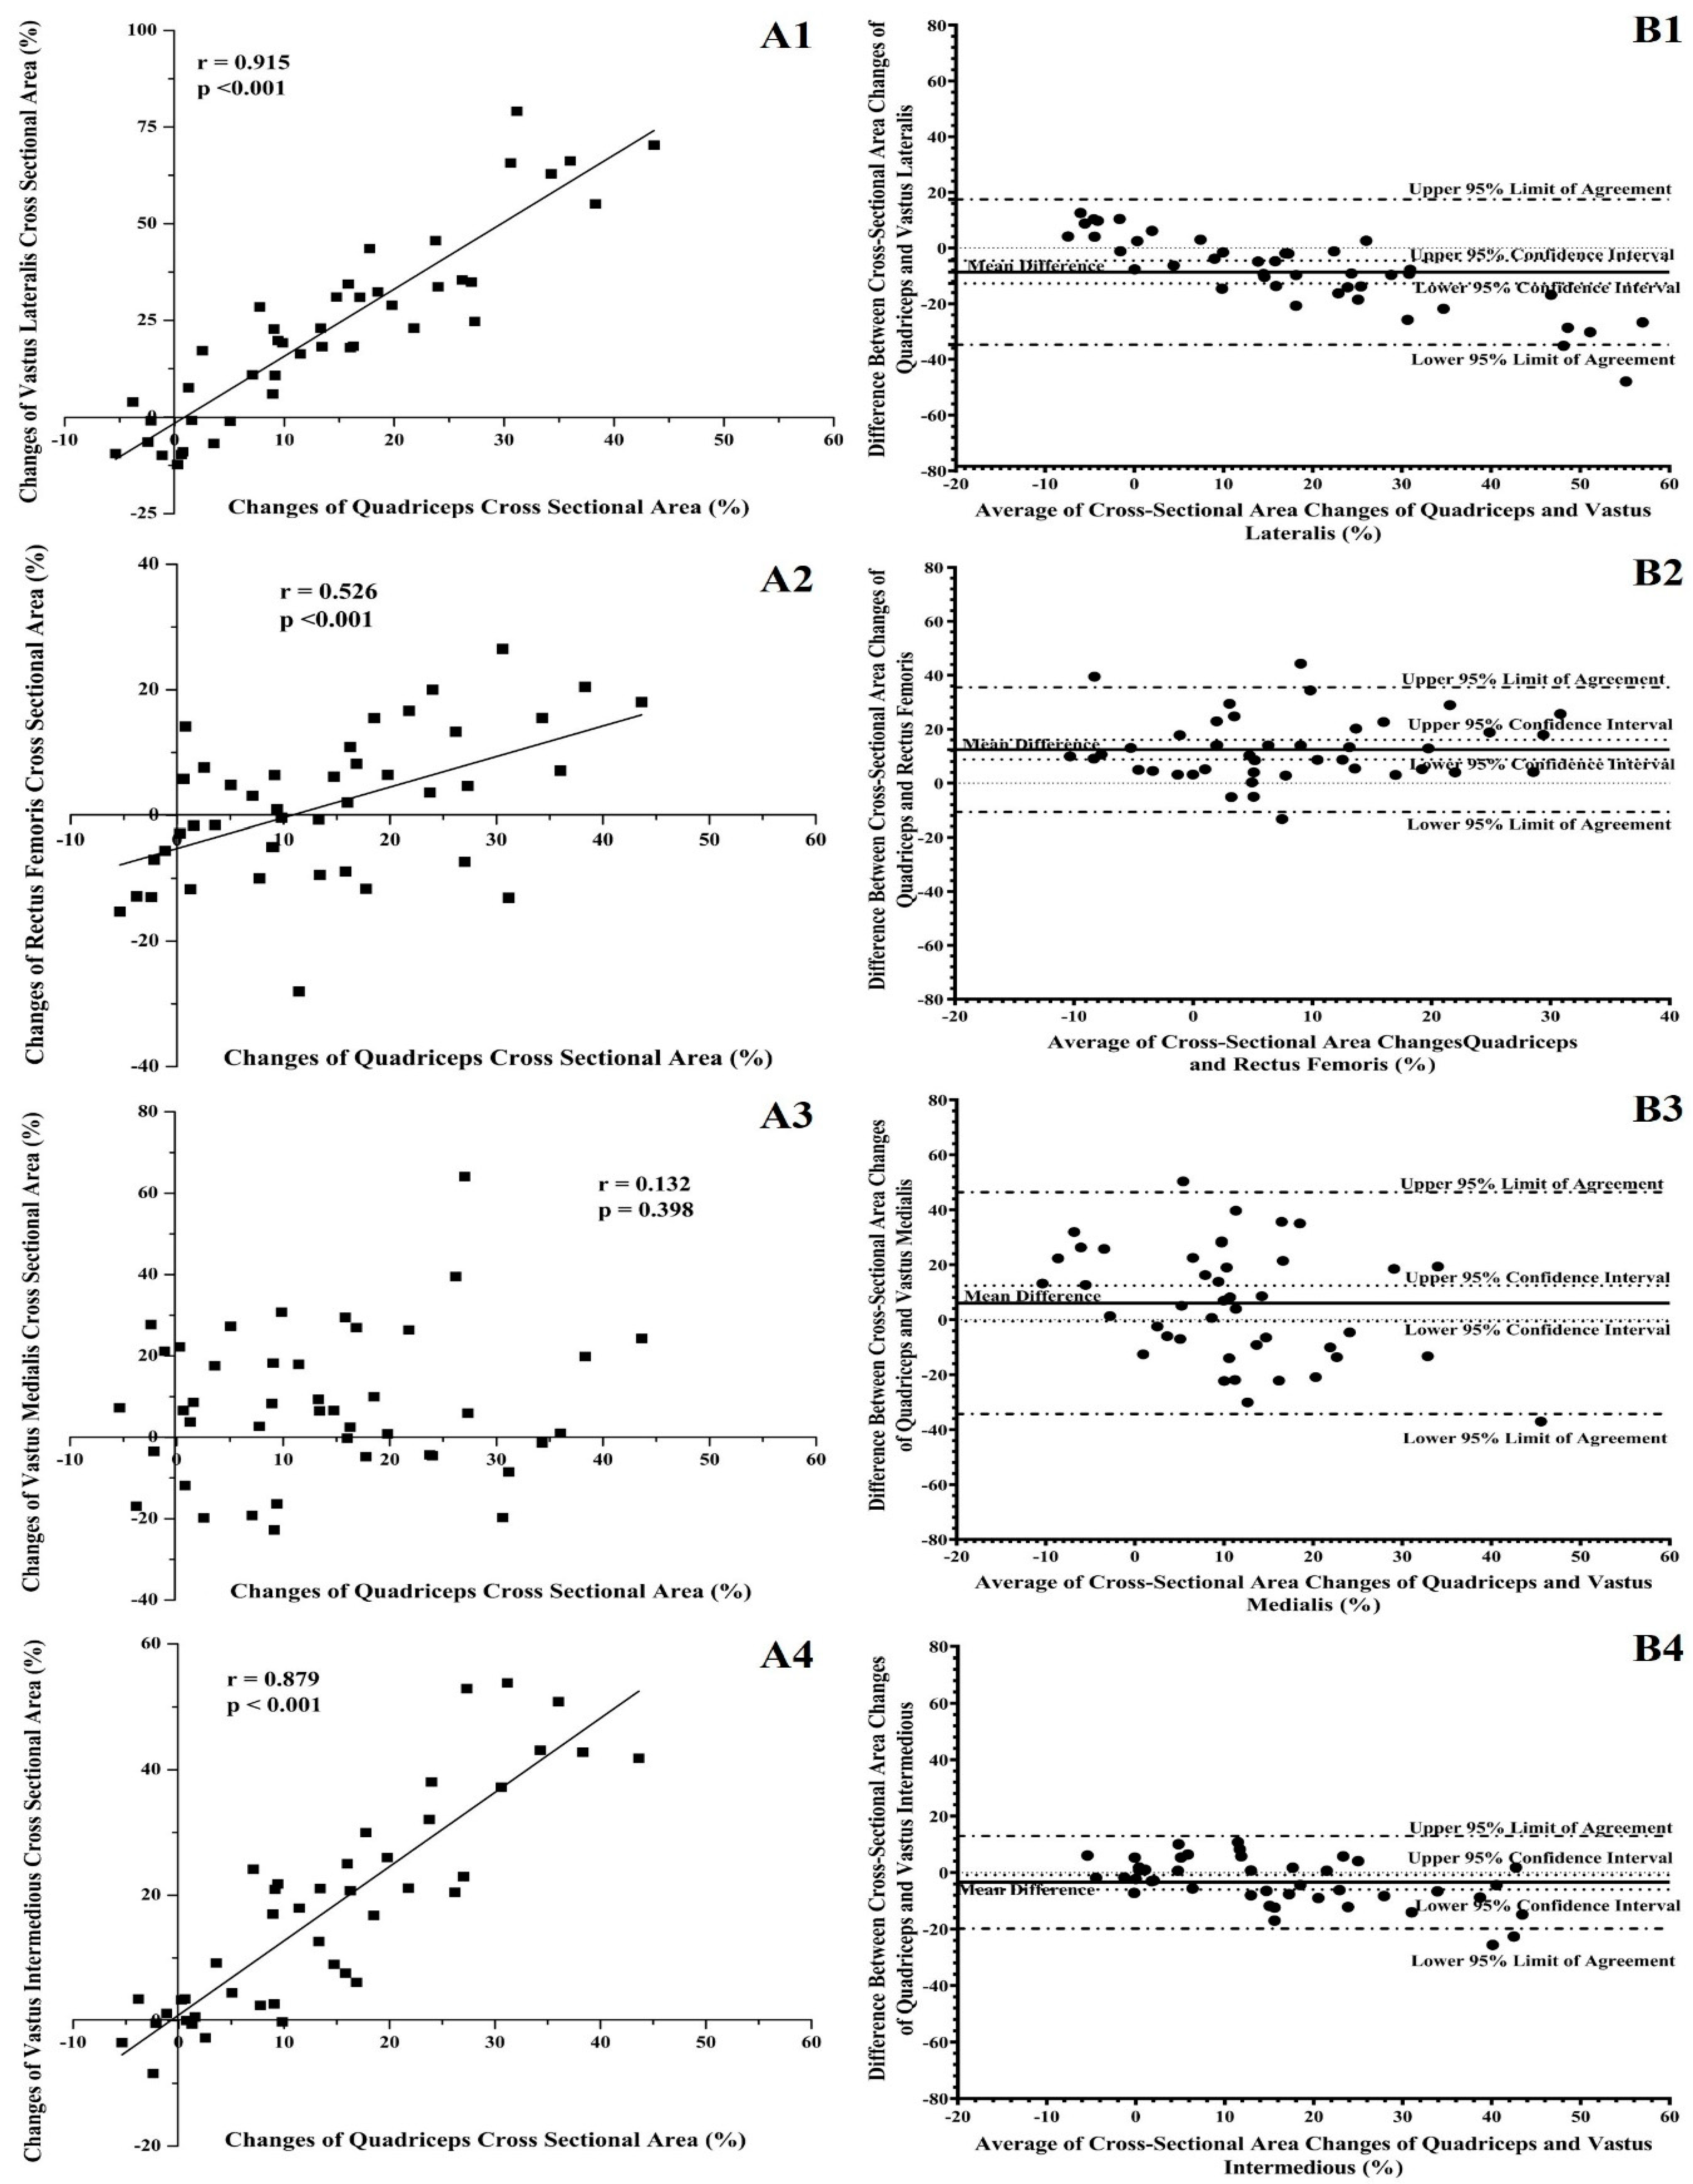
| Pearson’s r product/p | 0.915/<0.001 | 0.526/<0.001 | 0.132/<0.398 | 0.879/<0.001 | |
| Adjusted R2 | 0.833 | 0.259 | −0.006 | 0.767 | |
| LOA | MeanDiff ± SDDiff | −8.6 ± 13.3 | 12.4 ± 11.7 | 6.1 ± 20.5 | −3.4 ± 8.3 |
| 95% CIDiff | −12.7 to −4.5 | 8.7 to 16.1 | −0.5 to 12.3 | −6.0 to −0.9 | |
| High 95% of LOA (95%CILOA) | 17.4 (16.4–18.5) | 35.5 (34.5–36.4) | 46.4 (44.7–48.1) | 12.9 (12.3–13.6) | |
| Low 95% of LOA (95%CILOA) | −34.7 (−35.7–−33.6) | −10.6 (−11.6–−9.7) | −34.2 (−35.9–−32.6) | −19.8 (−20.5–−19.2) | |
| LOA 95% Width | 52.2 | 46.2 | 80.7 | 32.8 | |
| SEL | 0.533 | 0.474 | 0.829 | 0.337 | |
Publisher’s Note: MDPI stays neutral with regard to jurisdictional claims in published maps and institutional affiliations. |
© 2022 by the authors. Licensee MDPI, Basel, Switzerland. This article is an open access article distributed under the terms and conditions of the Creative Commons Attribution (CC BY) license (https://creativecommons.org/licenses/by/4.0/).
Share and Cite
Spiliopoulou, P.; Methenitis, S.; Zaras, N.; Stasinaki, A.-N.; Krekoukia, M.; Tsitkanou, S.; Terzis, G. Vastus Lateralis and Vastus Intermedius as Predictors of Quadriceps Femoris Muscle Hypertrophy after Strength Training. Appl. Sci. 2022, 12, 9133. https://doi.org/10.3390/app12189133
Spiliopoulou P, Methenitis S, Zaras N, Stasinaki A-N, Krekoukia M, Tsitkanou S, Terzis G. Vastus Lateralis and Vastus Intermedius as Predictors of Quadriceps Femoris Muscle Hypertrophy after Strength Training. Applied Sciences. 2022; 12(18):9133. https://doi.org/10.3390/app12189133
Chicago/Turabian StyleSpiliopoulou, Polyxeni, Spyridon Methenitis, Nikolaos Zaras, Angeliki-Nikoletta Stasinaki, Maria Krekoukia, Stavroula Tsitkanou, and Gerasimos Terzis. 2022. "Vastus Lateralis and Vastus Intermedius as Predictors of Quadriceps Femoris Muscle Hypertrophy after Strength Training" Applied Sciences 12, no. 18: 9133. https://doi.org/10.3390/app12189133
APA StyleSpiliopoulou, P., Methenitis, S., Zaras, N., Stasinaki, A.-N., Krekoukia, M., Tsitkanou, S., & Terzis, G. (2022). Vastus Lateralis and Vastus Intermedius as Predictors of Quadriceps Femoris Muscle Hypertrophy after Strength Training. Applied Sciences, 12(18), 9133. https://doi.org/10.3390/app12189133