1. Introduction
In our society, cultural heritage in general, and museums in particular, play a key role as symbols of the past and as a means of safeguarding cultural identity in a continuously changing world. Cultural tourism can be a major contributor to the economy of each country, as well as a potential vehicle to facilitate the preservation of cultural heritage, if properly managed [
1,
2]. From this perspective, the improvement of indoor air quality (IAQ) in museums is an important challenge as artefacts can be subjected to various types of decay depending on the indoor conditions in the building where they are preserved [
3]. On the other hand, comfortable conditions for workers and the visitors must also be guaranteed, requiring compromises between indoor pollution, well-being, preventive conservation, and energy efficiency [
4,
5]. The indoor temperature and relative humidity greatly influence the occurrence of chemical, biological, and mechanical degradation, as well as affecting thermal comfort [
6,
7]. Indoor relative humidity and temperature, as well as causing dimensional changes and biological deterioration, can accelerate both physical and chemical damages, such as metal corrosion, discoloration and the hydrolysis of cellulose-based materials, fabrics and paintings.
To achieve and maintain good IAQ, different sources of pollutants must be assessed, such as occupants, building materials, maintenance products, and equipment (HVAC) [
8]. In museums, the main parameters that must be measured and evaluated are chemical pollutants, microbiological pollutants, and volatile organic compounds (VOCs) [
9,
10]. Their effects can be increased if high levels of indoor air temperature, relative humidity, and ventilation effectiveness are improperly controlled inside the museum.
Carbon dioxide (CO
2) and water vapour are emitted from human breath and can be used as an indicator of pollution caused by human beings and of the effectiveness of ventilation in a museum [
11]. It has very little adverse effect on collections, though concentrations above 1000 ppm can have adverse effects on human health.
Table 1 shows concentration levels of CO
2 and their assessment [
12].
Most of the pollutants surveyed in museums belong to the class of VOCs, such as aliphatic, aromatic, and chlorinated hydrocarbons, aldehydes, terpenes, alcohols, esters, and ketones. They can be found in indoor air in relation to the activities performed, to the structural characteristics, to the HVAC system features, and to crowding. In general, the principal sources of VOCs are the occupants, HVAC equipment, air intakes near traffic-polluted areas, cleaning products, draperies, environmental tobacco smoke (ETS), printers and copiers, building materials, and furnishings [
12,
13]. In
Table 2, the most common indoor VOCs are listed with their main sources.
High concentrations of VOCs in indoor environments, that can be two to five times higher indoors than outdoors [
14], can cause a wide range of health effects. The most common effects on human health can be caused by short-term as well as long-term exposure to pollutants. An interesting review of the issues related to exposure to cleaning products and air fresheners is provided in [
15], where different groupings of substances are identified, including glycols, aliphatic, and aromatic hydrocarbons, aldehydes, ketones, and chlorinated organics. Detergents and sanitizers are often considered non-hazardous, pursuant to regulation 1272/2008 (CLP) [
16]. For this reason, the labels and safety data sheets do not report the chemical name of the individual substances, but their general composition (detergent, perfume, etc.). This does not allow for specific determination of the possible contribution of solvents deriving from these uses.
With respect to exposure to indoor air VOCs, the European Guideline COST Project 6 1 3—Report No. 11 [
17] reports the values of total volatile organic compounds (VOCs) derived from international studies (
Table 3).
For microbiological pollutants, the bioaerosol mainly consists of vital and non-vital biological agents, their metabolites (enzymes and toxins), bacterial and fungal spores and cysts of protozoa and cyanobacteria, as well as derivatives of plants, humans and animals. The presence of a bioaerosol can cause infectious processes, allergies, or intoxication. The onset of different pathologies related to the bioaerosol depends not only on the presence of outdoor and indoor pollution sources, but also on the ventilation rate of the building and the effectiveness of ventilation on indoor temperature and relative humidity (necessary conditions for the proliferation of microorganisms), the general hygienic conditions of the building, and the type and duration of human exposure [
18].
Moreover, the effects of biological agents and their metabolites must be evaluated not only in relation to their intrinsic characteristics, but also with respect to potential “cocktail” effects that are associated with mixtures of biological and chemical agents. These “cocktail” effects are also related to the following individual characteristics: age, immune system condition, presence or absence of chronic diseases, and lifestyle (sedentary lifestyle, use of narcotic/intoxicating substances, stress levels, etc.) [
18].
To ensure acceptable indoor biological quality conditions, constant monitoring of pollutant concentrations, ventilation/air treatment systems and their maintenance/sanitation status must be carried out. For this purpose, air quality indicators that must be analyzed include total bacterial load (TBL) and mold spore levels. Inside museums, the main sources of biological aerosol are usually human beings, though these pollutants can grow in the dust settled in the building and HVAC sections. High TBL levels can also be related to the presence and growth of pathogenic micro-organisms that can potentially cause hazardous diseases for humans (including via infectious processes, allergies or intoxication of occupants).
With respect to the concentration of bacterial and mycotic load in indoor air, the European Guideline COST Project 6 1 3—Report No. 12 [
19] presents a classification of pollutants collected using active sampling methods and expressed as CFU/m
3 (
Table 4). These values can be considered to be reference values for aeraulic system hygienic conditions when samples are collected inside the airduct or close to the vents or anemostats (about 50 cm from the sampler).
Finally, considering conditions for the well-being of people, [
20,
21] report the typical average values of indoor air temperature, relative humidity, and mean air velocity (
Table 5).
Currently, there is no specific reference in the Italian national legislation, and no global and integrated policy has been defined in the technical field, for the evaluation of cause-effect associations between the presence, type, and concentration of pollutants and perceived discomfort/health risk, according to the above-mentioned requirements. However, there are some reference technical rules and standards, guidelines, and national and international studies on IAQ [
18,
22,
23] that provide precise indications, e.g., ANSI/ASHRAE standard 62.1-2019 [
24], where IAQ is defined as “air in which there are no known contaminants at harmful concentrations, as determined by cognizant authorities, and with which a substantial majority (80% or more) of the people exposed do not express dissatisfaction”.
Since discomfort and health risk are largely related to pollutant concentrations and, therefore, indirectly to the ventilation effectiveness in the rooms, many technical and regulatory provisions deal with minimum values of air flow rates [
25,
26]. In addition, it is possible to find guidelines dealing with the hygienic maintenance of air handling units (filtration and cleaning) and the ductwork, relating to their inspection and cleaning procedures, and reference values on the concentration of dust, bacteria, and fungi inside the ductwork, as well as reports (mostly published by the Italian National Institute of Health—ISS) which deal with control and regulation in the IAQ arena to protect human health [
12,
27,
28,
29].
In Italy, in museums, the protection of artworks and individuals fall under a very broad regulatory and legislative framework overseen from the Ministry for Cultural Heritage and Activities [
30] to the Ministry of Health [
31]. Guidelines are also available that are issued by various national public technical bodies, such as the Higher Institute for Prevention and Occupational Safety (ISPESL), the Italian National Health Institute (ISS), and other international bodies, such as the World Health Organization (WHO), the Air Infiltration and Ventilation Center (AIVC), and, finally, ANSES (Agence Nationale de Sécurité Sanitaire de l’Alimentation, de l’Environnement et du Travail—the national agency for health, food, environmental and work safety). The latter, for instance, has drawn up an updated report on CO
2 concentrations. Moreover, the State-Regions conference guidelines are of great interest [
32,
33]. These documents provide information on the maintenance procedures for HVAC systems and provide for the planning of the hygienic maintenance of aeraulic components, and the frequency of, and strategies for, interventions.
The activity of ISS is of particular interest. In 2010, the National Study Group on Indoor Pollution was formed and issued documents dealing with various aspects of IAQ, such as VOCs in indoor environments [
27], monitoring strategies for biological air pollution in indoor environments [
28], microclimate parameters and indoor air pollution [
29], and the presence of CO
2 and hydrogen sulphide (H
2S) in indoor environments [
12].
Finally, considering the close relationship between air quality and HVAC systems, important recommendations have been provided in some documents drafted on hygienic maintenance by associations such as the National Air Duct Cleaners Association (NADCA) and the Italian Association of Aeraulic Systems Hygienists (A.I.I.S.A.) with reference to Italy. In particular, the 2021 NADCA ACR Standard [
34] provides practical, reliable and industry-backed information for assessing new and existing HVAC systems, evaluating and verifying the cleanliness of HVAC system components, preventing job-related hazards, and guiding the cleaning and restoration of HVAC systems to a specific level of cleanliness.
Within this panorama, this study sought to assess IAQ in museums based on a defined methodology. The proposed approach was applied and validated in the world-famous museum of the Uffizi Gallery in Florence, Italy. The approach comprised a combination of a survey and short-term monitoring carried out in selected rooms of the museum. The monitoring was undertaken to investigate indoor environmental conditions that have been demonstrated to affect both occupants’ well-being and artwork preservation, i.e., air temperature, relative humidity, and chemical and microbiological pollutants. Furthermore, a tailored strategy for the assessment of the monitored data was identified and implemented. The purpose of the proposed approach was to highlight possible critical issues in terms of IAQ in the museum and, as a result, to define guidelines to improve indoor air quality control in museums and to address observed issues.
2. Materials and Methods
2.1. Investigation Strategy
This research builds upon a previous study [
35] in which a general investigation strategy for the assessment of the indoor air quality of museums was defined. In the present study, this approach is presented and applied in a case study of a specific museum building. This methodology is based on the following phases:
- (i)
collection of general data;
- (ii)
definition of monitoring strategies;
- (iii)
sampling of indoor parameters;
- (iv)
analysis of data and comparison between measured and recommended values;
- (v)
IAQ parameter critical analysis and their correlation with possible pollution sources;
- (vi)
definition of guidelines and strategies for the improvement of IAQ conditions in museums.
During phase (i), combined with site inspections, primary information about the museum was collected, such as documents and drawings, the characteristics of rooms and the equipment held, the typical presence of visitors in each room, the presence and typology of the HVAC system, the characteristics of the building materials, the characteristics of the objects exposed and their conservation requirements, and the methods of cleaning the environment and the detergents used. Moreover, interviews with technical staff were carried out to identify possible concerns regarding management of the indoor air quality conditions in the museum environment.
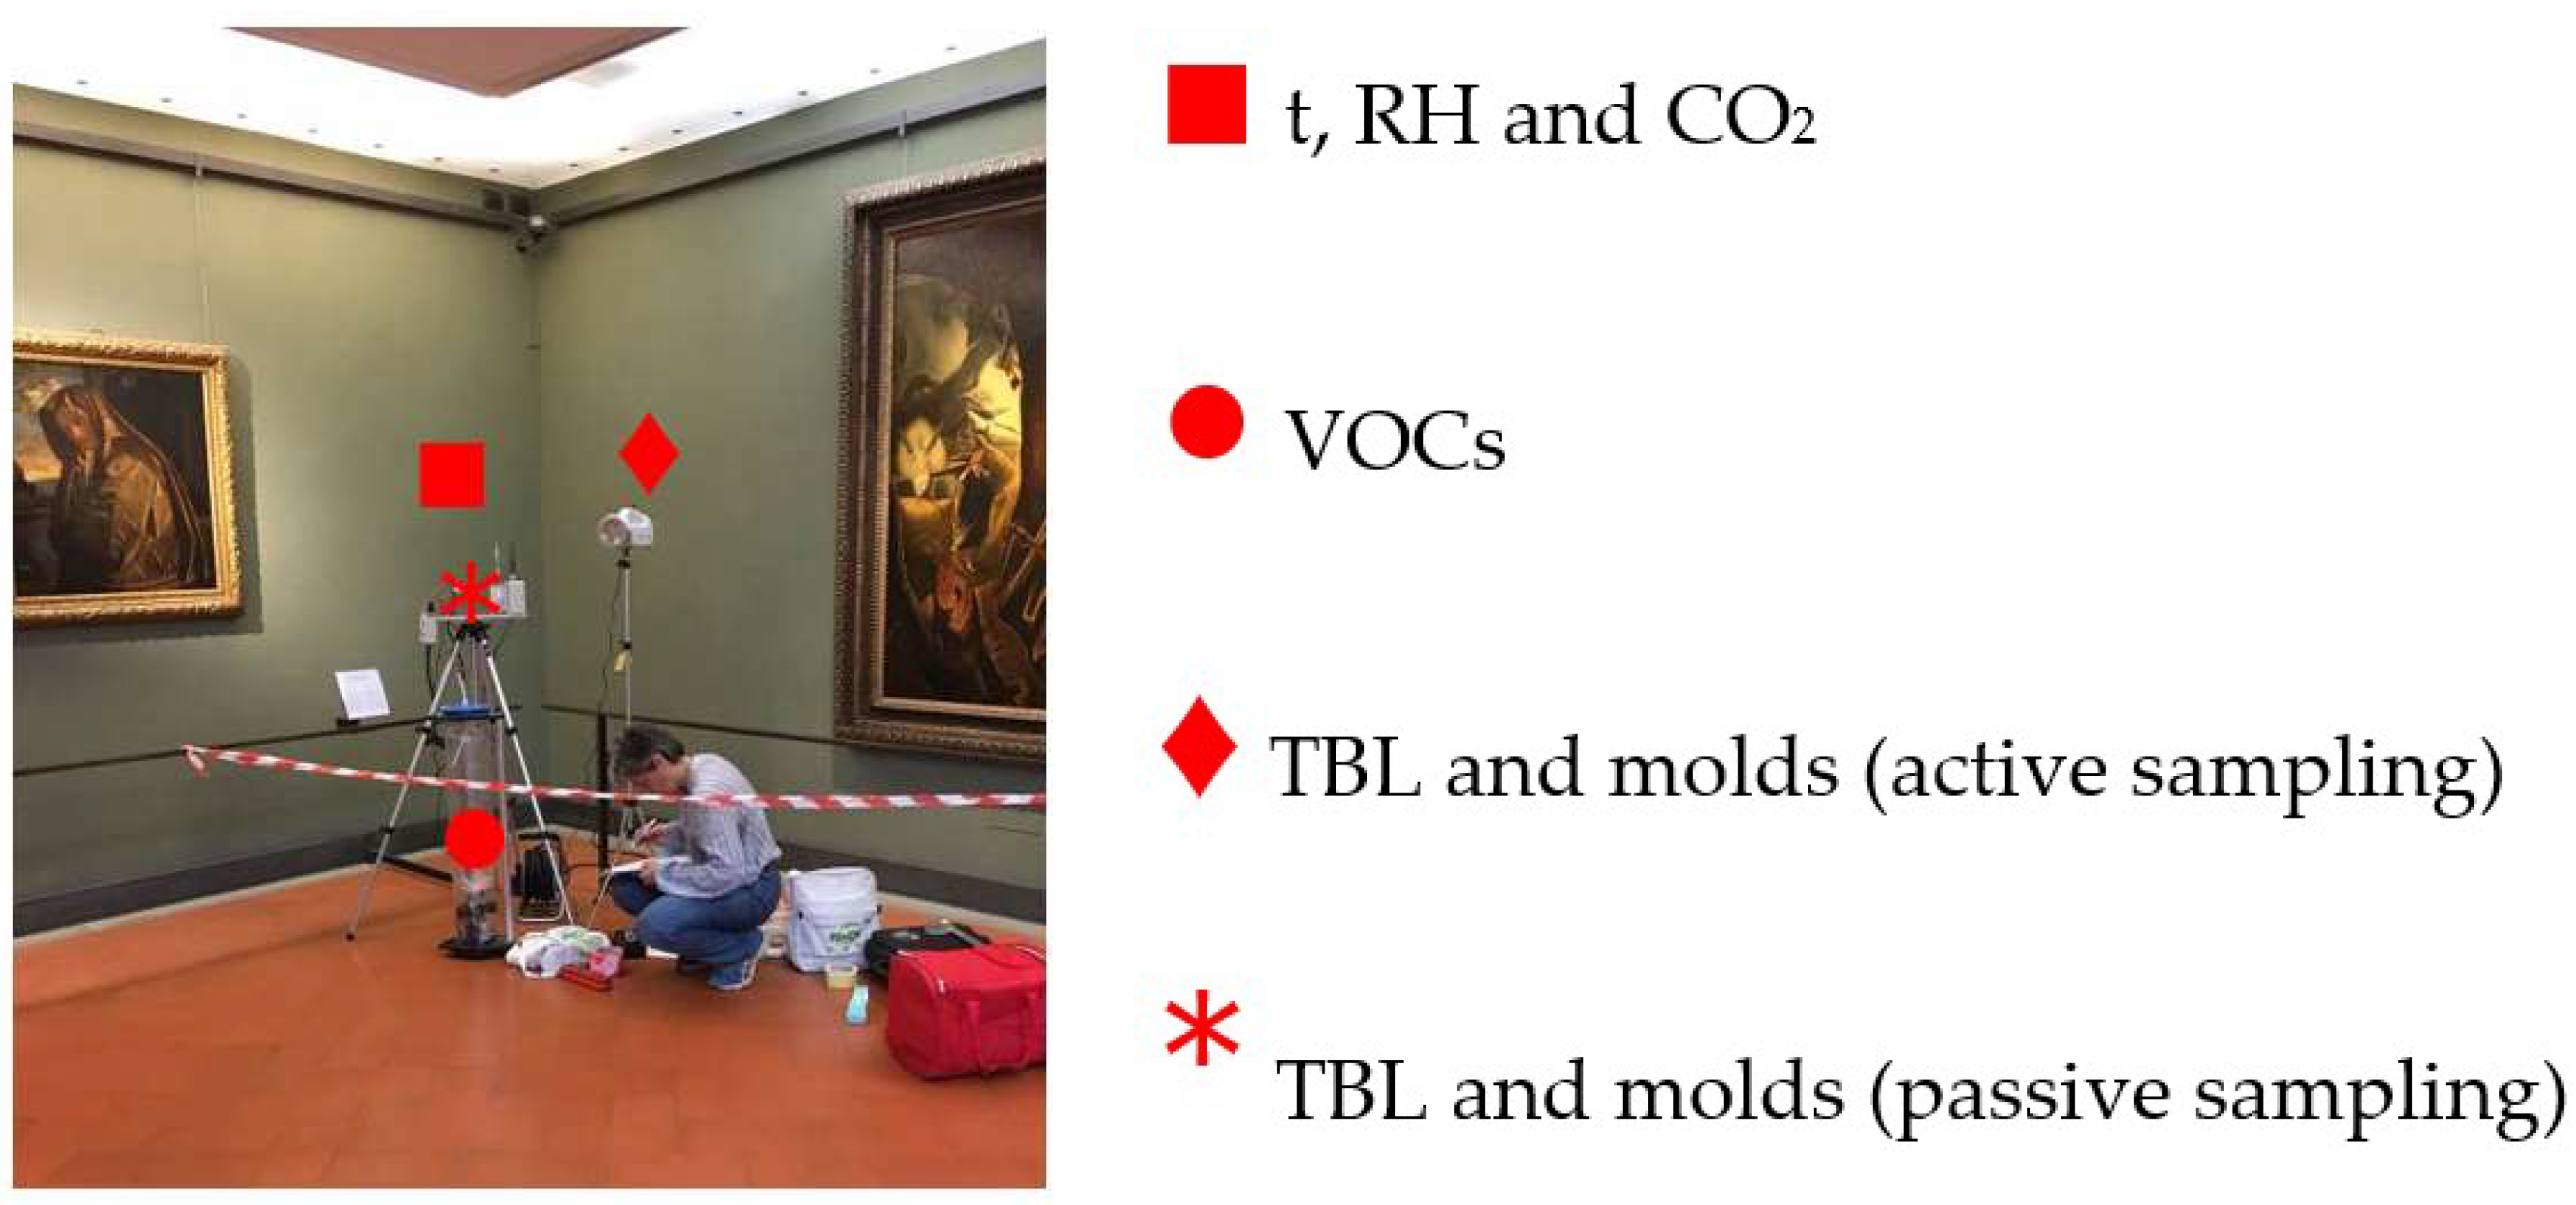
During phases (ii) and (iii), the monitoring strategies (instruments used, time of sampling, duration and frequency of sampling, etc.) for the evaluation of indoor air quality were defined, consistent with the research objectives. Moreover, based on the outcomes of phase (i), the reference rooms of the museum to be analyzed and the sampling location inside each room were defined. The analyzed rooms were selected based on various considerations related to the conservation of the artworks, i.e., their importance and the potential critical issues for their preservation, user factors, i.e., the number of visitors and occupants’ well-being related to indoor air quality, and the characteristics of the air conditioning system. In each room selected, the monitoring systems were placed in the best location with the purpose of collecting representative data (at a height of 1.5 m from the floor), while limiting visitors’ interaction with them, to ensure the proper and undisturbed functioning of the rooms
Since the museum is visited by many people every day, parameters characterizing air pollution in the rooms of the museum were collected for the selected representative rooms. Furthermore, the principal indoor parameters defining environmental and air quality conditions were collected, such as air temperature, relative humidity, organic (VOCs) and inorganic (CO2) pollutants, and bacteria aerosols (bacteria and molds).
Measurements were carried out both during the opening hours and the closing hours of the museum. The latter measurements were used as reference values for the conditions without occupants. In this case, monitoring was carried out during a day when the museum was closed to the public and a day when the museum was open to the public (opening hours 8:15 to 18:50), corresponding to a greater number of visitors. The monitoring was carried out before the maintenance of the HVAC systems to assess the most critical conditions.
To monitor the indoor air temperature, relative humidity and CO
2 concentration, a datalogger connected with a psychrometer (air temperature [°C] and relative humidity [%]), and a CO
2 probe [ppm] were used. This microclimate station measured the parameters every minute for 30 min in sequence in each room analyzed.
Table 6 summarizes the main features of the microclimate station [
35].
Organic pollutant and bacteria aerosol sampling were carried near the microclimate station [
35]. The VOCs were monitored through active sampling of a 5 L air volume in nalophan bags. Subsequently, the collected air volume was analyzed in an external laboratory through quantitative and qualitative VOCs analysis performed according to the gas chromatography-mass spectrometry (GC/MS) method [
36]. The cut-off value for VOCs was set equal to 1% of the air sample [
37].
Both active and passive methods were used in the biological analysis to sample TBL and molds. Active sampling involved the collection of air flow with a surface air system impactor (sampling rate of 100 L/min). However, the sampling rate and, thus, the total air volume varied from 0.3 to 1 m
3, according to the different occupational patterns of the monitored museum room, assuming a potentially higher pollutant concentration in relation to a greater presence of visitors. Passive sampling was used to gather information about the microbial load, using Petri dishes positioned next to the microclimatic station (Φ = 90 mm, plate count agar for microbial growth and Sabouraud dextrose agar for mold growth). The microbial load naturally falls on the plate as an effect of the movement of air (due to both the passage of people and to the air flows from the HVAC systems). Using this method, the total biological pollution was measured for 2 h. At the end of the sampling period, the dishes from the active and passive methods were analyzed in an external laboratory where they were incubated at the required temperature-time range (three days at 30 °C for TBL and five days at 25 °C for molds). Thereafter, the samples were analyzed to determine the CFU for both bacteria and molds according to the ISS Report [
28].
During phase (iv) all the sampled and monitored data were post-processed and organized in tables and graphs summarizing the minimum, maximum, and average values of the parameters. The parameters were analyzed for each selected room. For the organic, inorganic, and biological pollutants, the collected data were compared with reference values reported in the analyzed literature and, for the VOCs, also with cut-off values. Similarly, the measured air temperature and relative humidity values were compared with reference values for artwork conservation [
30] and for occupants’ well-being [
20,
21].
In phase (v), the results of the data collection were critically analyzed. The correlation of the level of pollutants (i.e., CO2, VOCs, TBL and molds) with various influencing variables, including the type of HVAC system, the maintenance procedures, the cleaning procedures, etc., were investigated. In particular, the total bacterial load and total colony forming units (CFUs) in the bioaerosol were assessed.
Finally, the outcomes of phase v) were utilized in phase (vi) to propose strategies and guidelines for the improvement of IAQ in museums.
2.2. The Case Study
The defined methodology was implemented and validated in selected rooms of the Uffizi Gallery Museum in Florence, Italy. This is a large museum that is among the most famous in the world. The Uffizi Gallery hosts priceless artwork collections that include paintings by Italian artists from the 14th-century and the Renaissance (e.g., Leonardo, Raffaello, Giotto, Piero della Francesca, Simone Martini, Filippo Lippi, Beato Angelico, Mantegna, Botticelli, Correggio, Michelangelo, and Caravaggio). Numerous precious works by European painters from the same historic period (mainly Dutch, Flemish, and German), and a collection of ancient statues and busts [
35] from the Medici family, are also displayed in the museum. The latter are ancient Roman copies of lost Greek sculptures that adorn the corridors of the Uffizi Gallery. The museum is located on the first and second floors of a valuable historical building in the city center of Florence, designed by Giorgio Vasari and dating back to 1560–1580.
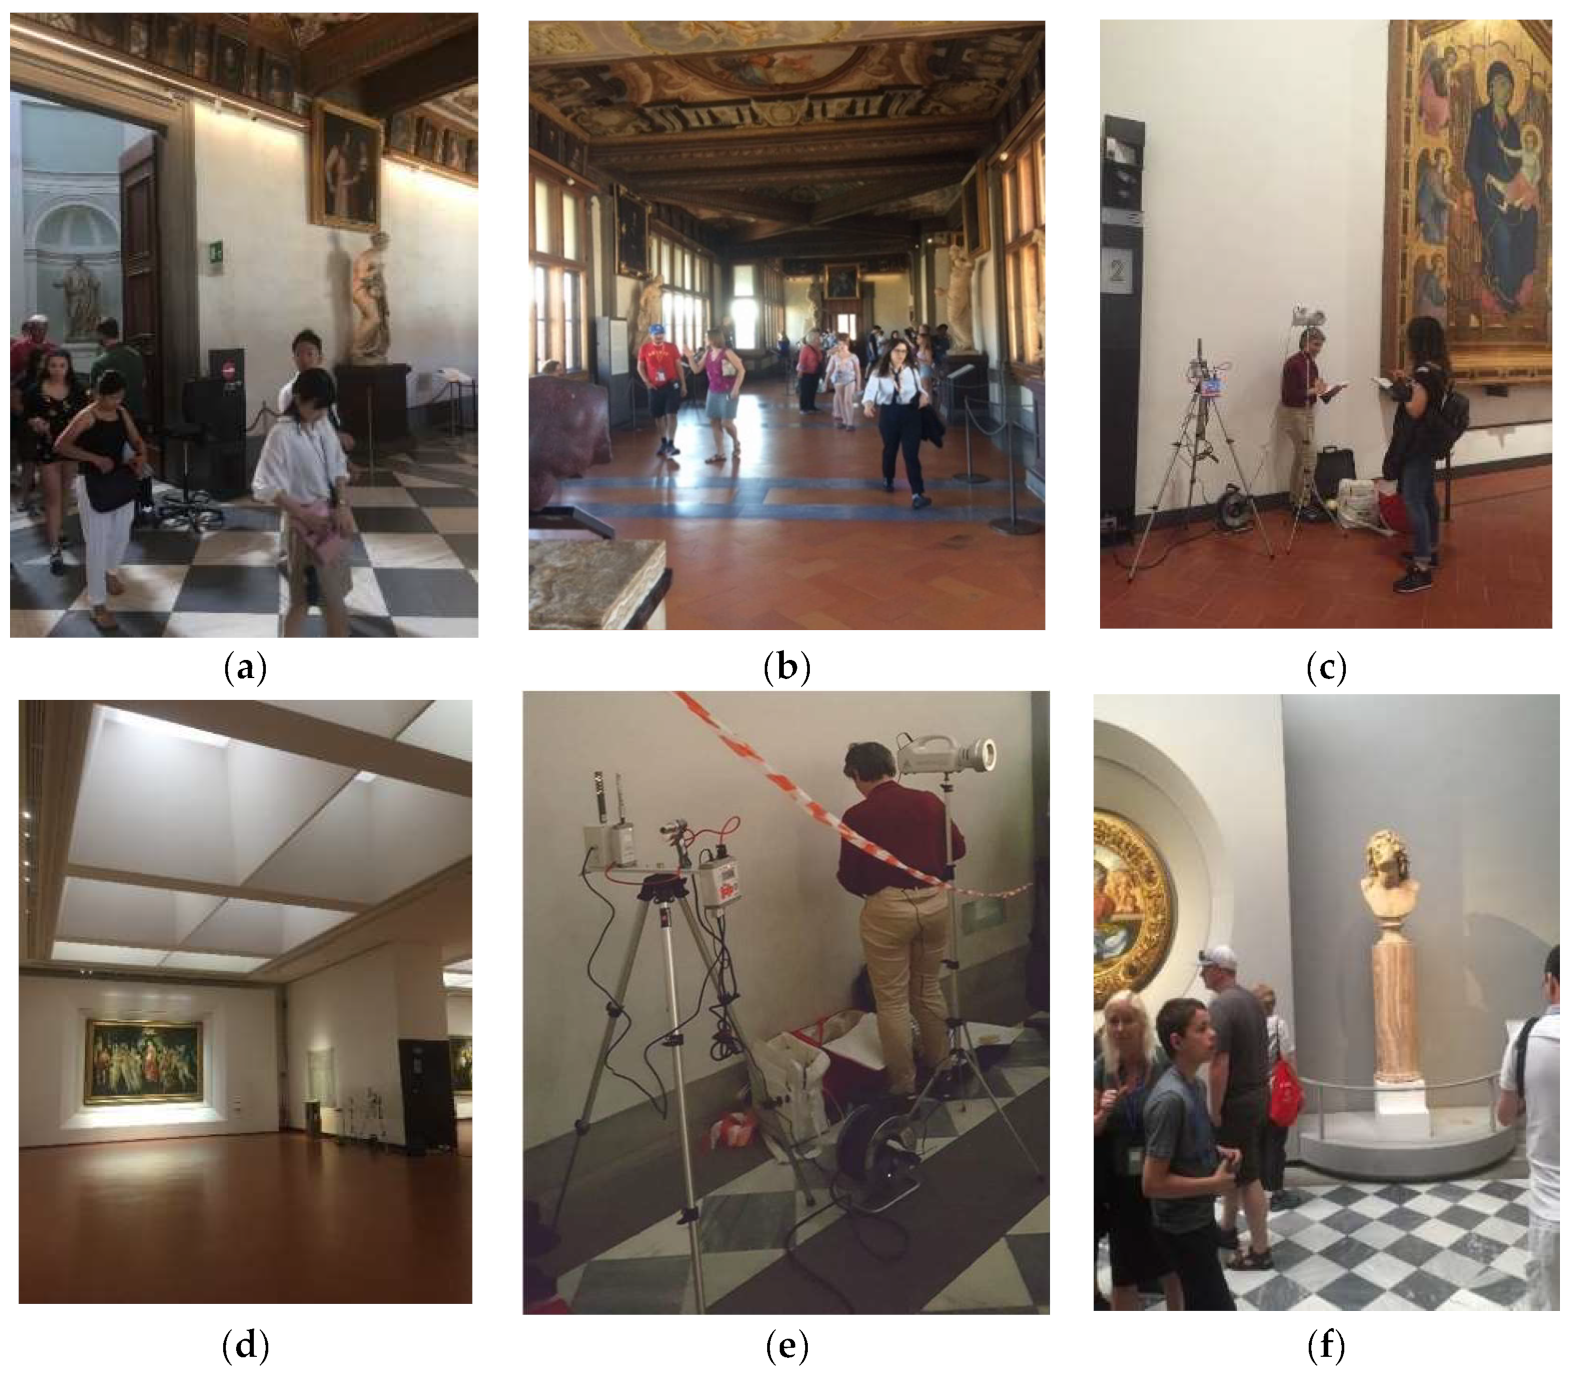
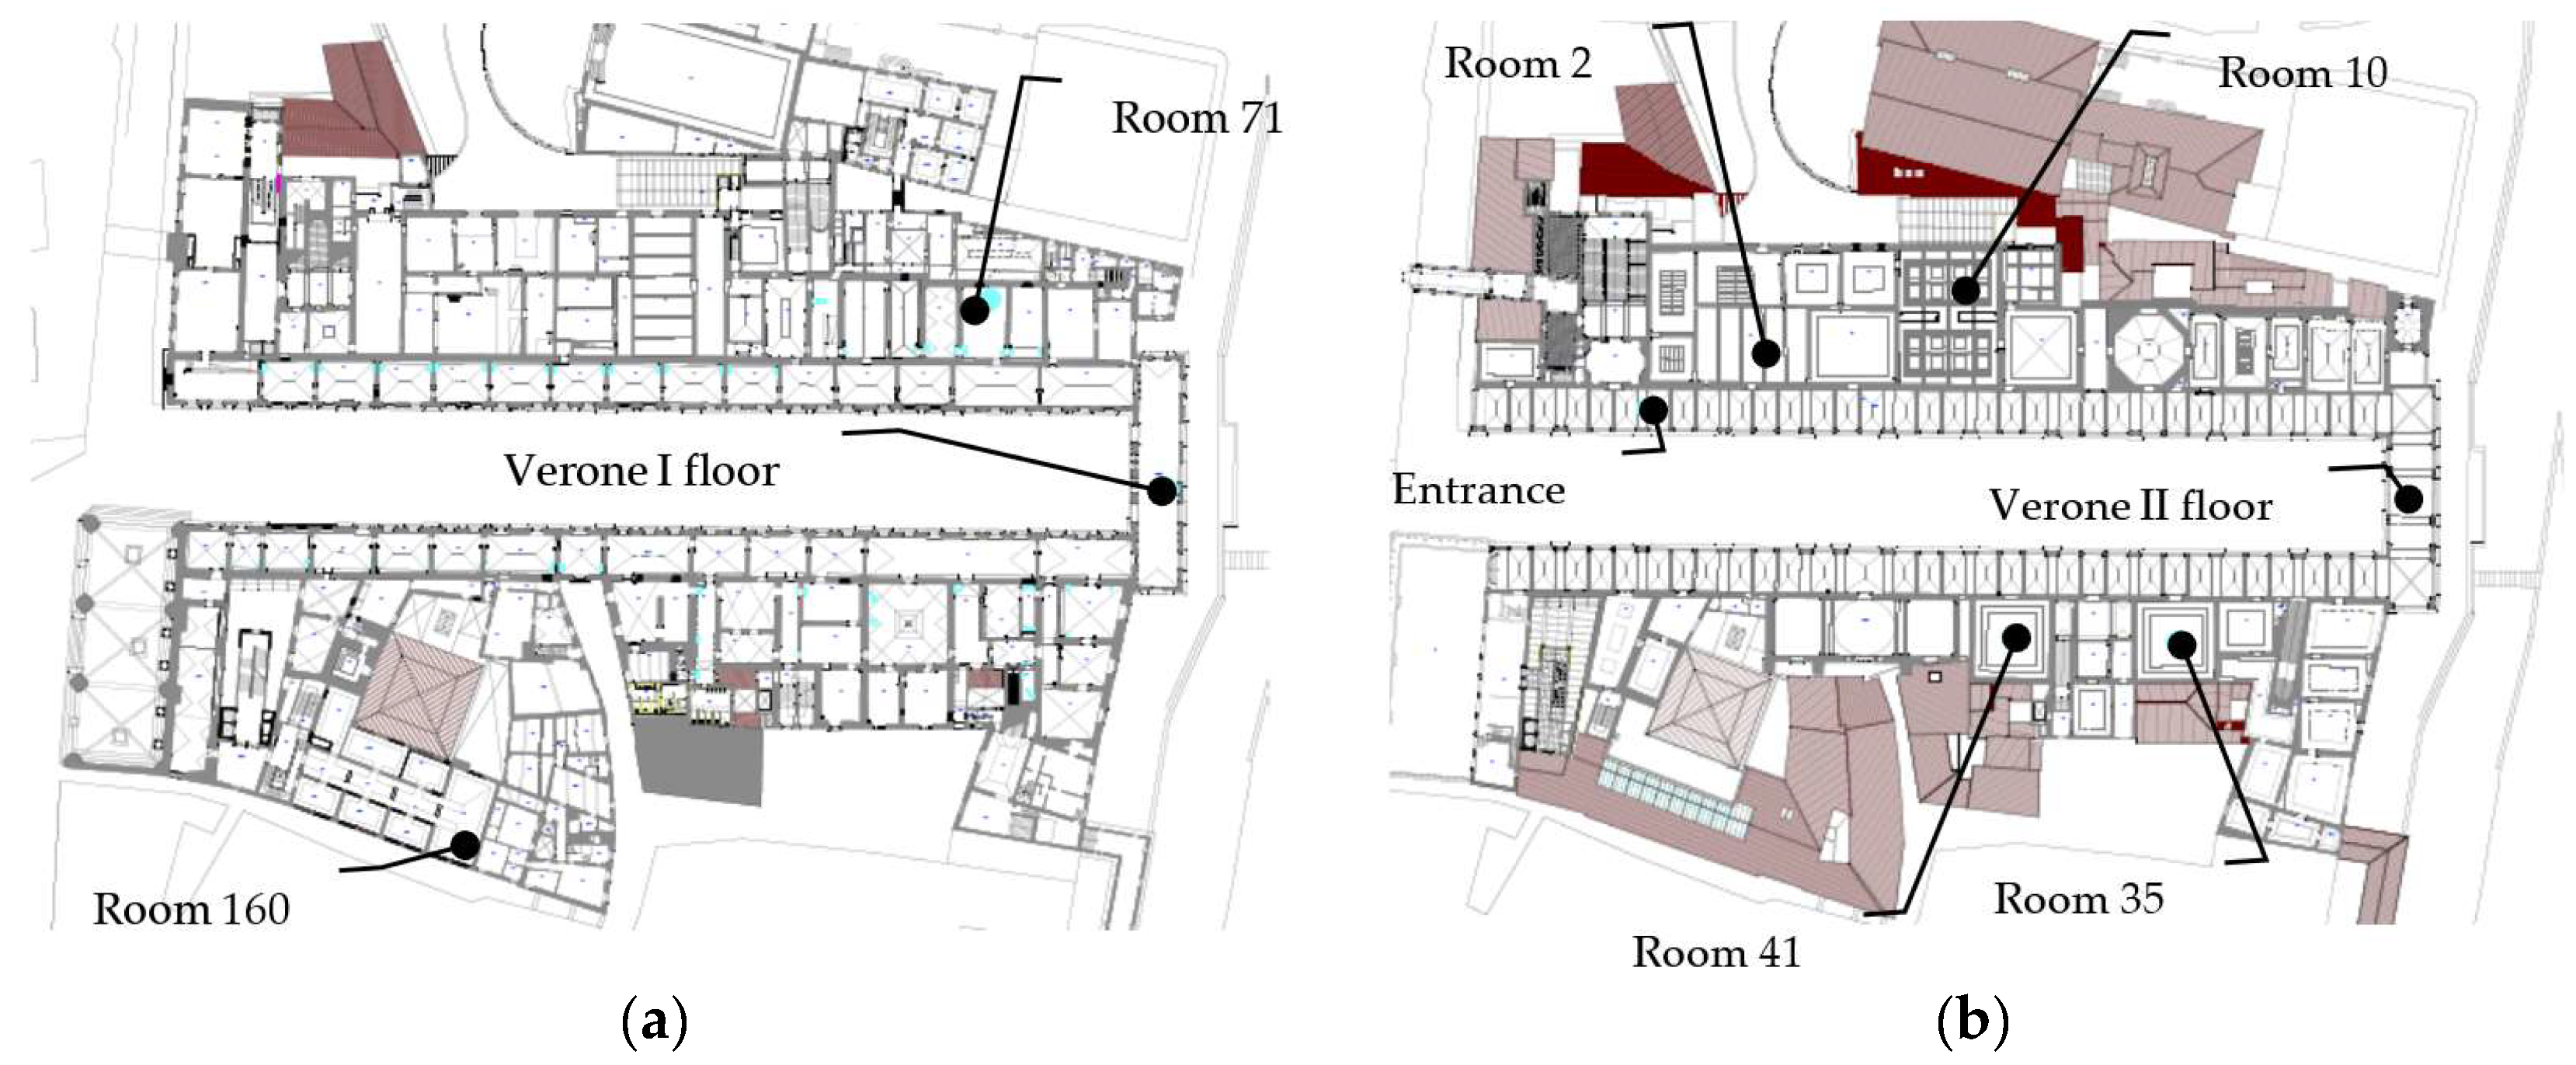
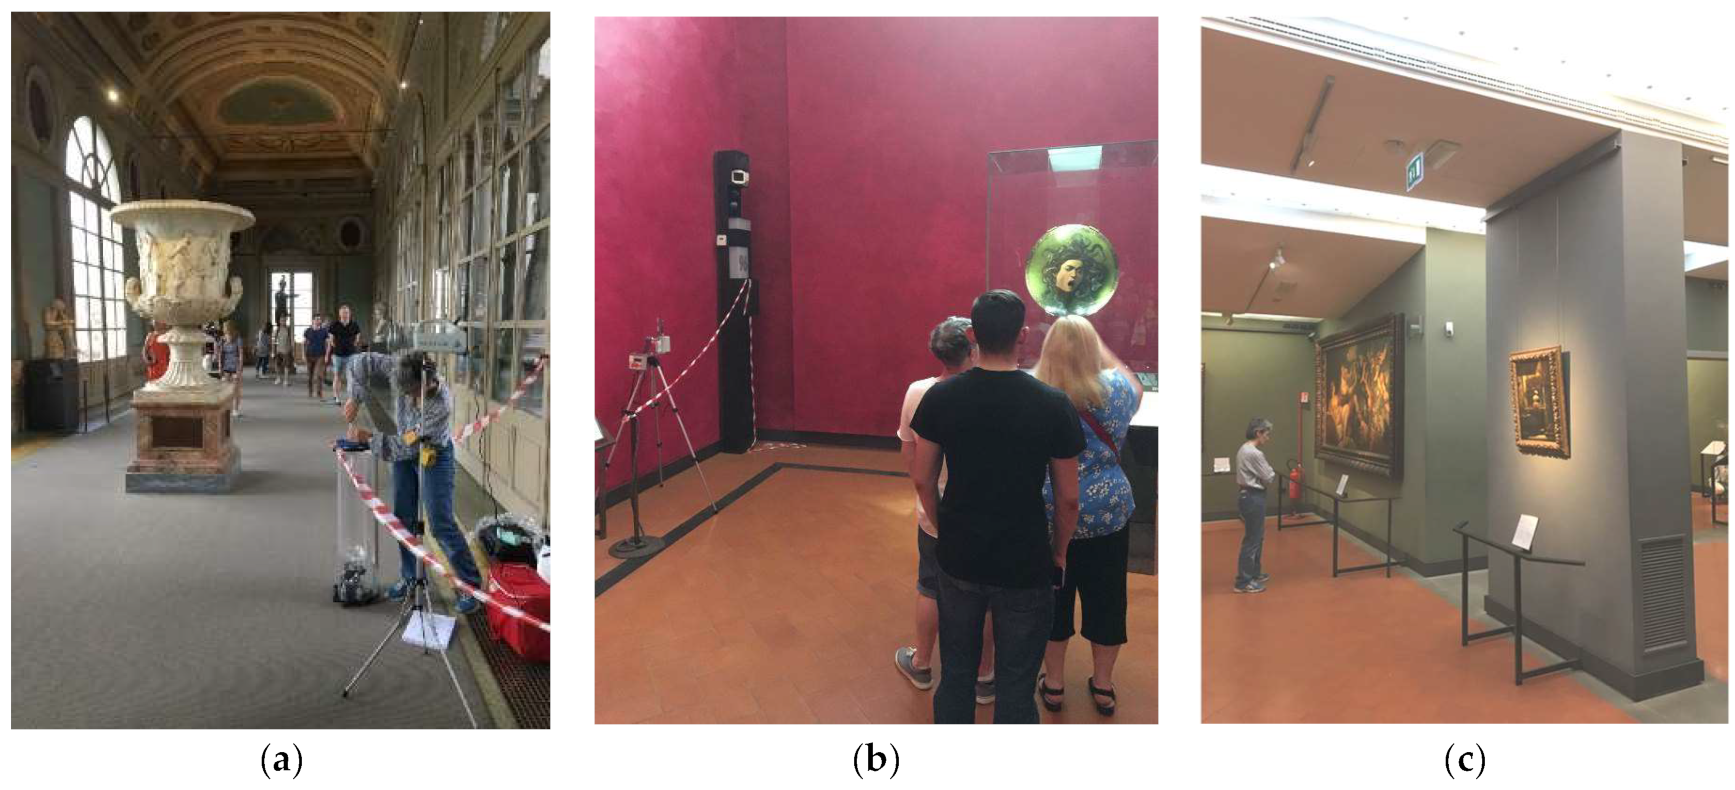
According to the results of phase (i), and due to the insights obtained from the interviews with the technical staff, some Gallery rooms characterized by poor air quality were identified. Therefore, the investigation was carried out for nine representative rooms that are highlighted in
Figure 1 and described in detail below.
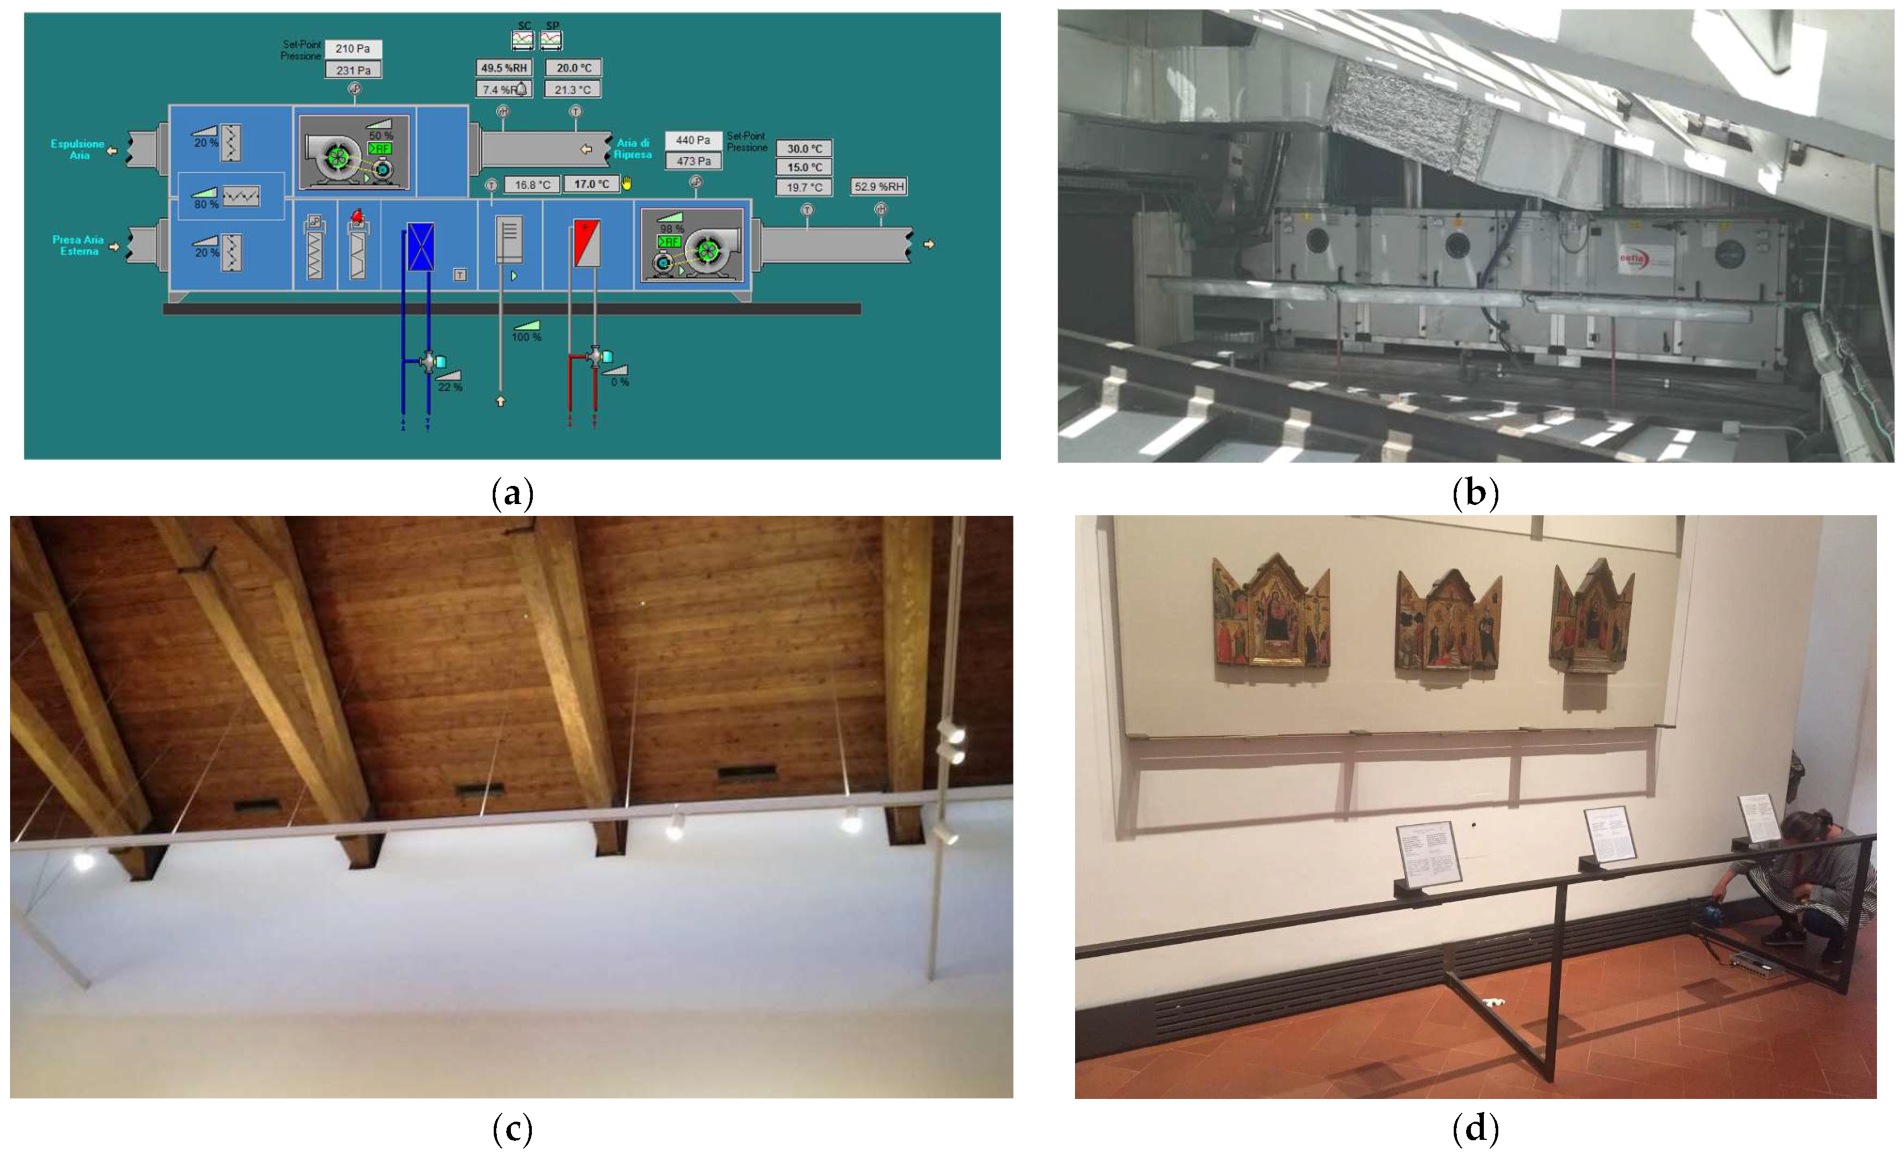
With respect to the HVAC system serving the building, the Uffizi Gallery is mainly equipped with HVAC systems which recirculate the air, for the control of air temperature and relative humidity, all year. Moreover, the system is managed by a remote monitoring and control system, positioned in a technical room, that also controls the fire system, the security system, and the electrical system. As an example,
Figure 2 shows the air handling unit (AHU) control system of Room 2 and some pictures of the room.
On the first floor of the museum, three rooms were considered (
Figure 3). The Verone I floor (
Figure 3a) has views from every orientation with large windows and mainly hosts ancient statues and busts. Sampling was performed near the north-facing window. The Verone I floor has a floor area of 201.04 m
2, a height of 8.17 m and a volume of 1642.50 m
3. It is equipped with an HVAC system for control all year of temperature and relative humidity, managed by a remote monitoring and control system. The primary ventilation air comes from the AHU, using supply fans with variable flow (nominal air flow rate of 1400 m
3/h), and enters the room through floor inductors. There is no recirculated air.
Room 71 (
Figure 3b) has non-external walls. Inside the room, the “Scudo con testa di Medusa” of Michelangelo Merisi from Caravaggio is displayed, an oil painting on canvas (1597). Samplings were carried out near the painting. The room has a floor area of 69.28 m
2, a height of 8.02 m and a volume of 555.62 m
3. It is equipped with an HVAC system for the control all year of temperature and relative humidity, managed by a remote monitoring and control system. The AHU, housed in an attic room, allows for centralized air treatment in summer mode, while, in winter mode, there is also the possibility of post-heating by means of zone batteries; the outdoor air intake is on the roof and there are variable flow fans (nominal air flow rate of 9000 m
3/h). Air inlet and outlet takes place through floor grids with adjustable nozzles.
Room 160 (
Figure 3c) has a north-west oriented windowless external wall and a skylight. It houses the collection donated by Contini-Bonacossi, with paintings and marble statues. Samplings were carried out near the precious paintings. The room has a floor area of 89.10 m
2, a height of 3.17 m and a volume of 282.45 m
3. It is equipped with an HVAC system for the control all year of temperature and relative humidity, managed by a remote monitoring and control system. The AHU, housed in a technical room located inside a storage area of the museum, allows centralized air treatment with recirculation in summer mode, while, in winter mode, there is also the possibility of post-heating by means of zone batteries; the outdoor air intake is on the roof and there are supply and return fans with variable flow (nominal air flow rate of 8000 m
3/h). The air inlets grids are positioned at the top under the skylight and the air outlet grids are located at the bottom of the wall. In this room only, there is a system for continuous monitoring of CO
2 and VOCs owned by the museum.
The other six rooms analyzed are located on the second floor of the building (
Figure 4). The entrance (
Figure 4a) of the Uffizi Gallery overlooks a large corridor. It faces west with large windows and mainly hosts marble statues and paintings on canvas. Sampling was performed near the visitor control area. The entrance has a floor area of 317.14 m
2, a height of 5.68 m and a volume of 1801.35 m
3. The space is equipped with nine fan coils placed in the internal wall of the corridor without air exchange. The recirculated indoor air is heated/cooled by the fan coil exchanger and then sent through a duct to the floor air inlets placed on the opposite side of the corridor. Inspection of the equipment is difficult.
The Verone II floor (
Figure 4b) is a corridor connected to the entrance of the Gallery. It is north-, south- and west-oriented, with large windows, and mainly hosts marble statues and paintings on canvas. Sampling was performed near the west-facing window, an area without an air conditioning system. It has a floor area of 214.99 m
2, a height of 5.68 m and a volume of 1221.14 m
3.
Room 2 (
Figure 4c) has no external walls. Inside the room, the very famous “Maestà di Ognissanti” by Giotto (about 1310), a tempera and gold painting on wood, is displayed. Samplings were carried out near the painting. The room has a floor area of 198.27 m
2, a height of 9.85 m and a volume of 1952.96 m
3. It is equipped with an HVAC system for the control all year of temperature and relative humidity, managed by a remote monitoring and control system. The AHU, housed in an attic room, allows all year centralized air treatment with recirculation and is equipped with supply and return fans with variable flow (nominal air flow rate of 8000 m
3/h). The air inlet grids are positioned at the top of the roof, while the air outlet grids are located at the bottom of the opposite wall.
Room 10 (
Figure 4d) has only an east-oriented windowless external wall. Inside the room there is the well-known “Primavera” by Sandro Botticelli, a tempera painting on wood (1478–1482). Samplings were carried out near the painting. The room has a floor area of 146.34 m
2, a height of 8.93 m and a volume of 1306.82 m
3. It is equipped with an HVAC system for the control all year of temperature and relative humidity, managed by a remote monitoring and control system. The AHU, housed in an attic room, allows the centralized air treatment with air recirculation all year, and is equipped with supply and return fans with variable flow (nominal air flow of 8000 m
3/h). The air inlet and outlet takes place through linear grids placed under the top skylight.
Room 35 (
Figure 4e) has one west-oriented windowless external wall. Inside the room there is the “Adorazione dei Magi” of Leonardo da Vinci, a tempera and oil painting (1481–1482). Samplings were carried out near the painting. It has a floor area of 146.80 m
2, a height of 6.61 m and a volume of 970.35 m
3. It is equipped with an HVAC system for the control all year of temperature and relative humidity, managed by a remote monitoring and control system. The AHU, housed in an attic room, allows centralized air treatment with air recirculation all year and is equipped with supply and return fans without variable flow (nominal air flow of 9500 m
3/h). The air inlet takes place through linear grids placed on the top of the ceiling while the air outlet occurs through floor grids.
Room 41 (
Figure 4f) has one west-oriented windowless external wall. Inside the room there is the Sacra Famiglia, called “Tondo Doni”, of Michelangelo Buonarroti, a tempera painting on wood (1503–1504). The room samplings were carried out near the painting. The room has a floor area of 140.91 m
2, a height of 6.61 m and a volume of 931.41 m
3. It is equipped with an HVAC system for the control all year of temperature and relative humidity, managed by a remote monitoring and control system. The AHU allows centralized air treatment with air recirculation all year, and is equipped with supply and return funs without variable flow (nominal air flow of 10000 m
3/h). The air inlet takes place through linear grids placed on the top of the ceiling, near the skylight, while the air outlet occurs through floor grids. The AHU is located in a very narrow attic room, which is particularly difficult to access for maintenance purposes.
Measurement of the parameters mentioned in
Section 2.1 (temperature, RH, CO
2, VOCs, TBL and molds) were taken in sequence in each analyzed room, at the time of the greatest number of visitors, according to the schedule shown in
Table 7. To evaluate the influence of occupants on pollutant concentrations, in Room 10, all the measurements were carried out during both a closed and an open day. Furthermore, in Room 35 and Room 41, the Uffizi Gallery Directorate also requested the measurement of temperature, relative humidity and carbon dioxide on a closed day of the museum.
To quantify the presence of visitors during monitoring days, the number of tickets sold was taken into account. On 5 June, 7435 visitors were counted, while on 6 June 7297 visitors were recorded.
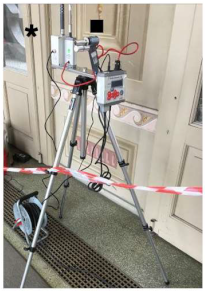
Figure 5 shows the equipment for IAQ monitoring positioned in a representative room of the case study (Room 160).
3. Results
The results of the monitoring carried out within the selected rooms of the Uffizi Gallery are reported according to the type of analyzed parameter (i.e., air temperature and relative humidity, carbon dioxide concentration, total volatile organic compounds and biological pollutants).
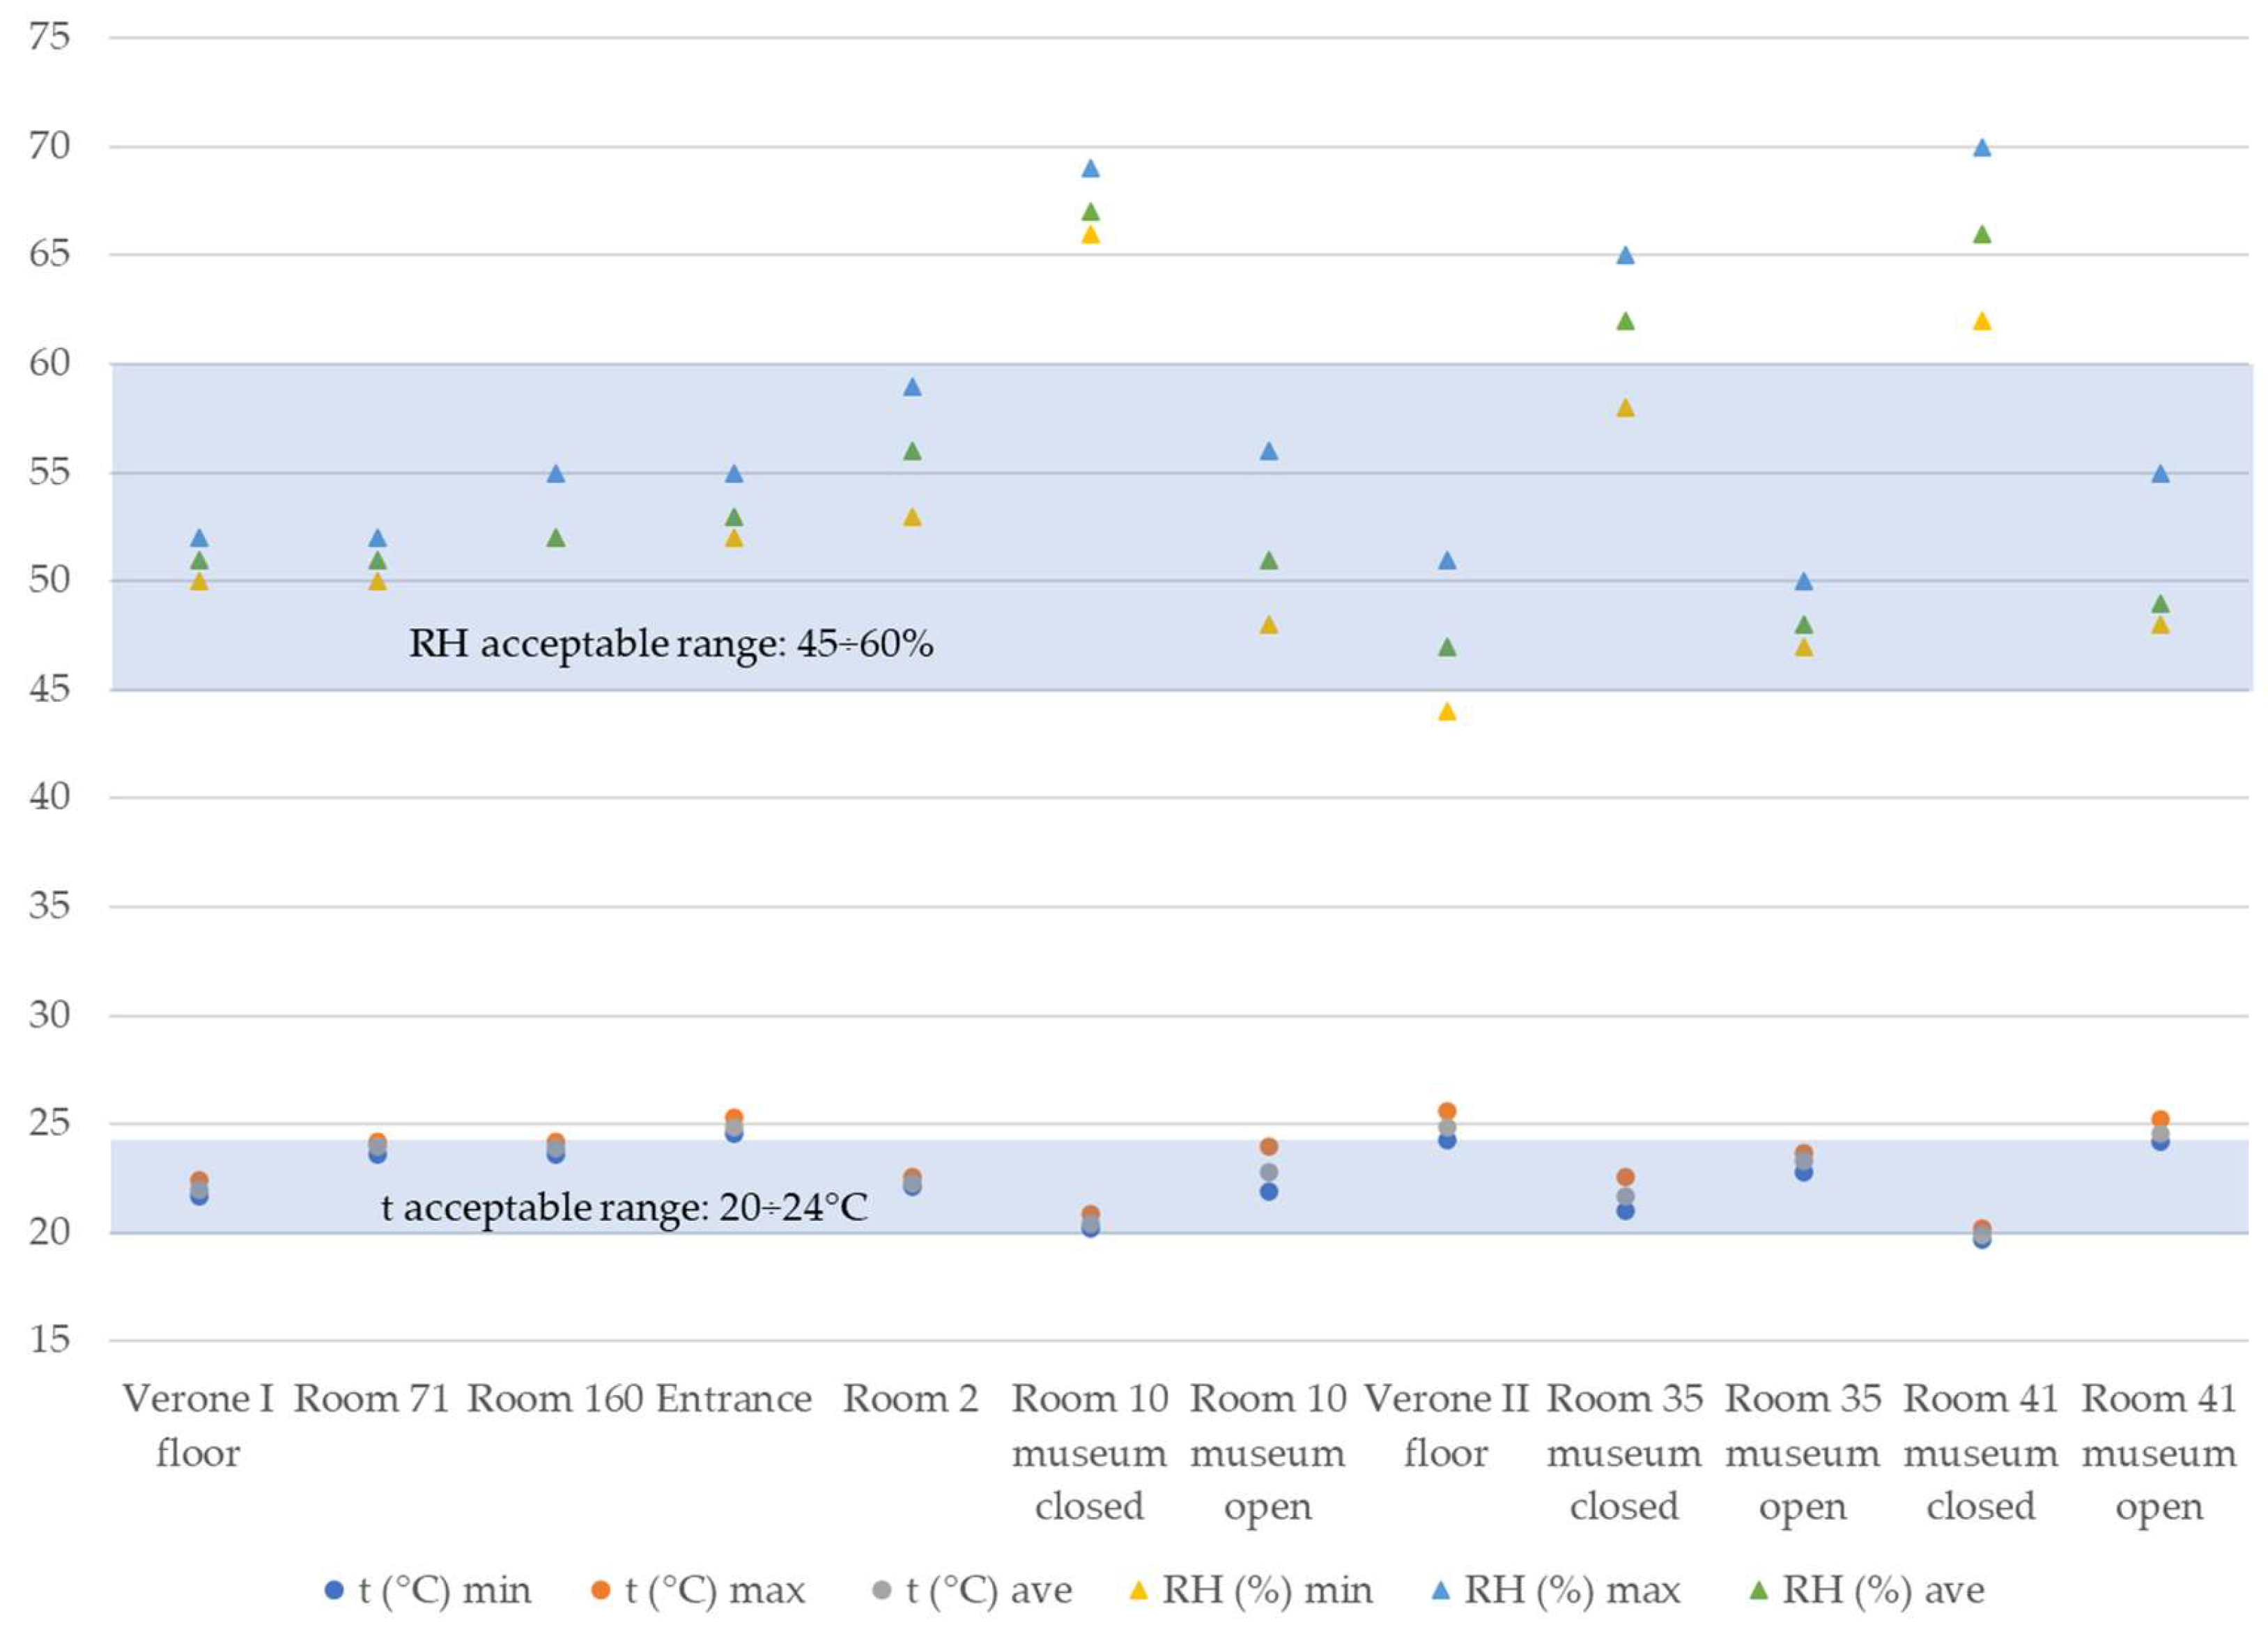
Figure 6 shows, for each analyzed room and monitoring period, the minimum, average, and maximum measured values for air temperature (t) and relative humidity (RH). The values were compared with narrow ranges considered acceptable for both artwork conservation (paintings—19 ÷ 24 °C for temperature and 45 ÷ 65% for relative humidity [
30]) and for the comfort of people (20 ÷ 26 °C for temperature and 40 ÷ 60% for relative humidity [
20,
21]), i.e., 20 ÷ 24 °C for temperature and 45 ÷ 60% for relative humidity.
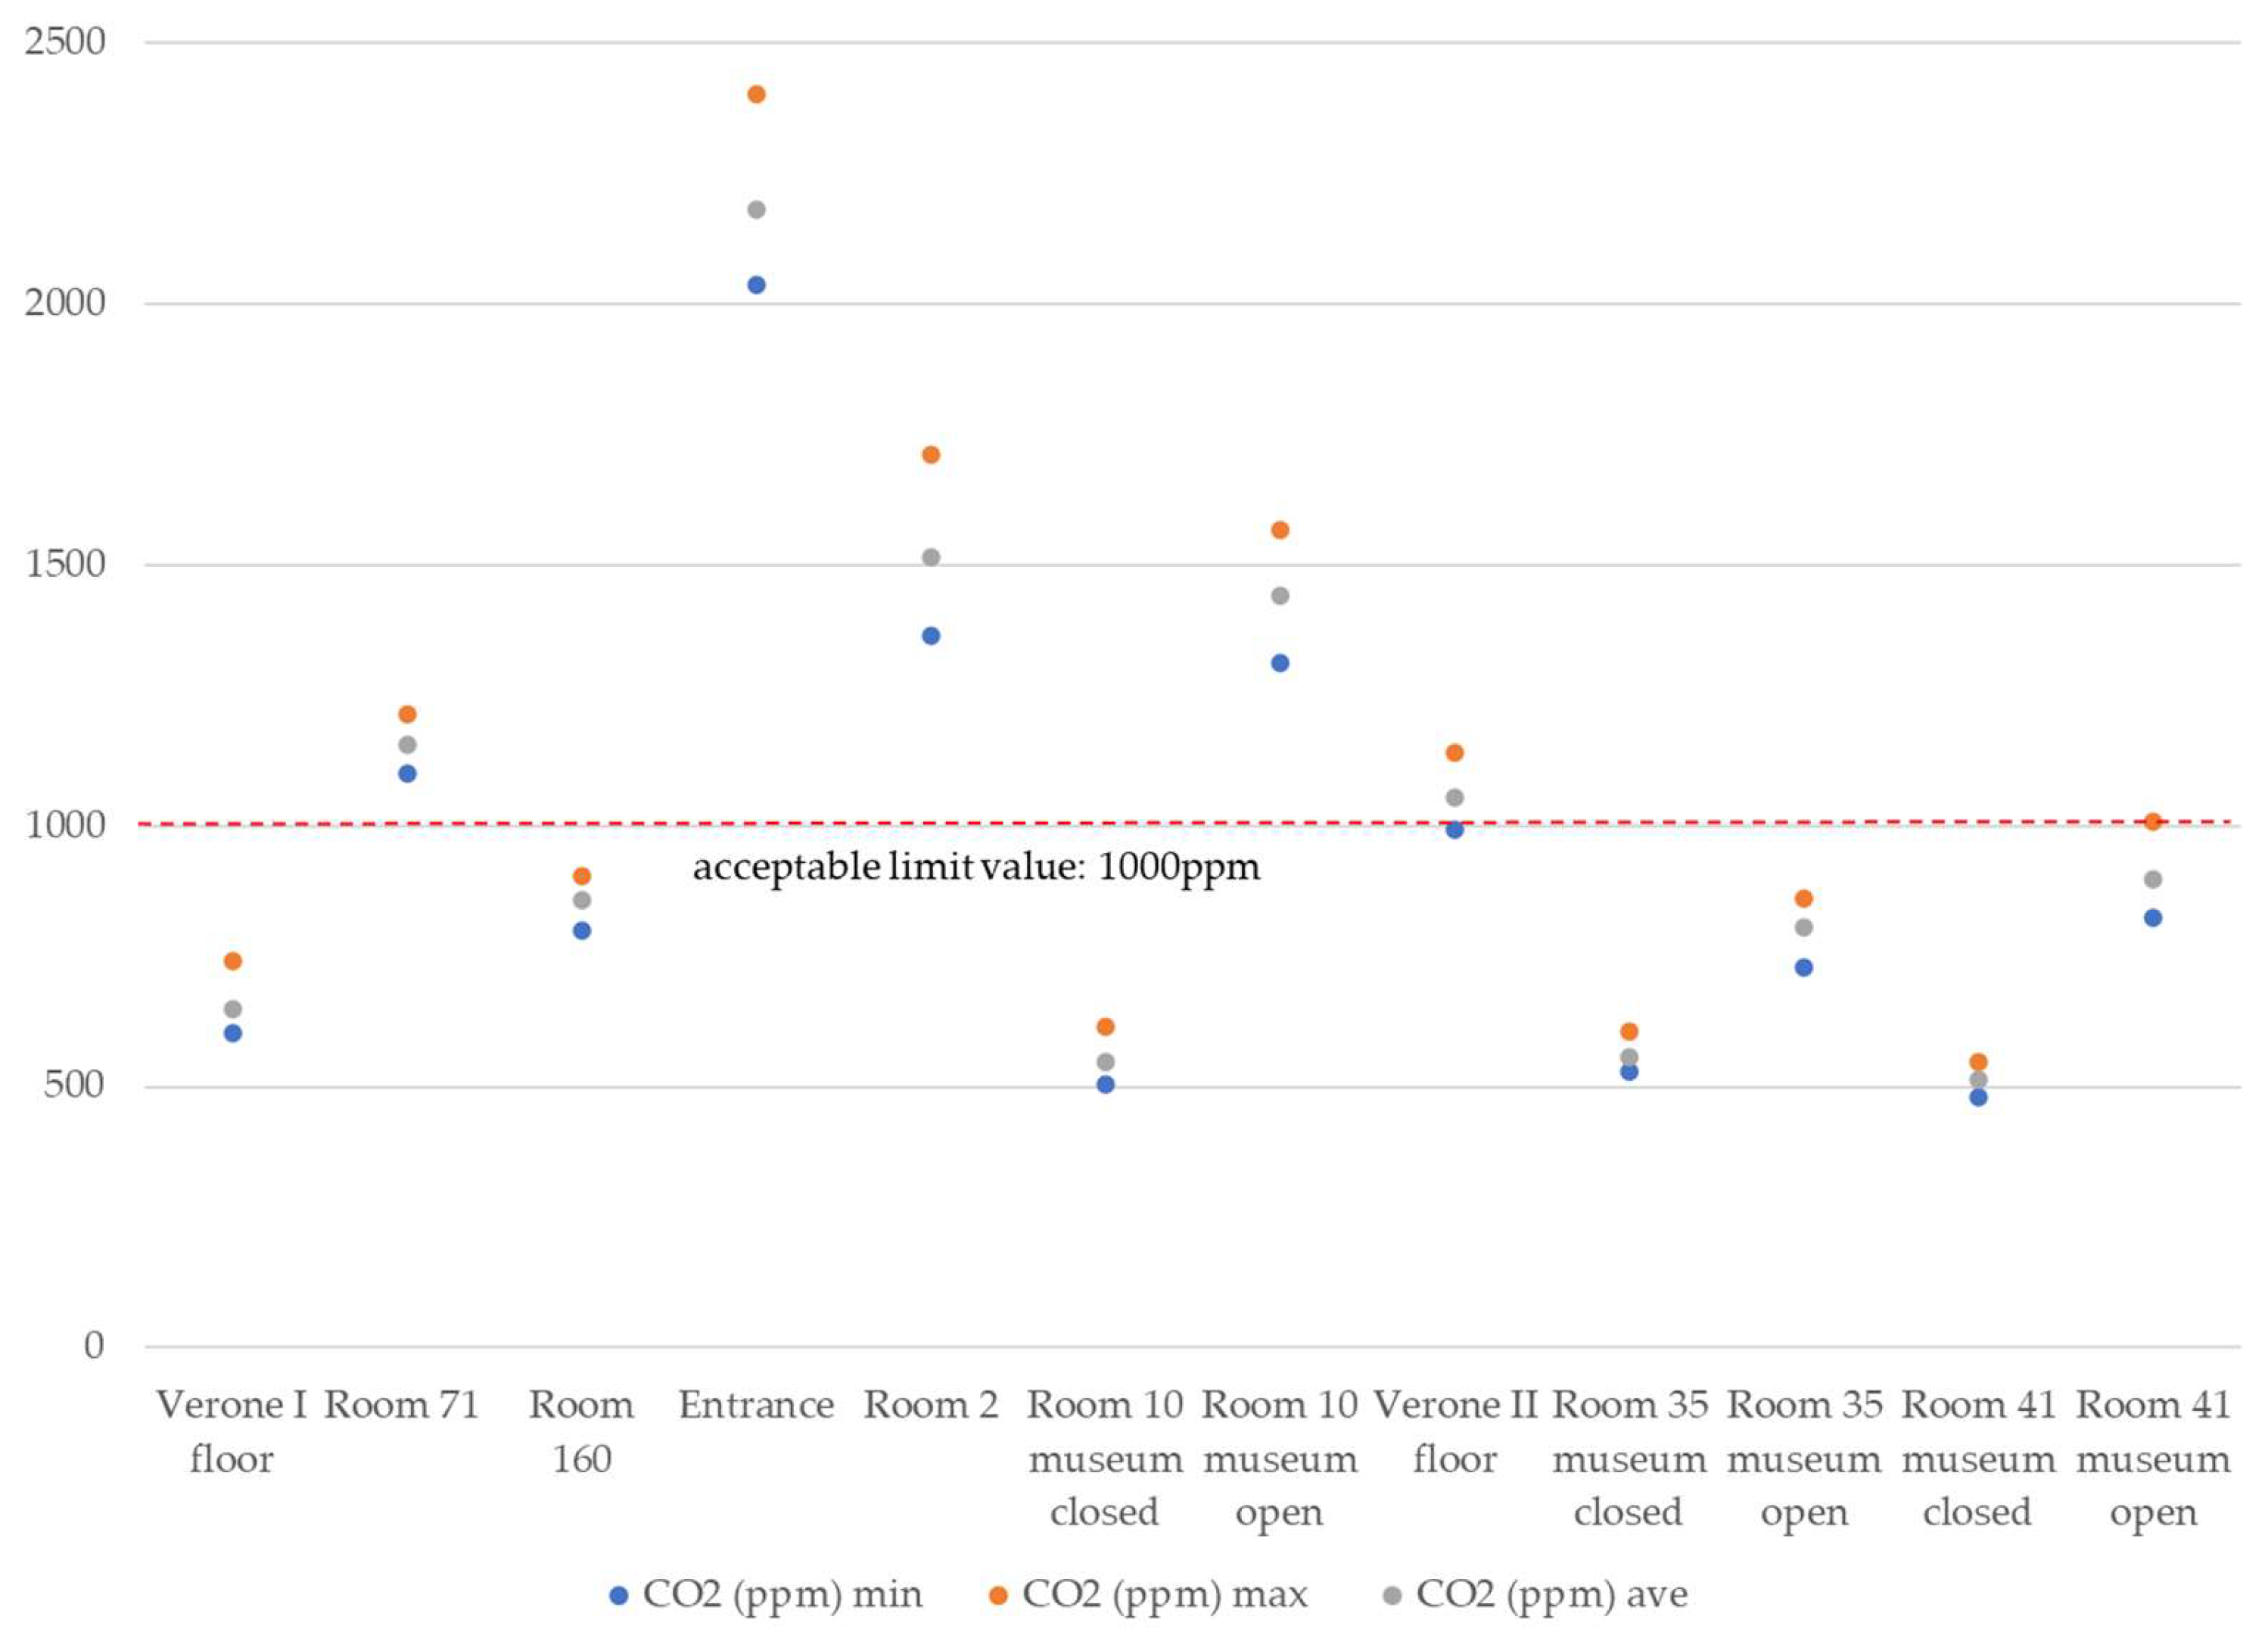
Figure 7 shows, for each analyzed room and monitoring period, the minimum, average and maximum measured values for carbon dioxide concentration, which were compared with value ranges considered acceptable for people, i.e., 1000 ppm [
12].
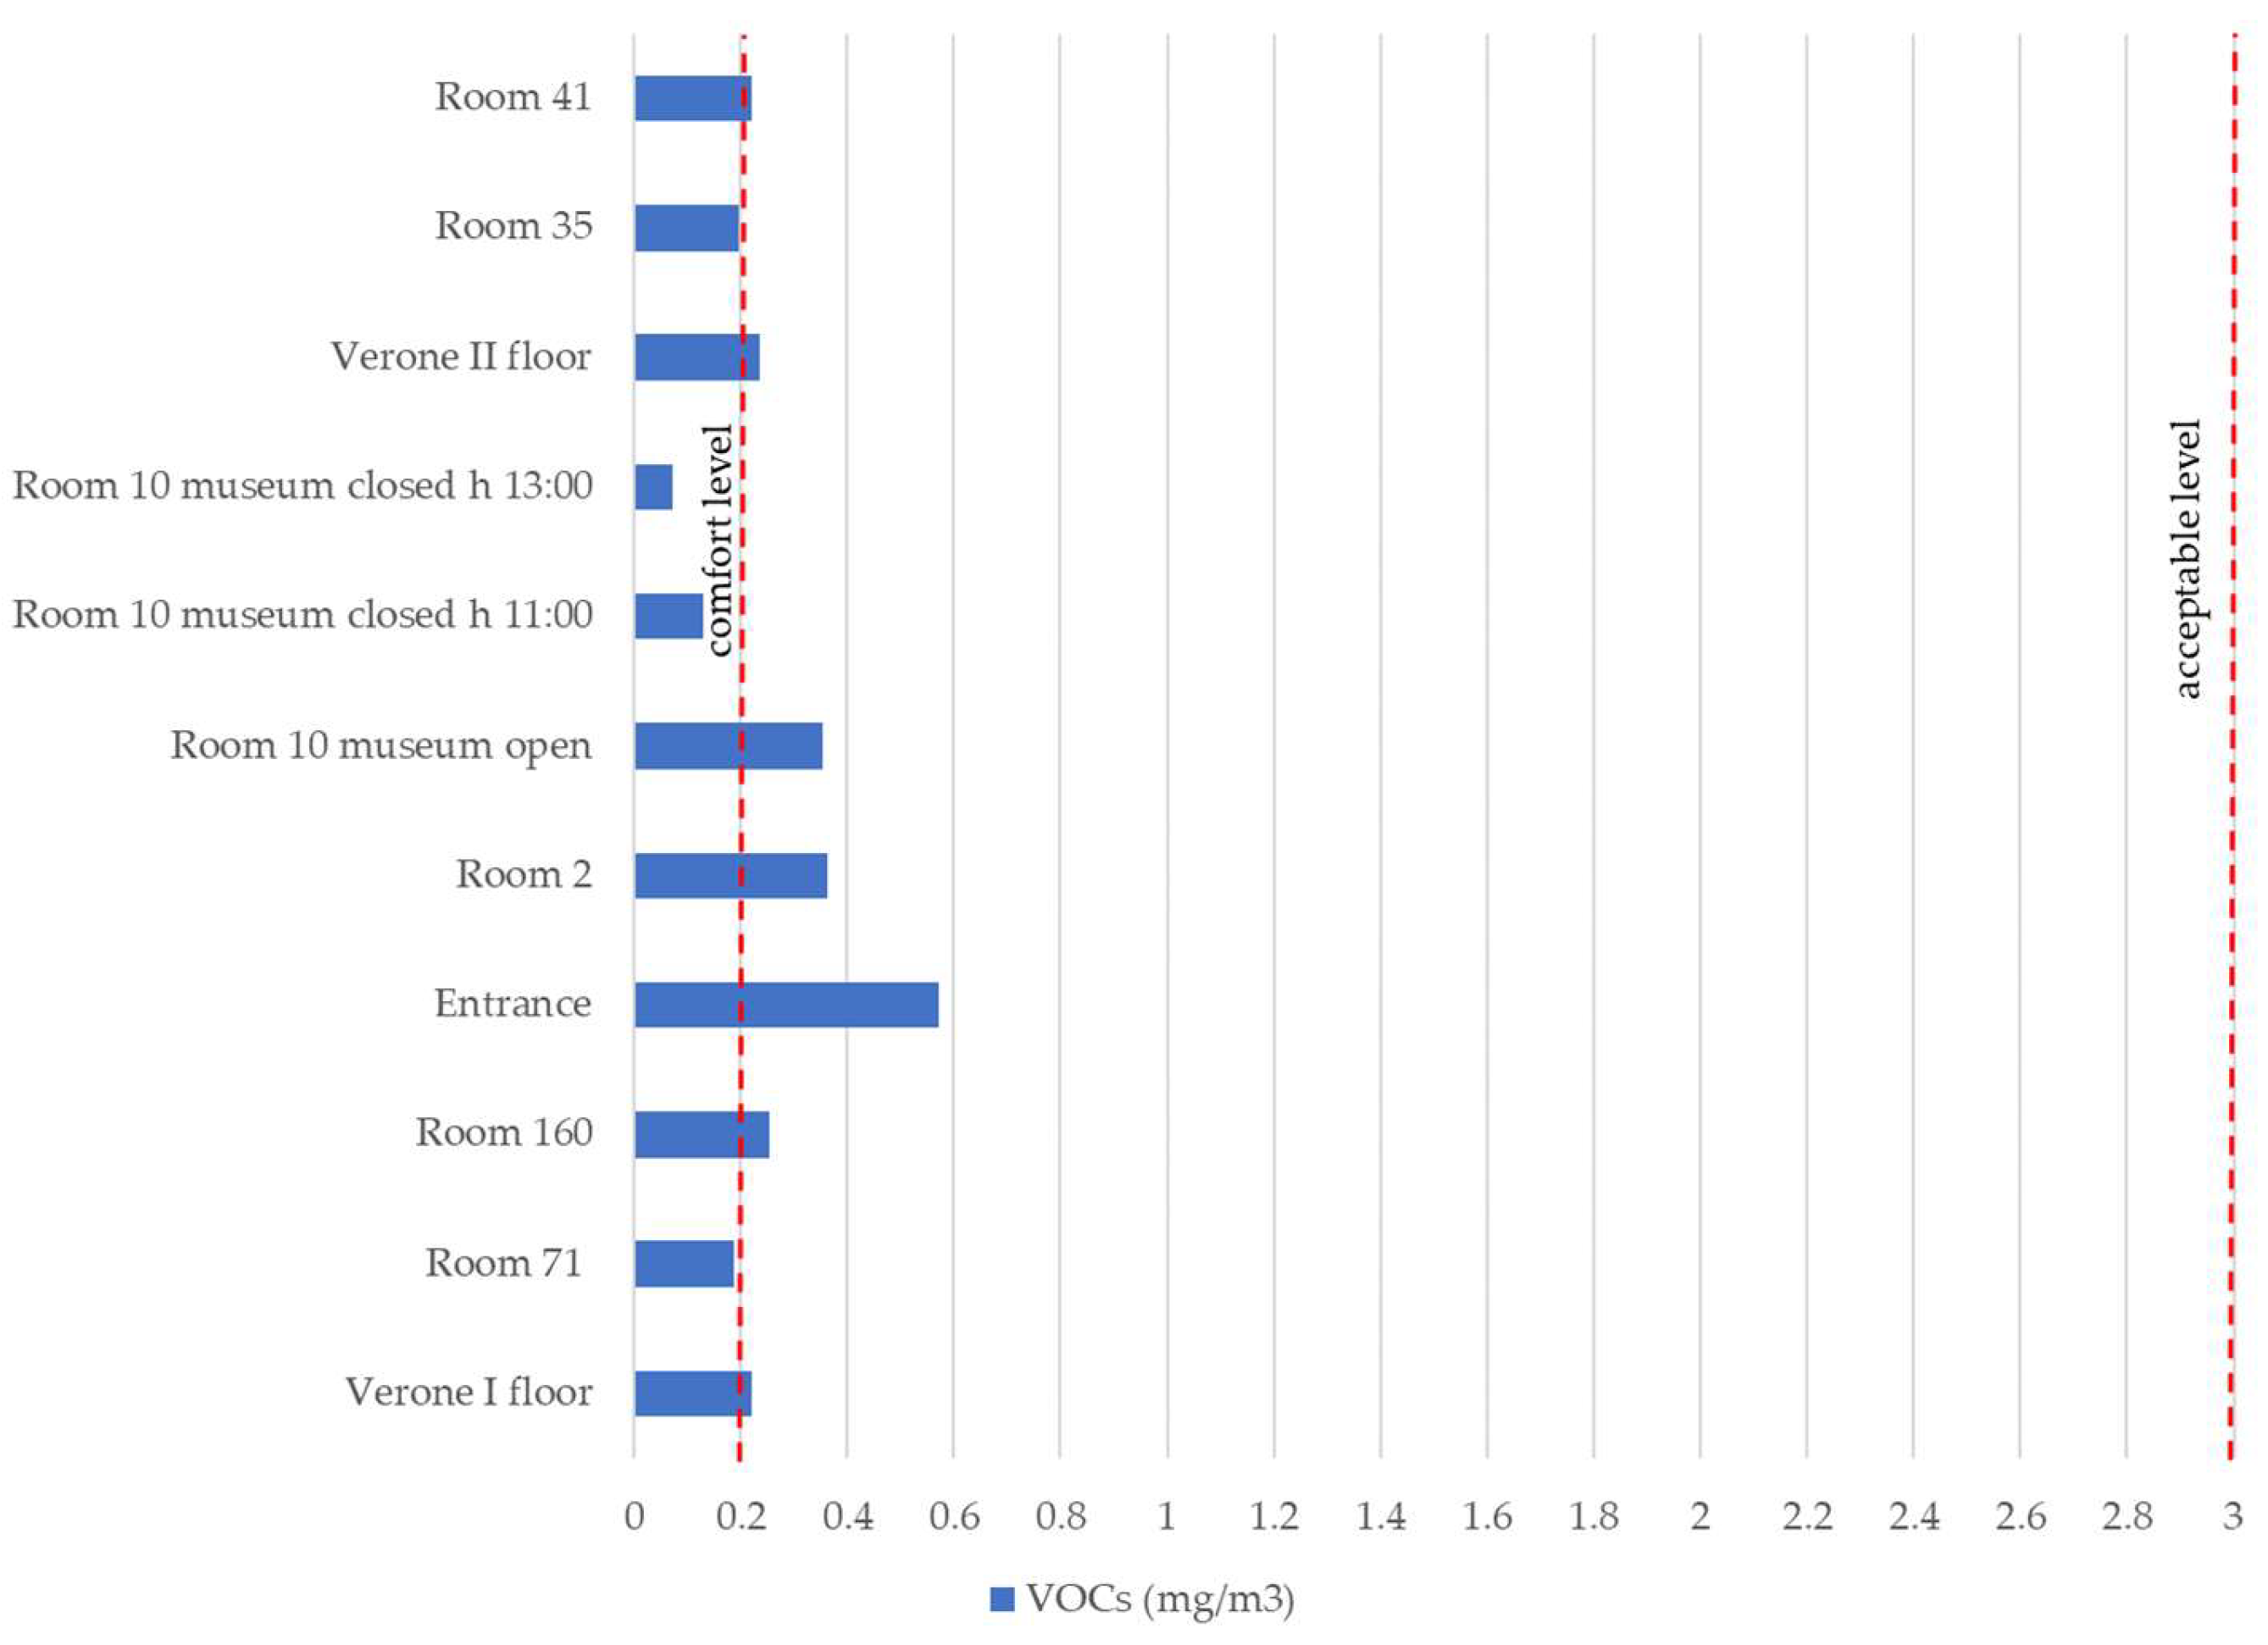
In
Figure 8, for each analyzed room, the measured values for VOCs concentration are reported and compared with comfort (<0.200 mg/m
3) and acceptable (0.200 ÷ 3 mg/m
3) values for these pollutants [
10,
12]. For Room 10, one of the most visited areas, samples were also taken on a closed day of the museum (3 June 2019), during which there was only one guided tour by a small group of visitors at 11:00, while the measurement of 13:00 refers to the museum totally without visitors.
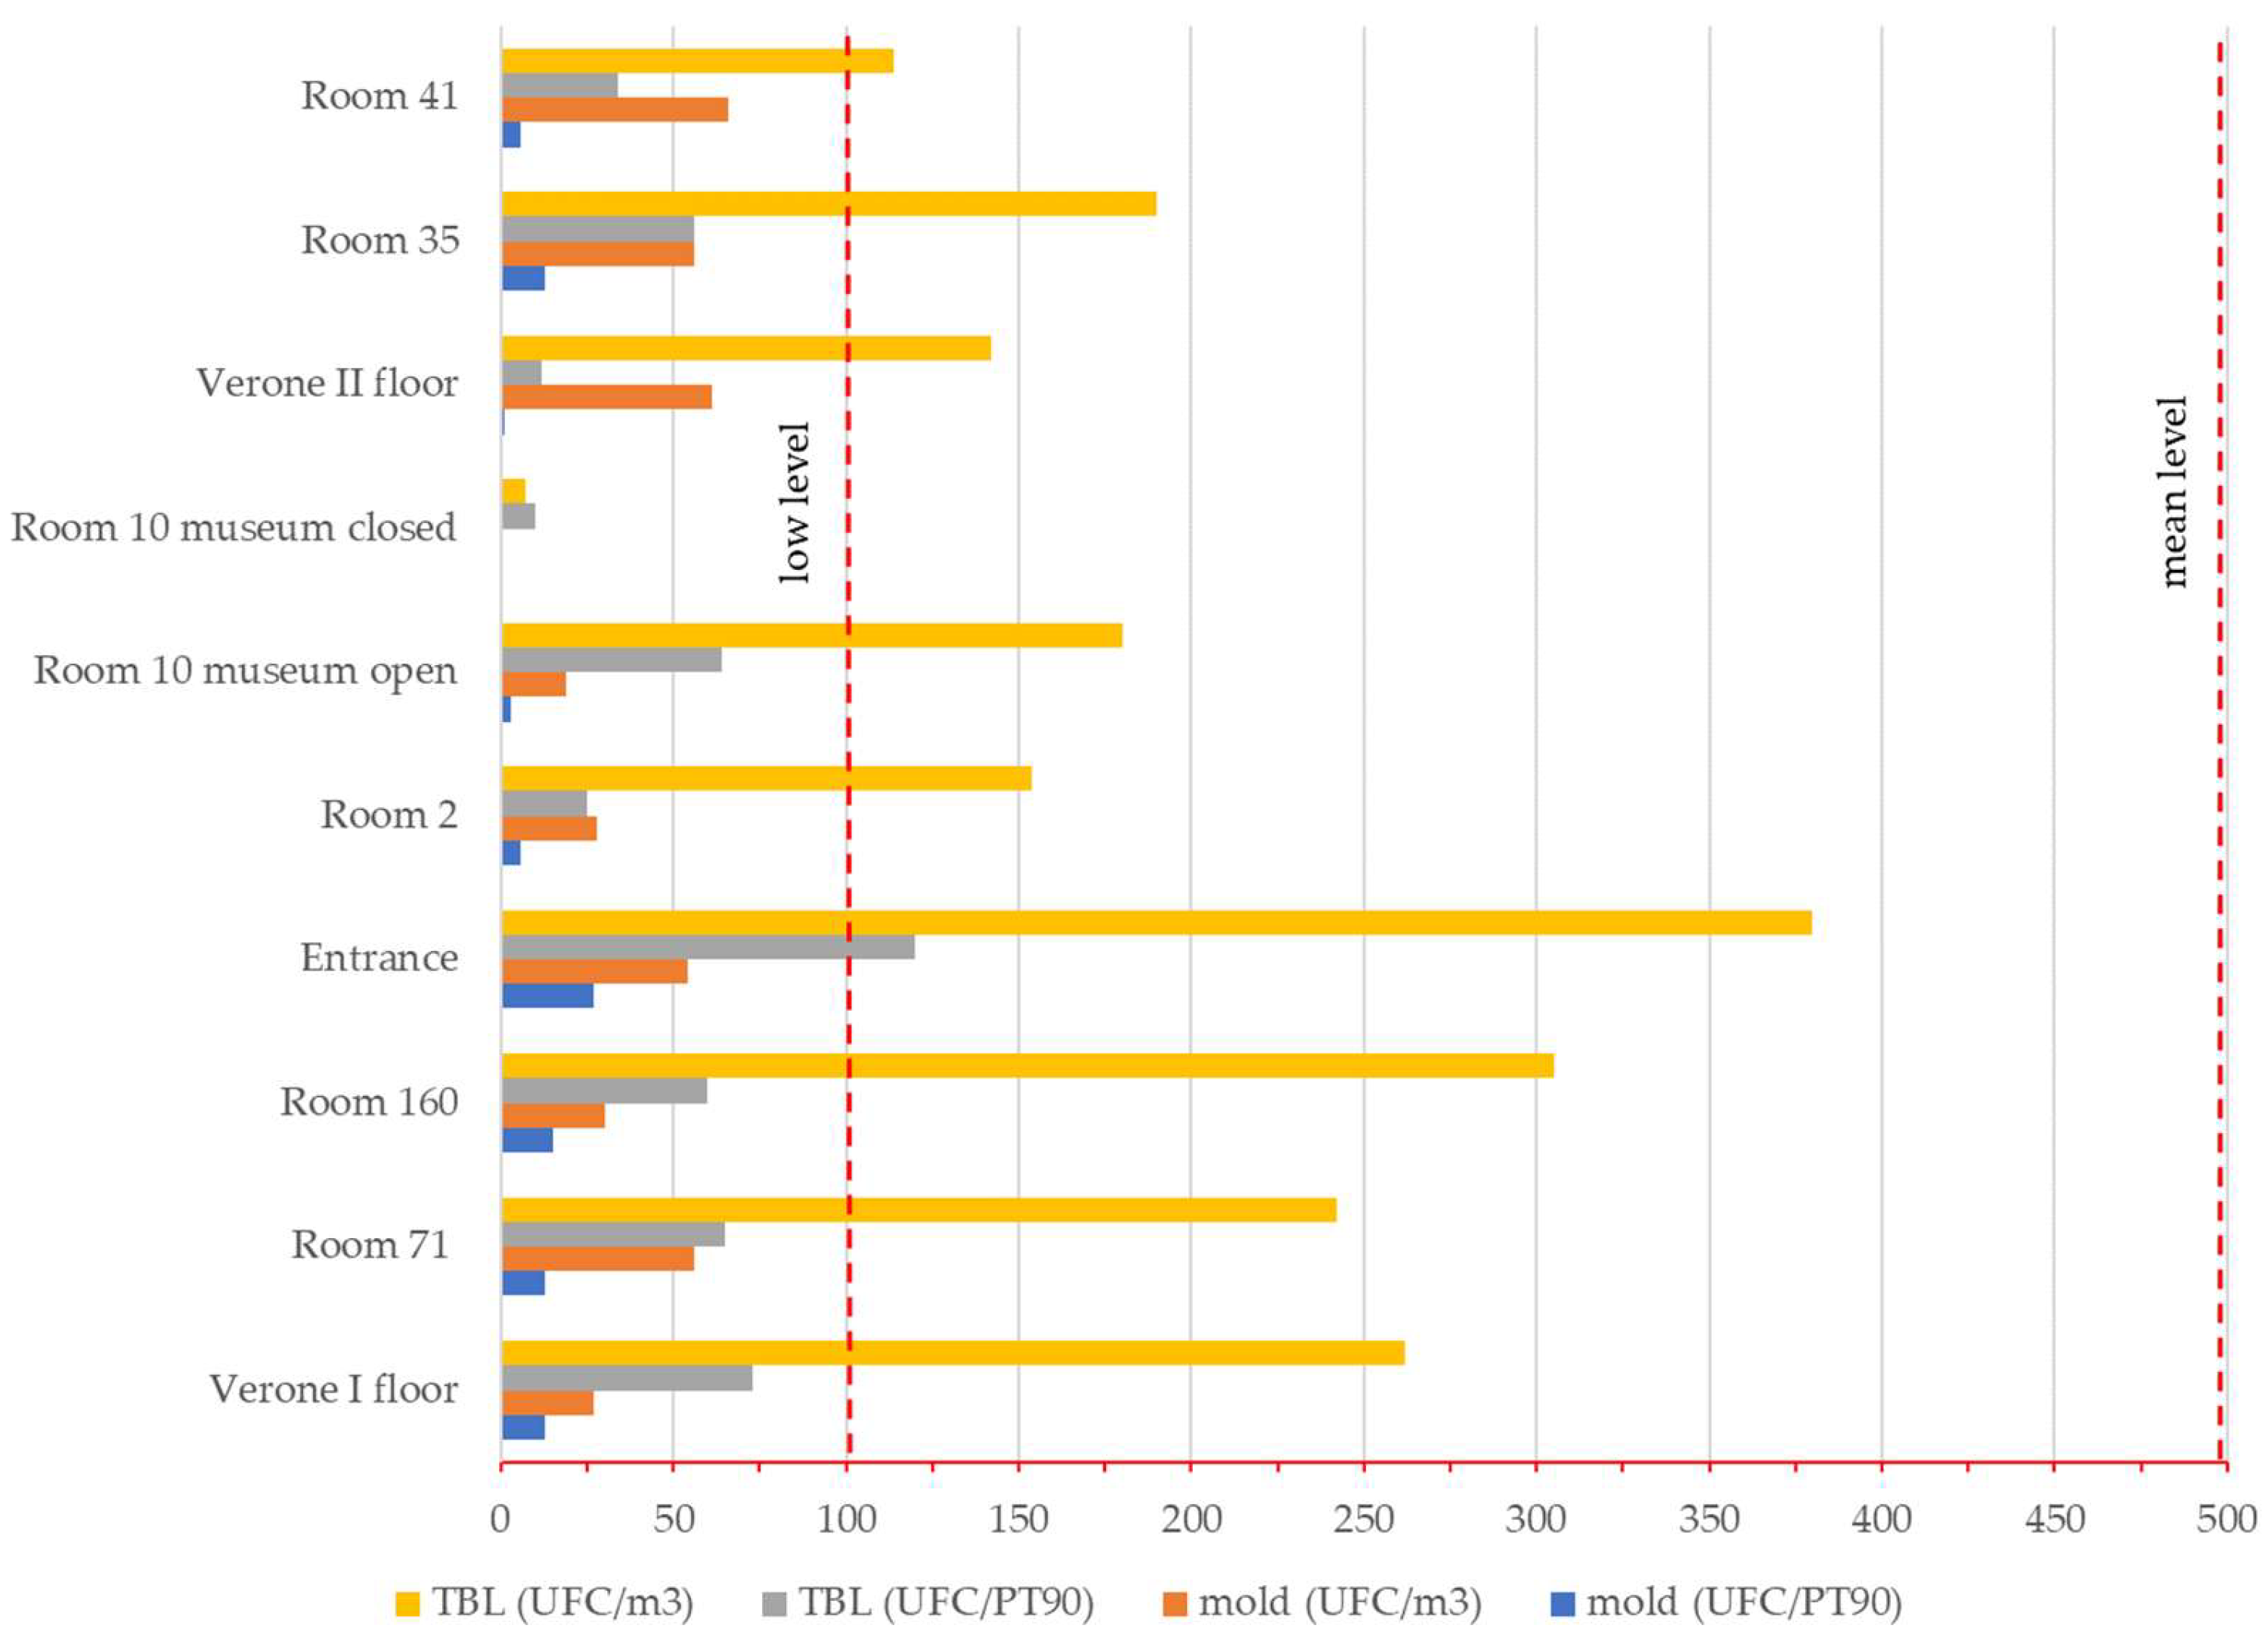
Figure 9 reports, for each analyzed room, the results of the sampling carried out for biological pollutants compared with reference values reported in
Table 4. The results expressed in CFU/m
3 were obtained from active sampling, while those expressed in CFU/PT90 refer to passive sampling of TBL and mold. The greater concentration detected by active sampling compared to passive is a natural consequence of the sampling technique: passive sampling does not force the capture of microorganisms and, thus, lower values are expected.
4. Discussion
The results of the monitoring highlight some issues for the assessment of microclimatic parameters and IAQ pollution.
With respect to the microclimatic parameters (
Figure 6), the measured values compared with the recommended ranges showed acceptable values for air temperature in the majority of the rooms—in some of them the values were only slightly over the limit value. For relative humidity, the values were above the limits when the museum was closed to the public in Room 10, Room 35, and Room 41. For the temperature values, the environment with the highest values (over 26 °C), which went beyond the conservation levels of the paintings and the comfort of people, was the Verone II floor, which had no HVAC systems. By comparison between data collected in the rooms with the museum closed and when open to the public, it was observed that when the museum was closed, the temperature and relative humidity values were often outside the optimal ranges. In particular, when the museum was closed, the temperature had lower values and the relative humidity higher values, even reaching 70% in Room 10 and Room 41. These data suggest that when the museum was closed, with climatic conditions that were not critical for a lack of sensible heat due to the occupants, the temperature was lower due to the absence of the public; under these conditions, the HVAC system was not able to control the relative humidity as it was not working under standard operating conditions. The fluctuations in the above-mentioned parameters must, therefore, be carefully assessed so that they do not cause damage to the artefacts of the museum.
To guarantee and maintain optimal microclimatic conditions for the correct conservation of the objects displayed, variation in the temperature and relative humidity values must be carefully monitored, in particular, where paintings on wood are exposed. The best conditions are those that address, at the same time, air conditioning requirements, energy saving needs and the architectural constraints of the museum operating in an historic ancient building.
For carbon dioxide, the rising values sampled in some museum rooms can be related to the presence of visitors and staff, to outdoor pollution and to the non-optimal positioning of the air inlet and outlet grids of the HVAC system.
As shown in
Figure 7, the threshold value was exceeded in the most crowded rooms, Room 2 and Room 10, and at the entrance of the museum, where there was always a queue. During opening hours, the average values in Room 2 reached 1516 ppm, in Room 10 1442 ppm, while in the Entrance, an environment without air exchange and with a greater concentration of public visitors, CO
2 average values of 2183 ppm were measured, with peaks of 2404 ppm. In the Verone II floor, also without mechanical ventilation, much lower CO
2 average values were recorded, equal to 1055 ppm, probably due to the lower concentration of visitors.
The comparison between the measured values of the CO2 concentration in the presence of visitors (average concentration in Room 10, Room 35, and Room 41 equal to about 1049 ppm) and when the museum was closed (average concentration in Room 10, Room 35, and Room 41 equal to about 540 ppm) made it possible to evaluate the influence of the presence of the public, which was associated with an approximate doubling of the background concentration of CO2 in rooms with mechanical ventilation.
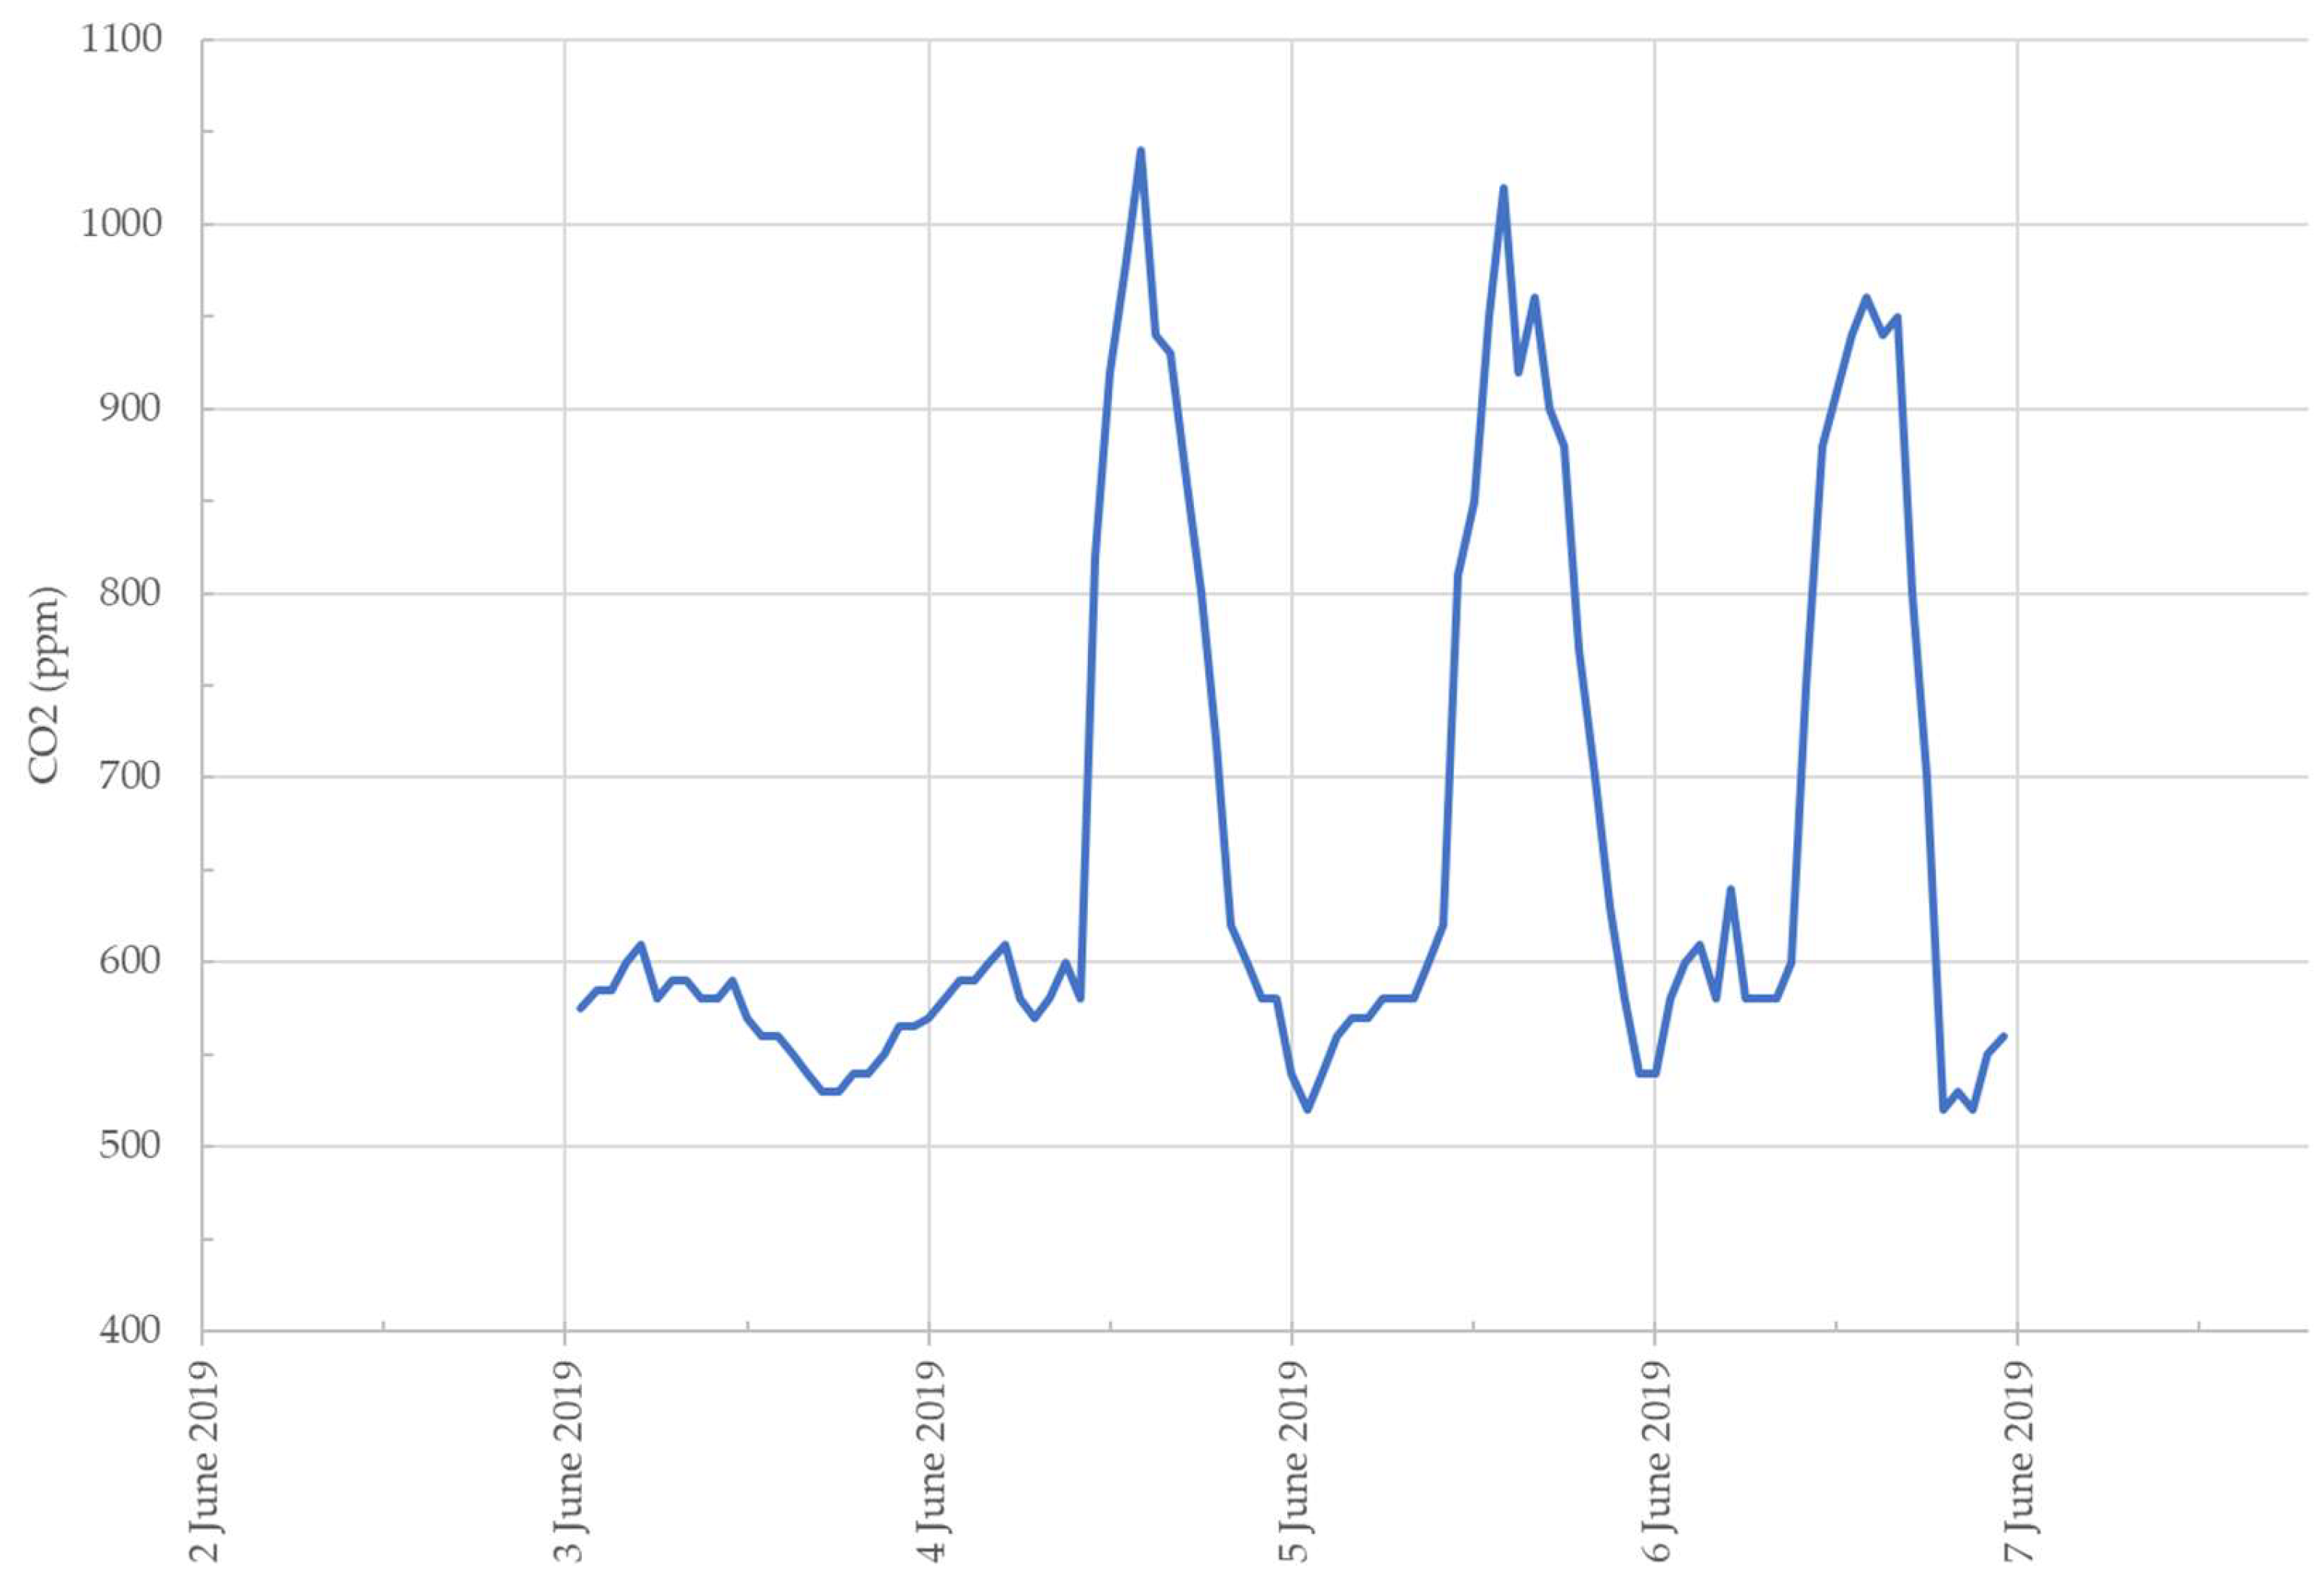
Figure 10 shows the trend in CO
2 concentration measured by the continuous monitoring system owned by the museum and present only in Room 160 from 3 to 6 June 2019; these data are in line with those monitored during the spot campaign (with a difference of about 5%). The CO
2 minimum value measured in Room 160 in this period was 530 ppm (museum closed) while the maximum value was 1040 ppm (museum open). This background concentration of CO
2 is consistent with the average Italian data measured outdoors in 2019 and equal to 410 ppm [
38], considering that there were still people present in the museum even during closing hours (staff, restorers, maintenance workers, etc.). The graph also shows that the highest concentration of CO
2 was reached between 10:30 and 16:00, indicating that these times were also those with the greatest turnout of visitors.
Regarding the VOCs concentration (
Figure 8), comparison of the values from sampling carried out in Room 10 when the museum was closed with days of high visitor turnout confirmed the hypothesis of human influence on the release of volatile organic compounds. The two VOCs values relating to the first and second sampling in Room 10 on the day of closure to the public provide significant information on the effectiveness and importance of the air exchange provided by the ventilation system: two hours between the passage of the first group of visitors (11:00) and the following group (13:00) were sufficient to reduce the VOCs concentration by 44%.
The values compared with the recommended limits reported in
Table 3 showed comfortable (Room 35, Room 41, and Room 71) or acceptable levels for the VOCs concentrations.
Furthermore, many VOCs classes (halogen-aliphatic, halogen-aromatic, halogen-unsaturated, nitrogen-aromatic, oxygen-acid, ether, oxygen-acid, phenol, sulfur-mercaptan, sulfur-sulphide) were not detected. For the VOCs classes that were detected, to evaluate the contribution and investigate the origin, the cut-off value of the compound was set at 1%. This value represents the concentration of the pollutant in the compound to be considered significantly present. The most present classes in the monitored rooms were aldehydes and alcohols, which were highlighted by the sum of the concentration values of the individual VOCs classes. As previously mentioned, these pollutants are present in furnishings, and especially in cleaning products (perfumes, deodorants, additives to cleaning products) and disinfectants, but their concentration can also be related to the presence of visitors. In particular, the values of aldehydes were higher at the second floor entrance, where all visitors pass through before being distributed to the different rooms, and where there was no mechanical ventilation. High and persistent concentrations of aldehydes can be associated with respiratory problems in sensitive subjects.
Table 8 summarizes the substances with concentrations greater than or equal to the cut-off values for each sampling point.
As the CO2 and VOCs trends were similar, strategies to improve the IAQ can be effective for the control of both CO2 and VOCs.
The analysis of the biological pollutants (
Figure 9) confirmed the data that emerged from the chemical investigation: the sampling point most vulnerable to the concentration of biological pollutants was the entrance on the second floor. Based on the reference values shown in
Table 4, the following observations can be made: the concentration of TBL in all the rooms was at a mean pollution level (less than 500 CFU/m
3), while the concentration of mold in all the rooms was at a low pollution level (less than 100 CFU/m
3). Nevertheless, these biological pollutants must be constantly monitored as indicators of indoor air quality, together with the other inorganic and organic pollutants.
The observed environmental molds were of the Aspergillus and Penicillium genera. The first species is ubiquitous and, therefore, is often monitored in different environments. Flavus and Fumigatus species (classified in [
31] as allergenic molds) were recorded, while Aspergillus niger was not identified. Penicillium genera can generate respiratory tract disorders in predisposed or immunosuppressed subjects.
Table 9 summarizes and compares the main values detected during the indoor monitoring campaign with the main characteristics of the HVAC systems present in the respective analyzed rooms. From the data, it is clear that the high concentrations of CO
2 could have been partly due to the modalities of introduction and extraction of the air in the environment that can negatively influence the air exchange. For example, Room 10 was served by a system with air inlet and outlet from the ceiling with possible short circuit. For Room 71, the air inlet and outlet were from the floor with possible similar problems, aggravated by the poor cleaning of the floor grilles. In the case of Room 2, even in the presence of air intake from above and return of air from below, the air flow rates may not have been adequate. In particular, the higher CO
2 concentrations corresponded to lower air changes.


