
Overheating Risks and Adaptation Strategies of Energy Retrofitted Historic Buildings under the Impact of Climate Change: Case Studies in Alpine Region


Abstract
:1. Introduction
2. Materials and Methods
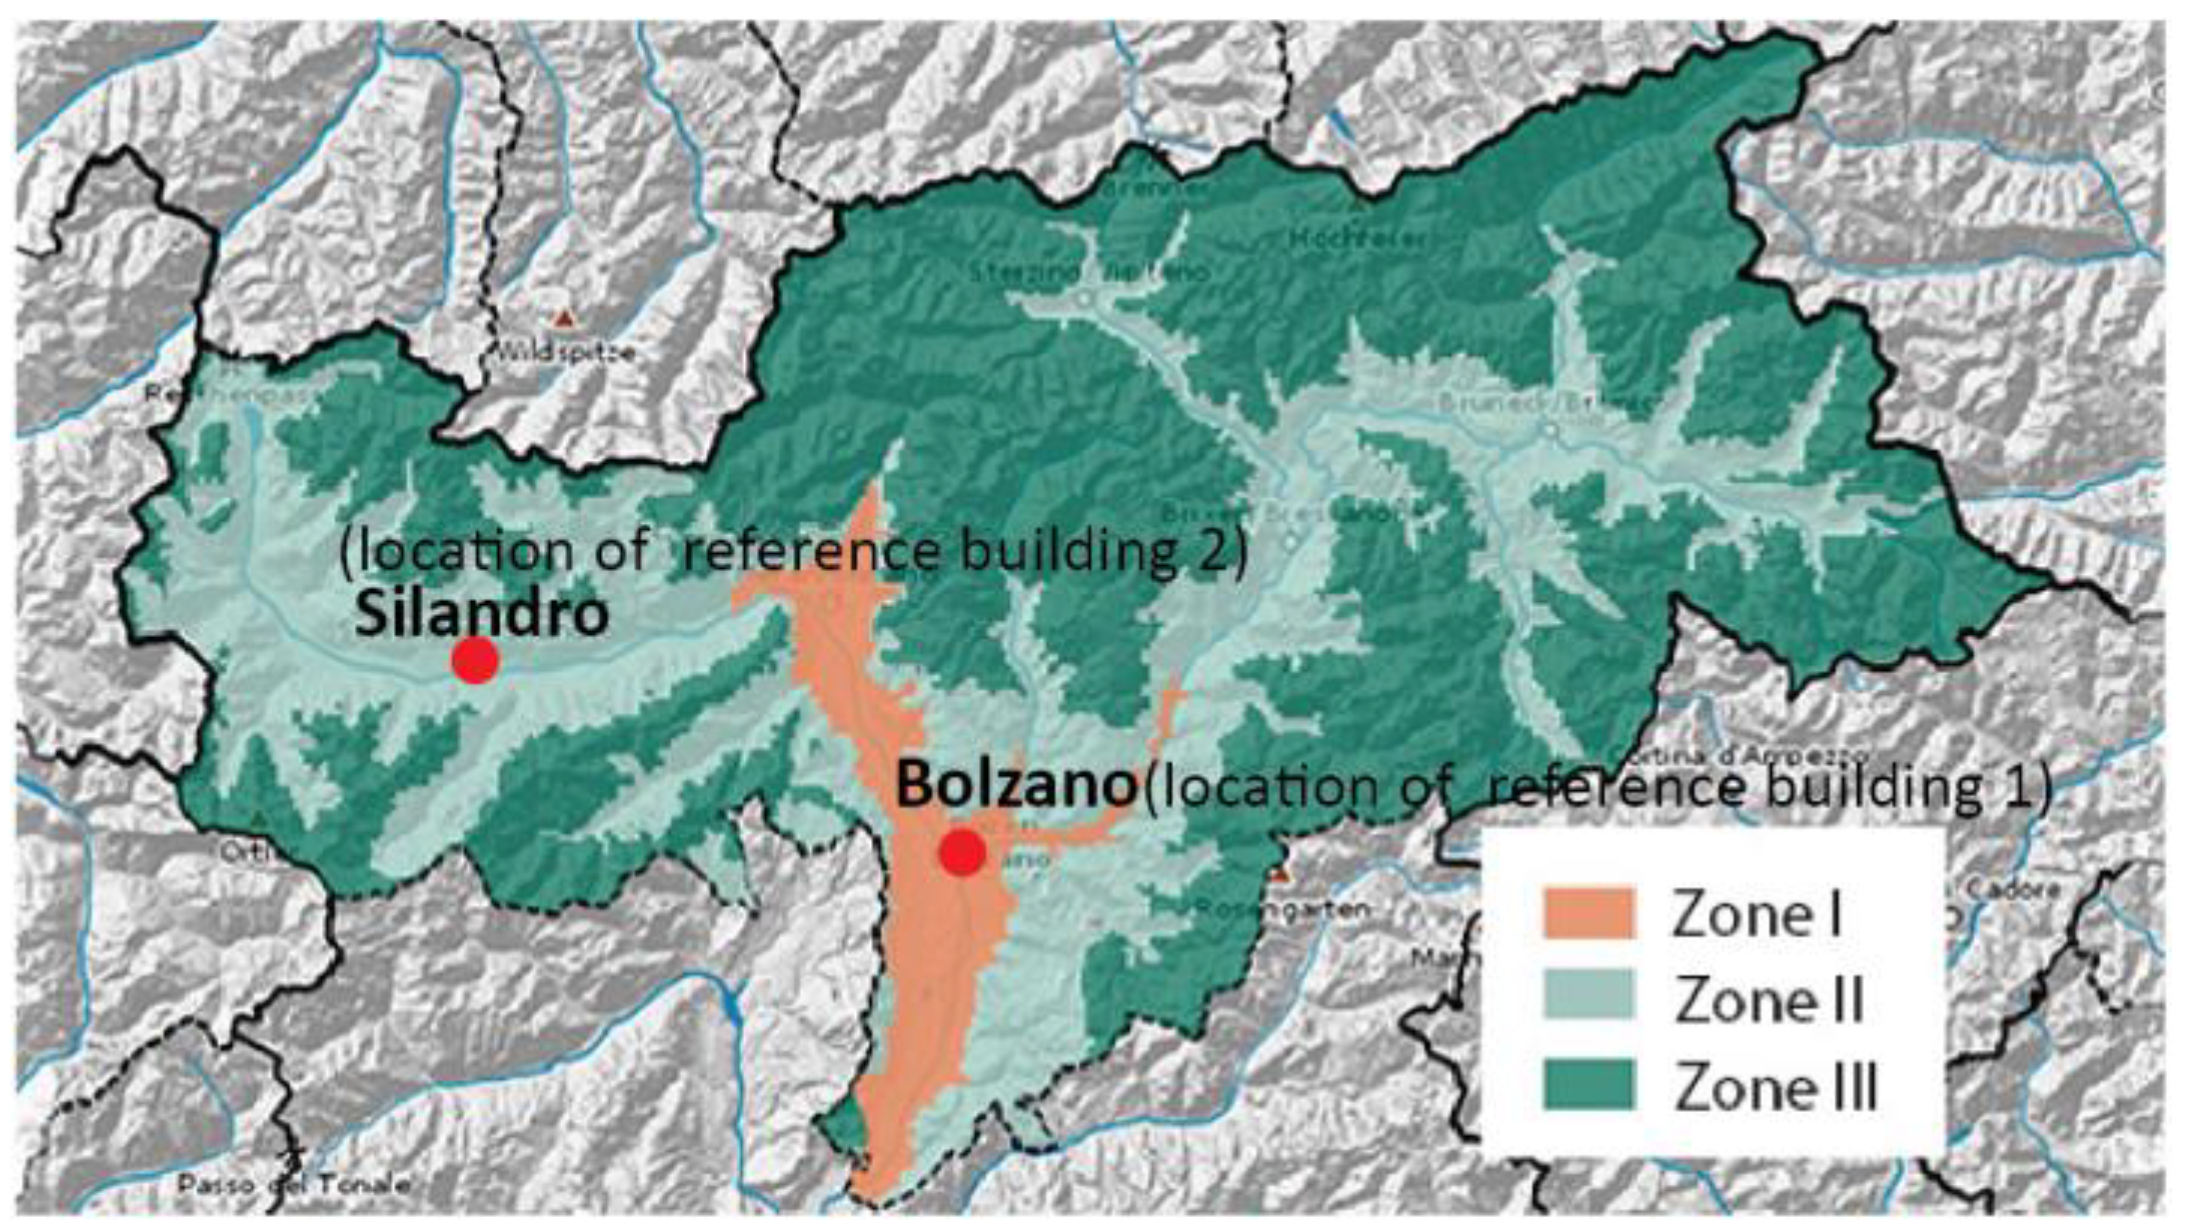
2.1. Climatic Data
2.1.1. Current Scenarios
2.1.2. Future Scenarios
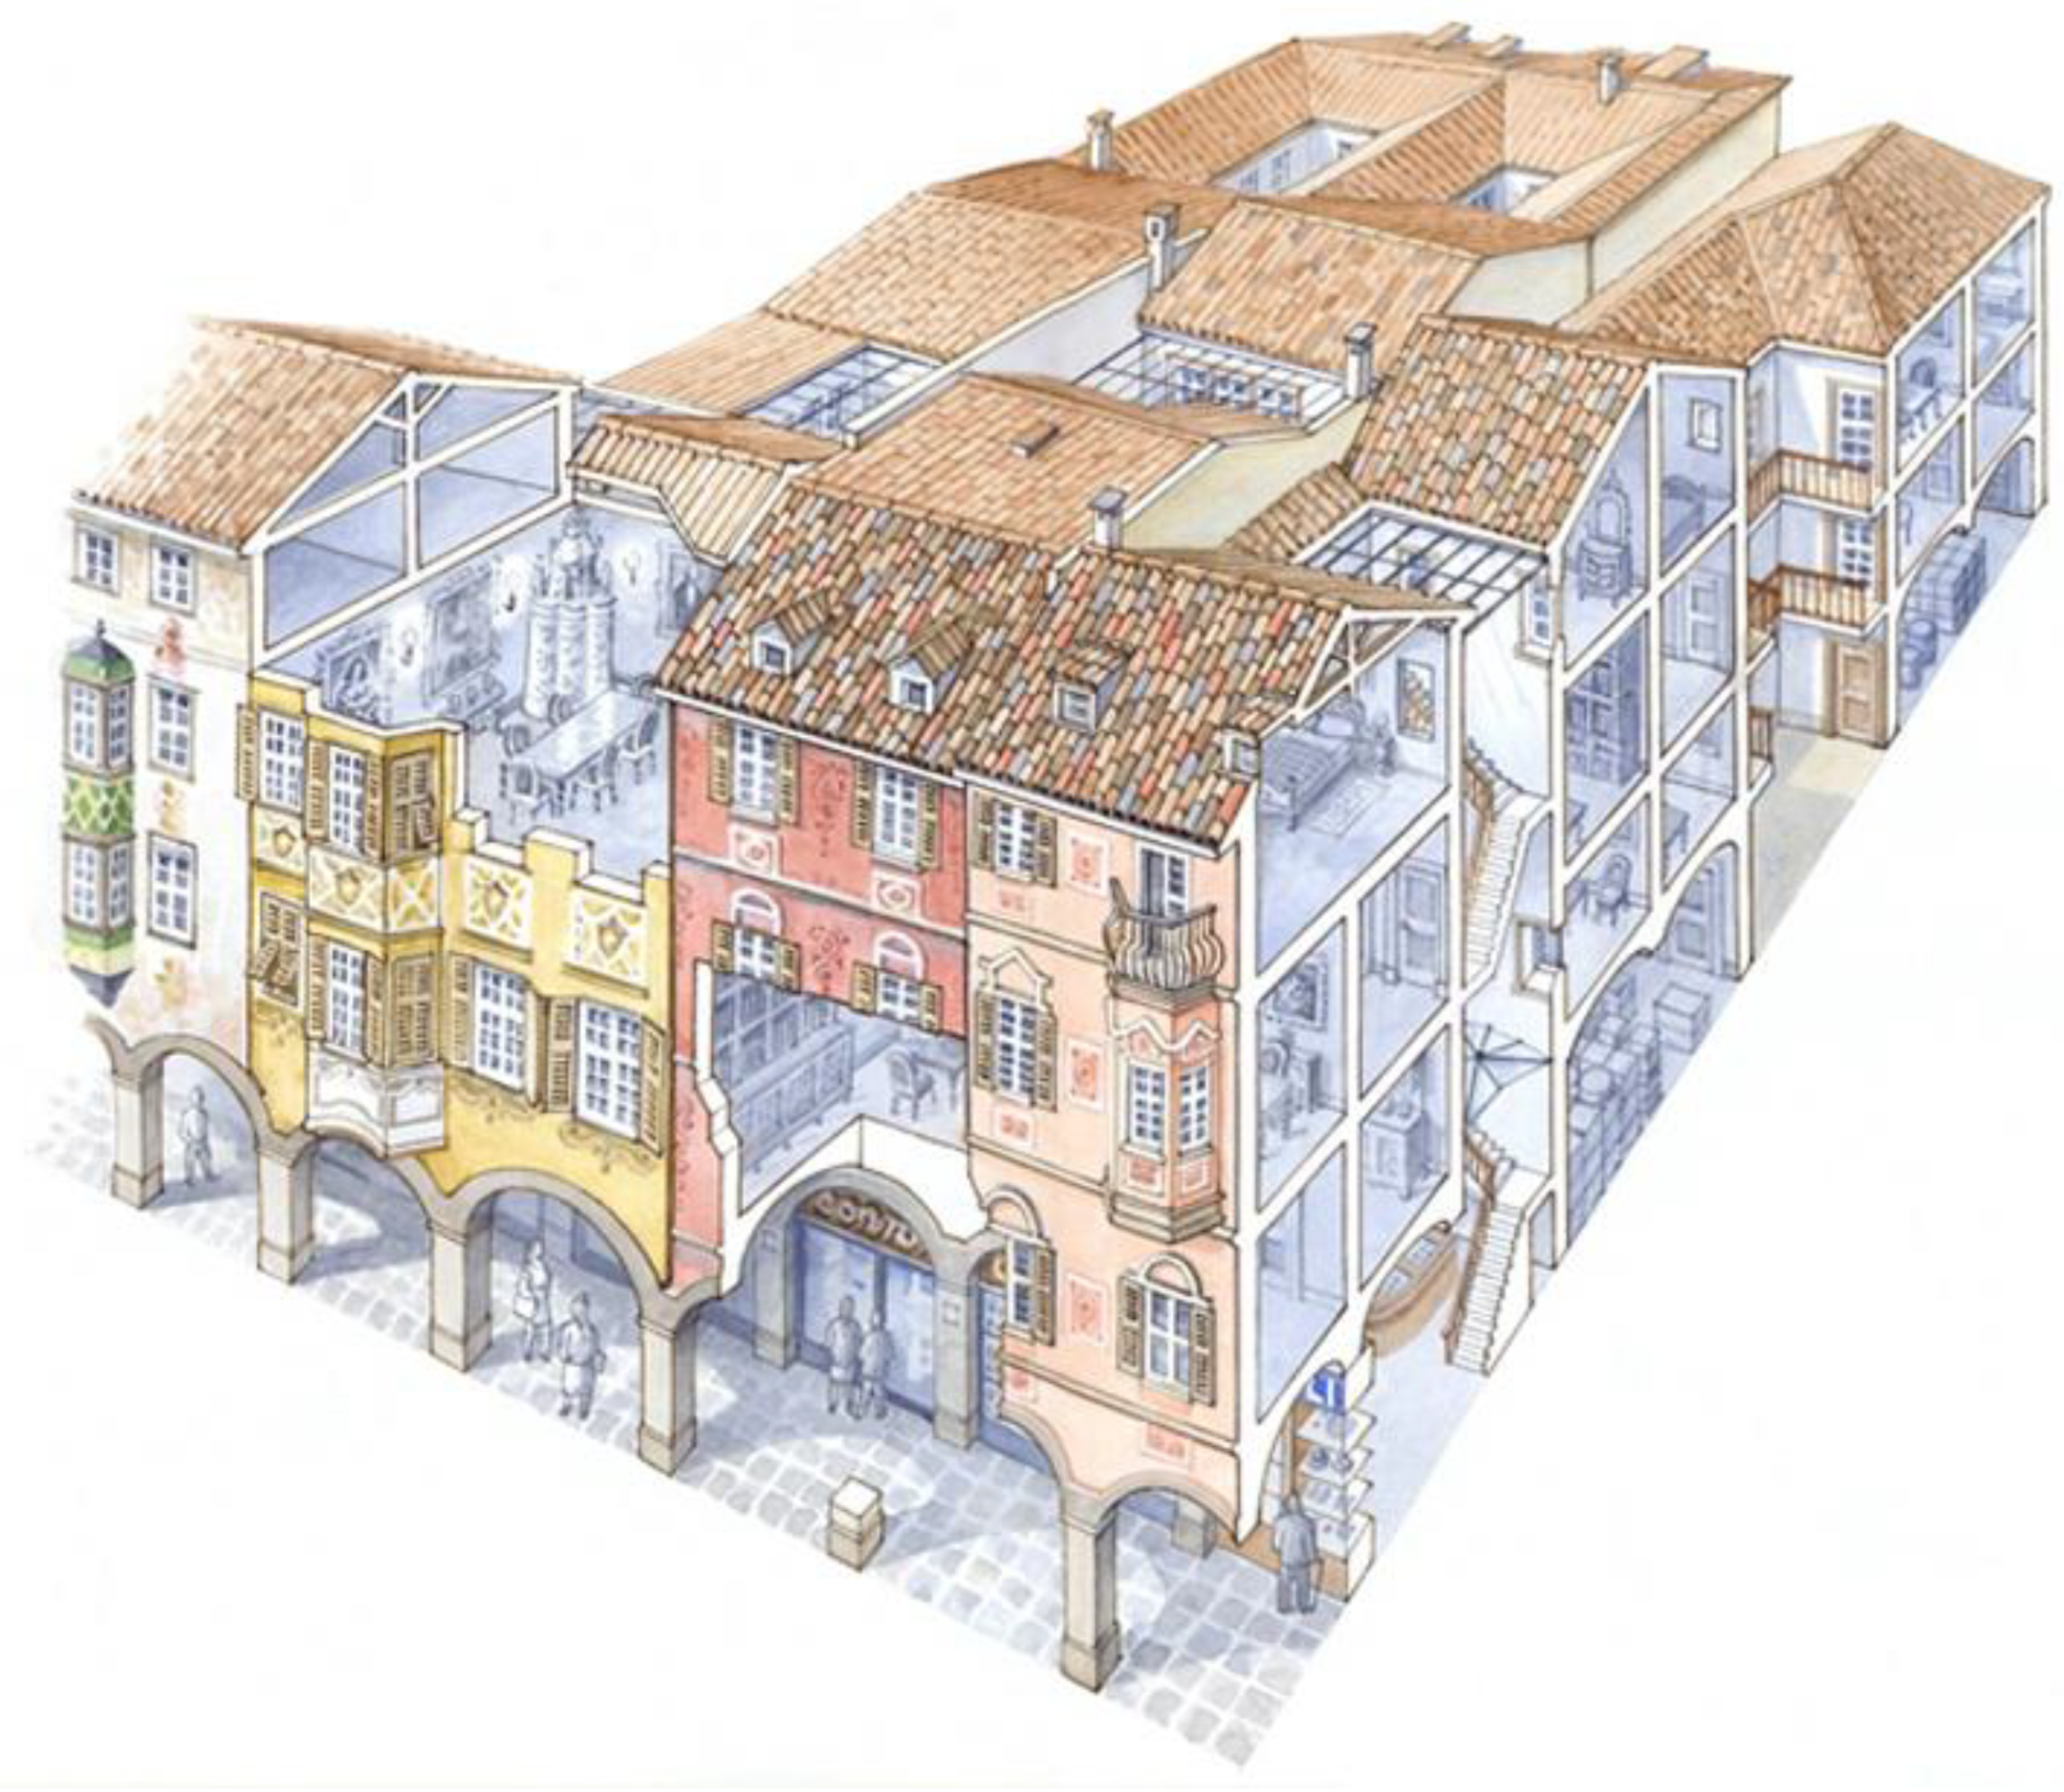
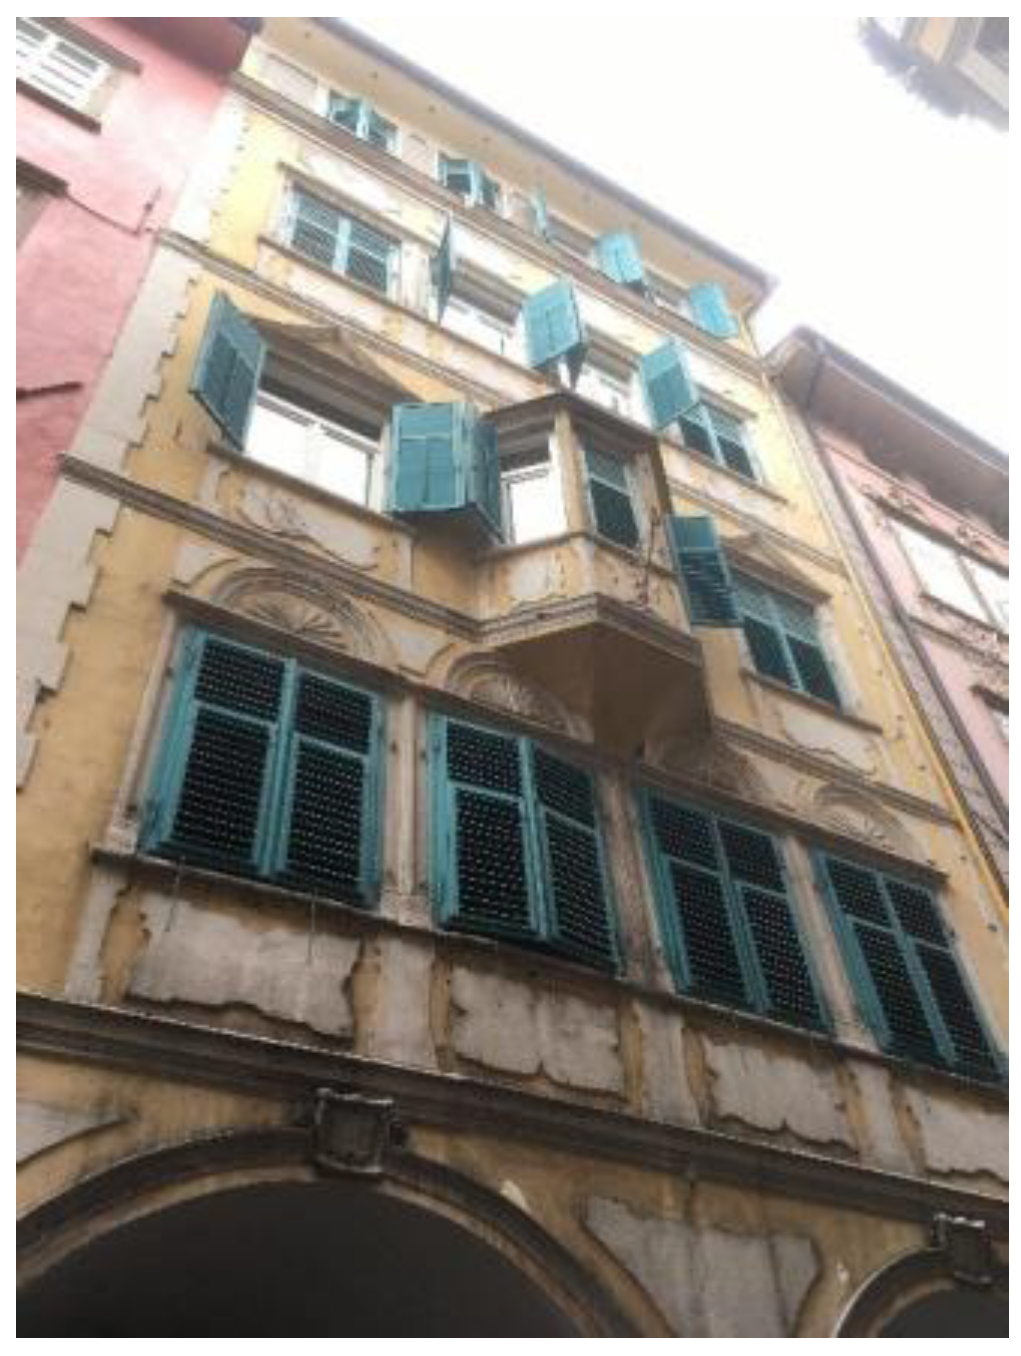
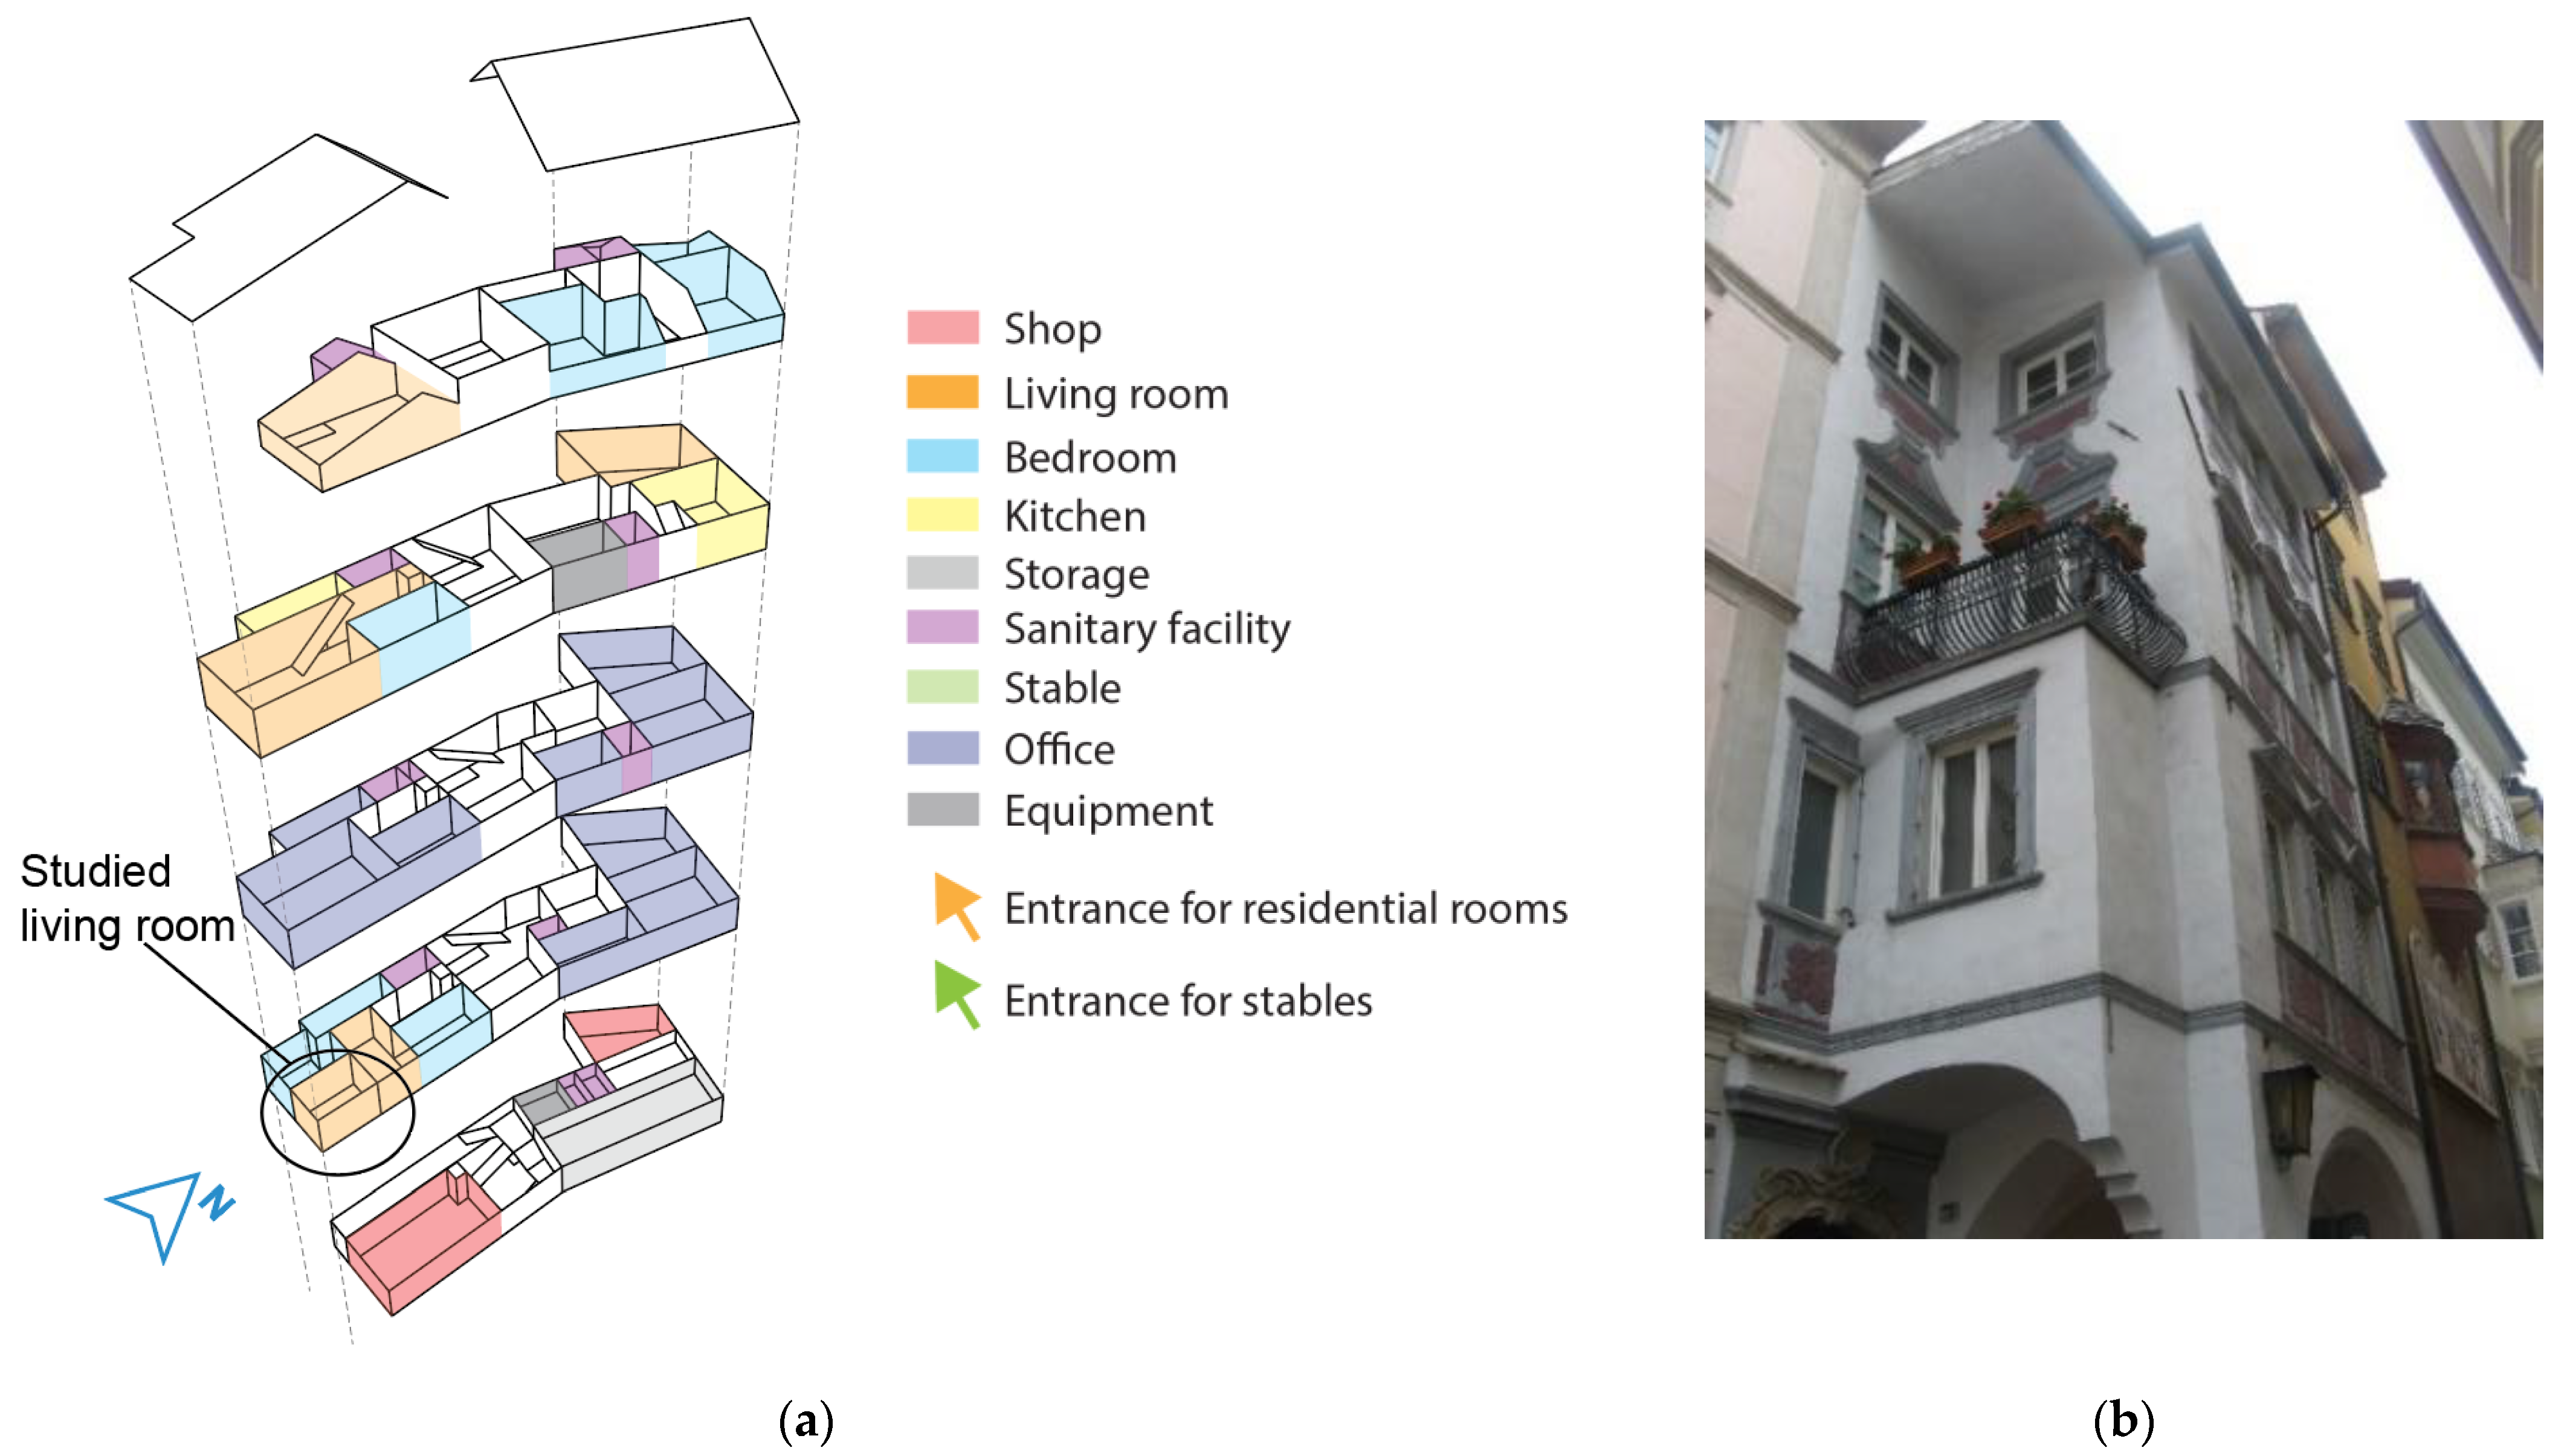
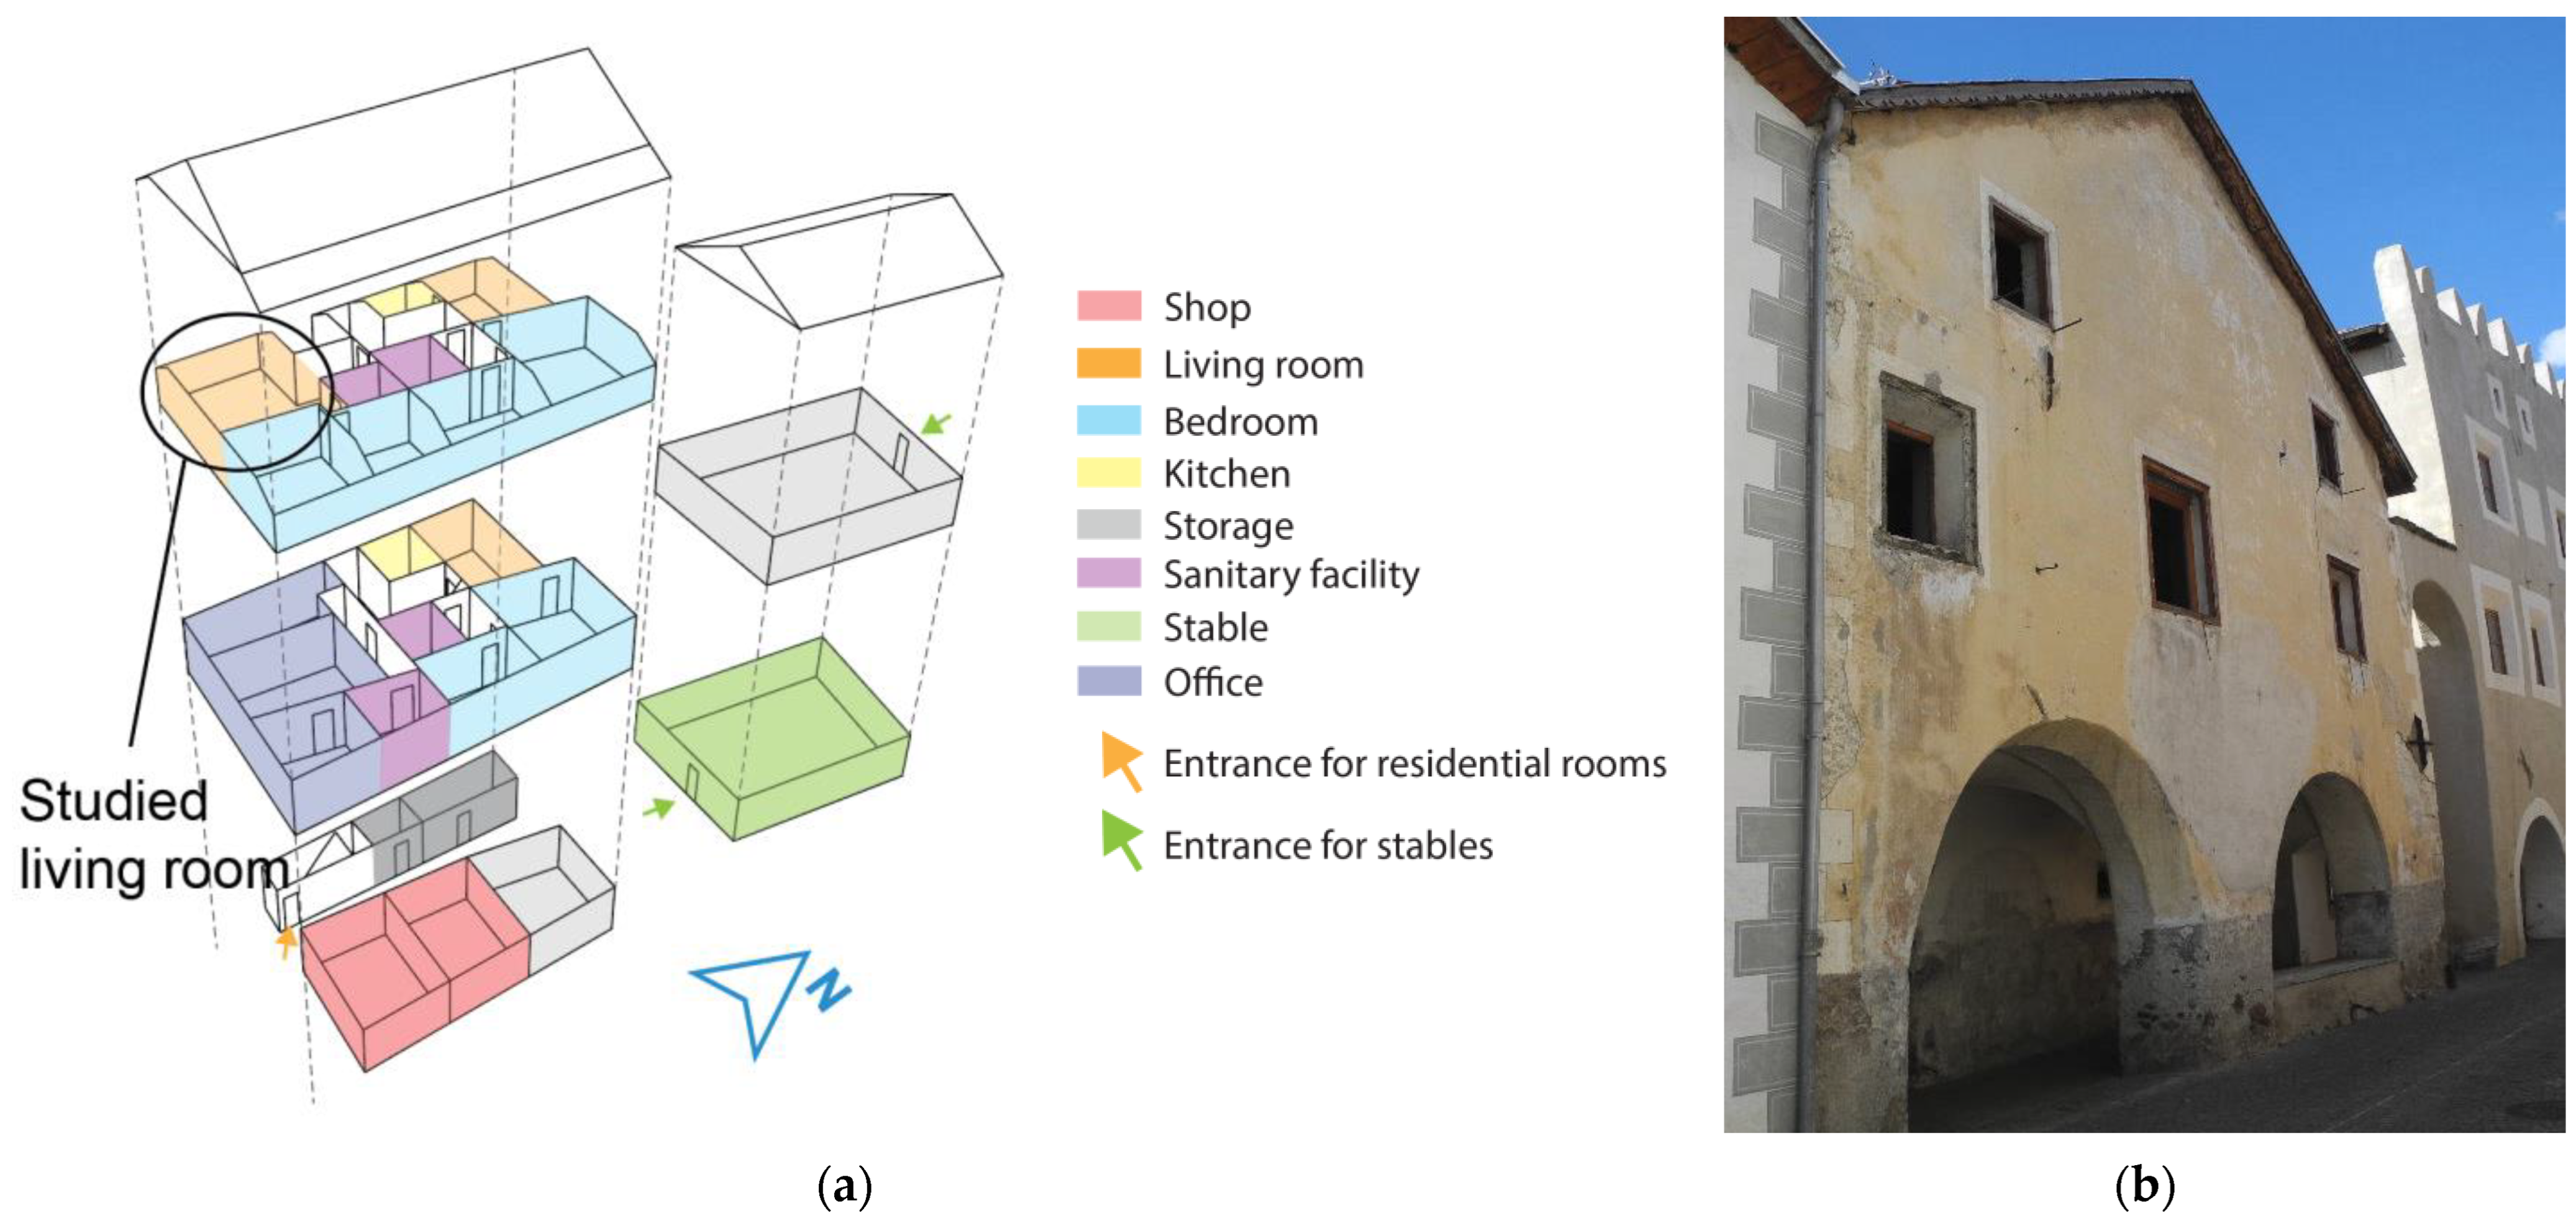
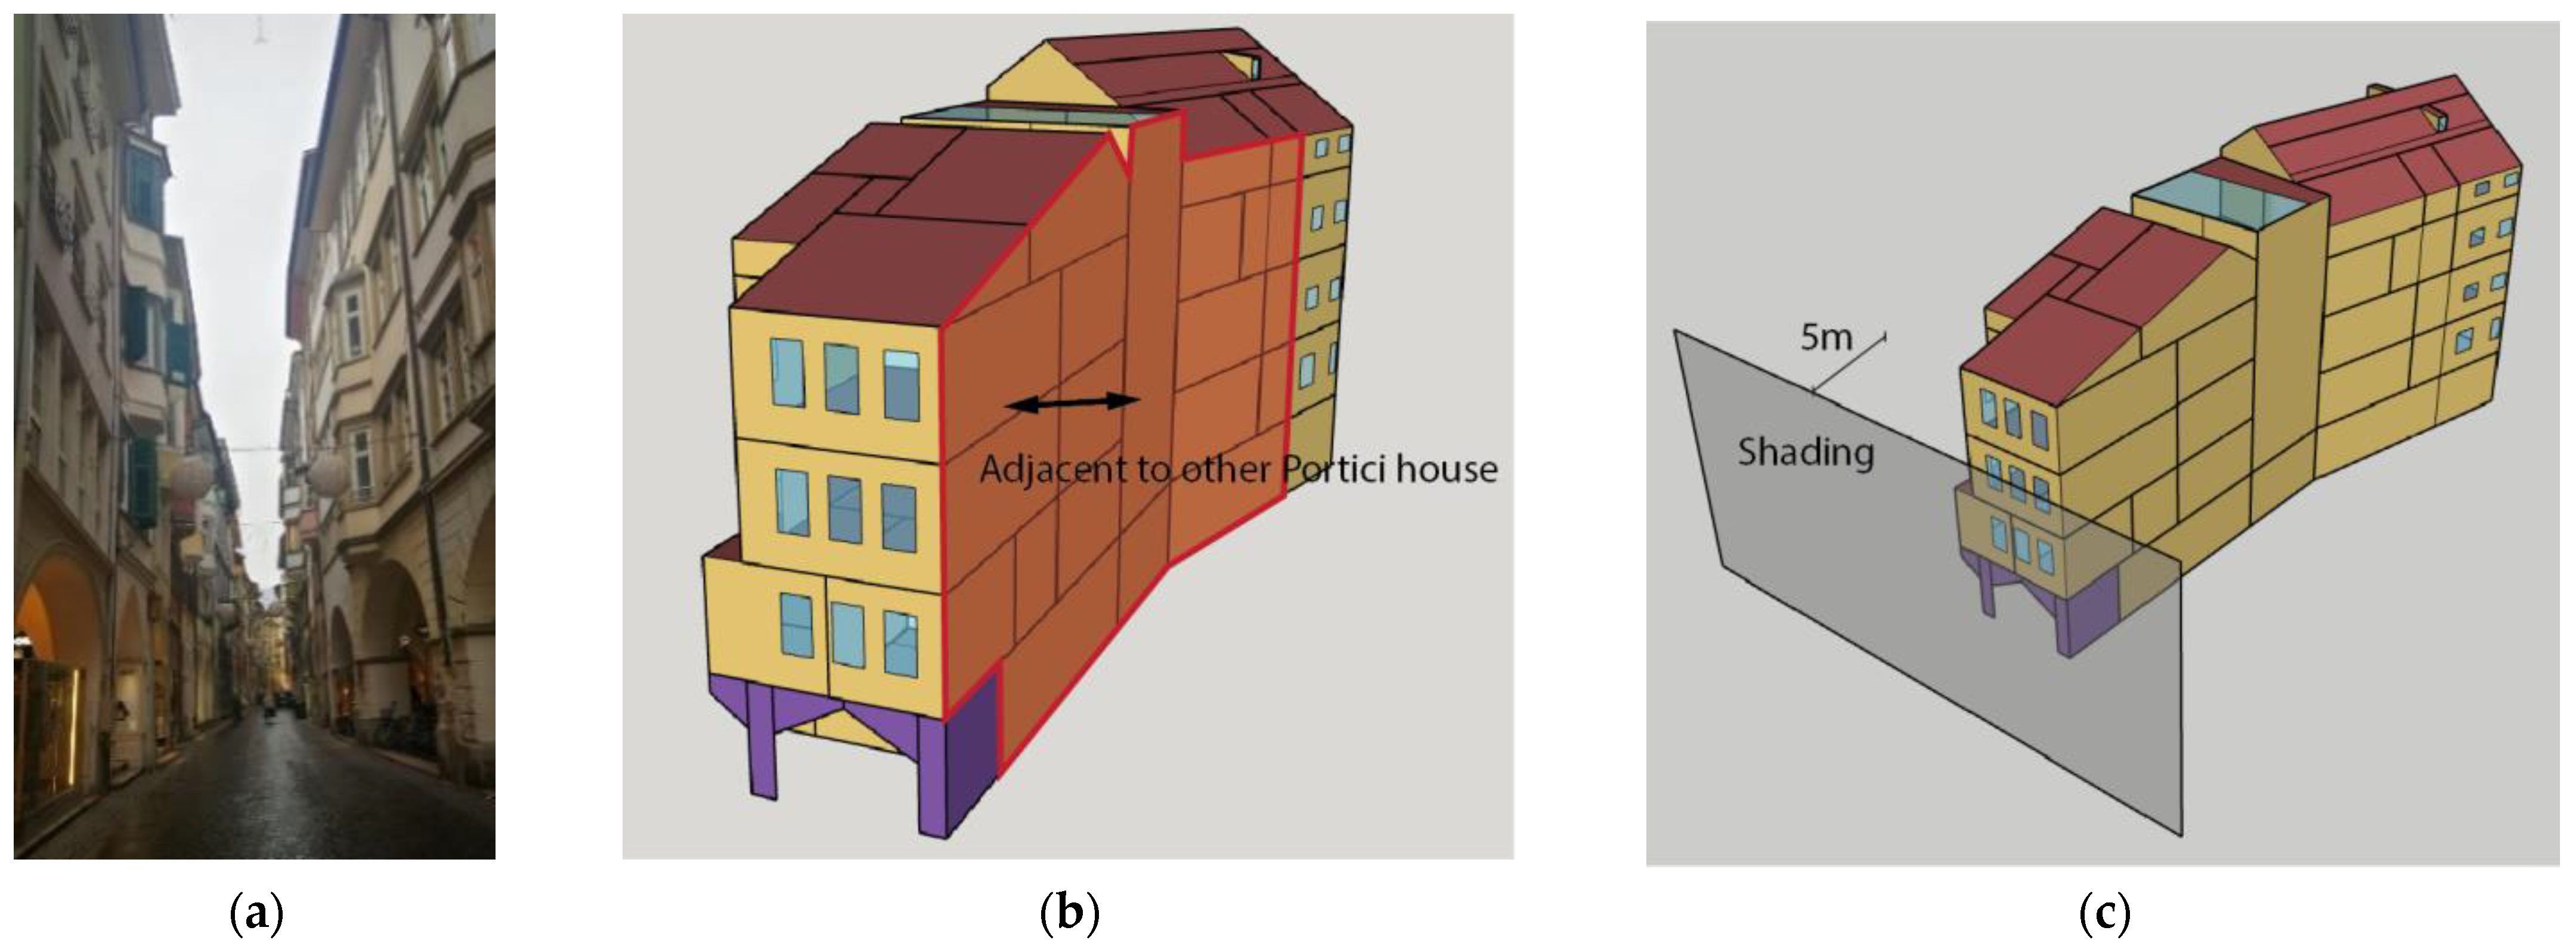
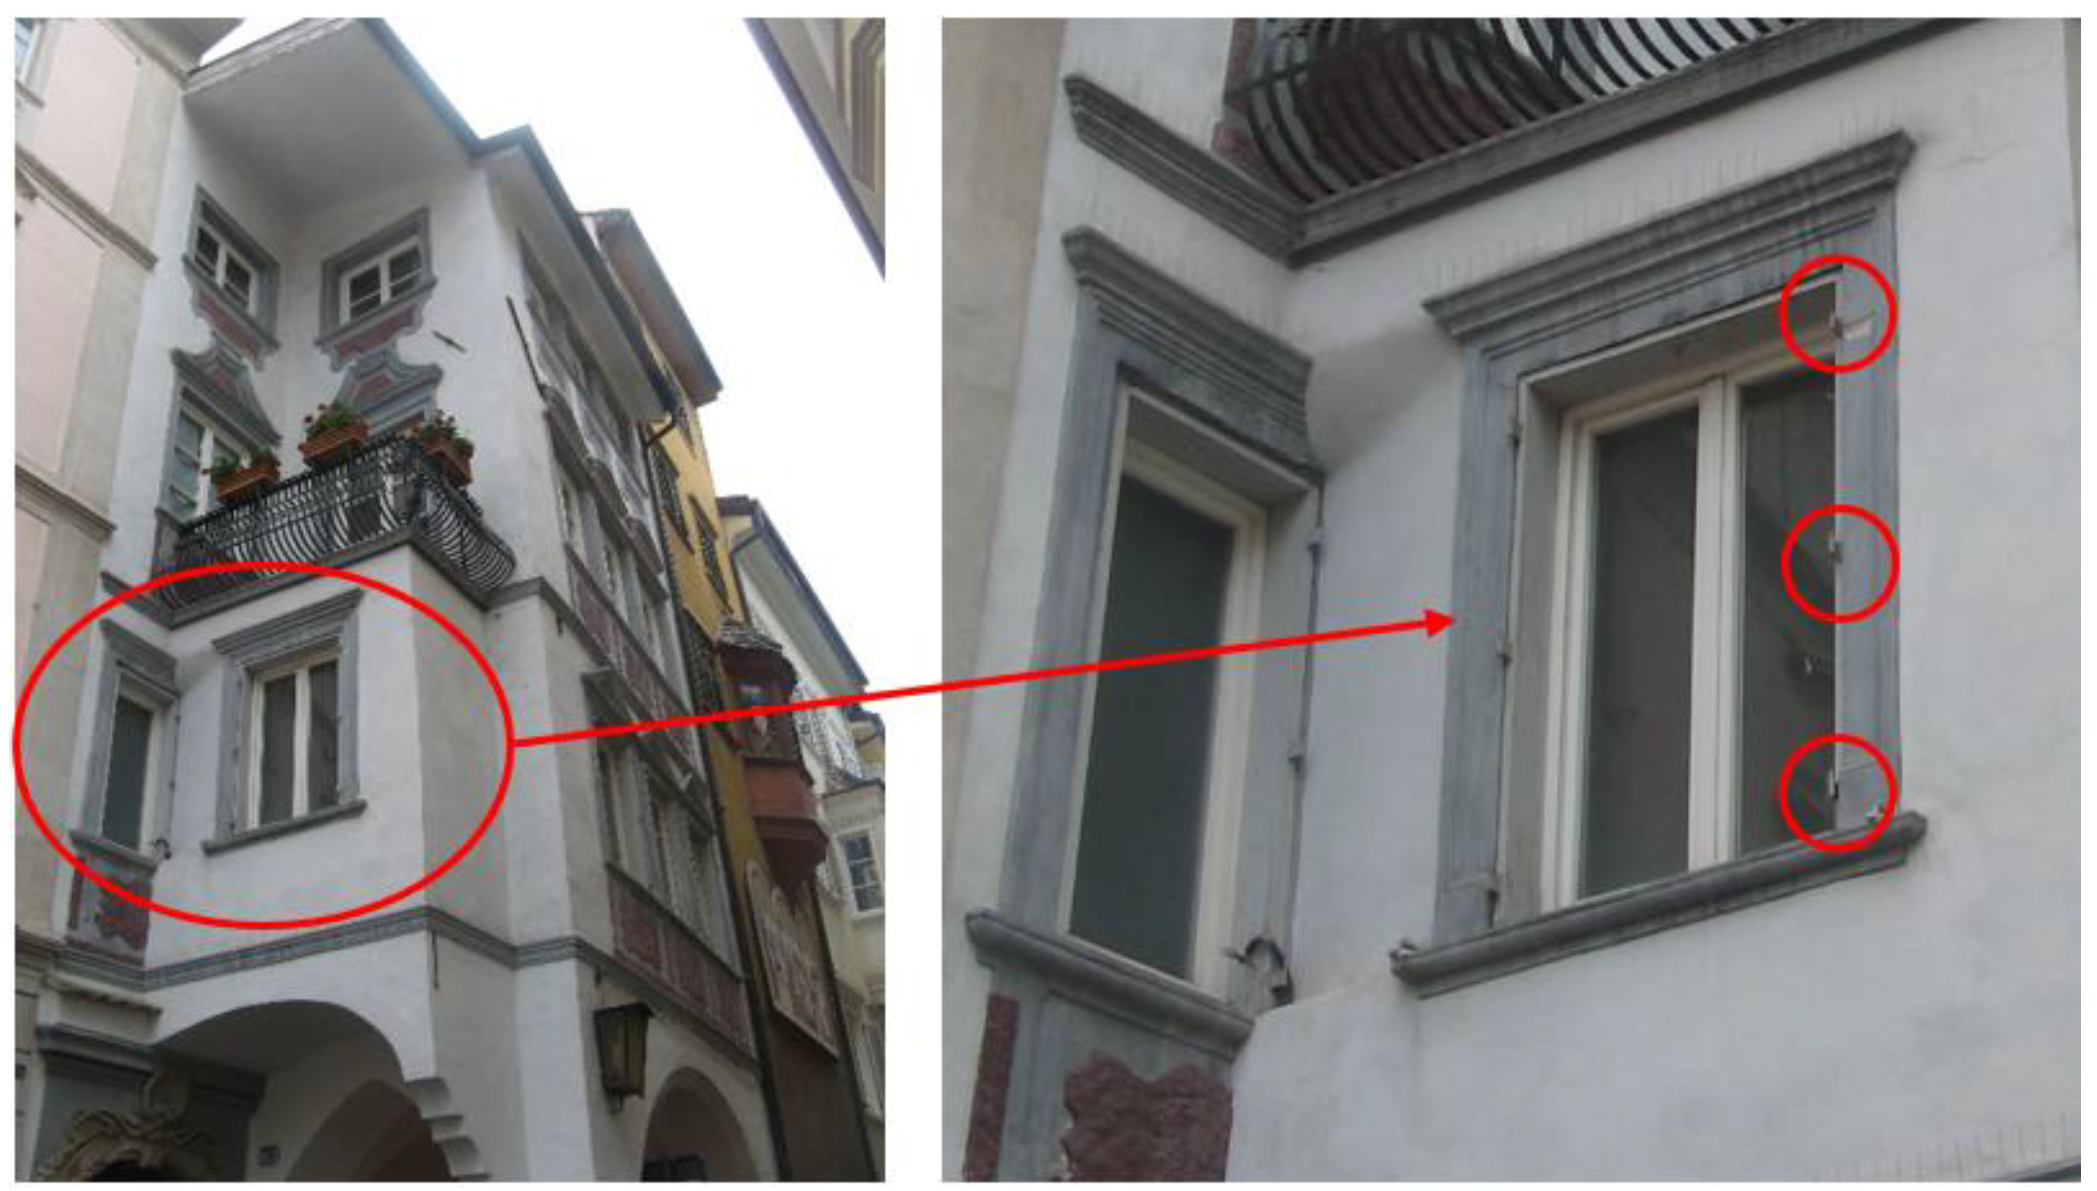
2.2. Description of Reference Buildings
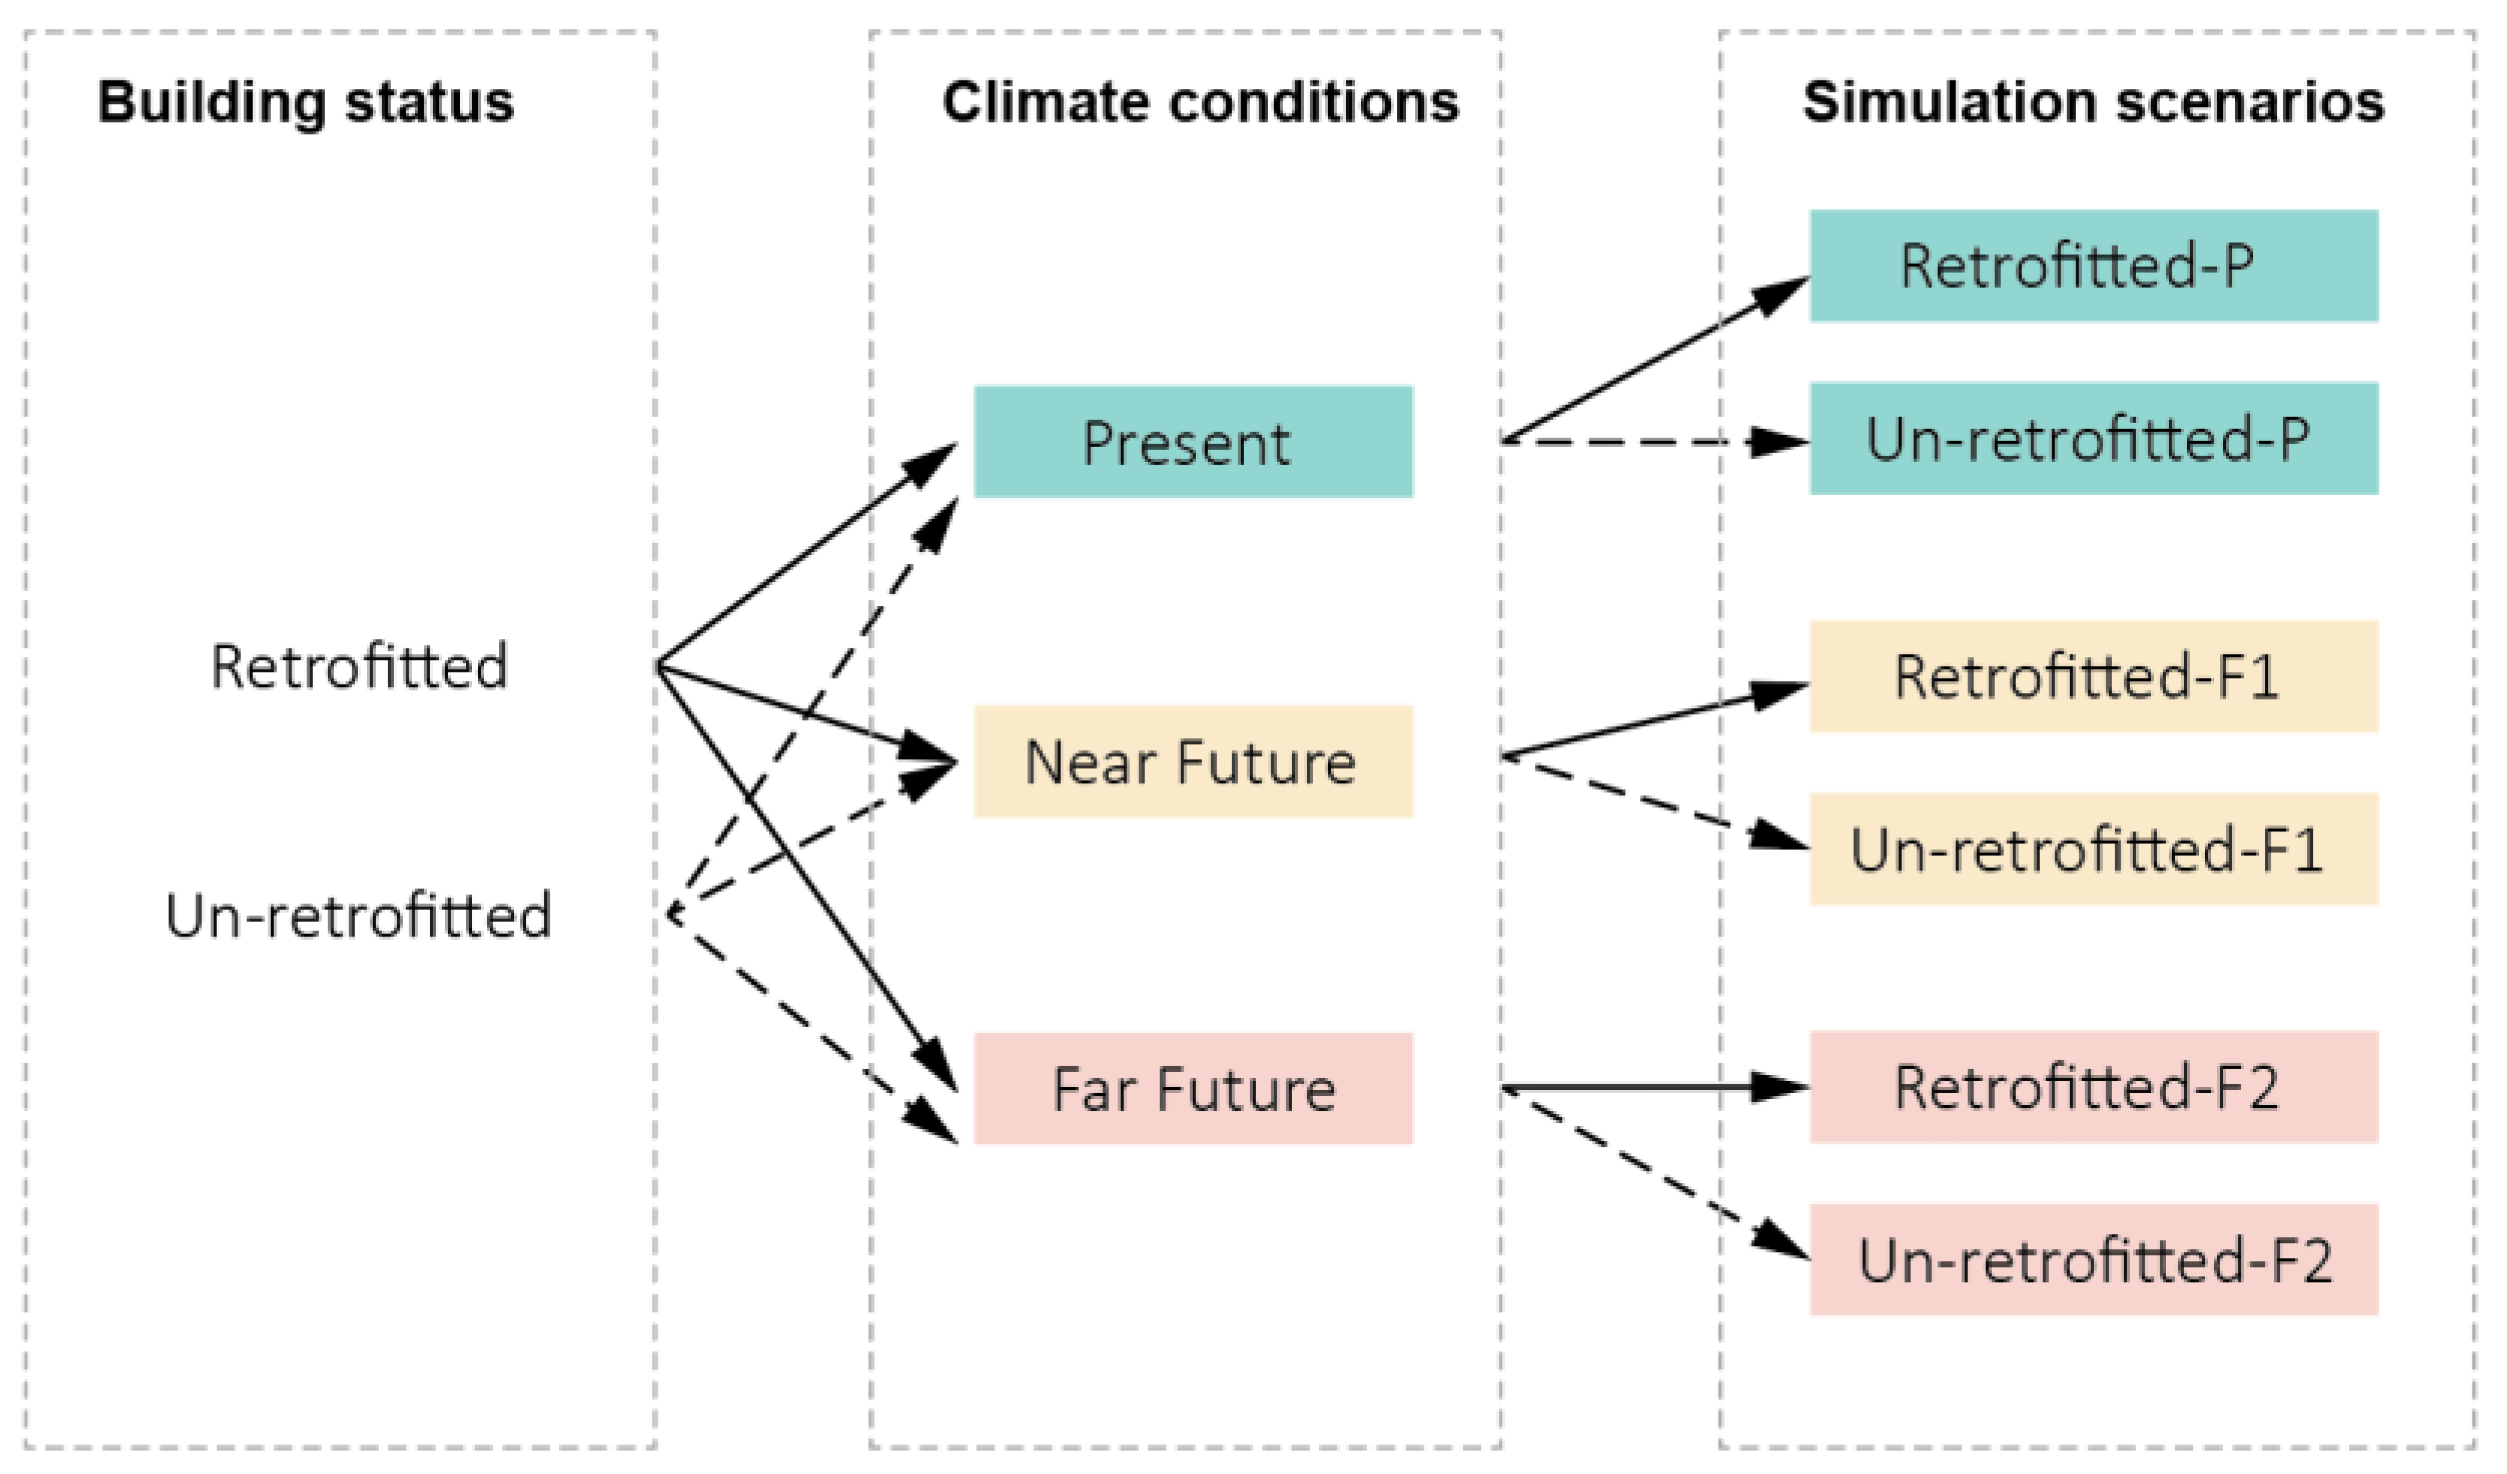
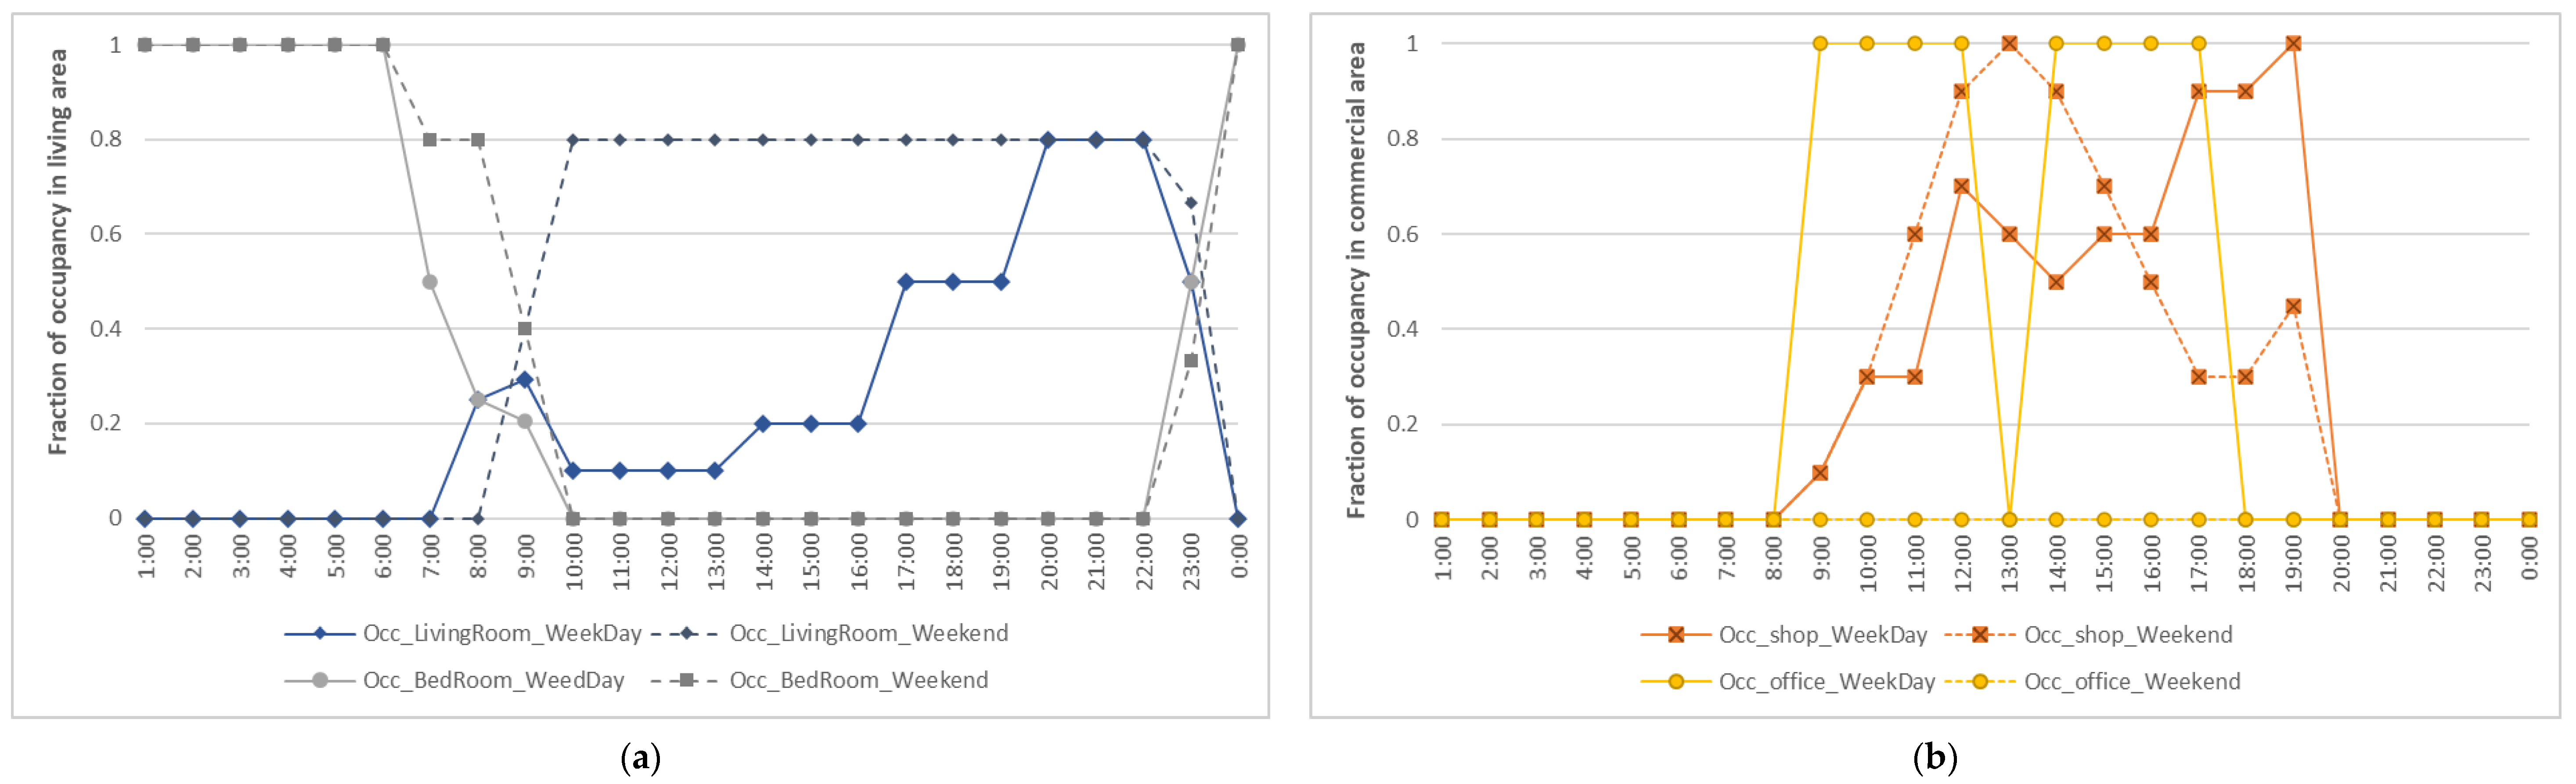
2.3. Numerical Simulation and Assessment Criteria
3. Results
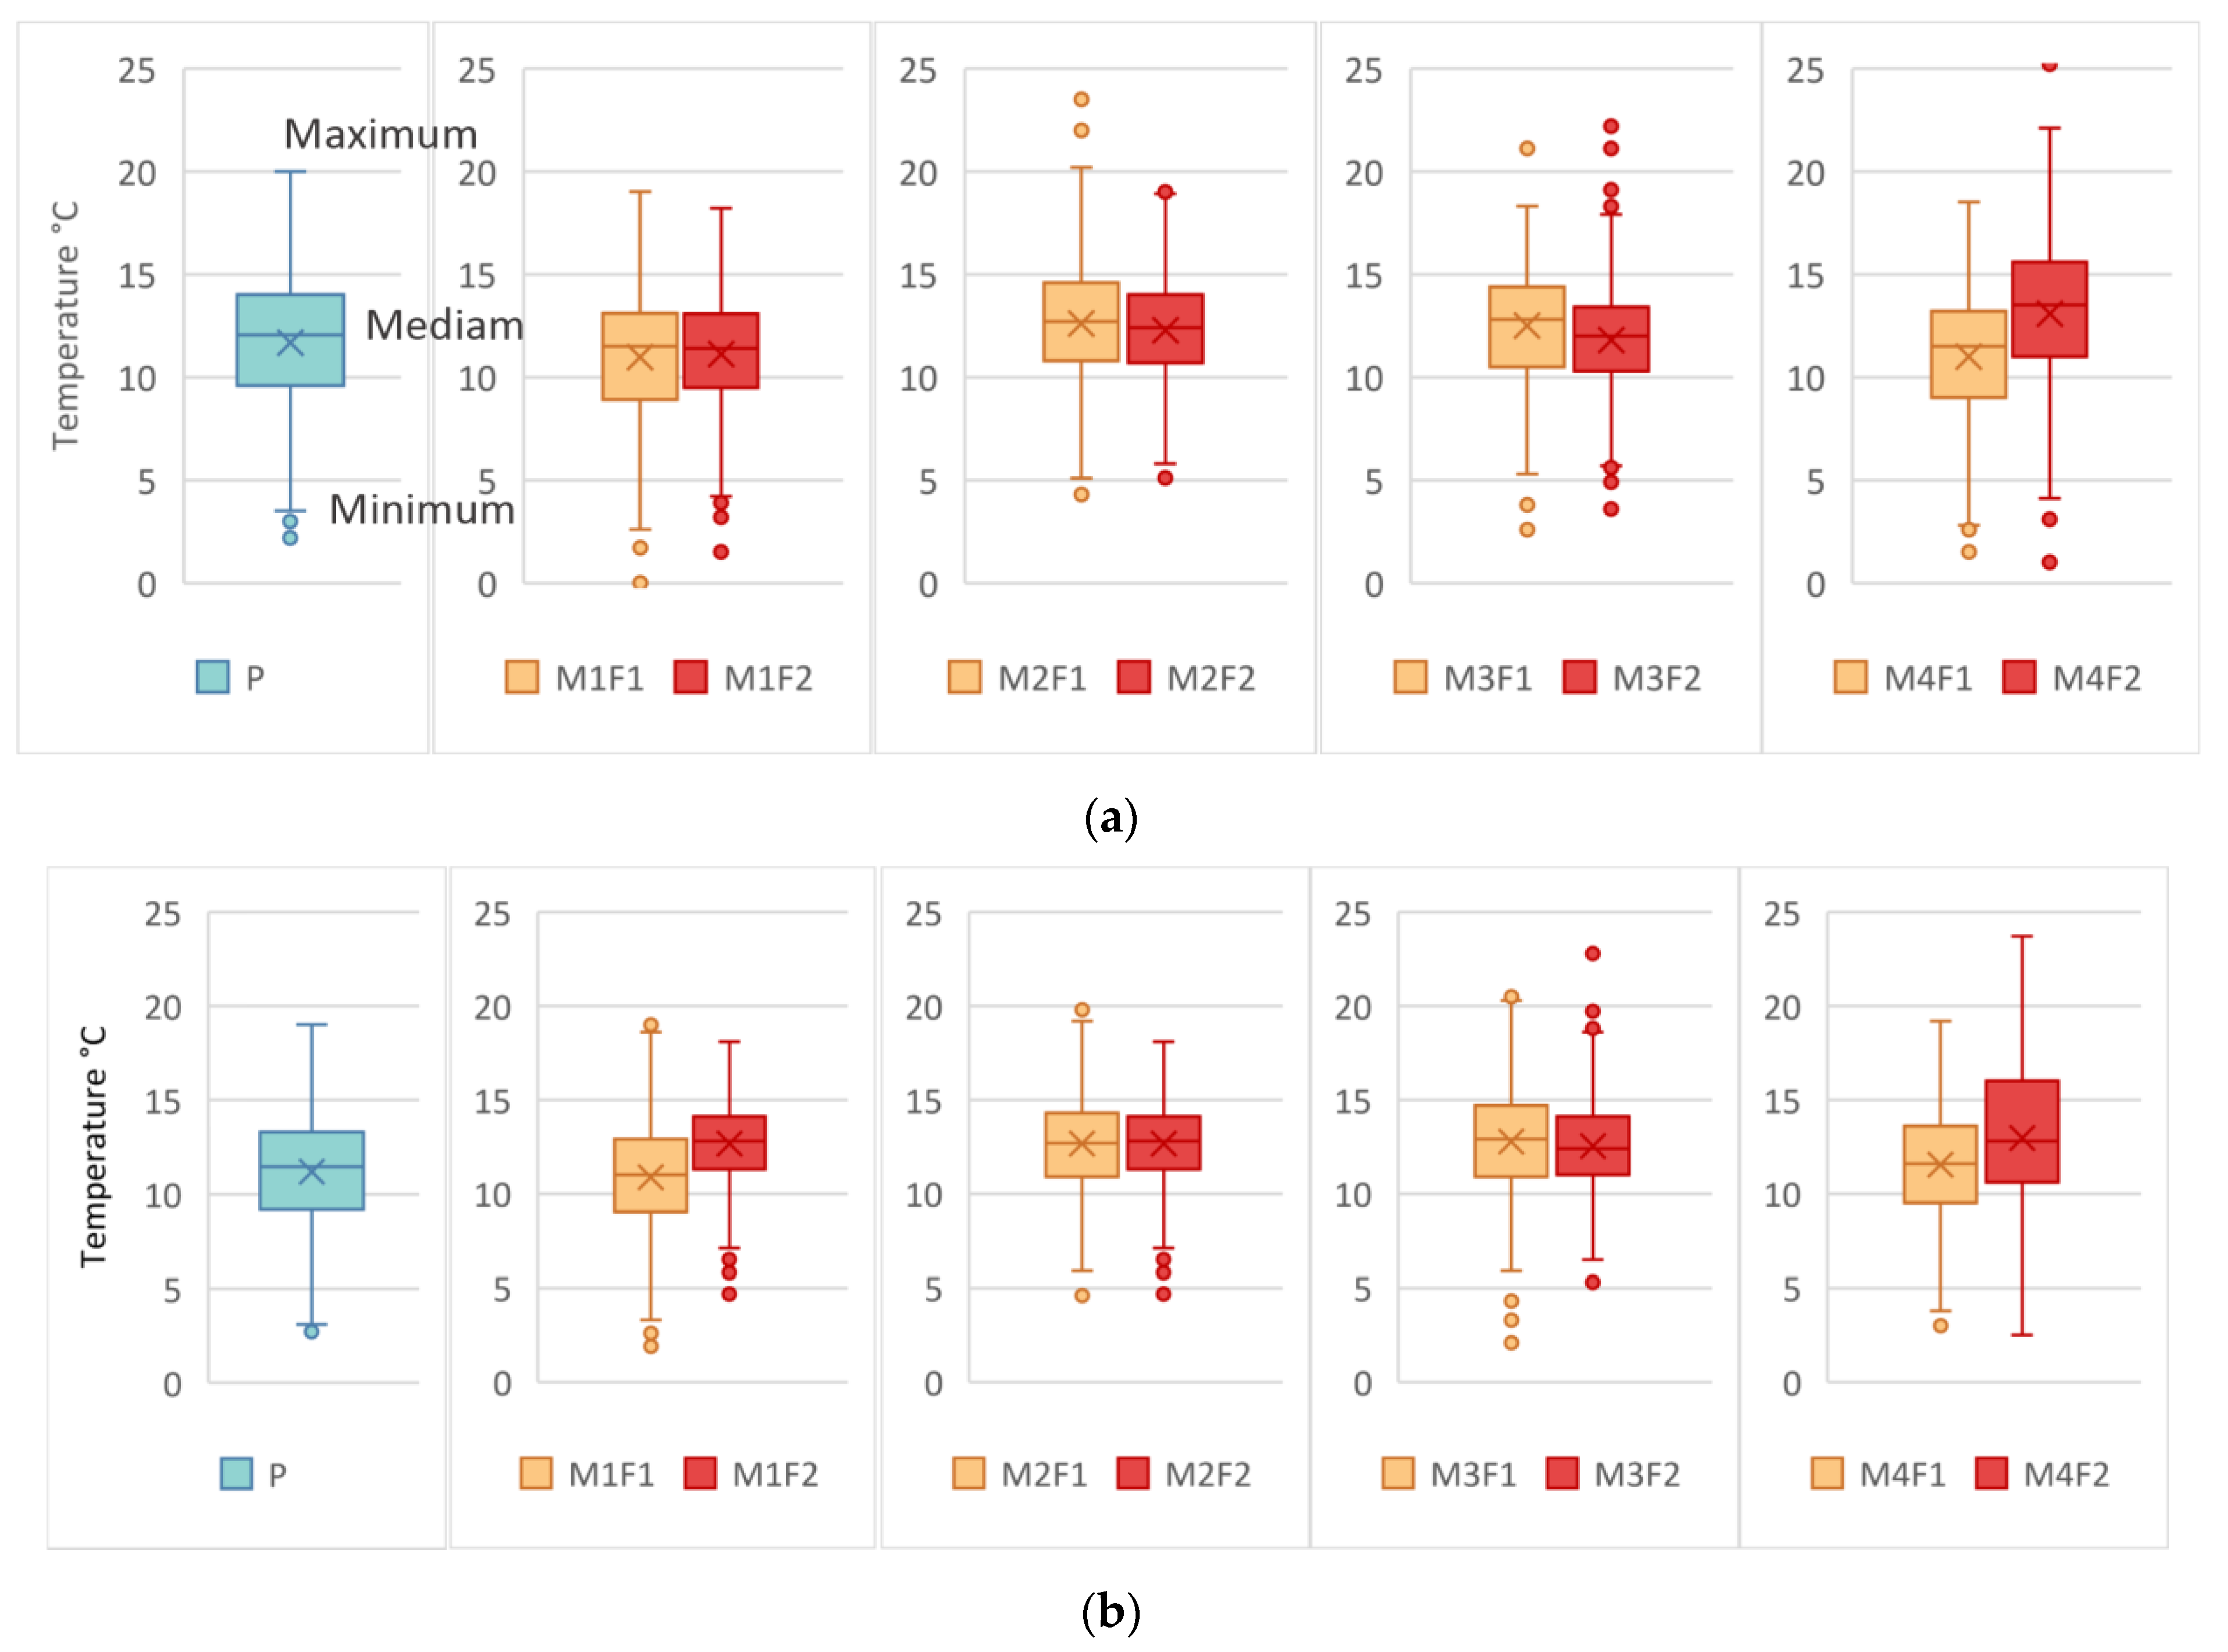
3.1. Future Climate Change
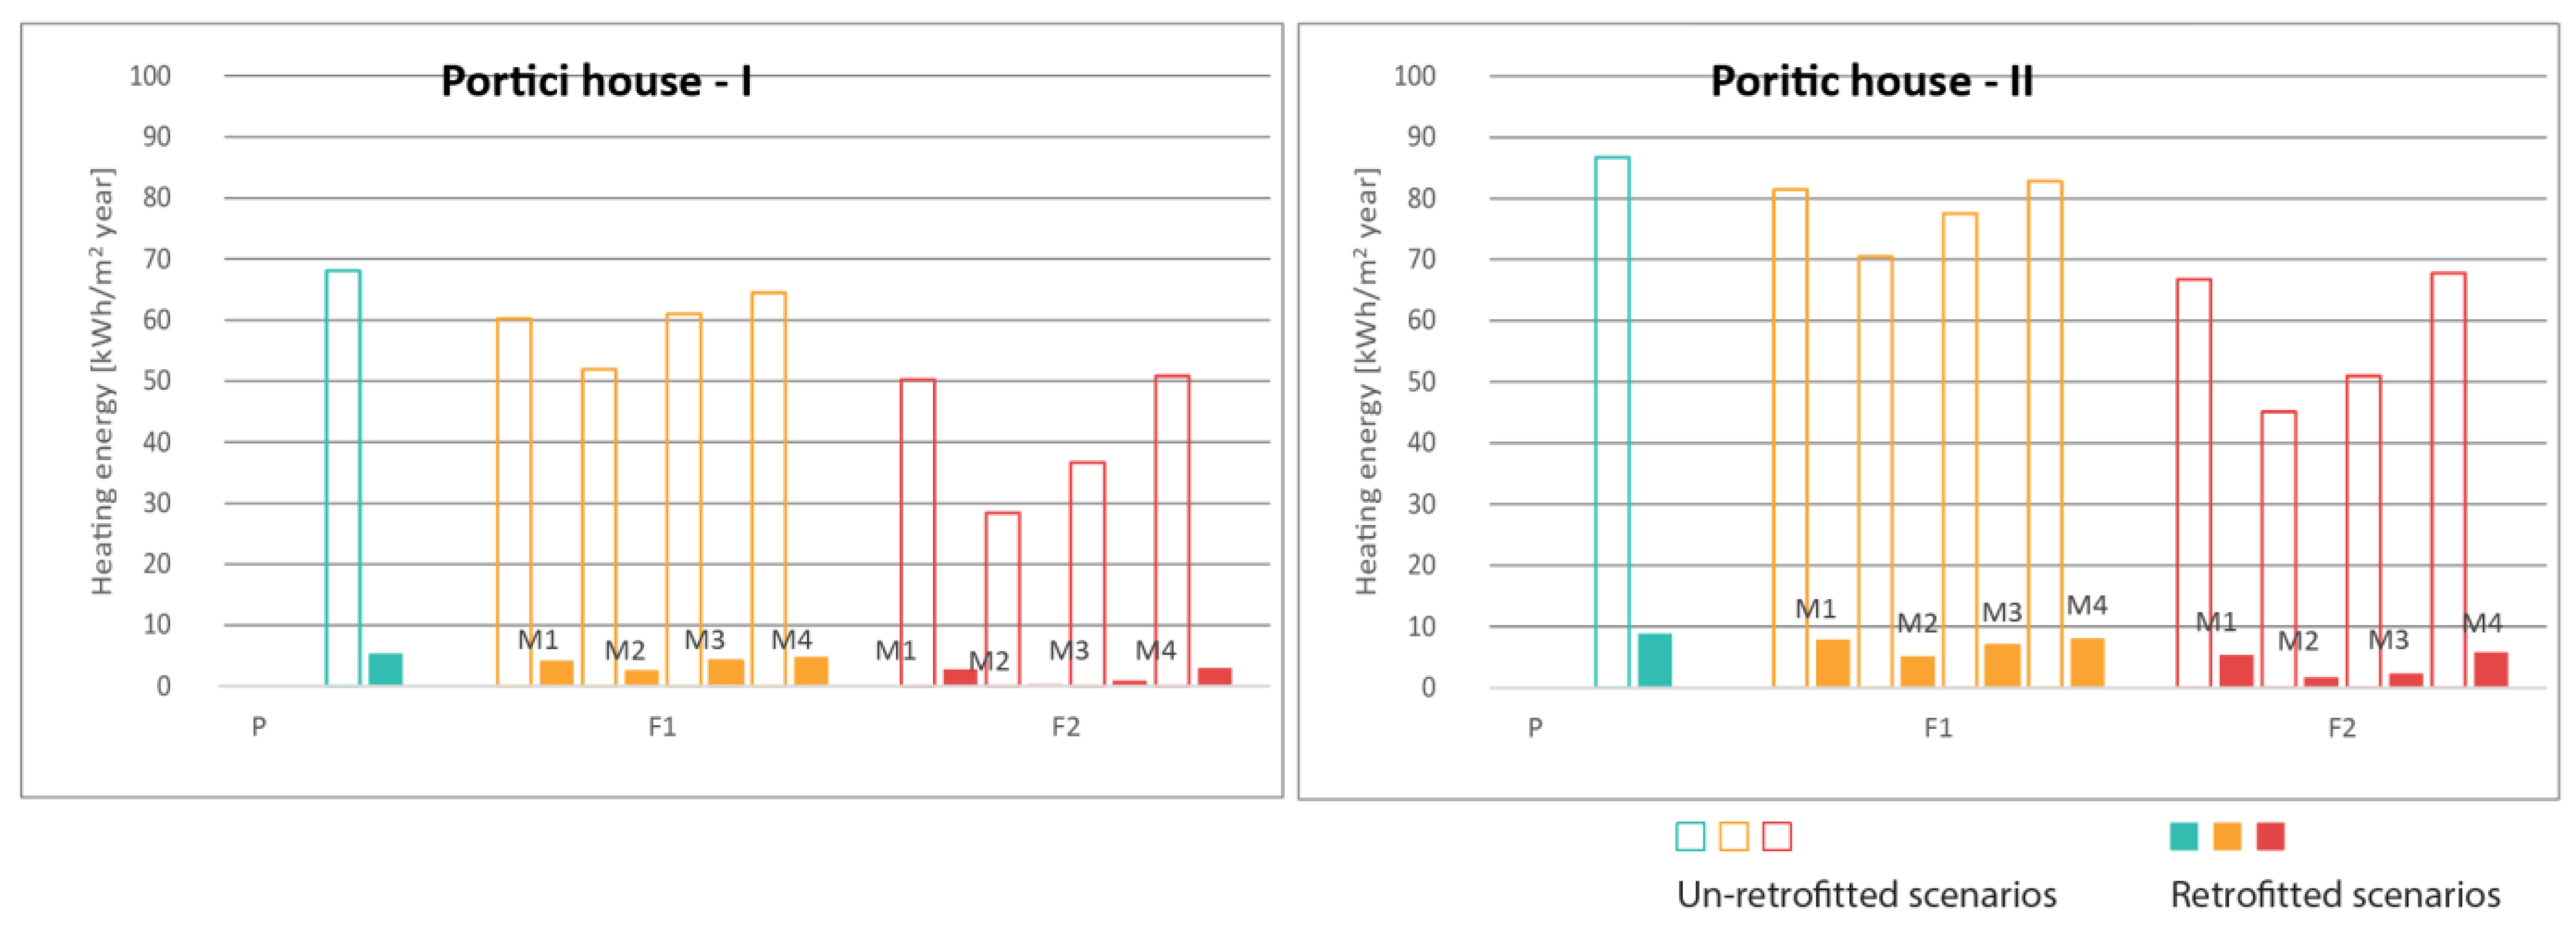
3.2. Building Energy Use
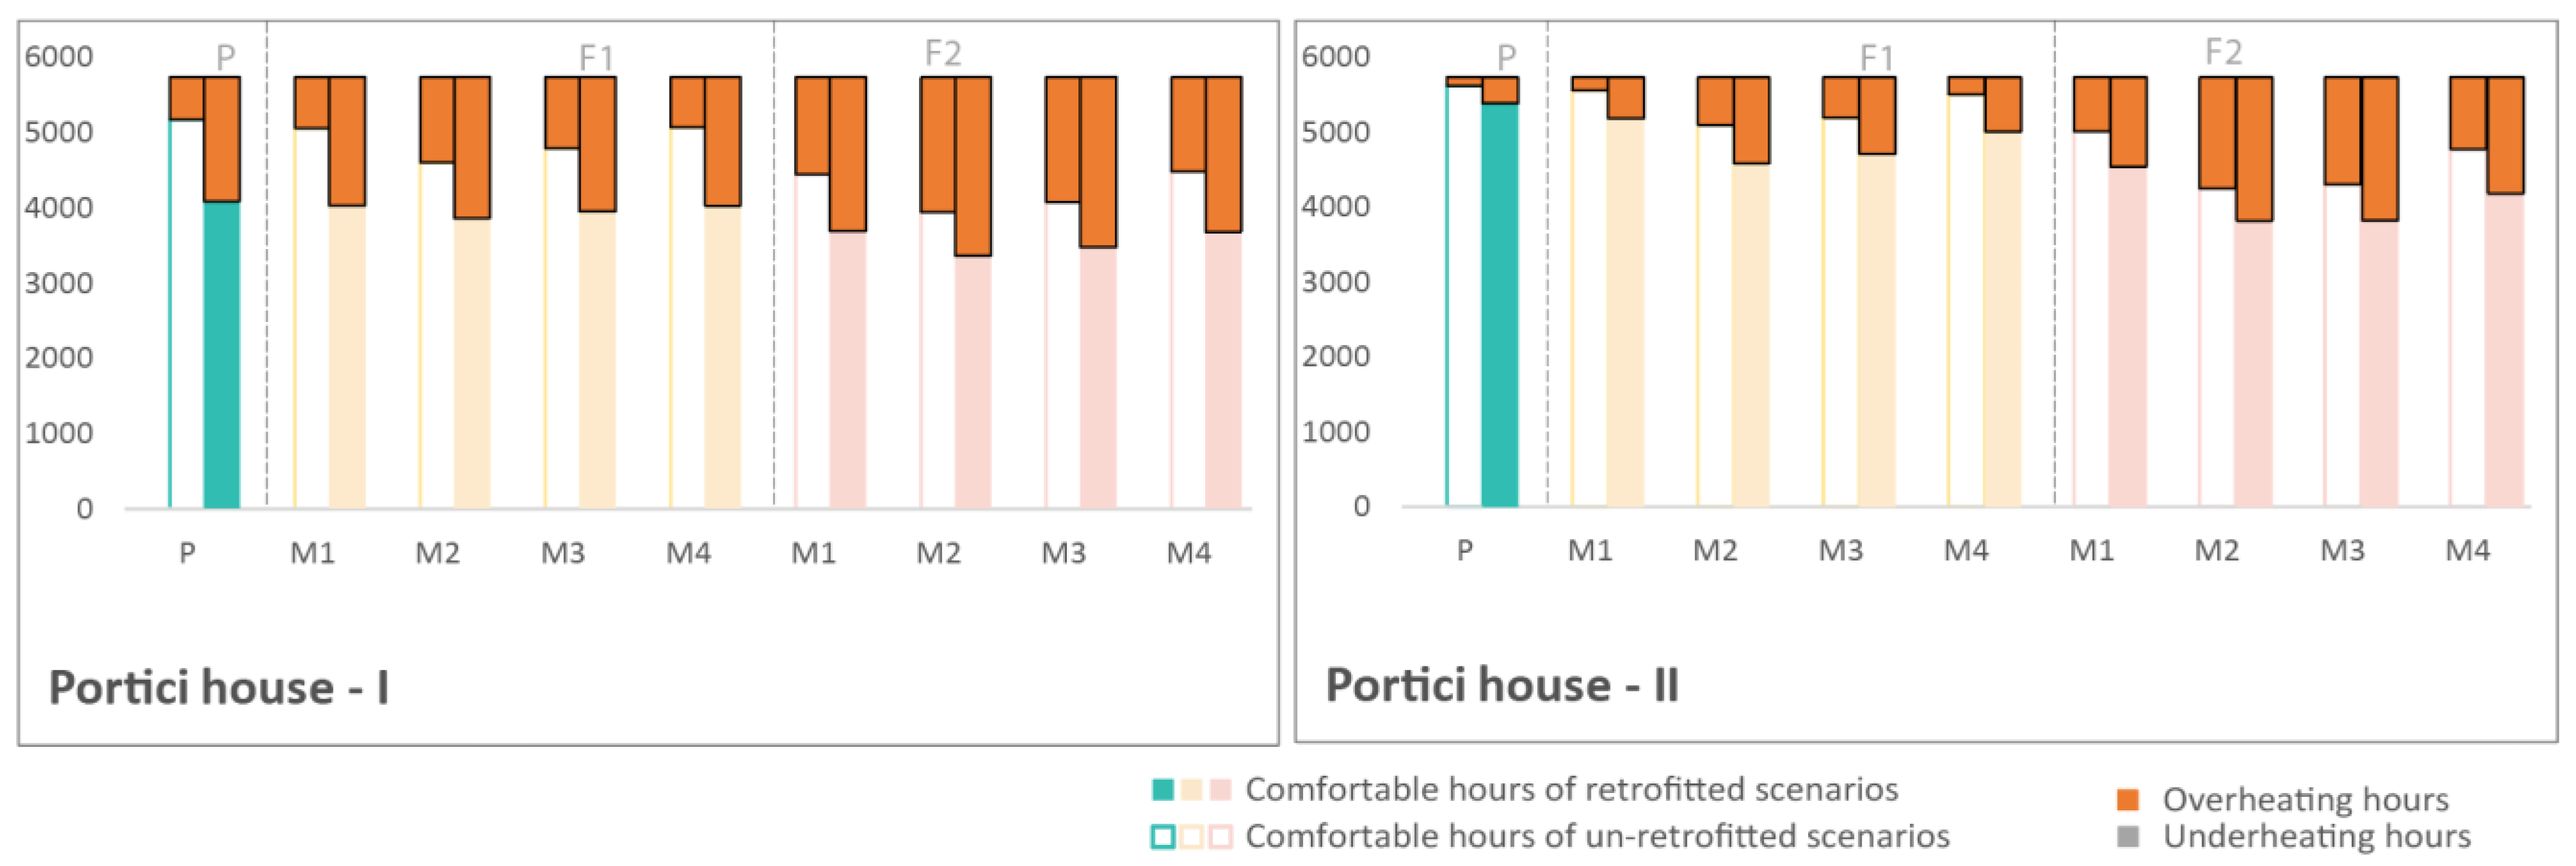
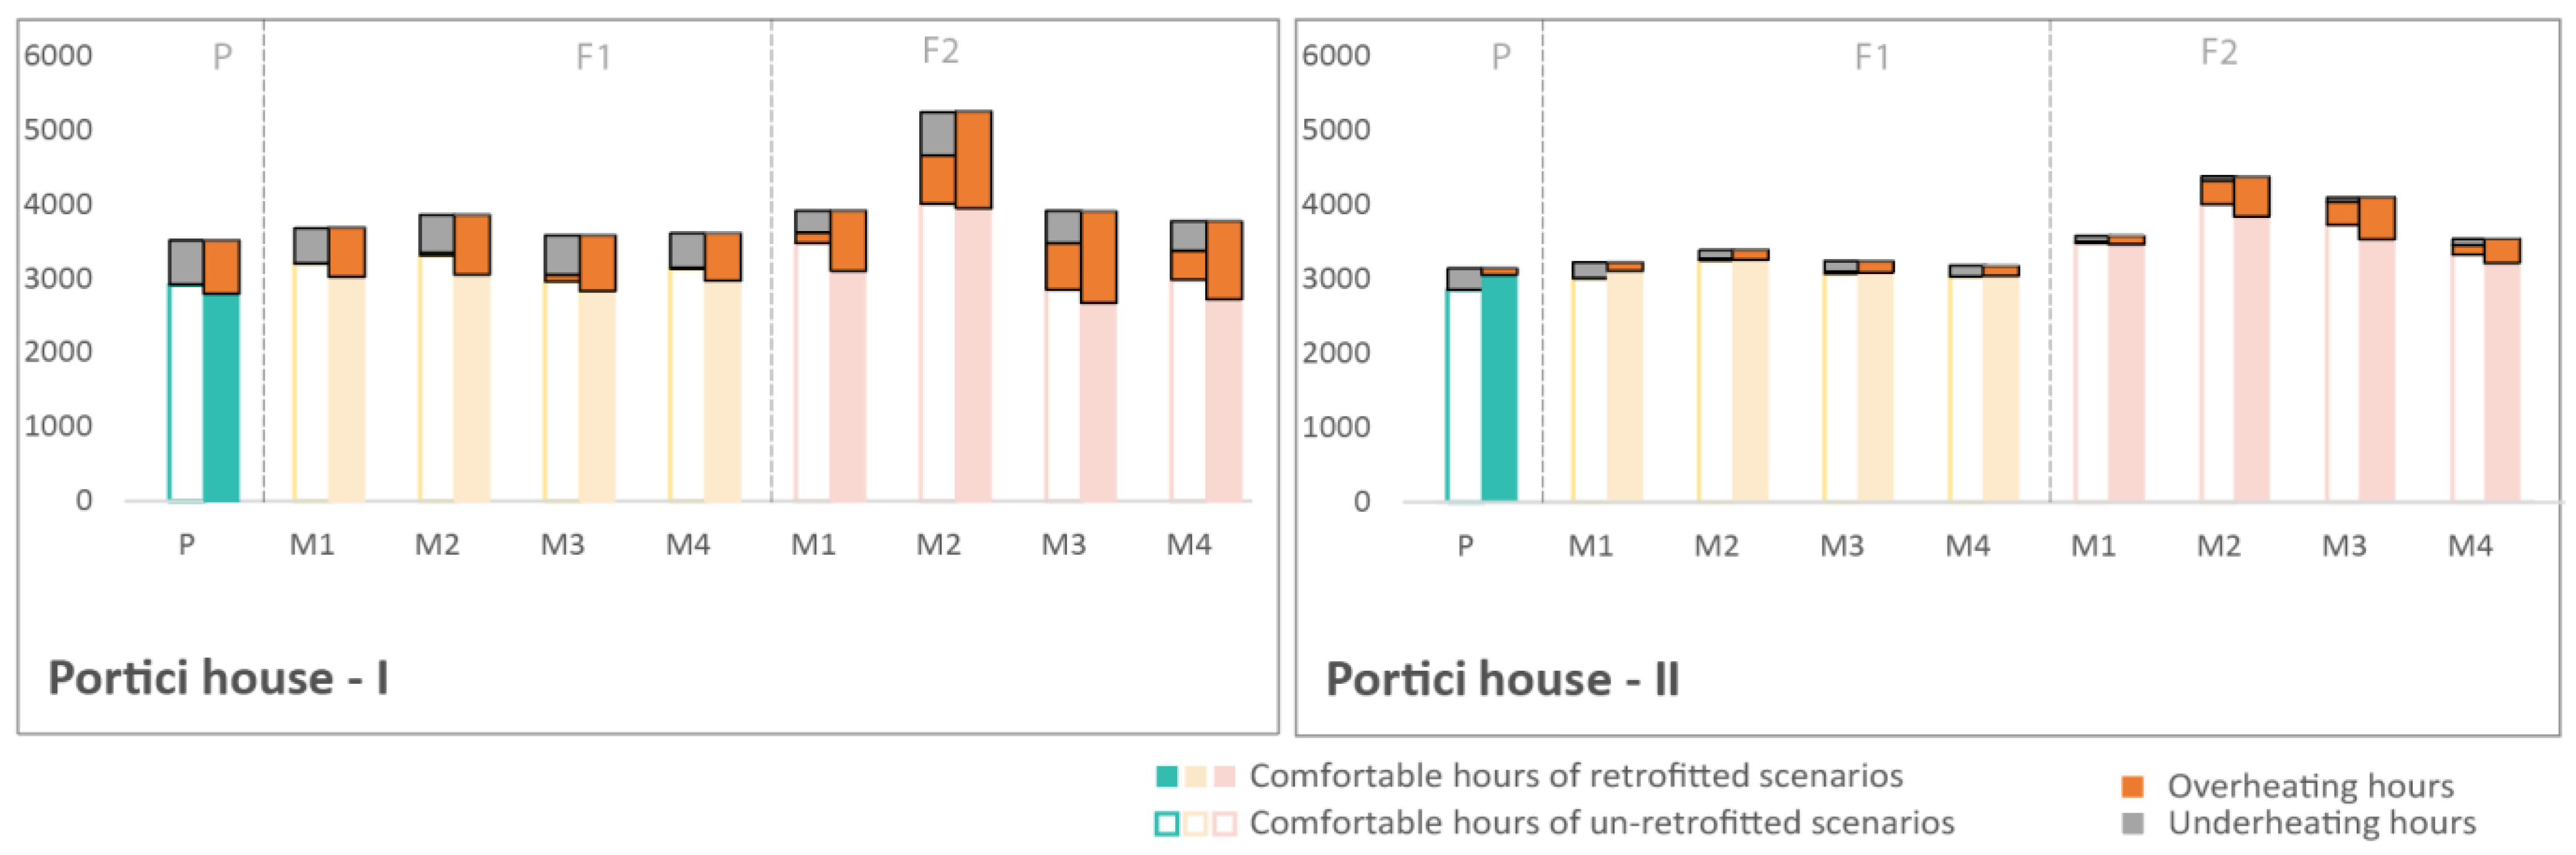
3.3. Thermal Comfort
3.3.1. Comfort Assessment with Fixed Operative Temperature Threshold
3.3.2. Comfort Assessment with Adaptive Model
4. Discussion
4.1. The Impact of Assessment Methods
4.2. The (Combined) Impact of Climate Change and Energy Retrofit
4.3. The Impact of Building Characteristics
4.4. Adaptation Solutions to Reduce Overheating Risk
4.5. Limitations and Future Research
5. Conclusions
Author Contributions
Funding
Institutional Review Board Statement
Informed Consent Statement
Conflicts of Interest
References
- IPCC. Technical Summary. In Climate Change 2021: The Physical Science Basis. Contribution of Working Group I to the Sixth Assessment Report of the Intergovernmental Panel on Climate Change; Cambridge University Press: Cambridge, UK, 2021; in Press. [Google Scholar]
- IPCC. Summary for Policymakers. In Climate Change 2021: The Physical Science Basis. Contribution of Working Group I to the Sixth Assessment Report of the Intergovernmental Panel on Climate Change; Cambridge University Press: Cambridge, UK, 2021; in Press. [Google Scholar]
- EEA. Climate Change, Impacts and Vulnerability in Europe 2016: An Indicator-Based Report; European Environment Agency: Luxembourg, 2017.
- Gobiet, A.; Kotlarski, S.; Beniston, M.; Heinrich, G.; Rajczak, J.; Stoffel, M. 21st century climate change in the European Alps—A review. Sci. Total Environ. 2014, 493, 1138–1151. [Google Scholar] [CrossRef]
- Zebisch, M.; Vaccaro, R.; Bertoldi, G.; Obojes, N.; Niedrist, G.; Seeber, J.; Scheiderbauer, S.; Schlogel, R.; Kofler, C.; Vigl, L.S.; et al. Klimareport Südtirol 2018; Eurac Research: Bolzano, Italy, 2018. [Google Scholar]
- Bienvenido-Huertas, D.; León-Muñoz, M.; Martín-del-Río, J.J.; Rubio-Bellido, C. Analysis of climate change impact on the preservation of heritage elements in historic buildings with a deficient indoor microclimate in warm regions. Build. Environ. 2021, 200, 107959. [Google Scholar] [CrossRef]
- Verticchio, E.; Frasca, F.; Bertolin, C.; Siani, A.M. Climate-induced risk for the preservation of paper collections: Comparative study among three historic libraries in Italy. Build. Environ. 2021, 206, 108394. [Google Scholar] [CrossRef]
- Coelho, G.B.A.; Silva, H.E.; Henriques, F.M.A. Impact of climate change on cultural heritage: A simulation study to assess the risks for conservation and thermal comfort. Int. J. Glob. Warm. 2019, 19, 382–406. [Google Scholar] [CrossRef]
- Pioppi, B.; Pigliautile, I.; Piselli, C.; Pisello, A.L. Cultural heritage microclimate change: Human-centric approach to experimentally investigate intra-urban overheating and numerically assess foreseen future scenarios impact. Sci. Total Environ. 2020, 703, 134448. [Google Scholar] [CrossRef]
- Shaviv, E.; Yezioro, A.; Capeluto, I.G. Thermal mass and night ventilation as passive cooling design strategy. Renew. Energy 2001, 24, 445–452. [Google Scholar] [CrossRef]
- Gagliano, A.; Patania, F.; Nocera, F.; Signorello, C. Assessment of the dynamic thermal performance of massive buildings. Energy Build. 2014, 72, 361–370. [Google Scholar] [CrossRef]
- Peacock, A.D.; Jenkins, D.P.; Kane, D. Investigating the potential of overheating in UK dwellings as a consequence of extant climate change. Energy Policy 2010, 38, 3277–3288. [Google Scholar] [CrossRef]
- Caro, R.; Sendra, J.J. Are the dwellings of historic Mediterranean cities cold in winter? A field assessment on their indoor environment and energy performance. Energy Build. 2021, 230, 110567. [Google Scholar] [CrossRef]
- Hao, L.; Herrera-Avellanosa, D.; del Pero, C.; Troi, A. What Are the Implications of Climate Change for Retrofitted Historic Buildings? A Literature Review. Sustainability 2020, 12, 7557. [Google Scholar]
- Muñoz González, C.M.; León Rodríguez, A.L.; Suárez Medina, R.; Ruiz Jaramillo, J. Effects of future climate change on the preservation of artworks, thermal comfort and energy consumption in historic buildings. Appl. Energy 2020, 276, 115483. [Google Scholar] [CrossRef]
- Yang, Y.; Javanroodi, K.; Nik, V.M. Climate change and energy performance of European residential building stocks—A comprehensive impact assessment using climate big data from the coordinated regional climate downscaling experiment. Appl. Energy 2021, 298, 117246. [Google Scholar] [CrossRef]
- IEA. 2019 Global Status Report for Buildings and Construction towards a Zero-Emissions, Efficient and Resilient Buildings and Construction Sector. 2019. Available online: https://www.worldgbc.org/news-media/2019-global-status-report-buildings-and-construction (accessed on 14 July 2022).
- Filippidou, F.; Jimenez Navarro, J.P. Achieving the Cost-Effective Energy Transformation of Europe’s Buildings; Joint Research Centre: Luxembourg, 2019. [Google Scholar]
- Buda, A.; de Place Hansen, E.J.; Rieser, A.; Giancola, E.; Pracchi, V.N.; Mauri, S.; Marincioni, V.; Gori, V.; Fouseki, K.; Polo López, C.S.; et al. Conservation-Compatible Retrofit Solutions in Historic Buildings: An Integrated Approach. Sustainability 2021, 13, 2927. [Google Scholar] [CrossRef]
- Posani, M.; Veiga, M.D.R.; de Freitas, V.P. Towards Resilience and Sustainability for Historic Buildings: A Review of Envelope Retrofit Possibilities and a Discussion on Hygric Compatibility of Thermal Insulations. Int. J. Archit. Herit. 2019, 15, 807–823. [Google Scholar] [CrossRef]
- Corominas, I.; Tabares, J.; Fonseca, I.; Casas, A.; Fonseca, I.; Casas, P. Contribution of Thermal Inertia to the Interior Climate of Girona Cathedral: Feasibility Analysis for the Preservation of Pieces of Art through the Monitoring of Thermal Conditions for 6 Years. Energies 2022, 15, 1571. [Google Scholar] [CrossRef]
- Chvatal, K.M.S.; Corvacho, H. The impact of increasing the building envelope insulation upon the risk of overheating in summer and an increased energy consumption. J. Build. Perform. Simul. 2009, 2, 267–282. [Google Scholar] [CrossRef]
- Tink, V.; Porritt, S.; Allinson, D.; Loveday, D. Measuring and mitigating overheating risk in solid wall dwellings retrofitted with internal wall insulation. Build. Environ. 2018, 141, 247–261. [Google Scholar] [CrossRef]
- Cirami, S.; Evola, G.; Gagliano, A.; Margani, G. Thermal and Economic Analysis of Renovation Strategies for a Historic Building in Mediterranean Area. Buildings 2017, 7, 60. [Google Scholar] [CrossRef]
- Bay, E.; Martinez-Molina, A.; Dupont, W.A. Assessment of natural ventilation strategies in historical buildings in a hot and humid climate using energy and CFD simulations. J. Build. Eng. 2022, 51, 104287. [Google Scholar] [CrossRef]
- Caro, R.; Sendra, J.J. Evaluation of indoor environment and energy performance of dwellings in heritage buildings. The case of hot summers in historic cities in Mediterranean Europe. Sustain. Cities Soc. 2020, 52, 101798. [Google Scholar] [CrossRef]
- Hao, L.; Herrera-Avellanosa, D.; Del Pero, C.; Troi, A. Categorization of South Tyrolean Built Heritage with Consideration of the Impact of Climate. Climate 2019, 7, 139. [Google Scholar] [CrossRef] [Green Version]
- Hydrographic Office of the Autonomous Province of Bolzano-Südtirol. Available online: https://weather.provinz.bz.it/ (accessed on 2 April 2022).
- Jacob, D.; Petersen, J.; Eggert, B.; Alias, A.; Christensen, O.B.; Bouwer, L.M.; Braun, A.; Colette, A.; Déqué, M.; Georgievski, G. EURO-CORDEX: New high-resolution climate change projections for European impact research. Reg. Environ. Chang. 2014, 14, 579–581. [Google Scholar] [CrossRef] [Green Version]
- Wilcke, R.A.I.; Bärring, L. Selecting regional climate scenarios for impact modelling studies. Environ. Model. Softw. 2016, 78, 191–201. [Google Scholar] [CrossRef] [Green Version]
- Thomas, M.; Andreas, G. Selecting climate simulations for impact studies based on multivariate patterns of climate change. Clim. Chang. 2016, 135, 381–393. [Google Scholar] [CrossRef]
- Hagemann, S.; Chen, C.; Haerter, J.O.; Heinke, J.; Gerten, D.; Piani, C. Impact of a Statistical Bias Correction on the Projected Hydrological Changes Obtained from Three GCMs and Two Hydrology Models. J. Hydrometeorol. 2011, 12, 556–578. [Google Scholar] [CrossRef]
- Meyer, J.; Kohn, I.; Stahl, K.; Hakala, K.; Seibert, J.; Cannon, A.J. Effects of univariate and multivariate bias correction on hydrological impact projections in alpine catchments. Hydrol. Earth Syst. Sci. 2019, 23, 1339–1354. [Google Scholar] [CrossRef] [Green Version]
- CIBSE. CIBSE Guide A, 7th ed.; Issue 2; Environmental Design: London, UK, 2007. [Google Scholar]
- ISO 17772-1:2017; Energy Performance of Buildings—Indoor Environmental Quality—Part 1: Indoor Environmental Input Parameters for the Design and Assessment of Energy Performance of Buildings. British Standards Institution: London, UK, 2017.
- Wilson, E.; Metzger, C.E.; Horowitz, S.; Hendron, R. 2014 Building America House Simulation Protocols; National Renewable Energy Laboratory: Golden, CO, USA, 2014.
- Eskola, L.; Alev, Û.; Arumägi, E.; Jokisalo, J.; Donarelli, A.; Kai, S.; Kalamees, T. Airtightness, Air Exchange and Energy Performance in Historic Residential Buildings with Different Structures. Int. J. Vent. 2016, 14, 11–26. [Google Scholar] [CrossRef]
- Johnston, D.; Miles-Shenton, D.; Bell, M. Airtightness of UK dwelling: Some recent measurements. In Proceedings of the COBRA 2004 RICS Foundation Construction and Building Research Conference, Leeds, UK, 7–8 September 2004. [Google Scholar]
- CasaClima. Criteri CasaClima: Per L’esecuzione Delle Prove di Tenuta all’aria; Agenzia per I’Energia Alto Adige CasaClima: Bolzano, Italy, 2015; Available online: https://www.agenziacasaclima.it/it/direttiva-casaclima-blower-door-test--10-1141.html (accessed on 14 July 2022).
- EN 15251; Indoor Environmental Input Parameters for Design and Assessment of Energy Performance of Buildings-Addressing Indoor Air Quality, Thermal Environment, Lighting and Acoustics. British Standards Institution: London, UK, 2007.
- Rahif, R.; Amaripadath, D.; Attia, S. Review on Time-Integrated Overheating Evaluation Methods for Residential Buildings in Temperate Climates of Europe. Energy Build. 2021, 252, 111463. [Google Scholar] [CrossRef]
- Carlucci, S.; Bai, L.; de Dear, R.; Yang, L. Review of adaptive thermal comfort models in built environmental regulatory documents. Build. Environ. 2018, 137, 73–89. [Google Scholar] [CrossRef] [Green Version]
- Lavaysse, C.; Cammalleri, C.; Dosio, A.; van der Schrier, G.; Toreti, A.; Vogt, J. Towards a monitoring system of temperature extremes in Europe. Nat. Hazards Earth Syst. Sci. 2018, 18, 91–104. [Google Scholar] [CrossRef] [Green Version]
- Nicol, J.F.; Humphreys, M.A. Adaptive thermal comfort and sustainable thermal standards for buildings. Energy Build. 2002, 34, 563–572. [Google Scholar] [CrossRef]
- Moujalled, B.; Cantin, R.; Guarracino, G. Comparison of thermal comfort algorithms in naturally ventilated office buildings. Energy Build. 2008, 40, 2215–2223. [Google Scholar] [CrossRef]
- Ozarisoy, B.; Elsharkawy, H. Assessing overheating risk and thermal comfort in state-of-the-art prototype houses that combat exacerbated climate change in UK. Energy Build. 2019, 187, 201–217. [Google Scholar] [CrossRef] [Green Version]
- Rempel, A.R.; Danis, J.; Rempel, A.W.; Fowler, M.; Mishra, S. Improving the passive survivability of residential buildings during extreme heat events in the Pacific Northwest. Appl. Energy 2022, 321, 119323. [Google Scholar] [CrossRef]
- Hamdy, M.; Carlucci, S.; Hoes, P.-J.; Hensen, J.L.M. The impact of climate change on the overheating risk in dwellings—A Dutch case study. Build. Environ. 2017, 122, 307–323. [Google Scholar] [CrossRef]
- Cho, H.M.; Yang, S.; Wi, S.; Chang, S.J.; Kim, S. Hygrothermal and energy retrofit planning of masonry façade historic building used as museum and office: A cultural properties case study. Energy 2020, 201, 117607. [Google Scholar] [CrossRef]
- Ide, L.; Gutland, M.; Bucking, S.; Santana Quintero, M. Balancing Trade-offs between Deep Energy Retrofits and Heritage Conservation: A Methodology and Case Study. Int. J. Archit. Herit. 2022, 16, 97–116. [Google Scholar] [CrossRef]
- Fosas, D.; Coley, D.A.; Natarajan, S.; Herrera, M.; Fosas de Pando, M.; Ramallo-Gonzalez, A. Mitigation versus adaptation: Does insulating dwellings increase overheating risk? Build. Environ. 2018, 143, 740–759. [Google Scholar] [CrossRef]


| Zone I | Zone II | Zone III | |
|---|---|---|---|
| Average T of coldest month | 0 °C–18 °C | ≤0 °C | ≤0 °C |
| Average annual precipitation | ≤825.2 mm | ≤825.2 mm | >825.2 mm |
| Altitude | 190–600 m | 601–1300 m | >1300 m |
| Description | Relatively warm and dry | Relatively cold and dry | Relatively cold and wet |
| Acronym | GCMs | RCMs | RCP |
|---|---|---|---|
| M1 | ICHEC-EC-EARTH | DMI-HIRHAM 5 | 8.5 |
| M2 | ICHEC-EC-EARTH | SMHI-RCA 4 | 8.5 |
| M3 | IPSL-IPSL-CM5A-MR | SMHI-RCA 4 | 8.5 |
| M4 | MPI-M-MPI-ESM-LR | CLMcom-CCLM 4 | 8.5 |
| Reference Building | Year | Main Façade Orientation | Ground Floor Area [m2] | No. of Floor | W-to-W Ratio (South) | Living Area [m2] | Office Area [m2] | Commercial Area [m2] |
|---|---|---|---|---|---|---|---|---|
| Portici I | 12th century | South & West | 233.25 | 4 | 0.22 | 462.83 | 273.33 | 87.39 |
| Portici II | 14th century | South & North | 230.53 | 3 | 0.16 | 364.44 | 195.77 | 61.34 |
| Type | Construction | Retrofit Solutions | Ub | Ua |
|---|---|---|---|---|
| External wall |  Masonry wall, 58 cm | 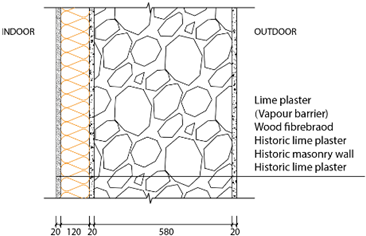 Internal insulation system: Wood fiberboard, 12 cm | 2.59 | 0.28 |
| Internal wall | Masonry wall, 35 cm | - | 3.96 | 3.96 |
| Roof | 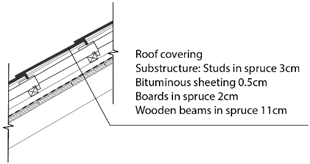 Timber rafters with wooden casing and roof tiles on top | 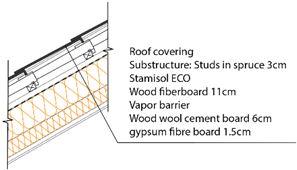 Insulation panel between and under the roof beams: Wood fibreboard, 20 cm | 5.6 | 0.17 |
| Internal floor | Wood floor with clay-sand in-between | - | 1.54 | 1.54 |
| Foundation | 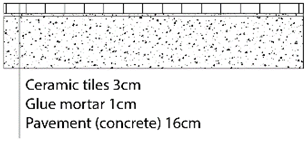 Tamped earth and concrete pavement | 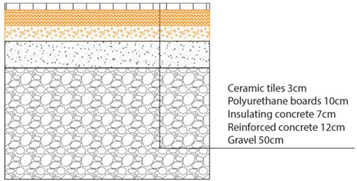 Insulation system: Polyurethane boards,10 cm | 4.19 | 0.25 |
| Window | Single glazed window | Double glazed window | 3 | 1.1 |
| Parameters | Value | ||
|---|---|---|---|
| Climate Zone I | Climate Zone II | ||
| Heating period | 15 October–15 April, 14 h/day | 15 September–15 May, whole day | |
| Setpoint temperature | Occupied hours | 22 °C | 22 °C |
| Un-occupied hours | 18 °C | 18 °C | |
| Occupants’ density | Residence | 28.3 m2/person | |
| Shops and offices | 17 m2/person | ||
| Infiltration rate | Before retrofit | 10 ac/h, at 50 Pa | |
| After retrofit | 1.5 ac/h, at 50 Pa | ||
| Ventilation rate (ventilation is active when:) | The room is occupied, indoor temperature is higher than 24 °C, and the difference between indoor and outdoor temperature is higher than 3 °C | ||
| HVAC system | Without any mechanical cooling or ventilation system; heating system is simulated with ideal loads air system | ||
| Climate Zone | Climate Scenarios | Annual Average Temperature (°C) | Annual Average Tropical Night | Annual Average Summer Days | Average No. of HWs per Year | Average Length of HWs (Day) | Longest HWs (Day) | |
|---|---|---|---|---|---|---|---|---|
| I | P | 13.1 | 15.6 | 118.5 | 0.5 | 3.7 | 5.0 | |
| F1 | M1 | 14 | 23.5 | 101.2 | 0.7 | 3.4 | 5.0 | |
| M2 | 15.3 | 47.1 | 122.2 | 0.3 | 3.7 | 4.0 | ||
| M3 | 14.2 | 33.9 | 120.3 | 0.2 | 3.5 | 4.0 | ||
| M4 | 13.7 | 25.7 | 108.5 | 0.6 | 3.7 | 5.0 | ||
| F2 | M1 | 16.1 | 68.2 | 134.4 | 0.9 | 3.8 | 5.0 | |
| M2 | 19.2 | 104.0 | 151.6 | 0.2 | 5.5 | 6.0 | ||
| M3 | 18.2 | 102.8 | 141.1 | 0.8 | 3.4 | 4.0 | ||
| M4 | 16.3 | 61.3 | 131.9 | 1.1 | 3.7 | 6.0 | ||
| II | P | 10.6 | 0.4 | 58.5 | 0.6 | 3.0 | 3.0 | |
| F1 | M1 | 11.1 | 0.3 | 60.7 | 0.5 | 3.8 | 5.0 | |
| M2 | 12.8 | 8.4 | 88.3 | 0.6 | 4.0 | 6.0 | ||
| M3 | 11.9 | 6.4 | 77.5 | 0.7 | 3.4 | 5.0 | ||
| M4 | 11.3 | 1.0 | 69.5 | 0.5 | 3.2 | 4.0 | ||
| F2 | M1 | 13.5 | 10.2 | 98.3 | 0.8 | 4.3 | 7.0 | |
| M2 | 16.7 | 41.8 | 133.2 | 0.8 | 3.9 | 6.0 | ||
| M3 | 16.2 | 54.2 | 123.1 | 0.9 | 3.9 | 6.0 | ||
| M4 | 13.9 | 21.4 | 114.4 | 0.8 | 3.4 | 4.0 | ||
| P | F1 | F2 | ||||||||
|---|---|---|---|---|---|---|---|---|---|---|
| M1 | M2 | M3 | M4 | M1 | M2 | M3 | M4 | |||
| Portici house I | CIBSE-A | 1653.1 (28.8%) | 1707.6 (29.8%) | 1880.8 (32.8%) | 1789.9 (31.2%) | 1714.8 (29.9%) | 2051.8 (35.8%) | 2383.4 (41.6%) | 2264.1 (39.5%) | 2061.8 (35.9%) |
| EN15251 | 717.9 (20.5%) | 659.1 (17.9%) | 804.4 (20.9%) | 744.9 (20.8%) | 641 (17.8%) | 808.1 (20.7%) | 1301.4 (24.8%) | 1236.8 (31.6%) | 1060.6 (27.9%) | |
| Portici house II | CIBSE-A | 343.8 (6.0%) | 543.4 (9.5%) | 1146.5 (20.0%) | 1019.3 (17.8%) | 721.6 (12.6%) | 1190.8 (20.8%) | 1919.5 (33.5%) | 1912.4 (33.3%) | 1553.9 (27.1%) |
| EN15251 | 90.7 (2.9%) | 115.8 (3.6%) | 129.6 (3.8%) | 151.9 (4.7%) | 132.3 (4.2%) | 116.6 (3.3%) | 536.6 (12.3%) | 561.9 (13.7%) | 324.3 (9.2%) | |
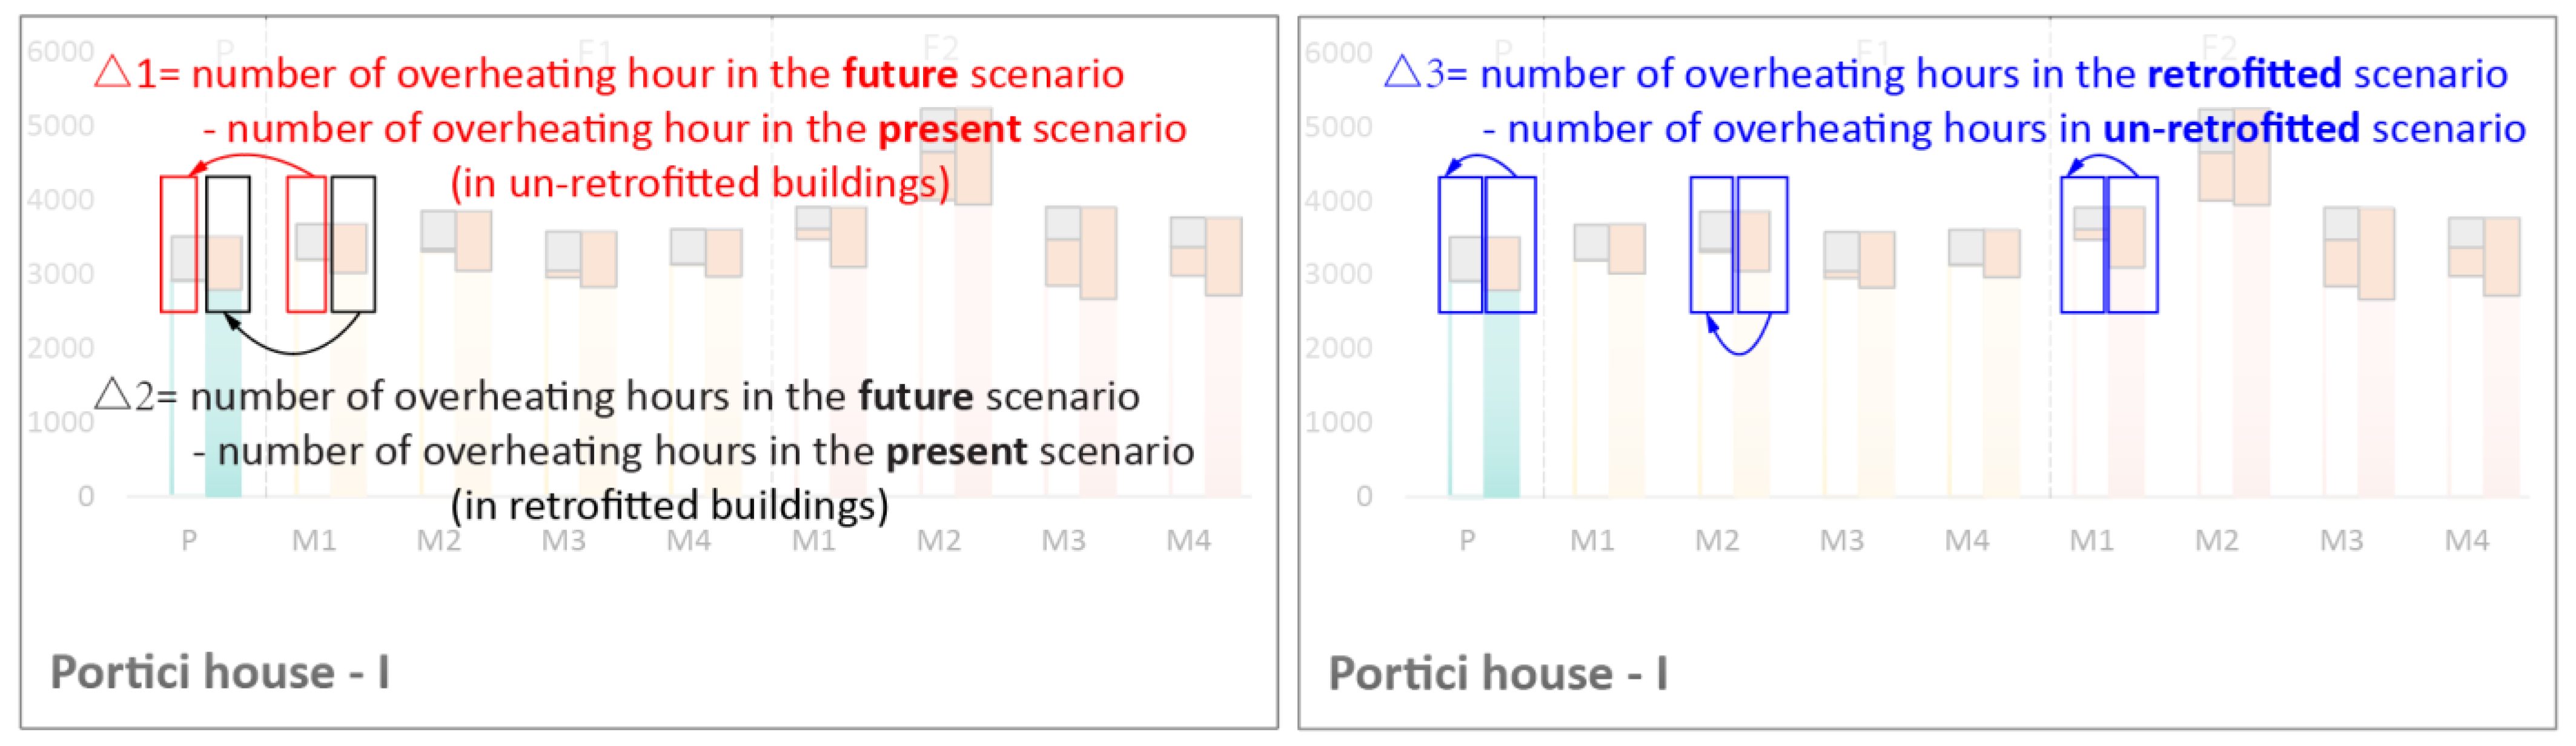
| P | F1 | F2 | ||||||||
|---|---|---|---|---|---|---|---|---|---|---|
| M1 | M2 | M3 | M4 | M1 | M2 | M3 | M4 | |||
| Portici house-I | Δ1 | - | 2 | 34 | 90 | 10 | 138 | 650 | 624 | 384 |
| Δ2 | - | −59 | 87 | 27 | −77 | 90 | 584 | 519 | 333 | |
| Δ3 | 715 | 654 | 767 | 652 | 627 | 667 | 648 | 690 | 664 | |
| Portici house-II | Δ1 | - | 0 | 21 | 29 | 0 | 17 | 318 | 318 | 130 |
| Δ2 | - | 25 | 39 | 61 | 42 | 26 | 446 | 471 | 234 | |
| Δ3 | 91 | 116 | 109 | 123 | 132 | 99 | 219 | 244 | 194 | |
| No. of Options | Adaptive Solutions | Details |
|---|---|---|
| 1 | Less insulation | The thickness of insulation for external walls is 6 cm while the insulation for roof and ground floor remains unchanged. |
| 2 | Extra shading | The wooden shutter of the window is on when the indoor temperature is higher than 24 °C. |
| 3 | Extra thermal mass | 3.6 m3 natural stone, with a volumetric heat capacity equivalent to 2.1 MJ/m3K, added as floor slabs. |
| 4 | New ventilation strategy (a) | The ventilation is active when (i) the room is occupied, (ii) Ti > 24 °C, Te >18 °C, (iii) Ti > Te (the difference with the original ventilation is that the original ventilation is active when Ti > Te + 3 °C). |
| 5 | New ventilation strategy (b) | The ventilation is active when (i) Ti > 24 °C, Te >18 °C and (ii) Ti > Te + 3 °C. (the room does not have to be occupied) |
| I-Portici House | II-Portici House | |||||
|---|---|---|---|---|---|---|
| P | F1 | F2 | P | F1 | F2 | |
| Un-retrofitted | 3.2 | 37.2 | 653.7 | 0 | 20.9 | 318 |
| Retrofitted with current practice | 717.9 | 804.4 | 1301.5 | 90.7 | 129.6 | 536.6 |
| 1-Less insulation | 584.5 | 730.1 | 1249.8 | 19 | 64.3 | 445.1 |
| 2-Extra shading | 350.4 | 481.7 | 1088 | 51.2 | 80.1 | 425.8 |
| 3-Extra thermal mass | 572.7 | 690.4 | 1334.5 | 84.5 | 108.8 | 494.8 |
| 4-Ventilation strategy-a | 660.4 | 880.5 | 1445 | 82.5 | 81.4 | 386.2 |
| 5-Ventilation strategy-b | 346.7 | 429.5 | 927.2 | 46.8 | 38 | 160.8 |
| Combination of 2,4,5 | 78.6 | 53.3 | 376.9 | 11.1 | 7.1 | 74.6 |
Publisher’s Note: MDPI stays neutral with regard to jurisdictional claims in published maps and institutional affiliations. |
© 2022 by the authors. Licensee MDPI, Basel, Switzerland. This article is an open access article distributed under the terms and conditions of the Creative Commons Attribution (CC BY) license (https://creativecommons.org/licenses/by/4.0/).
Share and Cite
Hao, L.; Herrera-Avellanosa, D.; Del Pero, C.; Troi, A. Overheating Risks and Adaptation Strategies of Energy Retrofitted Historic Buildings under the Impact of Climate Change: Case Studies in Alpine Region. Appl. Sci. 2022, 12, 7162. https://doi.org/10.3390/app12147162
Hao L, Herrera-Avellanosa D, Del Pero C, Troi A. Overheating Risks and Adaptation Strategies of Energy Retrofitted Historic Buildings under the Impact of Climate Change: Case Studies in Alpine Region. Applied Sciences. 2022; 12(14):7162. https://doi.org/10.3390/app12147162
Chicago/Turabian StyleHao, Lingjun, Daniel Herrera-Avellanosa, Claudio Del Pero, and Alexandra Troi. 2022. "Overheating Risks and Adaptation Strategies of Energy Retrofitted Historic Buildings under the Impact of Climate Change: Case Studies in Alpine Region" Applied Sciences 12, no. 14: 7162. https://doi.org/10.3390/app12147162
APA StyleHao, L., Herrera-Avellanosa, D., Del Pero, C., & Troi, A. (2022). Overheating Risks and Adaptation Strategies of Energy Retrofitted Historic Buildings under the Impact of Climate Change: Case Studies in Alpine Region. Applied Sciences, 12(14), 7162. https://doi.org/10.3390/app12147162