
Prediction of Intracranial Aneurysm Rupture Risk Using Non-Invasive Radiomics Analysis Based on Follow-Up Magnetic Resonance Angiography Images: A Preliminary Study

Abstract
:Featured Application
Abstract
1. Introduction
2. Materials and Methods
2.1. Patient Data
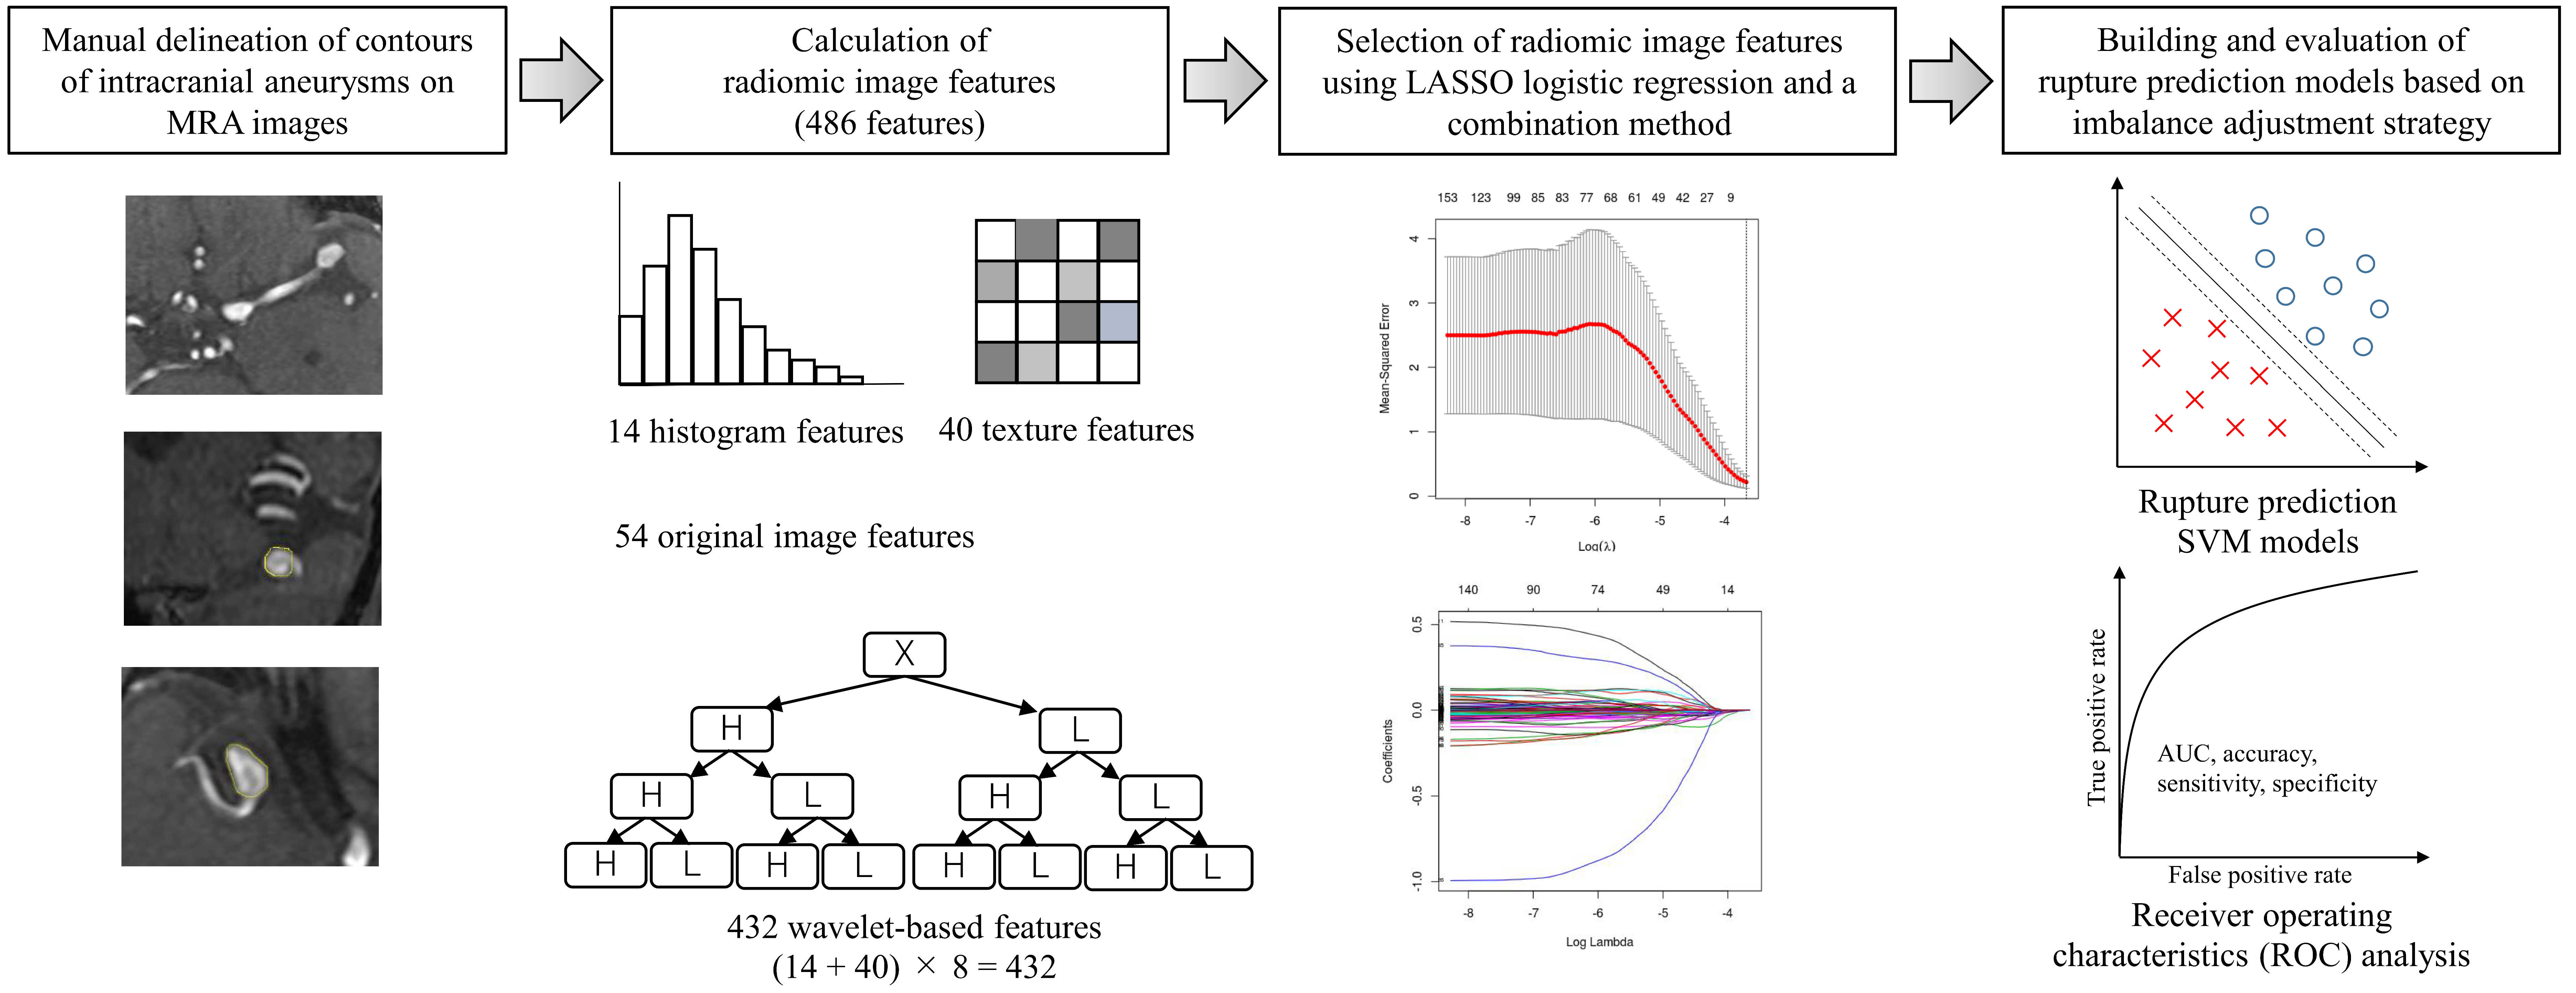
2.2. Calculation of Radiomics Image Features
2.3. Selection of Radiomic Features Using LASSO Logistic Regression
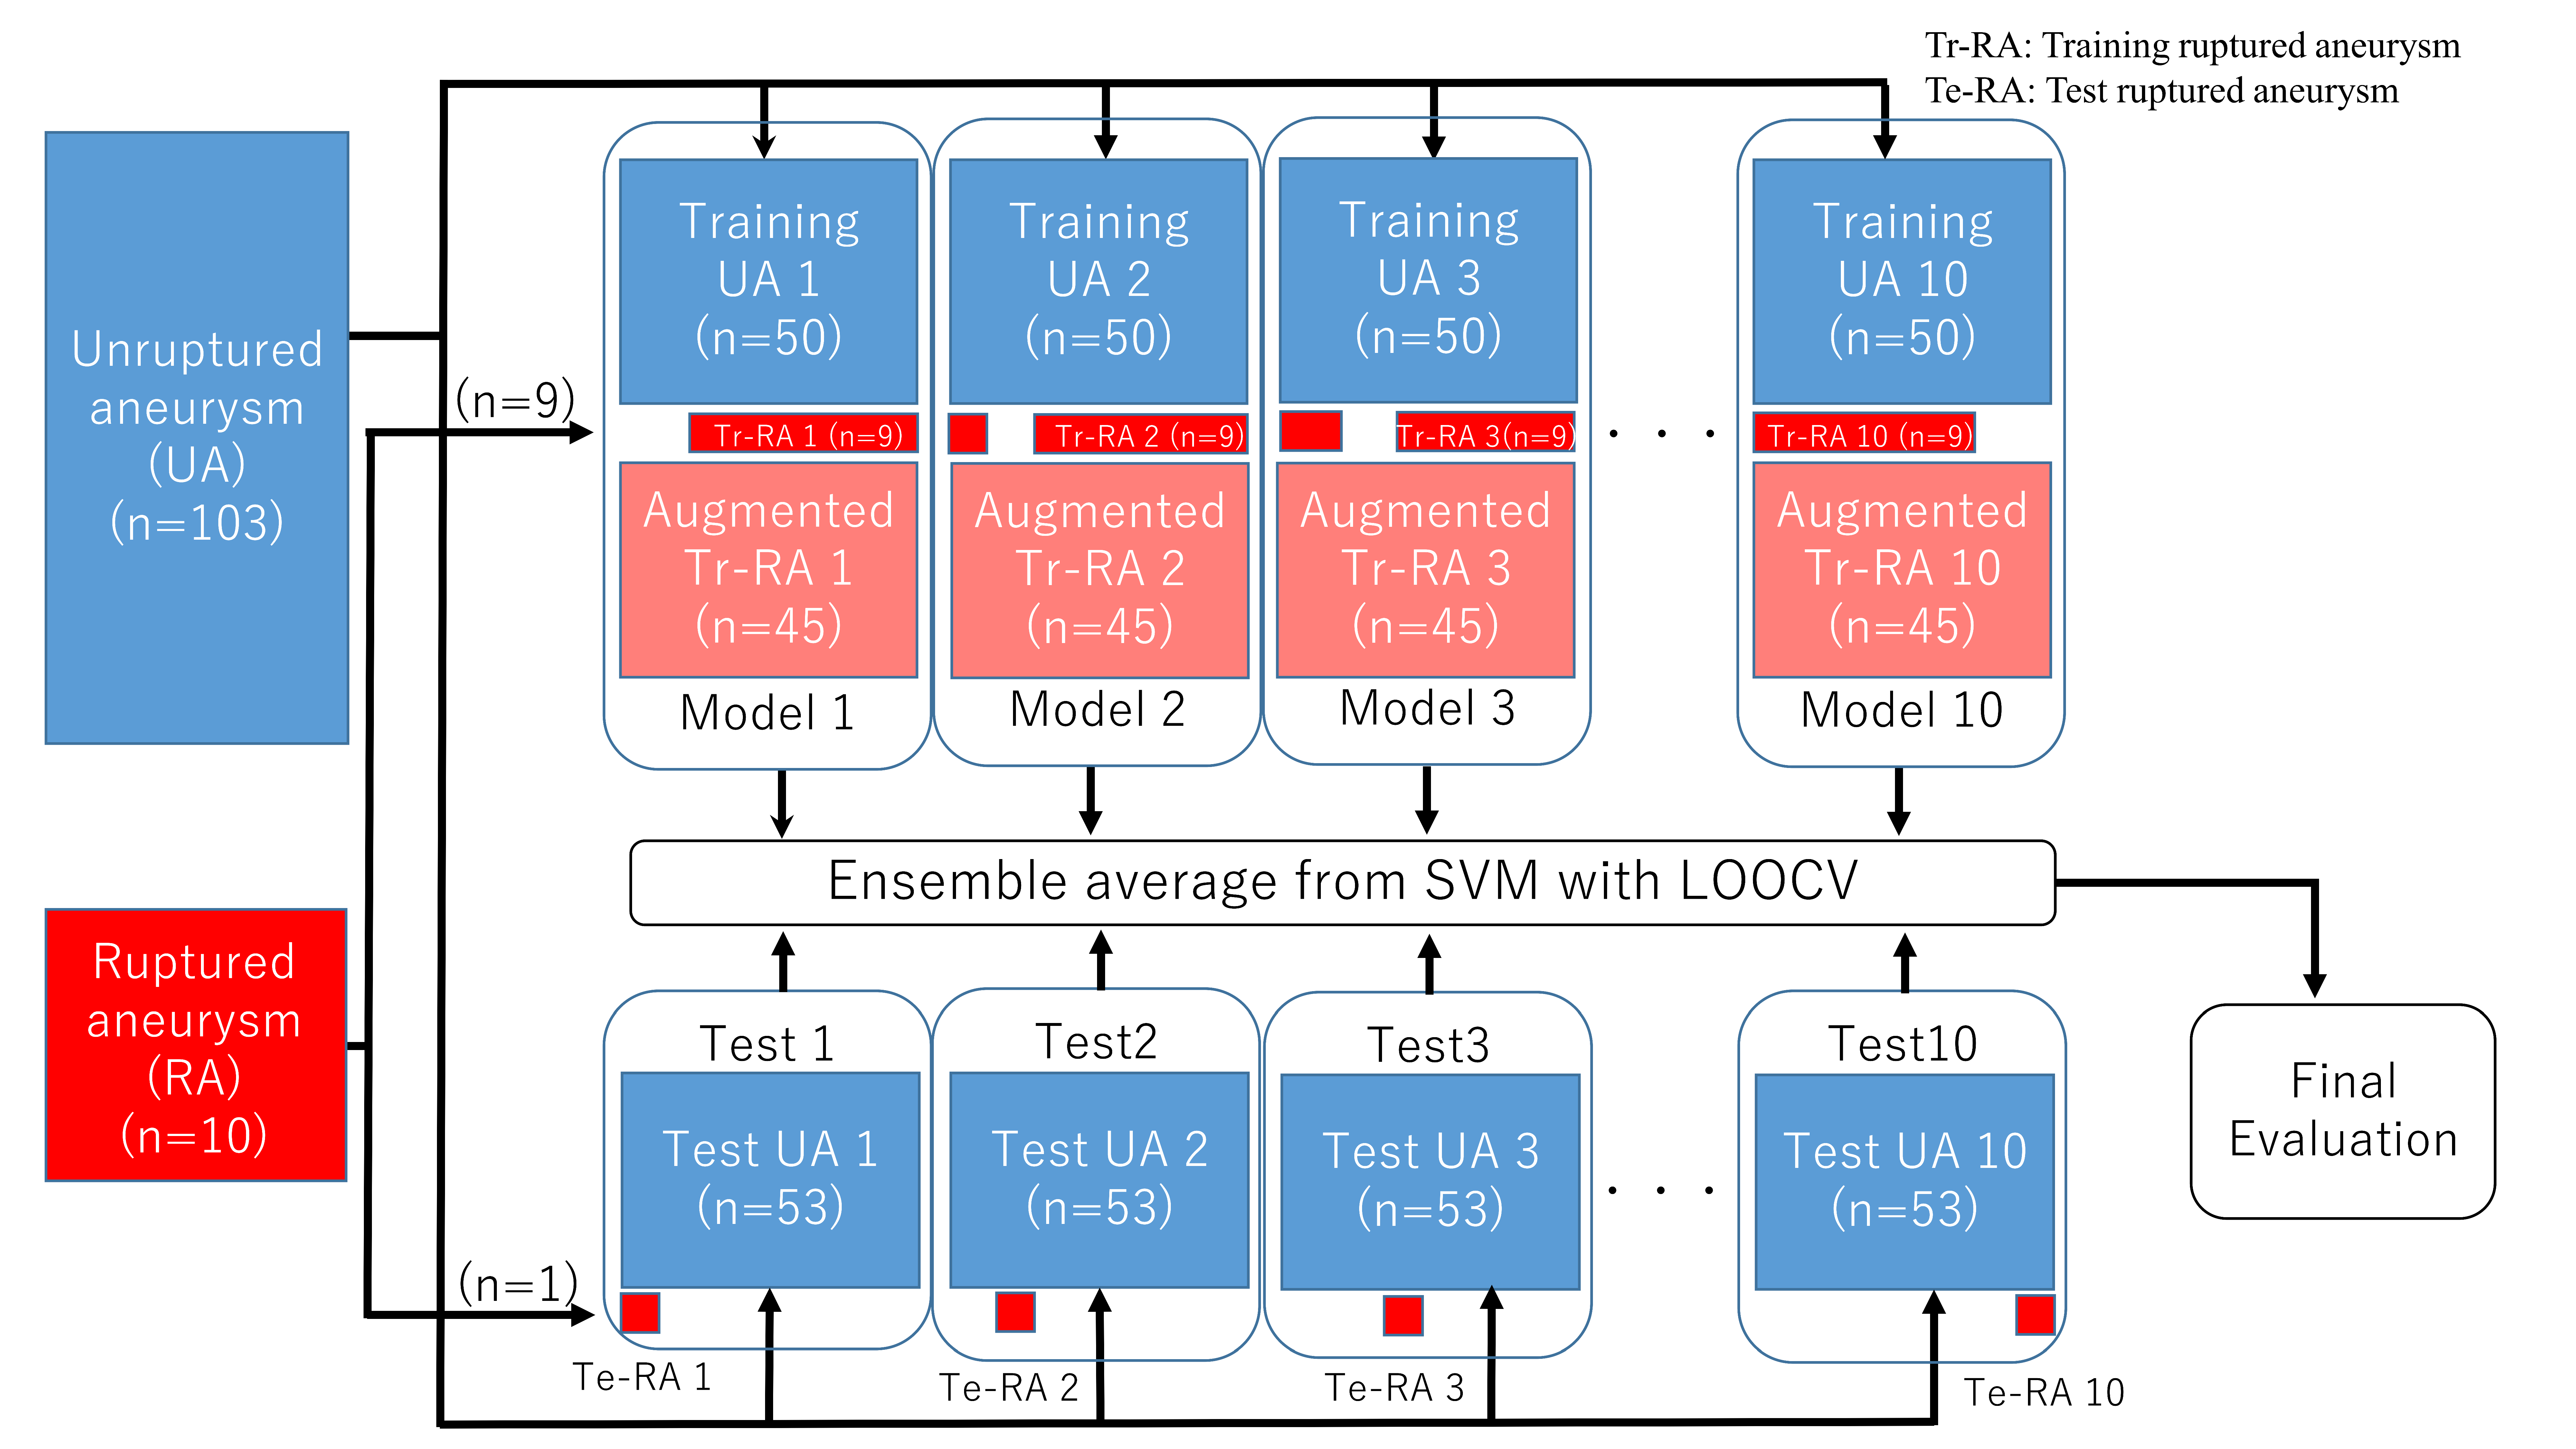
2.4. Building and Evaluating Rupture Prediction Models Based on Imbalance Adjustment Strategy
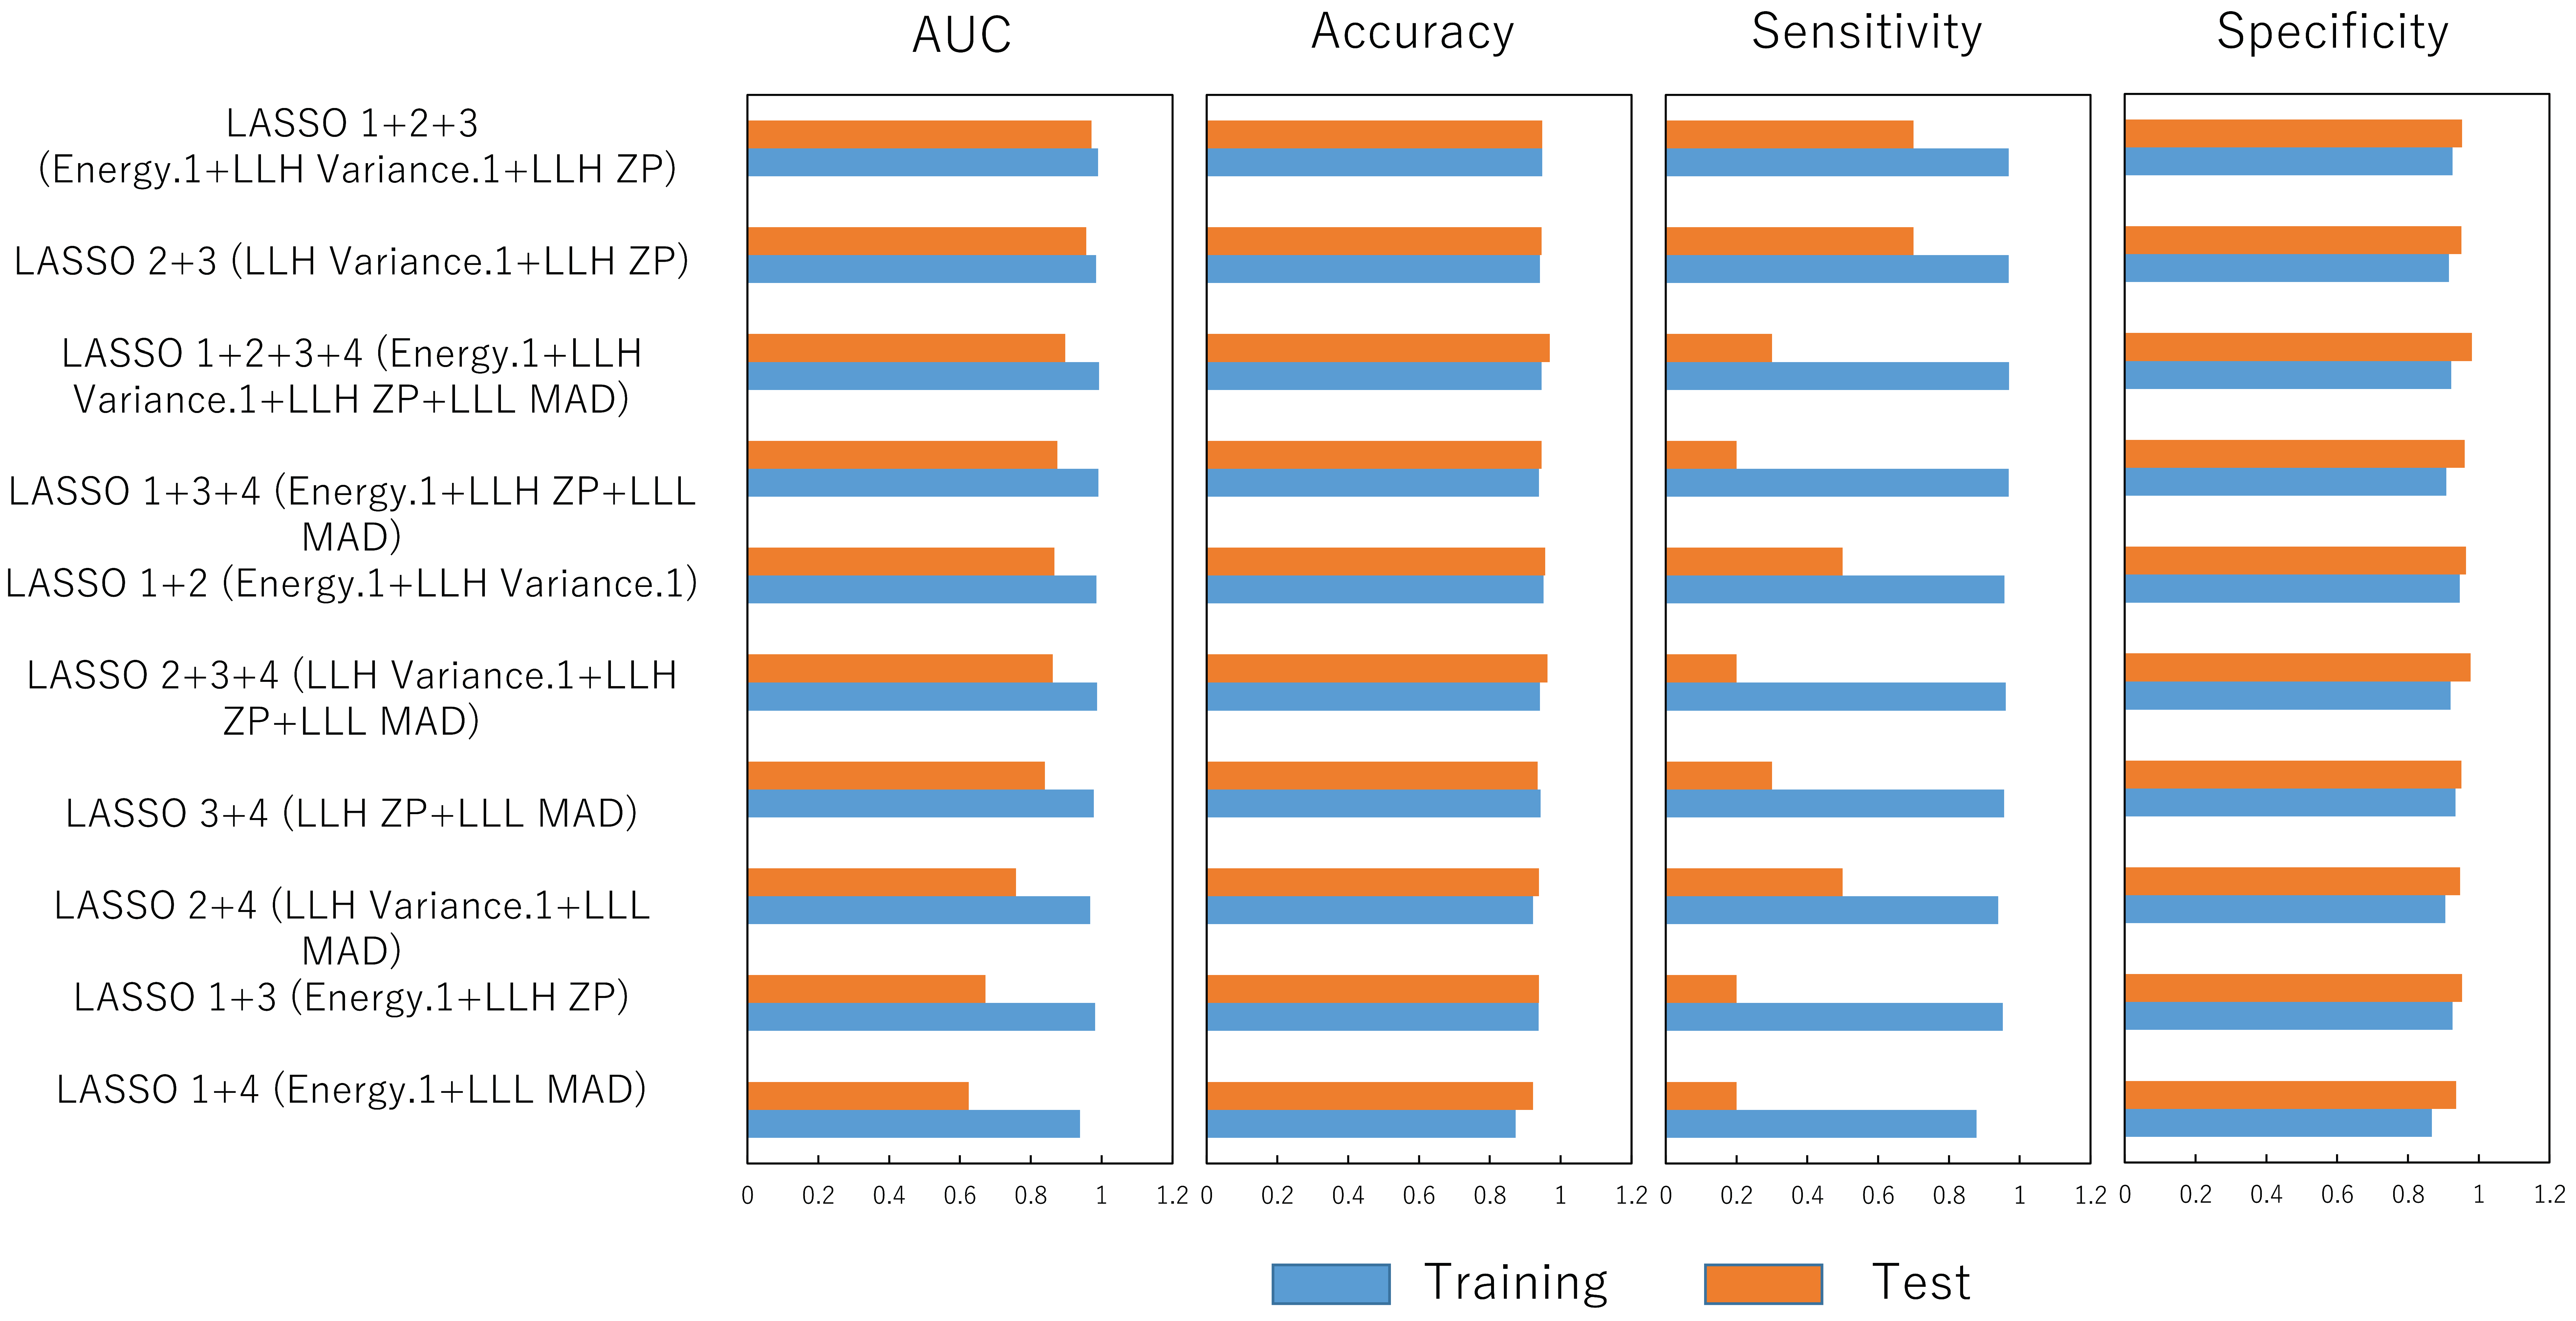
3. Results
4. Discussion
5. Conclusions
Supplementary Materials
Author Contributions
Funding
Institutional Review Board Statement
Informed Consent Statement
Data Availability Statement
Acknowledgments
Conflicts of Interest
References
- van Gijn, J.; Rinkel, G.J. Subarachnoid haemorrhage: Diagnosis, causes and management. Brain 2001, 124, 249–278. [Google Scholar] [CrossRef] [PubMed]
- UCAS Japan Investigators; Morita, A.; Kirino, T.; Hashi, K.; Aoki, N.; Fukuhara, S.; Hashimoto, N.; Nakayama, T.; Sakai, M.; Teramoto, A.; et al. The natural course of unruptured cerebral aneurysms in a Japanese cohort. N. Engl. J. Med. 2012, 366, 2474–2482. [Google Scholar] [CrossRef] [PubMed]
- The Japan Stroke Society. Japanese Guidelines for the Management of Stroke 2015; The Japan Stroke Society: Kyowa Kikaku, Tokyo, 2015. [Google Scholar]
- Raaymakers, T.W.; Rinkel, G.J.; Limburg, M.; Algra, A. Mortality and morbidity of surgery for unruptured intracranial aneurysms: A meta-analysis. Stroke 1998, 29, 1531–1538. [Google Scholar] [CrossRef] [PubMed]
- Nakagawa, D.; Nagahama, Y.; Policeni, B.A.; Raghavan, M.L.; Dillard, S.I.; Schumacher, A.L.; Sarathy, S.; Dlouhy, B.J.; Wilson, S.; Allan, L.; et al. Accuracy of detecting enlargement of aneurysms using different MRI modalities and measurement protocols. J. Neurosurg. 2018, 130, 559–565. [Google Scholar] [CrossRef] [PubMed]
- Sailer, A.M.; Wagemans, B.A.; Nelemans, P.J.; de Graaf, R.; van Zwam, W.H. Diagnosing intracranial aneurysms with MR angiography: Systematic review and meta-analysis. Stroke 2014, 45, 119–126. [Google Scholar] [CrossRef]
- Keedy, A. An overview of intracranial aneurysms. McGill J. Med. 2006, 9, 141–146. [Google Scholar] [CrossRef]
- Groth, M.; Forkert, N.D.; Buhk, J.H.; Schoenfeld, M.; Goebell, E.; Fiehler, J. Comparison of 3D computer-aided with manual cerebral aneurysm measurements in different imaging modalities. Neuroradiology 2013, 55, 171–178. [Google Scholar] [CrossRef]
- Liu, Q.L.; Jiang, P.; Jiang, Y.H.; Ge, H.J.; Li, S.L.; Jin, H.W.; Li, Y.X. Prediction of Aneurysm Stability Using a Machine Learning Model Based on PyRadiomics- Derived Morphological Features. Stroke 2019, 50, 2314–2321. [Google Scholar] [CrossRef]
- Ludwig, C.G.; Lauric, A.; Malek, J.A.; Mulligan, R.; Malek, A.M. Performance of Radiomics derived morphological features for prediction of aneurysm rupture status. J. Neurointerv. Surg. 2021, 13, 755–761. [Google Scholar] [CrossRef]
- Alwalid, O.; Long, X.; Xie, M.; Yang, J.; Cen, C.; Liu, H.; Han, P. CT Angiography-Based Radiomics for Classification of Intracranial Aneurysm Rupture. Front. Neurol. 2021, 12, 619864. [Google Scholar] [CrossRef]
- Zhu, D.; Chen, Y.; Zheng, K.; Chen, C.; Li, Q.; Zhou, J.; Jia, X.; Xia, N.; Wang, H.; Lin, B.; et al. Classifying Ruptured Middle Cerebral Artery Aneurysms With a Machine Learning Based, Radiomics-Morphological Model: A Multicentral Study. Front. Neurosci. 2021, 15, 721268. [Google Scholar] [CrossRef] [PubMed]
- Tong, X.; Feng, X.; Peng, F.; Niu, H.; Zhang, B.; Yuan, F.; Jin, W.; Wu, Z.; Zhao, Y.; Liu, A.; et al. Morphology-based radiomics signature: A novel determinant to identify multiple intracranial aneurysms rupture. Aging (Albany N. Y.) 2021, 13, 13195–13210. [Google Scholar] [CrossRef] [PubMed]
- Ou, C.; Chong, W.; Duan, C.Z.; Zhang, X.; Morgan, M.; Qian, Y. A preliminary investigation of radiomics differences between ruptured and unruptured intracranial aneurysms. Eur. Radiol. 2021, 31, 2716–2725. [Google Scholar] [CrossRef] [PubMed]
- Ou, C.; Li, C.; Qian, Y.; Duan, C.Z.; Si, W.; Zhang, X.; Li, X.; Morgan, M.; Dou, Q.; Heng, P.A. Morphology-aware multi-source fusion-based intracranial aneurysms rupture prediction. Eur. Radiol. 2022, 32, 5633–5641. [Google Scholar] [CrossRef]
- Lauric, A.; Ludwig, C.G.; Malek, A.M. Enhanced Radiomics for Prediction of Rupture Status in Cerebral Aneurysms. World Neurosurg. 2022, 159, e8–e22. [Google Scholar] [CrossRef]
- An, X.; He, J.; Di, Y.; Wang, M.; Luo, B.; Huang, Y.; Ming, D. Intracranial Aneurysm Rupture Risk Estimation With Multidimensional Feature Fusion. Front. Neurosci. 2022, 16, 813056. [Google Scholar] [CrossRef]
- Etminan, N.; Rinkel, G.J. Unruptured intracranial aneurysms: Development, rupture and preventive management. Nat. Rev. Neurol. 2016, 12, 699–713. [Google Scholar] [CrossRef]
- Hastie, T.; Tibshirani, R.; Friedman, J. The Elements of Statistical Learning-Data Mining, Inference, and Prediction, 2nd ed.; Springer: New York, NY, USA, 2008. [Google Scholar]
- Herman, G.T.; Zheng, J.; Bucholtz, C.A. Shape-based interpolation. IEEE Comput. Graph. Appl. 1992, 12, 69–79. [Google Scholar] [CrossRef]
- 3D Slicer. Available online: https://slicer.readthedocs.io/en/latest/index.html (accessed on 27 August 2022).
- Tibshirani, R. Regression Shrinkage and Selection via the Lasso. J. R. Statist. Soc. B 1996, 58, 267–288. [Google Scholar] [CrossRef]
- Peduzzi, P.; Concato, J.; Kemper, E.; Holford, T.R.; Feinstein, A.R. A simulation study of the number of events per variable in logistic regression analysis. J. Clin. Epidemiol. 1996, 49, 1373–1379. [Google Scholar] [CrossRef]
- Arimura, H.; Soufi, M.; Ninomiya, K.; Kamezawa, H.; Yamada, M. Potentials of radiomics for cancer diagnosis and treatment in comparison with computer-aided diagnosis. Radiol. Phys. Technol. 2018, 11, 365–374. [Google Scholar] [CrossRef] [PubMed]
- Chawla, N.V.; Bowyer, K.W.; Hall, L.O.; Kegelmeyer, W.P. SMOTE: Synthetic Minority Over-sampling Technique. J. Artif. Intell. Res. 2002, 16, 321–357. [Google Scholar] [CrossRef]
- Zwanenburg, A.; Vallières, M.; Abdalah, M.A.; Aerts, H.J.W.L.; Andrearczyk, V.; Apte, A.; Ashrafinia, S.; Bakas, S.; Beukinga, R.J.; Boellaard, R.; et al. The Image Biomarker Standardization Initiative: Standardized Quantitative Radiomics for High-Throughput Image-based Phenotyping. Radiology 2020, 295, 328–338. [Google Scholar] [CrossRef]
- Soldozy, S.; Norat, P.; Elsarrag, M.; Chatrath, A.; Costello, J.S.; Sokolowski, J.D.; Tvrdik, P.; Kalani, M.Y.S.; Park, M.S. The biophysical role of hemodynamics in the pathogenesis of cerebral aneurysm formation and rupture. Neurosurg. Focus 2019, 47, E11. [Google Scholar] [CrossRef]
- Zhang, H.; Liang, S.; Lv, X. Intra-aneurysmal thrombosis and turbulent flow on MRI of large and giant internal carotid artery aneurysms. Neurosci. Inform. 2021, 1, 100027. [Google Scholar] [CrossRef]
- Arimura, H.; Li, Q.; Korogi, Y.; Hirai, T.; Abe, H.; Yamashita, Y.; Katsuragawa, S.; Ikeda, R.; Doi, K. Automated computerized scheme for detection of unruptured intracranial aneurysms in three-dimensional magnetic resonance angiography. Acad. Radiol. 2004, 11, 1093–1104. [Google Scholar] [CrossRef] [PubMed]
- Baghaie, A.; Schnell, S.; Bakhshinejad, A.; Fathi, M.F.; D’Souza, R.M.; Rayz, V.L. Curvelet Transform-based volume fusion for correcting signal loss artifacts in Time-of-Flight Magnetic Resonance Angiography data. Comput. Biol. Med. 2018, 99, 142–153. [Google Scholar] [CrossRef] [PubMed]
- Yuan, W.; Peng, Y.; Guo, Y.; Ren, Y.; Xue, Q. DCAU-Net: Dense convolutional attention U-Net for segmentation of intracranial aneurysm images. Vis. Comput. Ind. Biomed. Art. 2022, 5, 9, Erratum in Vis. Comput. Ind. Biomed. Art. 2022, 5, 12. [Google Scholar] [CrossRef]


| Characteristics | Total of Patient Cohort |
|---|---|
| No. of patients | 28 |
| No. of ruptured cases | 10 |
| No. of unruptured cases | 18 |
| Follow-up MRA images | |
| No. of images | 113 |
| No. of images for ruptured cases | 10 |
| No. of images for unruptured cases | 103 |
| Gender | |
| Male | 9 |
| Female | 19 |
| Age (year) | 35–92 (median: 63) |
| Aneurysm diameter (mm) | 2–12 (median: 4.43) |
| Site of intracranial aneurysm | |
| Middle cerebral artery (MCA) | 103 |
| Internal carotid–posterior communicating artery (IC-PC) | 5 |
| Basilar artery (BA) | 3 |
| Anterior communicating artery (A-com) | 2 |
| Radiomic Feature | Coefficient of LASSO |
|---|---|
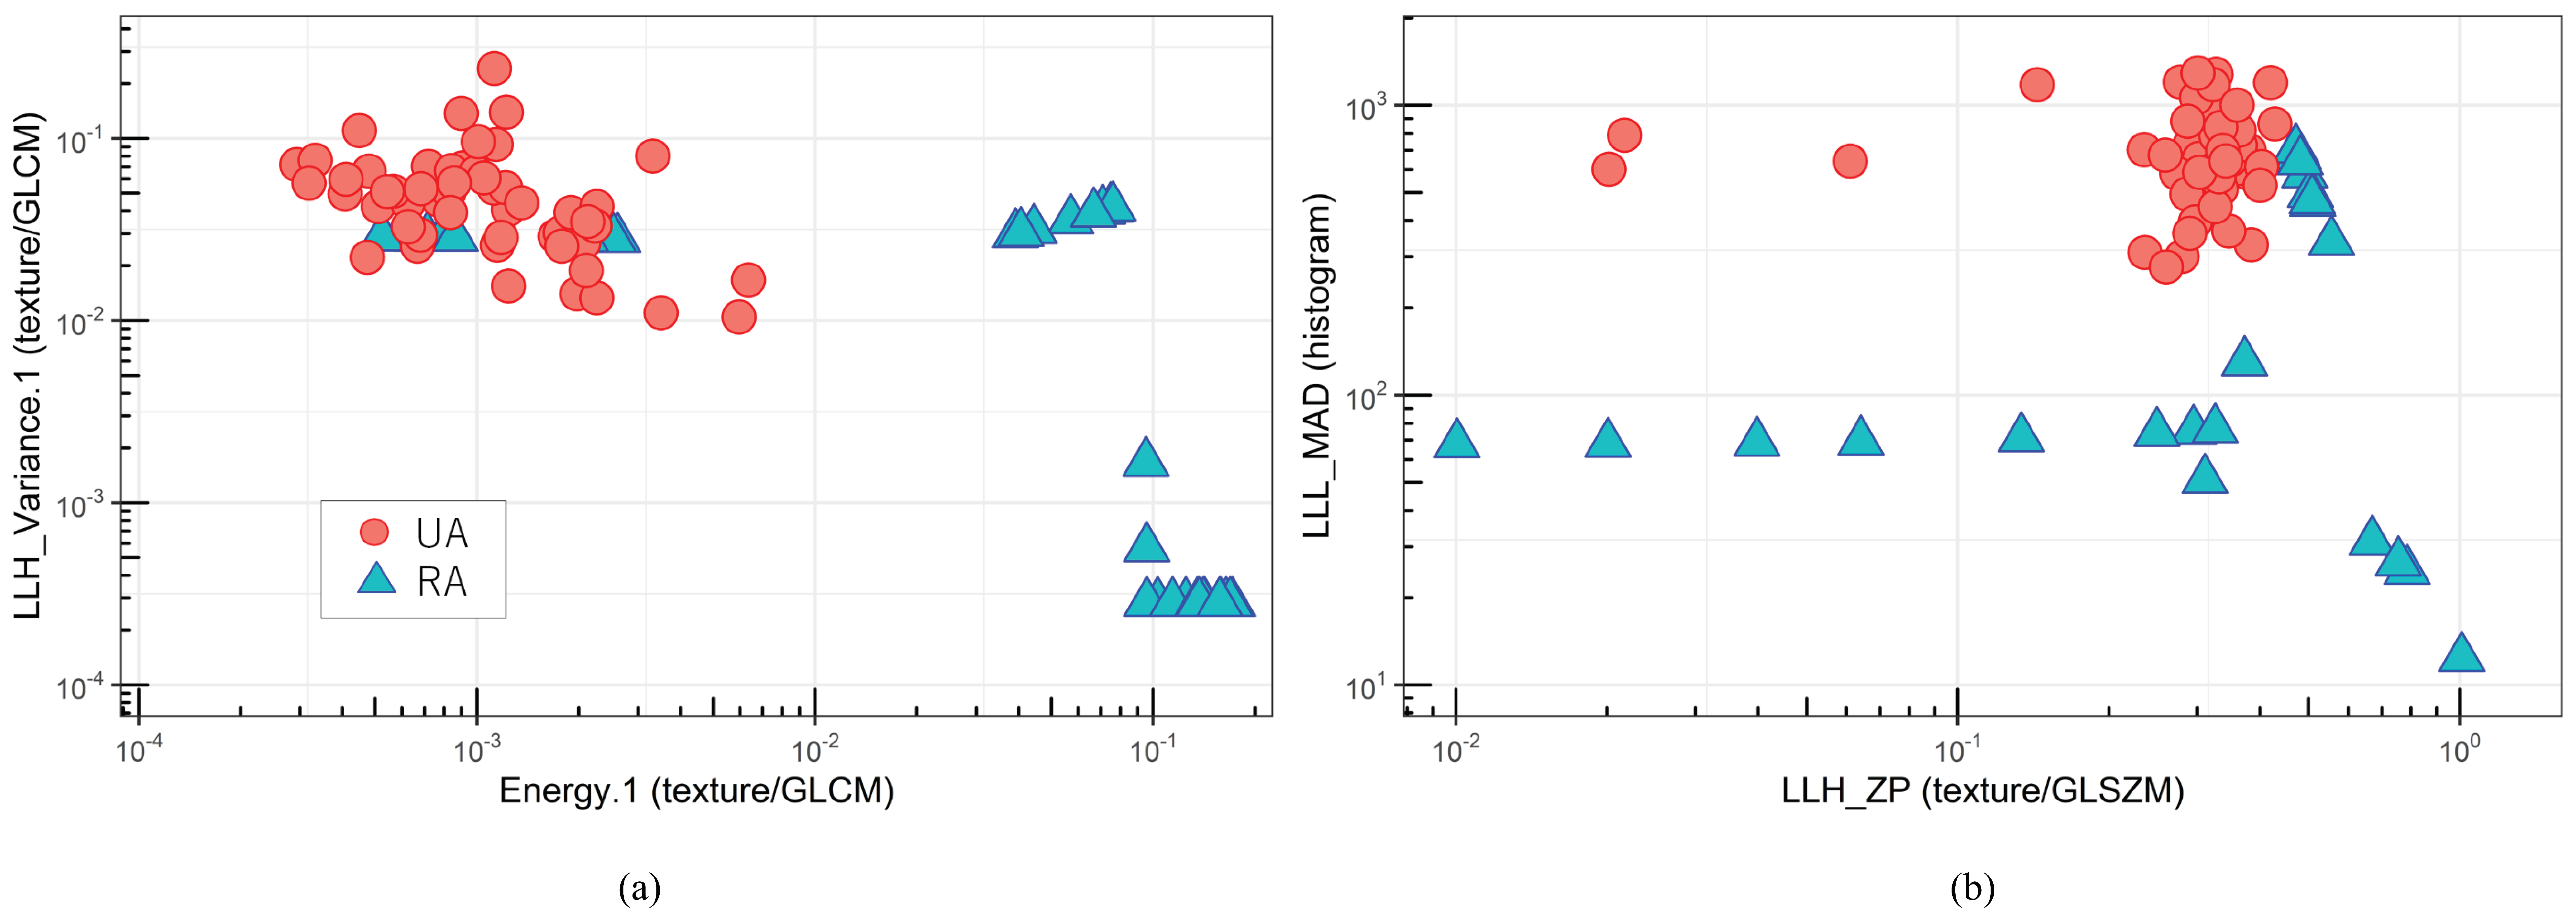
| Energy.1 (texture/GLCM) | 1.383 |
| LLH Variance.1 (texture/GLCM) | 0.438 |
| LLH ZP (texture/GLSZM) | 0.239 |
| LLL MAD (histogram) | 0.189 |
| HLL ZP (texture/GLSZM) | 0.107 |
| LLH Variance (histogram) | 0.0659 |
| Uniformity (histogram) | 0.0485 |
| LLH Autocorrelation (texture/GLCM) | 0.0311 |
| LLH GLV (texture/GLRLM) | 0.0260 |
| HHH ZP (texture/GLSZM) | 0.0153 |
| LLH Contrast (texture/GLCM) | 0.000211 |
Publisher’s Note: MDPI stays neutral with regard to jurisdictional claims in published maps and institutional affiliations. |
© 2022 by the authors. Licensee MDPI, Basel, Switzerland. This article is an open access article distributed under the terms and conditions of the Creative Commons Attribution (CC BY) license (https://creativecommons.org/licenses/by/4.0/).
Share and Cite
Yamanouchi, M.; Arimura, H.; Kodama, T.; Urakami, A. Prediction of Intracranial Aneurysm Rupture Risk Using Non-Invasive Radiomics Analysis Based on Follow-Up Magnetic Resonance Angiography Images: A Preliminary Study. Appl. Sci. 2022, 12, 8615. https://doi.org/10.3390/app12178615
Yamanouchi M, Arimura H, Kodama T, Urakami A. Prediction of Intracranial Aneurysm Rupture Risk Using Non-Invasive Radiomics Analysis Based on Follow-Up Magnetic Resonance Angiography Images: A Preliminary Study. Applied Sciences. 2022; 12(17):8615. https://doi.org/10.3390/app12178615
Chicago/Turabian StyleYamanouchi, Masayuki, Hidetaka Arimura, Takumi Kodama, and Akimasa Urakami. 2022. "Prediction of Intracranial Aneurysm Rupture Risk Using Non-Invasive Radiomics Analysis Based on Follow-Up Magnetic Resonance Angiography Images: A Preliminary Study" Applied Sciences 12, no. 17: 8615. https://doi.org/10.3390/app12178615
APA StyleYamanouchi, M., Arimura, H., Kodama, T., & Urakami, A. (2022). Prediction of Intracranial Aneurysm Rupture Risk Using Non-Invasive Radiomics Analysis Based on Follow-Up Magnetic Resonance Angiography Images: A Preliminary Study. Applied Sciences, 12(17), 8615. https://doi.org/10.3390/app12178615