1. Introduction
Brain–Computer Interface (BCI) systems can interact directly with external devices without using the brain’s regular output circuit, while enables conscious control of brain activity terminal equipment. BCI offers significant scientific study value and broad application potential in various domains, including the operation of an intelligent EEG wheelchair via an electroencephalography (EEG) signal, rehabilitation training and the creation of wearable devices [
1,
2,
3].
Three paradigms for brain–computer interfaces are frequently used: Motor Imagery, P300 signal [
4,
5], and Steady–State Visual Evoked Potential (SSVEP) [
6,
7]. SSVEP is a potential created in the brain’s visual cortex or the occipital region outside the skull when the human eye is stimulated with a specific frequency of flash or image [
8,
9]. A BCI system based on SSVEP has garnered considerable interest due to its advantages, including high classification accuracy, short training time and fast pace of Information Transfer Rate (ITR) [
10,
11]. Zhu et al. [
12] used ensemble learning to improve the performance of ear–EEG in SSVEP–based BCI through re–implementing a compact convolutional neural network. Cherloo et al. [
13] presented the Spatio–Spectral canonical correlation analysis (SS–CCA) algorithm, which is inspired by common spatio–spectral patterns algorithm. It is used as the base model of filter bank canonical correlation analysis (FBCCA), which can help increase the frequency recognition performance. Kwon et al. [
14] proposed a novel multidomain signal–to–signal translation method to generate artificial SSVEP signals from resting EEG. Mao et al. [
15] presented a recursive Bayes–based technique for enhancing the classification effectiveness of high–frequency SSVEP. Lin et al. [
16] suggested a Volterra–filter–based nonlinear model of SSVEP. The training cost is minimized in this model by transfer learning and recreating stable reference signals using a small number of training targets.
This paper focuses on the SSVEP algorithm. SSVEP typically places a premium on the simplicity of use of brain–computer interface devices in practical applications. In certain application cases, obtaining sufficient individual data to pre–train the BCI system is challenging. Therefore, an unsupervised fast SSVEP classification algorithm based on FBCCA was developed. Simultaneously, the minimum time required to collect EEG data from 30 subjects with a 0.2 Hz frequency variation of 40 targets can be lowered to 1.5 s. Additionally, the maximum accuracy can reach 89.1% regardless of the sampling period when the sampling time approaches 3.5 s. Each set of trials’ processing time is less than 2.5 s, which bodes well for the use of some brain control devices. When the data length is 2 s, the classification accuracy may rise by more than 20% when compared to the standard canonical correlation analysis (CCA) algorithm.
2. Materials and Methods
2.1. Unsupervised Classification Algorithm FBCCA
The FBCCA algorithm does not need training and can directly conduct unsupervised classification [
17]. Traditional CCA requires pre–training of models with EEG data before online classification [
18,
19].
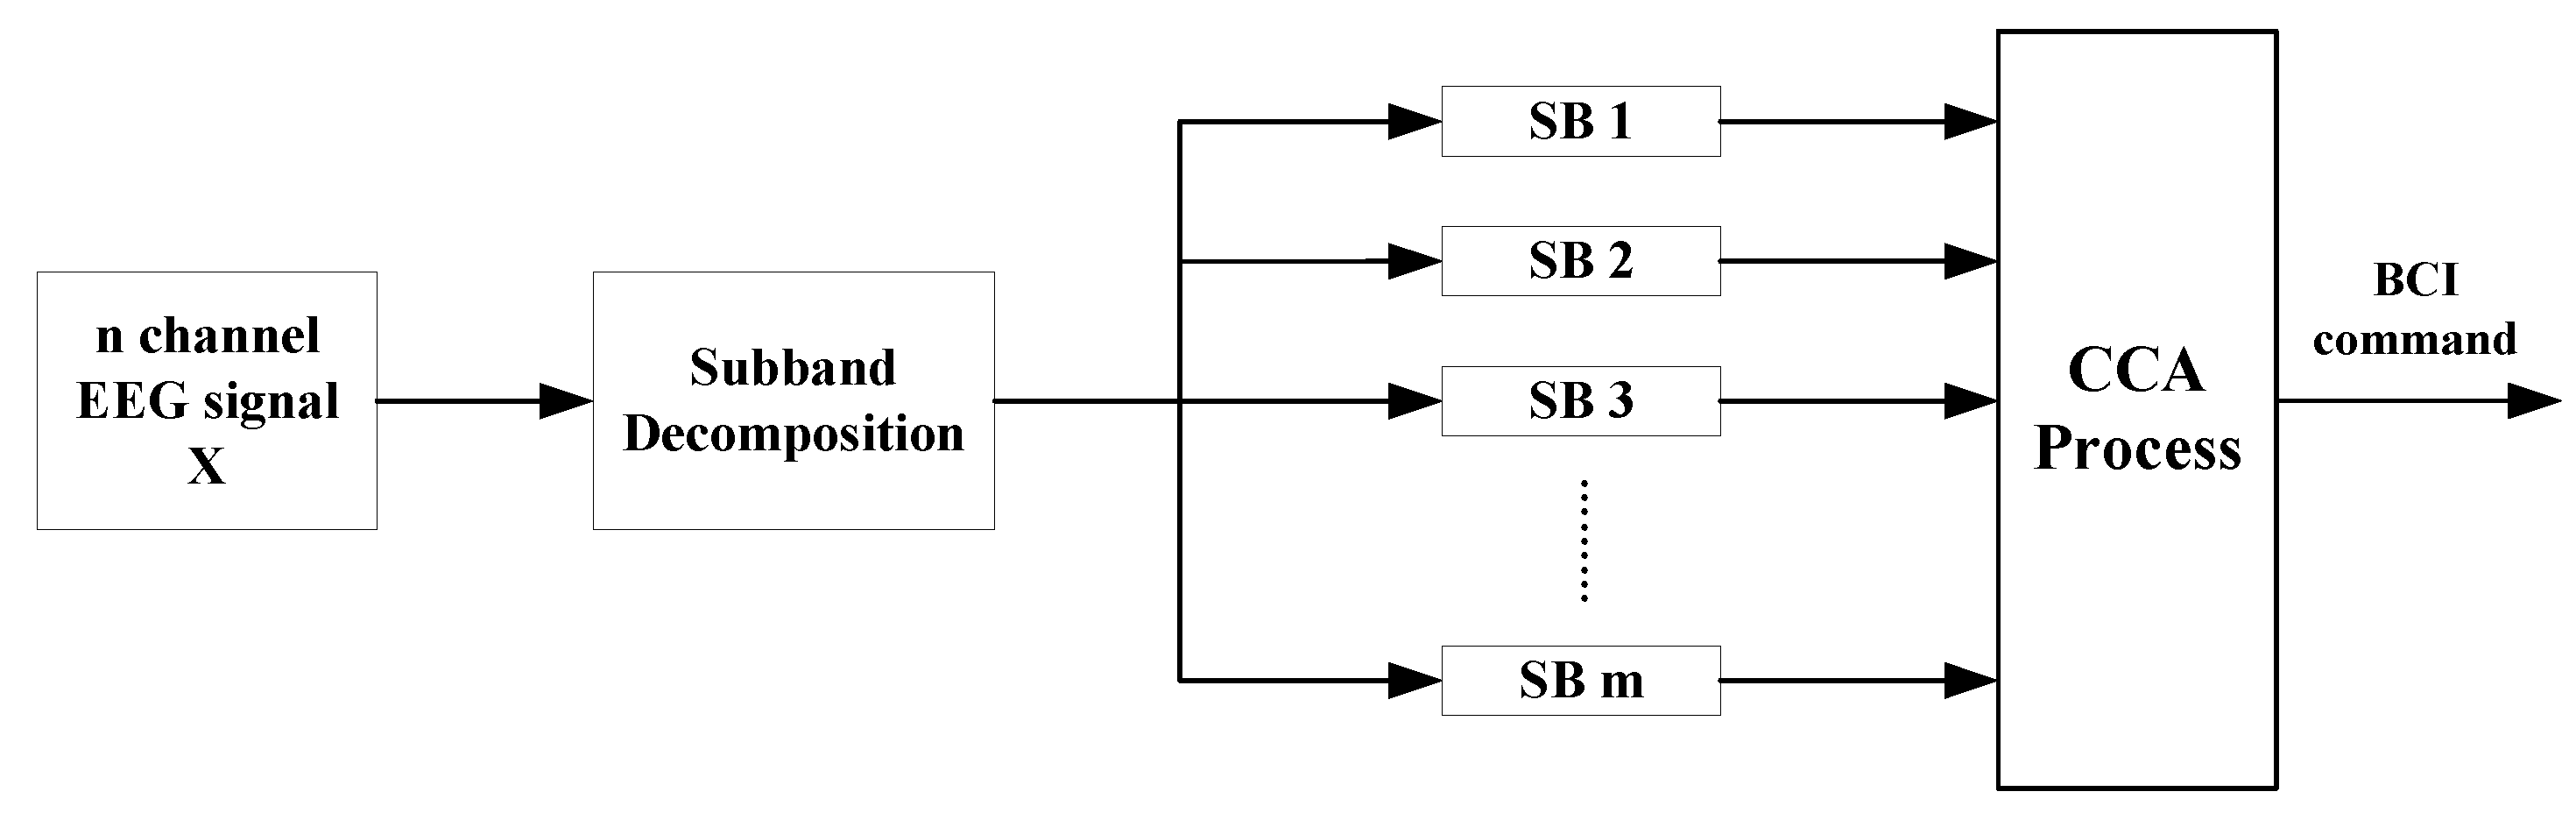
As shown in
Figure 1, the main steps of FBCCA are as follows: (1) filter bank analysis; (2) canonical correlation analysis between SSVEP subband components and sinusoidal reference signals; and (3) target classification and recognition.
Filter bank analysis in FBCCA can deconstruct SSVEP into several subband components, allowing the discriminant information contained in SSVEP harmonic components to be extracted. As a result, FBCCA delivers more extensive and robust harmonic information to recognize SSVEP targets and has a higher classification recognition effect.
2.1.1. Filter Bank Construction
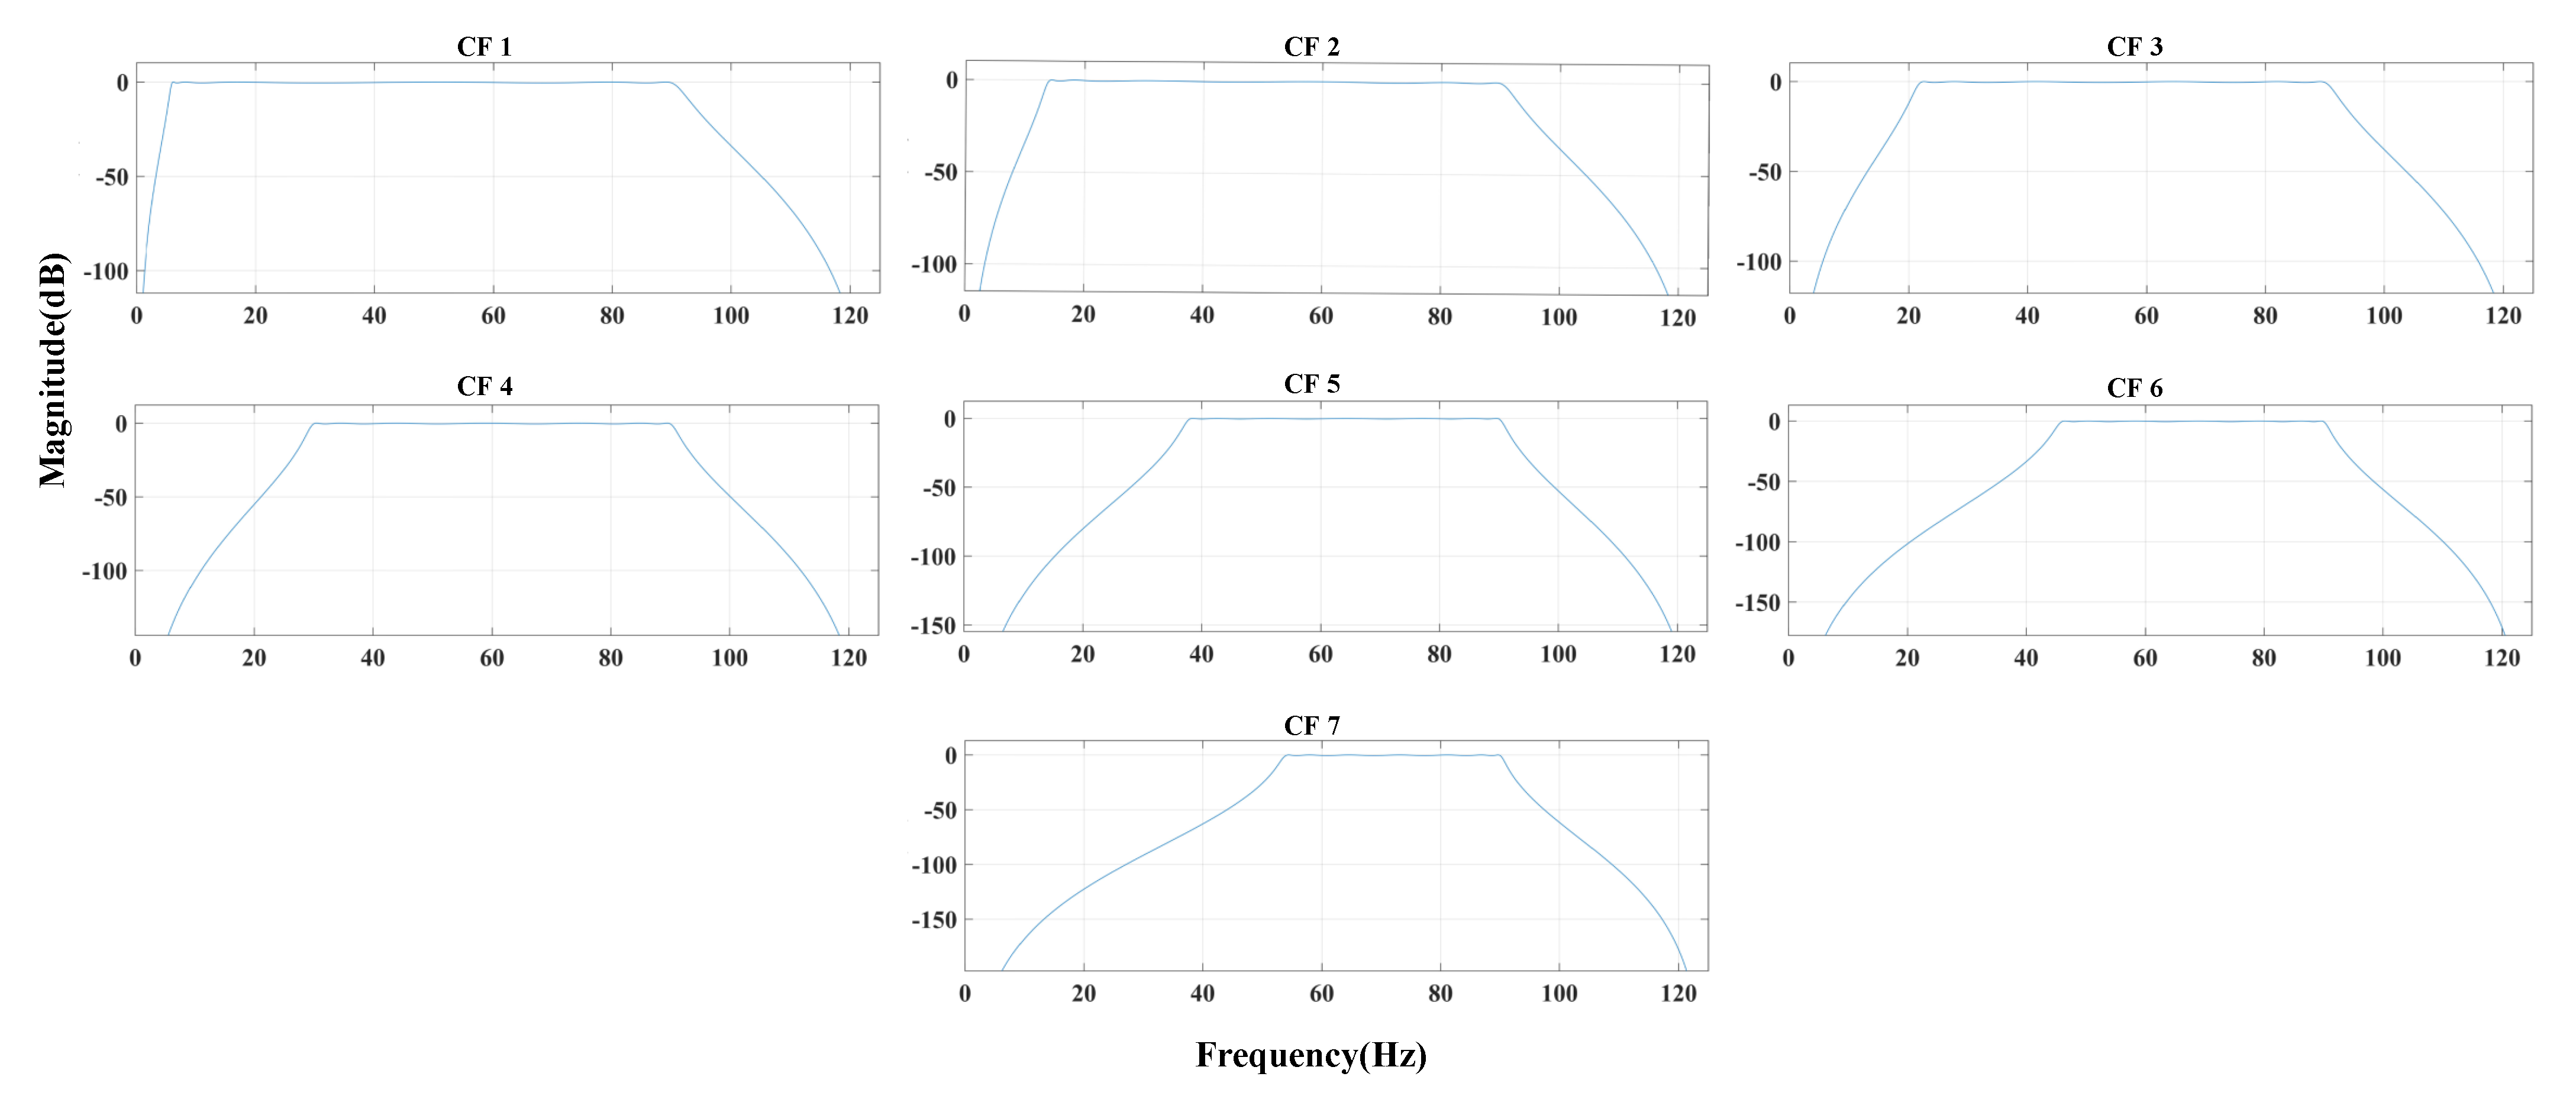
First, an appropriate filter bank for multi–subband EEG signal filtering need to be built. Generally, digital signal processors include FIR and IIR. IIR filter carries the characteristics of short processing time and large amount of data, which can be used to filter EEG signals. The experimental results show that the Chebyshev type–1 filter in IIR filter can process SSVEP signal well. This work also uses Chebyshev type–1 filter to process SSVEP signal. As shown in
Figure 2, we constructed a Chebyshev type–1 filter bank with
of 90 Hz and
of 100 Hz at high frequency. The
and
at low frequency are shown in
Table 1.
Finally, we need to determine the subband’s range. In general, when a single channel’s EEG signal is filtered by
m filter banks,
m EEG signals processed by the subband filter may be produced. Finally, when the channel count is
n, the
m filter banks can be filtered to generate an
matrix. The (
1) represents the EEG data for
n channels.
After processing each channel with a Chebyshev type–1 filter bank consisting of m subbands, the processed subband filtered EEG signal produced is as follows:
2.1.2. CCA Analysis
After obtaining
subband filter matrix, we need to do the CCA analysis. CCA is a multivariate statistical method that maximizes the correlation between two sets of data, which is widely used in BCI frequency classification and detection based on SSVEP [
20,
21]. The method is mainly used to calculate the correlation coefficient between the multi–channel EEG signal and the established reference sine and cosine signal to determine the maximum correlation of the signal.
Figure 3 shows the process.
As shown in
Figure 3, CCA can analyze multi–channel EEG signals simultaneously, providing more channel information and more successfully extracting features from SSVEP EEG data. When CCA is used to extract the SSVEP response frequency, two sets of multivariate variables are defined as
X and
Y. Among them,
X is the multi–channel EEG signal of SSVEP, and
Y is the reference signal associated with the stimulation frequency
f.
As shown in (
3),
N denotes the number of harmonics in
f, and
X denotes the number of channels. Assuming
i stimulation frequencies exist, then
is as follows:
CCA identifies a pair of vectors
and
for each set of multidimensional variables
X and
Y and optimizes the correlation between related variables
and
through
and
, as shown in the following formula:
The maximum correlation coefficient
between
X and
Y is obtained from (
5). Different
f are selected, and
is calculated. Then, the frequency corresponding to the maximum
is regarded as the SSVEP response frequency.
2.2. The Experiment
2.2.1. Test Datasets Source
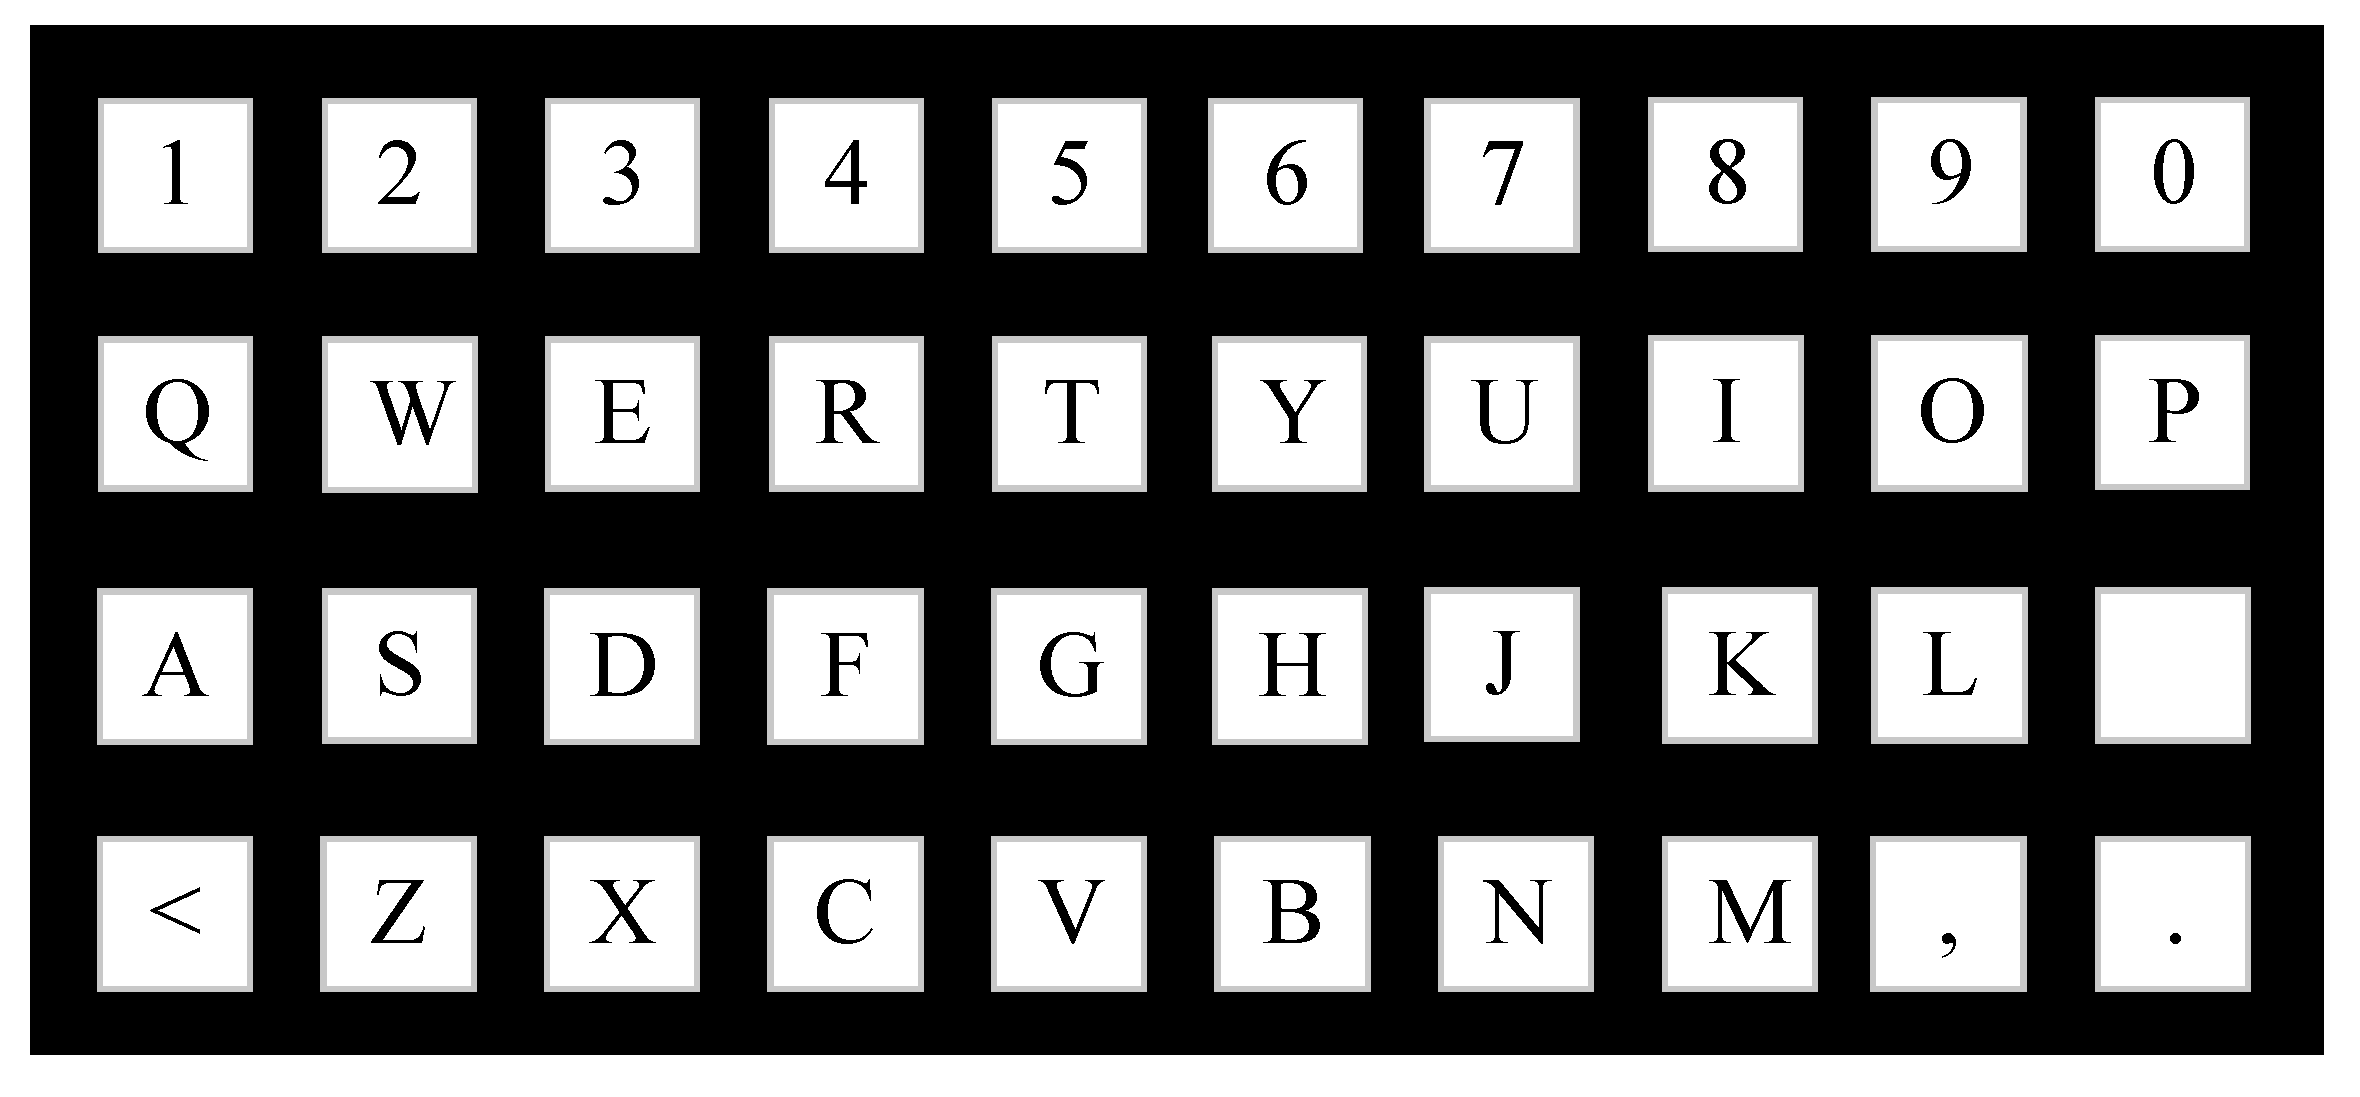
The data was acquired using the Neuracle 64–lead equipment during the third “China Brain–Computer Interface Competition” using the SSVEP paradigm. As shown in
Figure 4, the stimulus paradigm has 40 targets. The stimulus frequency is 8∼15.8 Hz, and the interval is 0.2 Hz.
2.2.2. Experimental Paradigm Process
The experimental data were gathered in blocks, with EEG data taken sequentially in each block, which contained an indefinite number of stimulation tests in random order. In a single block, the frequency of each stimulus trial is not fixed. A single trial lasts 3.5∼4.5 s. The prompt phase of the target starts at 0.5 s, and a red block will appear on the screen to indicate the target position and lasts for 0.5 s.
During the stimulus, 40 targets flashed at the same time, and the brightness of each target changed sinusoidal according to its predetermined frequency. Subjects were instructed to maintain a rigorous concentration on the recommended object, eliciting a steady–state visual evoked response in their EEG signals. Each trial begins with a trigger at the stimulus stage’s initial location. The experimental data were downsampled to 250 Hz EEG data without any further filtering, the visual latency was 0.13 s, and the confidence was 0.95.
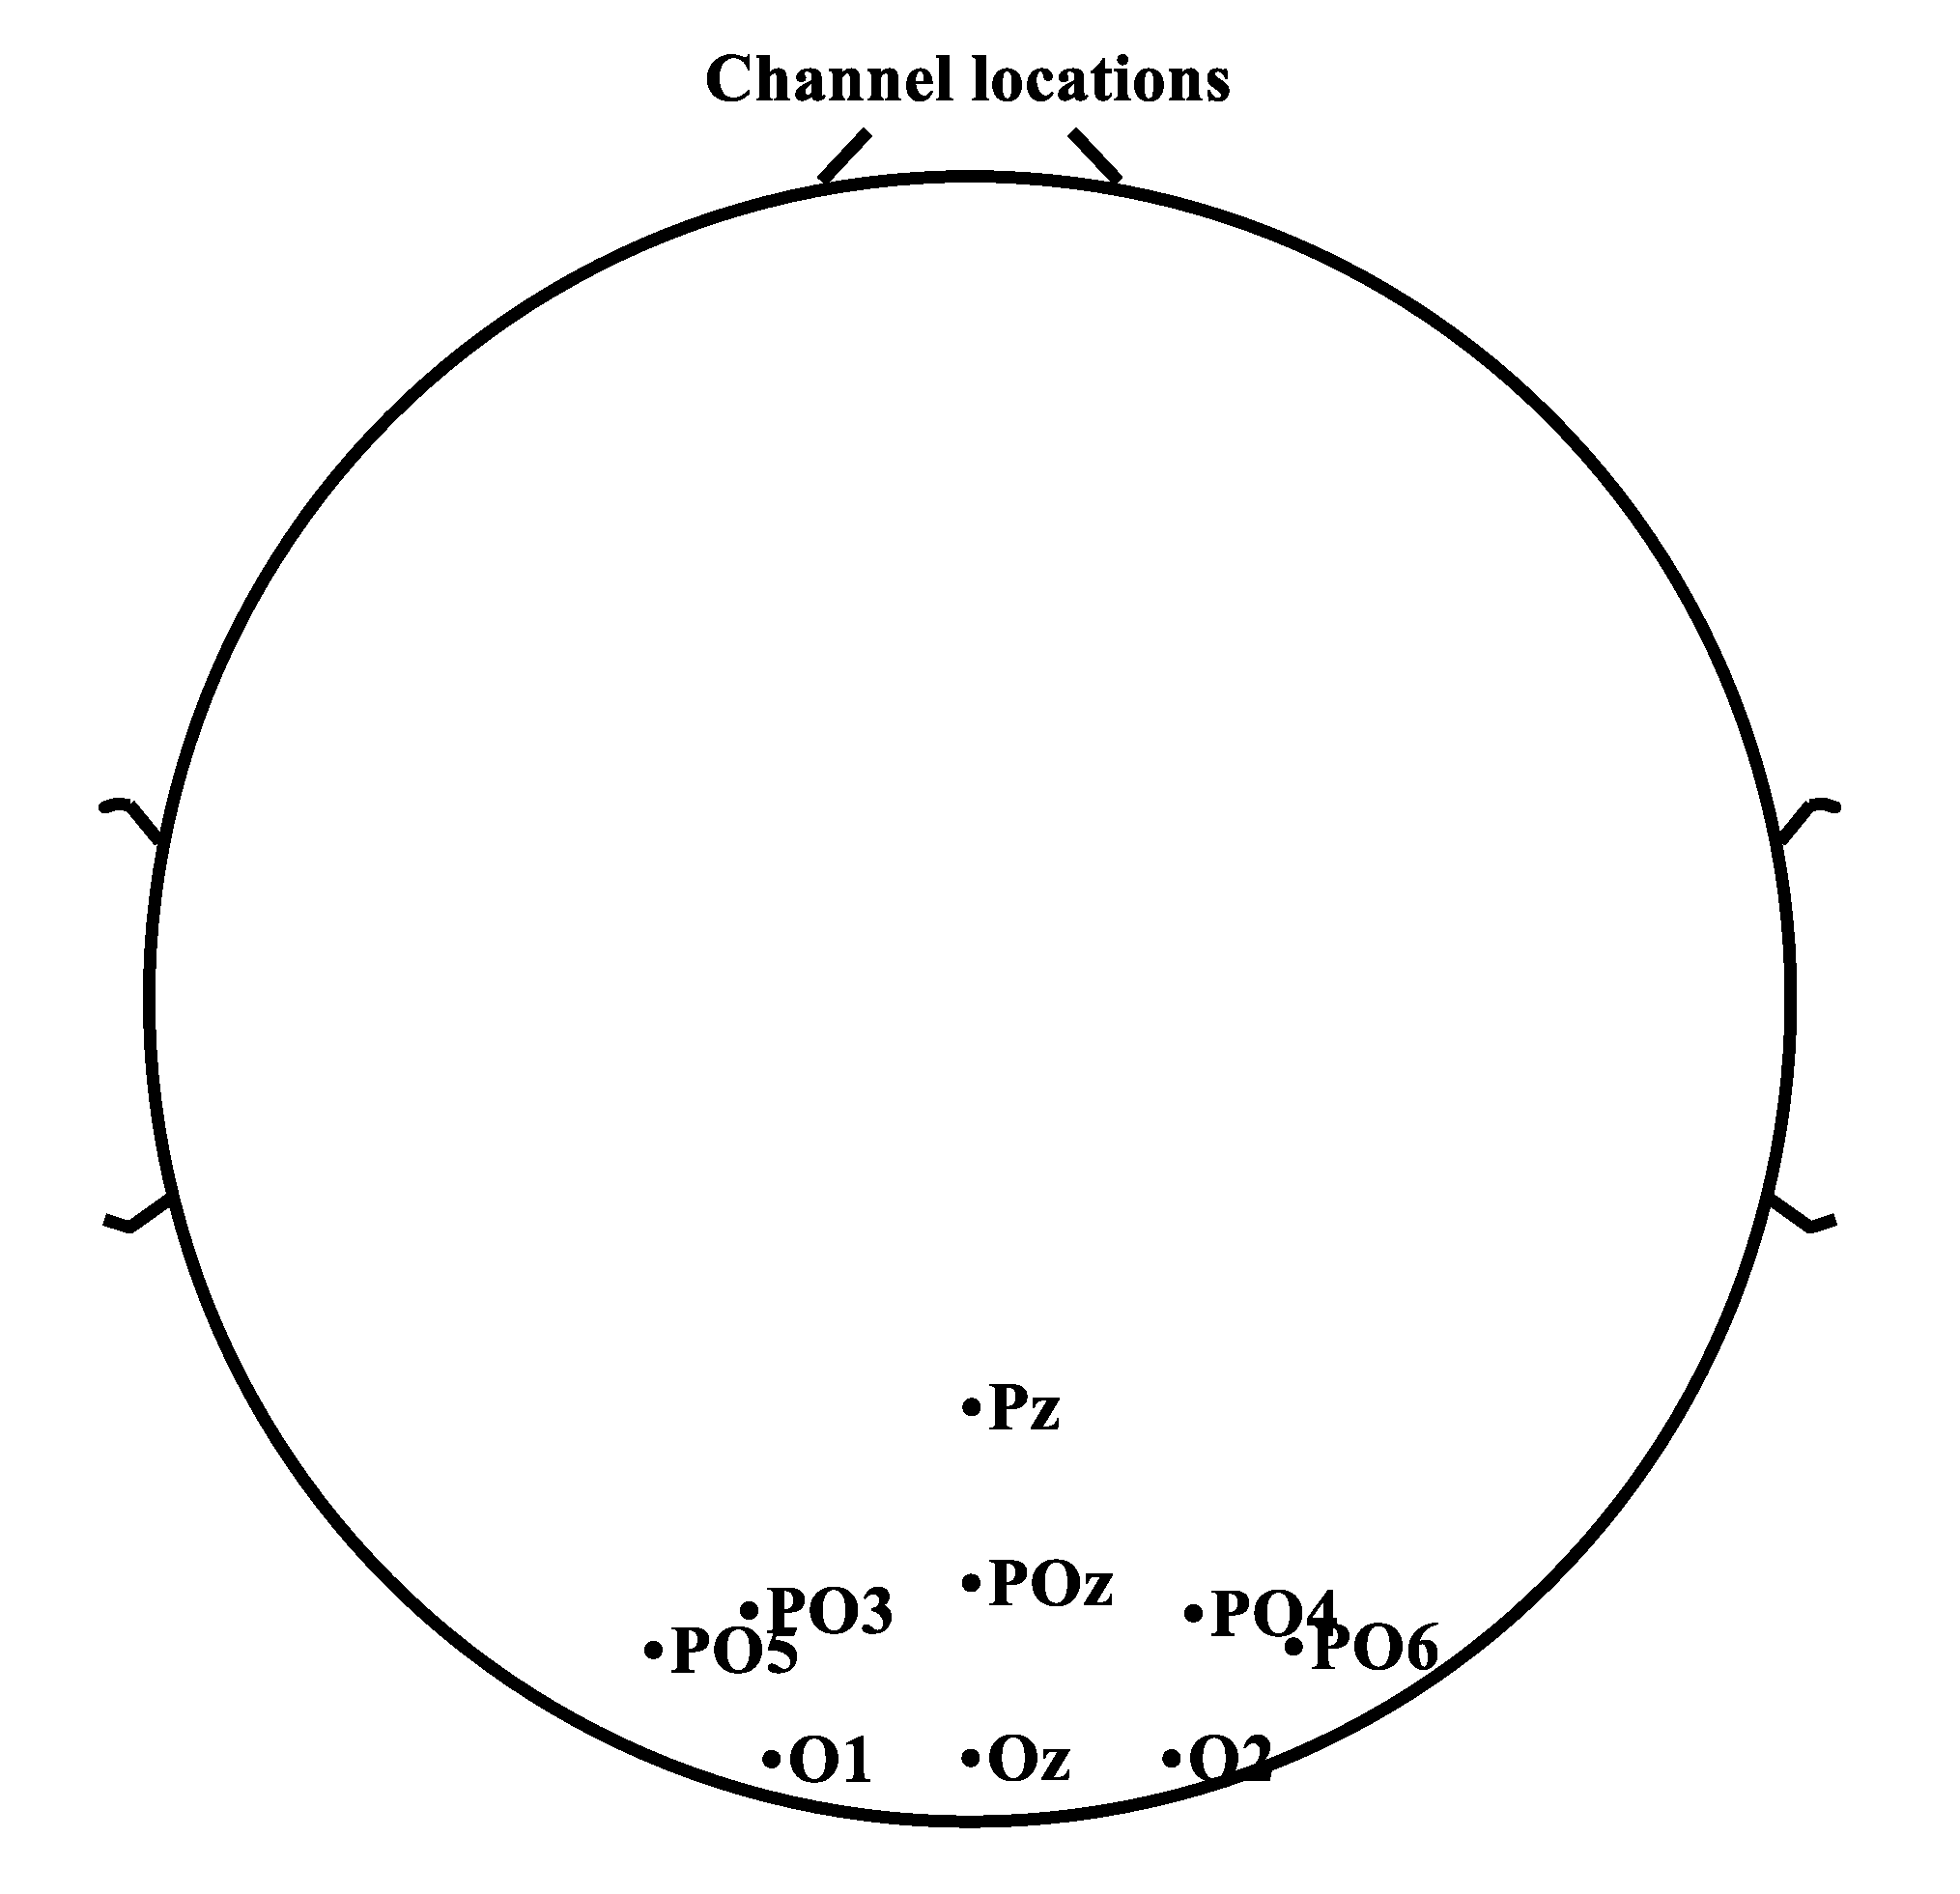
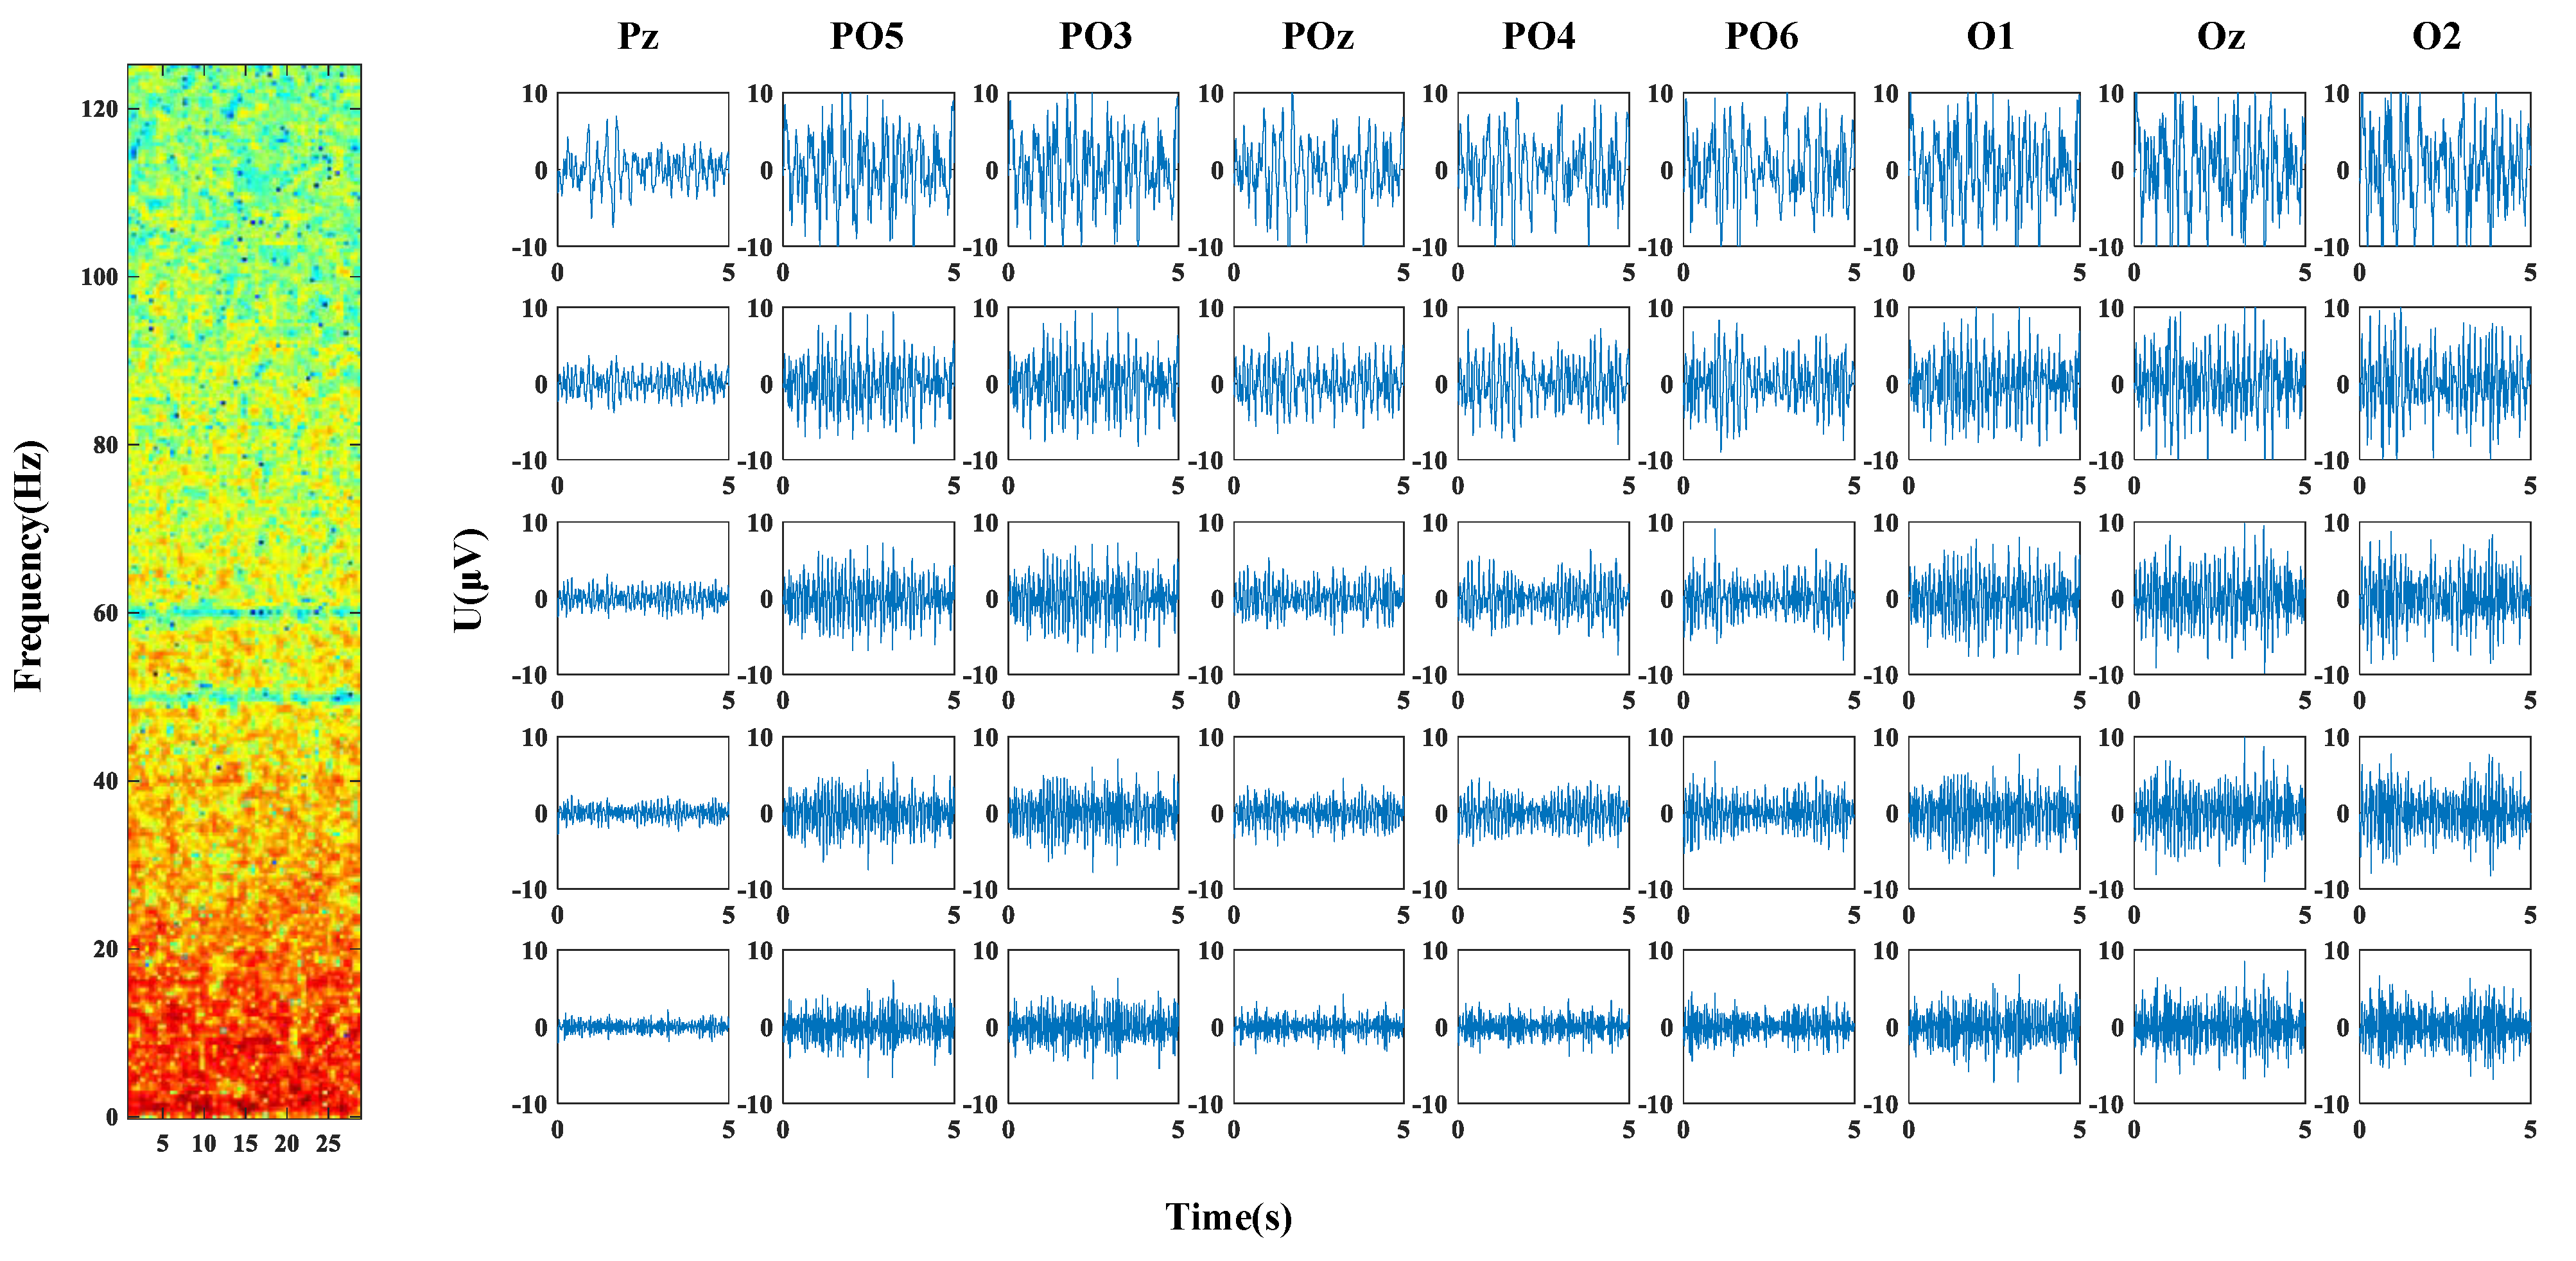
2.2.3. Channel Selection
When SSVEP signals are acquired, the response signal is mainly located in the posterior occipital area of the brain [
22]. For the regularly used 64–channel EEG acquisition device, the main channels for SSVEP signal processing and classification are Pz, POz, PO3, PO4, PO5, PO6, Oz, O1 and O2, as shown in
Figure 5, which this study selected for signal processing and classification [
23].
3. Results and Analysis
3.1. Evaluation Metrics
3.1.1. Accuracy Calculation Process
This study analyses the performance of the algorithm regarding the accuracy. As shown in (
6).
where
represents the classification accuracy,
n is the total number of samples,
t is the sample number,
is the true label of the sample, and
is the inferred label of the sample.
3.1.2. Information Transmission Rate Calculation Process
The information transfer rate (
) is a frequently used metric for evaluating the performance of BCI, and its formula is as follows:
where
represents the classification accuracy,
N represents the target number and
T represents the entire detection time, including the target fixation time and the gaze shifting time. The optimal average data length and classification accuracy can be calculated by simulating the online trials, and then the theoretical
value can be obtained. As a result, if we want to improve
, we might consider the three aspects above.
3.2. Parameter Setting and Evaluation Standard
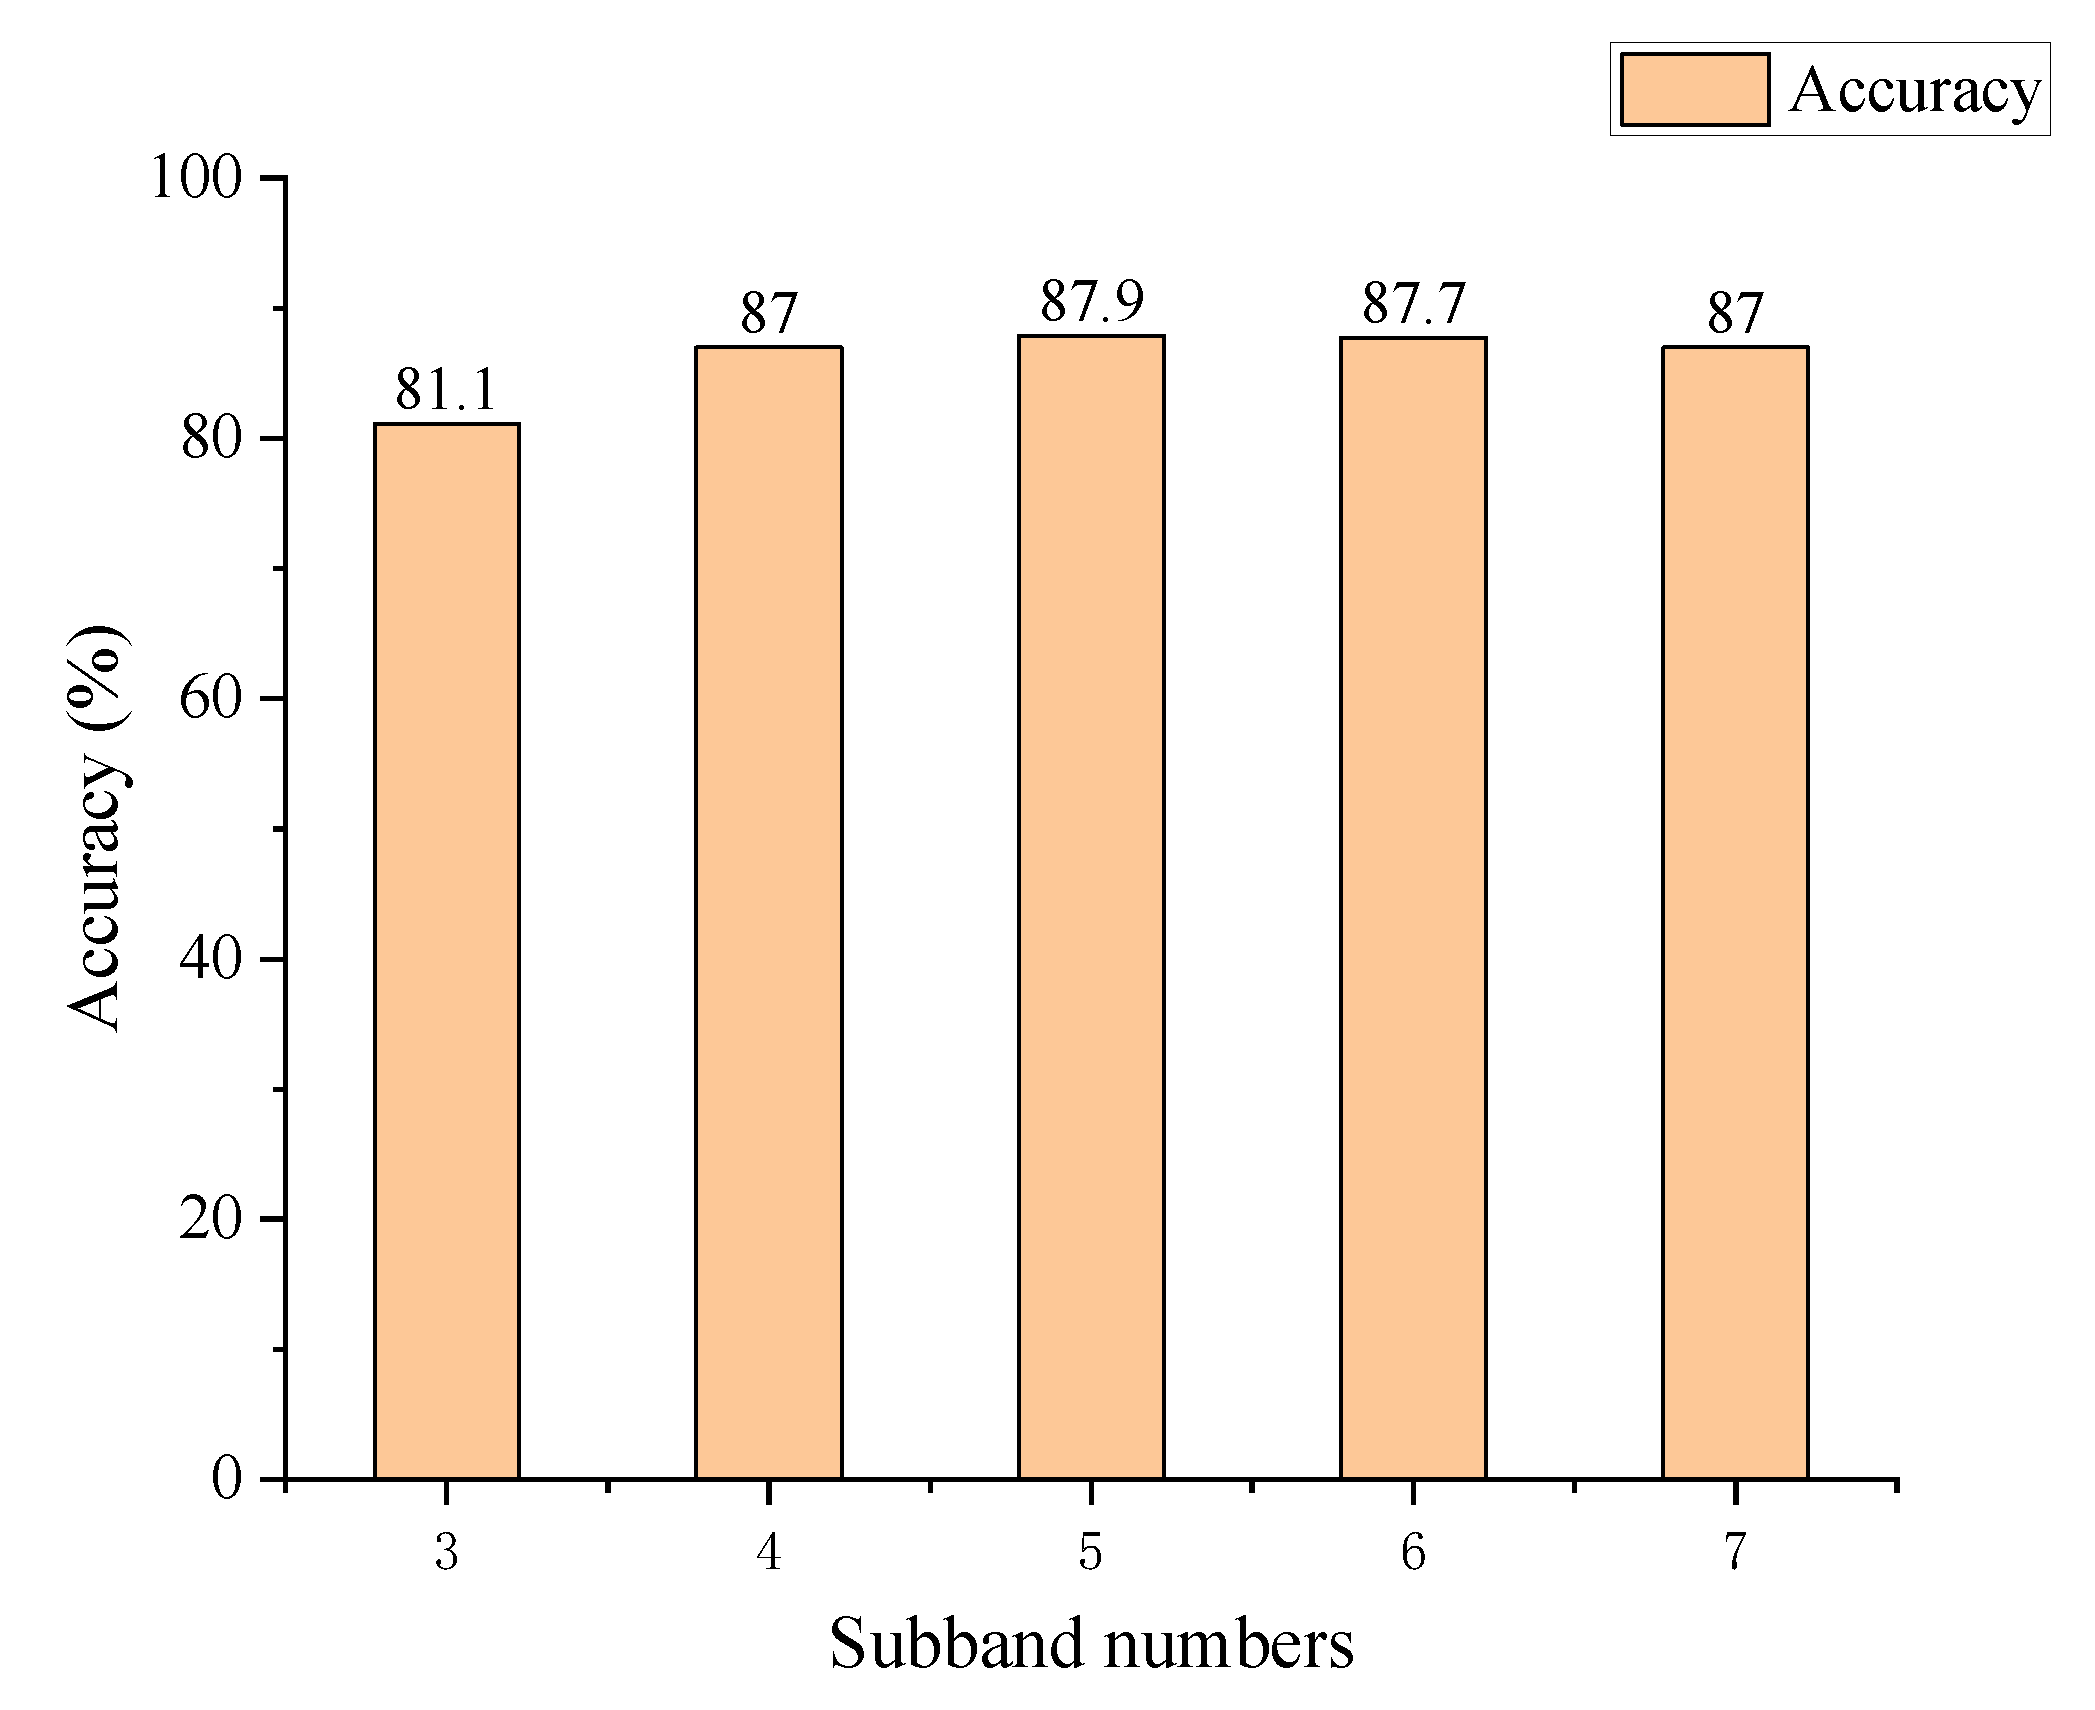
3.2.1. Subband Number
The primary purpose of the filter bank analysis is to decompose SSVEP into subband components to extract independent information from harmonics more efficiently. This approach separates the SSVEP into equal–bandwidth subbands and assesses the accuracy by varying the number of subbands. The number of subbands is set to 3∼7, and all other variables are strictly controlled. The time duration is 1.5 s with three harmonics. The accuracy is shown in
Figure 6.
We obtained the greatest accuracy, 87.9%, based on five subbands. When the number of subbands is greater than 5, the accuracy will be reduced to a certain extent. Thus, the number of subbands should be based on 5. When the number of subbands is 5, the decomposition of subbands at 8 Hz is shown in
Figure 7, where the time–frequency diagram of six blocks of the single channel (Pz) is drawn.
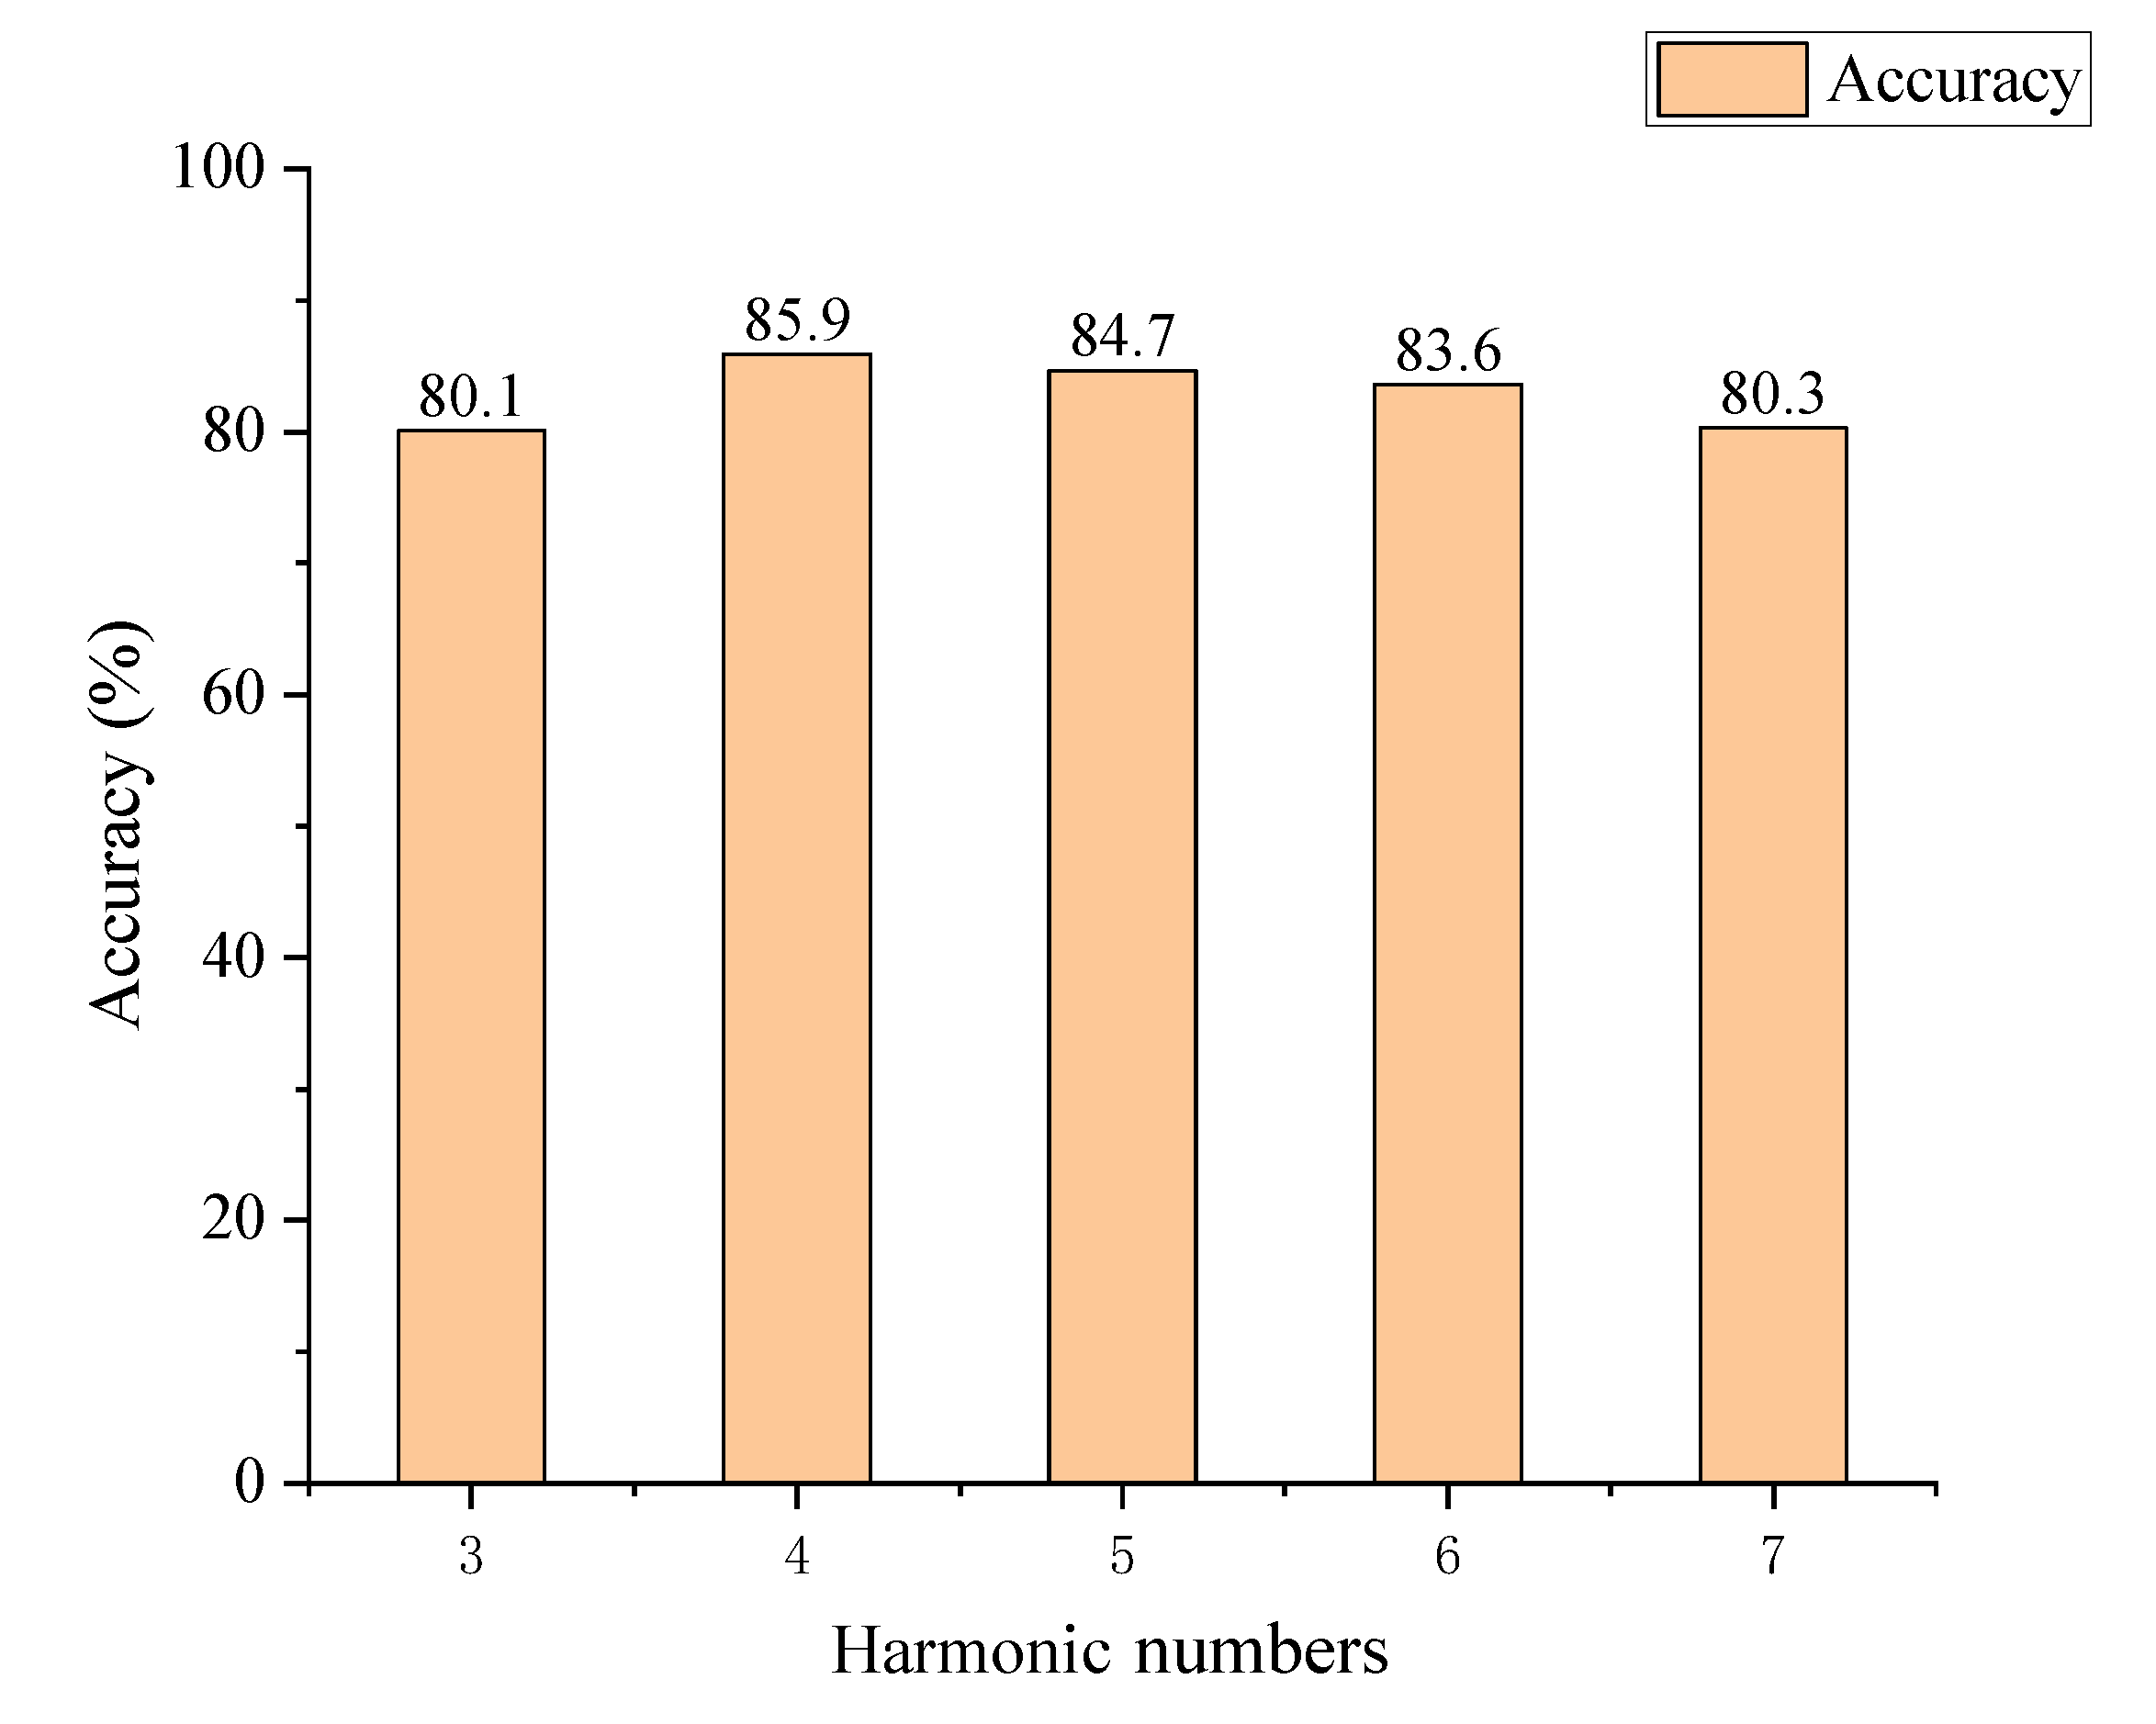
3.2.2. Harmonic Number
SSVEP’s main components are stimulation frequency and harmonics. Harmonic may give helpful information for identifying the frequency. After determining the number of subbands, we need to determine the number of harmonics. As the number of harmonics grows, the signal strength may weaken, increasing computation time while not improving the accuracy.
As a result, we compared harmonic numbers to find the best suitable value. The number of harmonics is set to 3∼7, and all other variables are strictly controlled. The time duration is 1.5 s with five subbands. The accuracy is shown in
Figure 8.
As shown in
Figure 8, the number of four harmonics obtained is the maximum accuracy of 85.9%. After greater than four harmonics, the data accuracy will be reduced to a certain extent, and thus the number of harmonics should be 4.
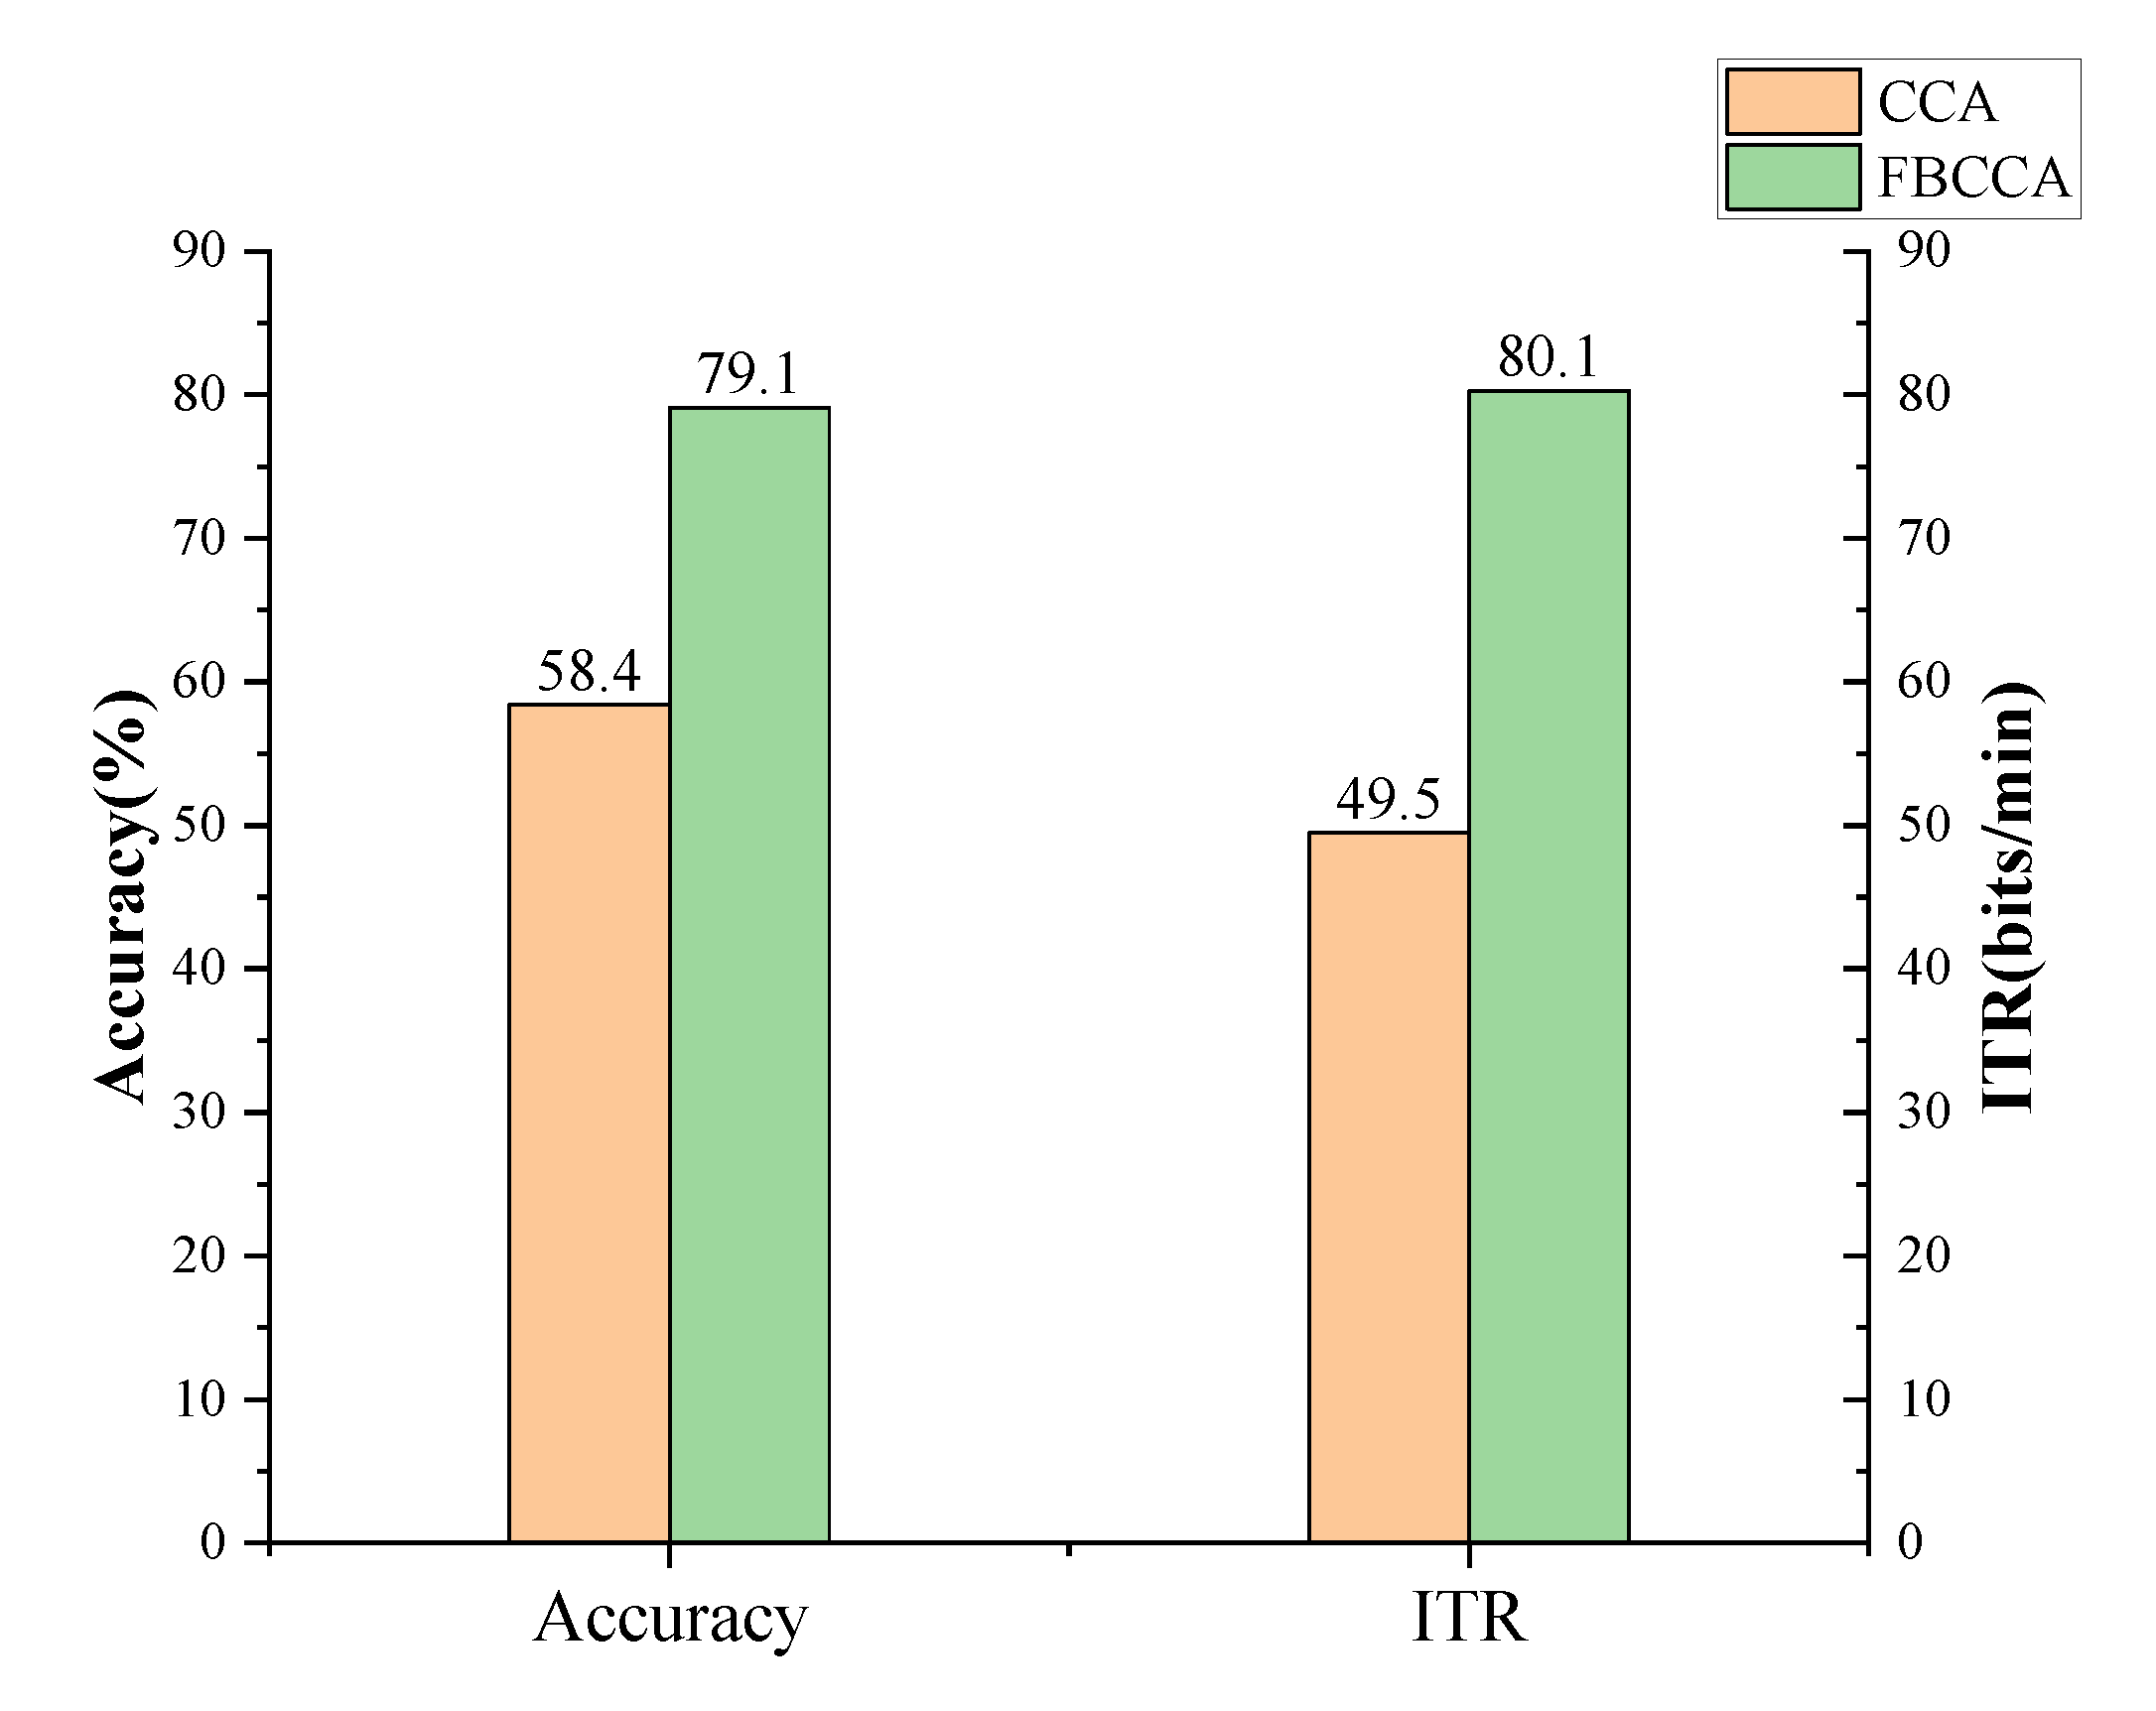
3.3. Comparison of FBCCA and CCA
The evaluation criterion includes the average accuracy and of 30 subjects. For different application scenarios, the standards are inconsistent. is more suitable for online testing and evaluation and has a relatively considerable effect on the actual application of SSVEP and BCI. However, accuracy evaluation is also a critical criterion in some scenarios that need higher precision but not a quicker acquisition time. As a result, this study analyzes these two commonly used criteria.
The FBCCA algorithm is compared to the traditional CCA algorithm, using the best parameter in harmonic and subband numbers above. The extracted data length takes 2 s, and the comparative results are shown in
Figure 9.
As shown in
Figure 9, the algorithm accuracy of FBCCA is nearly 20% higher than CCA, while
is nearly 30% higher, indicating a significant improvement in the algorithm performance.
3.4. The Effect of Data Length
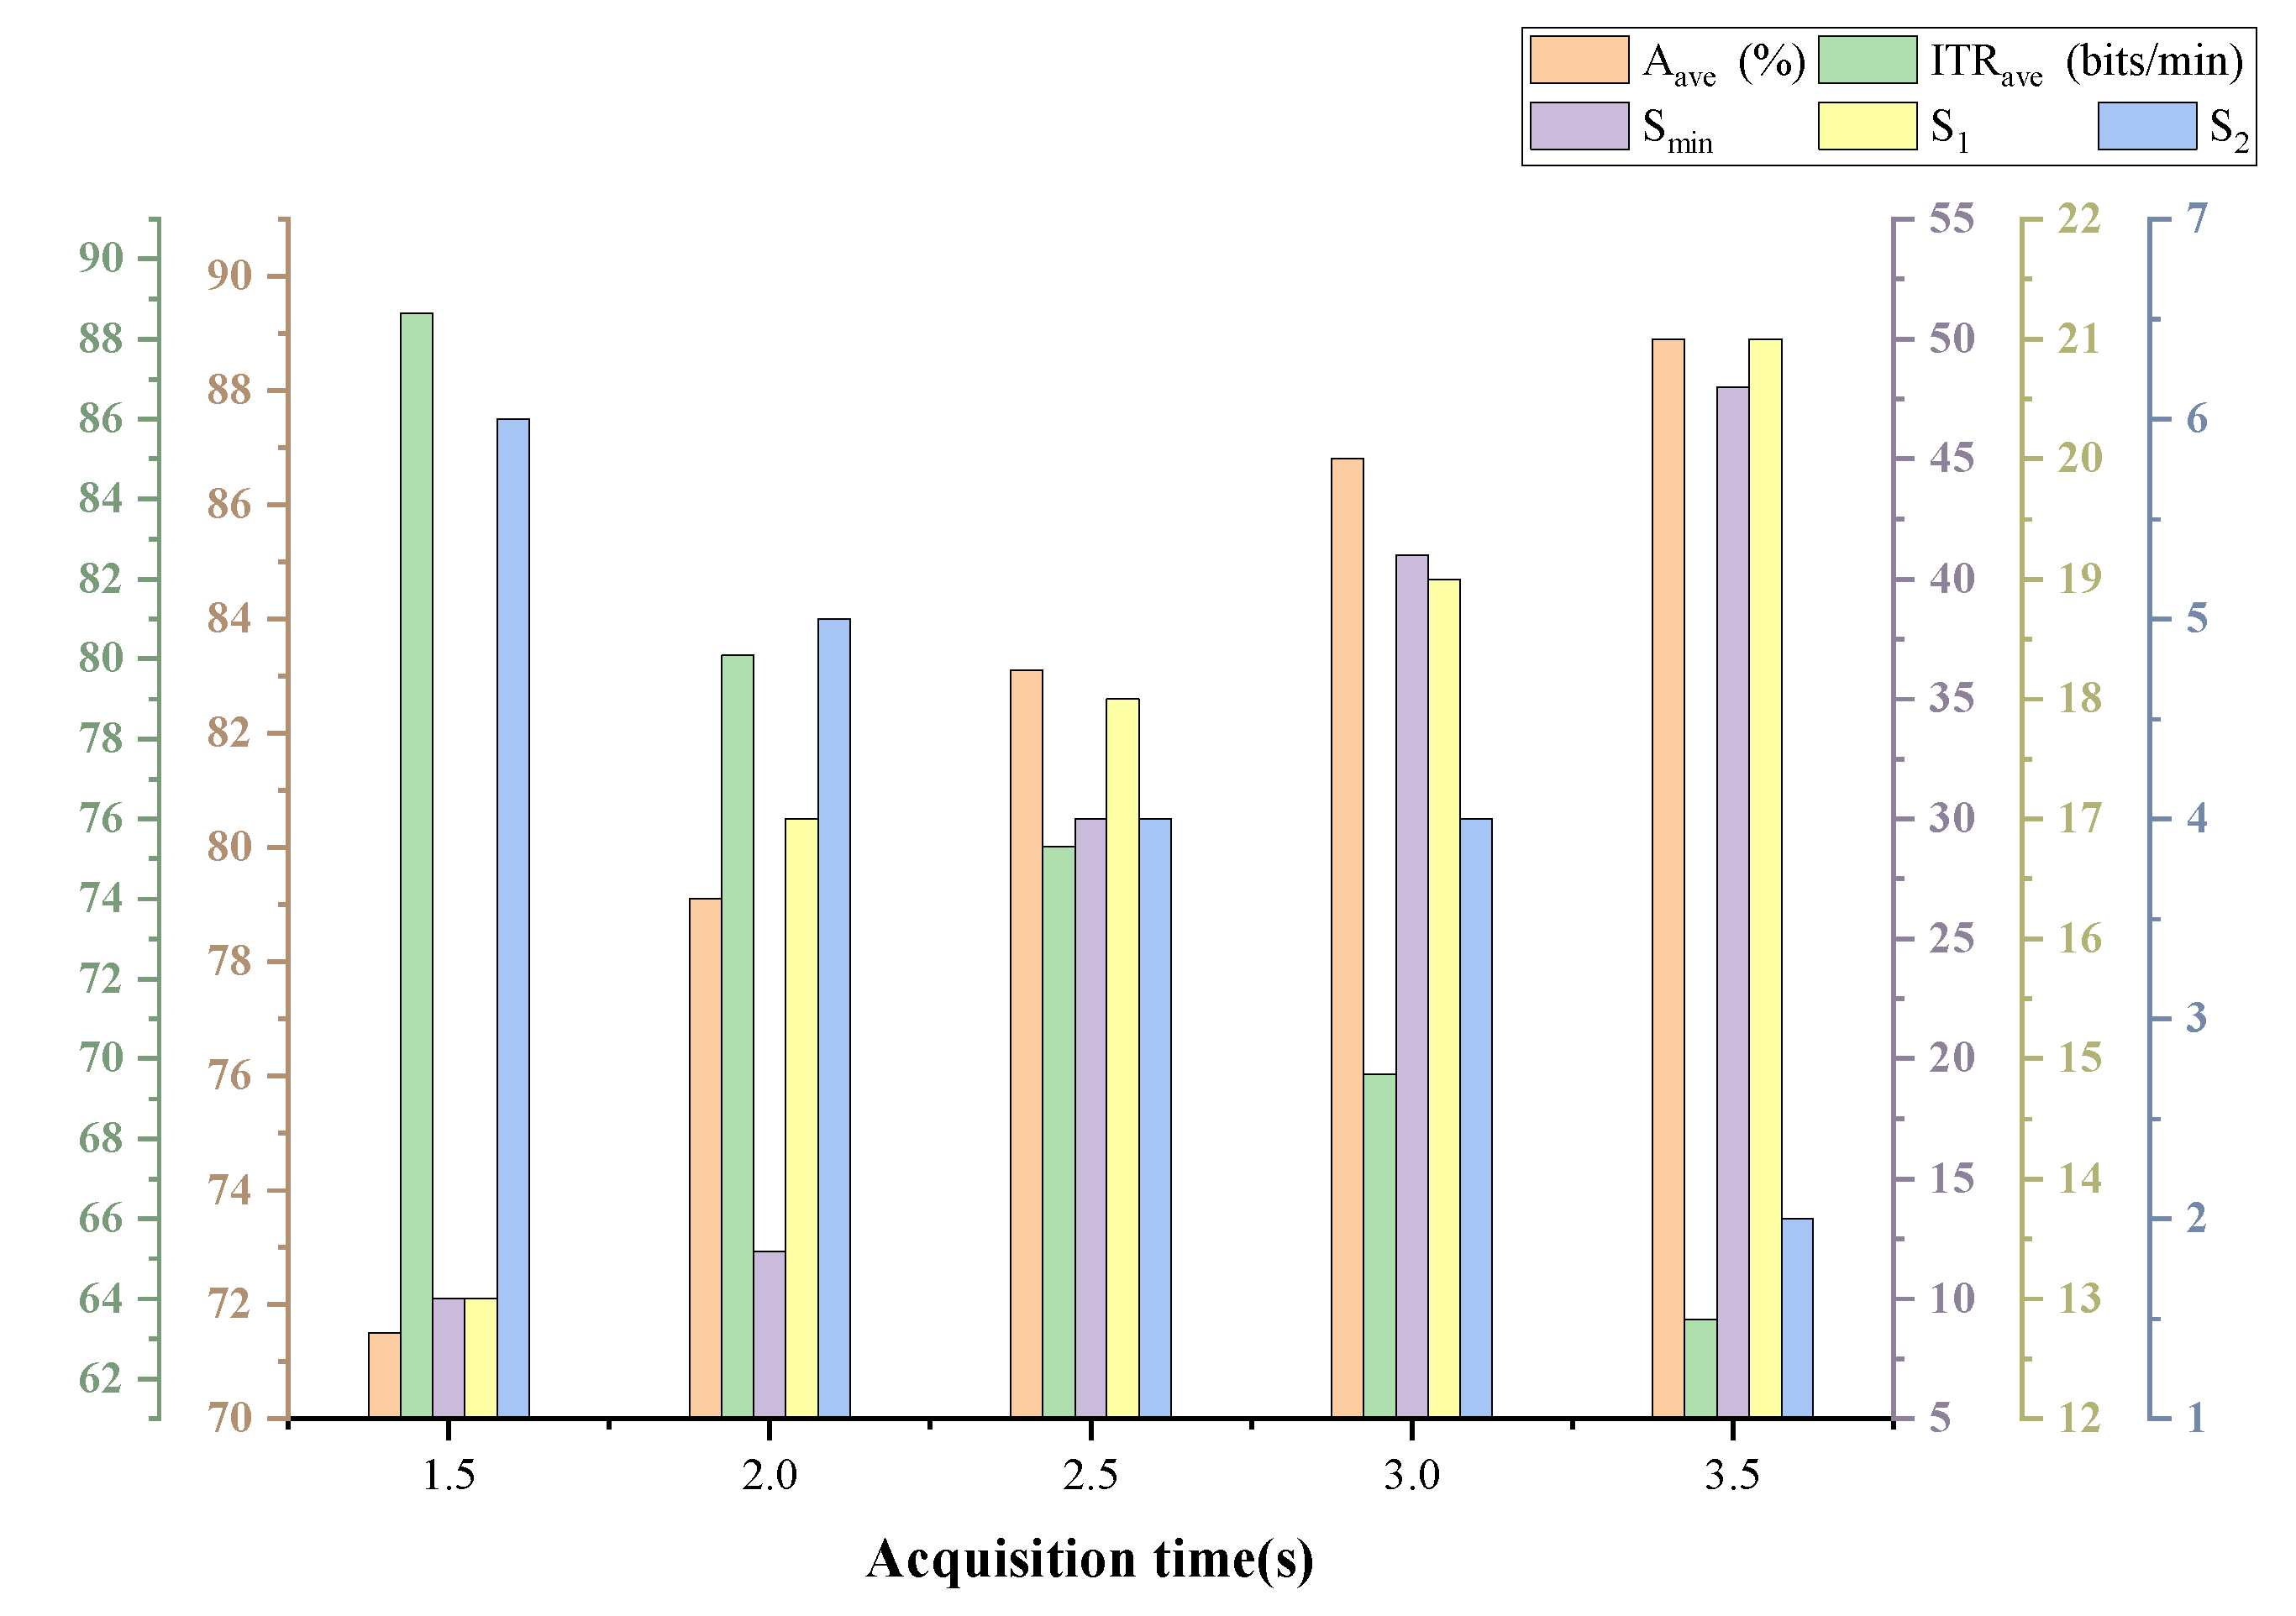
To evaluate the effect of extraction time on SSVEP performance, we process a comparison experiment in terms of the average accuracy rate , average information transmission rate and minimum correct number of subjects conducted on acquisition time intervals of 1.5, 2, 2.5, 3 and 3.5 s. and indicate the numbers of subjects whose accuracy rates are more than 80% and less than 50%, respectively.
As shown in
Table 2, the accuracy can reach the maximum with the increase of time, which is 88.9%. For an SSVEP system with 40 targets and a frequency difference of 0.2 Hz, the recognition rate of nearly 90% can already meet the requirements of various control systems with lower real–time, and more sampling extraction time can be used to ensure the accuracy rate. Moreover, increasing the time extraction length can improve the abnormal samples to some extent, which is shown as the minimum correct number of subjects in
Table 2.
Since the EEG intensity of each subject is different, the acquisition environment and the interference level of the acquisition in some application scenarios are also different, and it is necessary to ensure the minimum number of correct or minimum accuracy. Theoretically, for the time length, the longer, the better, which is confirmed by
and
in
Table 2. However, if the time is too long, after the response time of the stimulus, the acquired data will revert to the baseline of the EEG signal after the stimulus–response period, which may interfere with the results.
4. Discussion
In many application scenarios, such as a brain–controlled wheelchair and BCI spelling, a higher can meet the high–level requirements for the response time of controlling and transmission rate of signals in actual control. In this case, it is more practical to consider the than the accuracy alone; is similar to the concept of derivative. If the accuracy does not grow with it when the time grows by a certain value, the will decrease and vice versa.
As shown in
Table 2, when the
exceeds 80 bits/min, the data length is less than or equal to 2 s. Although the accuracy is only about 70%, abnormal data is limited during actual application processes, which means
will further increase, and it can meet the fundamental requirements of BCI wheelchair control.
As shown in
Figure 10, all metrics are time–dependent and most balanced at 2.5 s. It reveals that
,
and
are positively correlated with the time length, while
and
are negatively correlated with time length. The performance of
,
,
,
, which are all related to the accuracy, improves after time length increase, and
, which is related to the efficiency, on the contrary, decreases. Different application scenarios should decide the acquisition time length according to the requirements.
Two criteria can evaluate the performance of the model, one is the accuracy rate, and the other is the
. The accuracy rate is used as a criterion for a trial or application scenario, which needs higher precision but not a quicker acquisition time. The experimental data in this paper shows that the highest accuracy rate can be achieved with a time length of 3.5 s, four harmonics and five subbands, which is 88.9%.
has a relatively important significance for online testing. For the unsupervised FBCCA algorithm,
Table 2 above also lists some comparative
ITRs, and then the maximum
ITR can be achieved with a time length of 1.5 s, four harmonics and five subbands, which is 88.64 bits/min.
5. Conclusions
SSVEP is referred to as the rhythmic EEG signal induced by continuous visual stimulation. There are now several methods of studying SSVEP. The primary target of this study was to achieve the quick classification of unsupervised SSVEP using FBCCA. The unsupervised model required no training and was highly robust. Additionally, the experimental analysis revealed that the FBCCA algorithm outperformed the CCA algorithm in terms of the recognition classification and . The acquisition time should be chosen based on the needs of the application scenario when there are five subbands and four harmonics. The longer the acquisition time, the more appropriate it is for precision–required application scenarios, whereas the shorter the time, the more appropriate it is for high real–time required application scenarios.
For 40 targets with a frequency difference of 0.2 Hz, the FBCCA algorithm achieved an 88.9% identification rate and a maximum of 88.64 bits/min, which provides a reference value for subsequent SSVEP research. Compared to the CCA algorithm, the classification accuracy may rise by more than 20% when the data length is 2 s. However, we used offline datasets for research and only simulated online testing, which has its limitations. This research can continue to conduct real–time online testing in different application scenarios to solve this problem in the future.
Author Contributions
Conceptualization, Y.W., R.Y. and X.L.; methodology, Y.W. and W.C.; software, R.Y. and X.L.; validation, J.N.; formal analysis, X.L. and R.Y.; investigation, J.N.; resources, X.L.; data curation, X.L.; writing—original draft preparation, X.L. and R.Y; writing—review and editing, R.Y. and J.N.; visualization, R.Y.; supervision, Y.W. and W.C.; project administration, Y.W., W.C. and R.Y.; funding acquisition, Y.W. and W.C. All authors have read and agreed to the published version of the manuscript.
Funding
This research was funded by Beijing Natural Science Foundation (4202026).
Institutional Review Board Statement
Not applicable.
Informed Consent Statement
Not applicable.
Data Availability Statement
Conflicts of Interest
The authors declare no conflict of interest.
References
- Deng, X.; Yu, Z.L.; Lin, C.; Gu, Z.; Li, Y. A Bayesian Shared Control Approach for Wheelchair Robot With Brain Machine Interface. IEEE Trans. Neural Syst. Rehabil. Eng. 2019, 28, 328–338. [Google Scholar] [CrossRef] [PubMed]
- Hernández-Rojas, L.G.; Montoya, O.M.; Antelis, J.M. Anticipatory Detection of Self-Paced Rehabilitative Movements in the Same Upper Limb From EEG Signals. IEEE Access 2020, 8, 119728–119743. [Google Scholar] [CrossRef]
- Mehreen, A.; Anwar, S.M.; Haseeb, M.; Majid, M.; Ullah, M.O. A Hybrid Scheme for Drowsiness Detection Using Wearable Sensors. IEEE Sens. J. 2019, 19, 5119–5126. [Google Scholar] [CrossRef]
- Jin, J.; Miao, Y.; Daly, I.; Zuo, C.; Hu, D.; Cichocki, A. Correlation-based channel selection and regularized feature optimization for MI-based BCI. Neural Netw. 2019, 118, 262–270. [Google Scholar] [CrossRef] [PubMed]
- Huang, W.; Zhang, P.; Yu, T.; Gu, Z.; Guo, Q.; Li, Y. A P300-Based BCI system using stereoelectroencephalography and its application in a brain mechanistic study. IEEE Trans. Biomed. Eng. 2020, 68, 2509–2519. [Google Scholar] [CrossRef] [PubMed]
- Wong, C.M.B.W.; Wang, Z.; Lao, K.F.; Rosa, A.; Wan, F. Spatial filtering in SSVEP-based BCIs: Unified framework and new improvements. IEEE Trans. Biomed. Eng. 2020, 67, 3057–3072. [Google Scholar] [CrossRef] [PubMed]
- Hsu, H.T.; Shyu, K.K.; Hsu, C.C.; Lee, L.H.; Lee, P.L. Phase-Approaching Stimulation Sequence for SSVEP-Based BCI: A Practical Use in VR/AR HMD. IEEE Trans. Neural Syst. Rehabil. Eng. 2021, 29, 2754–2764. [Google Scholar] [CrossRef] [PubMed]
- Chevallier, S.; Kalunga, E.K.; Barthélemy, Q.; Monacelli, E. Review of Riemannian distances and divergences, applied to SSVEP-based BCI. Neuroinformatics 2021, 19, 93–106. [Google Scholar] [CrossRef] [PubMed]
- Park, S.; Cha, H.S.; Kwon, J.; Kim, H.; Im, C.H. Development of an online home appliance control system using augmented reality and an ssvep-based brain–computer interface. In Proceedings of the 2020 Eighth International Winter Conference on Brain–Computer Interface (BCI), Gangwon, Korea, 26–28 February 2020; pp. 1–2. [Google Scholar]
- Venuto, D.D.; Mezzina, G. A single-trial P300 detector based on symbolized EEG and autoencoded-(1D) CNN to improve ITR performance in BCIs. Sensors 2021, 21, 3961. [Google Scholar] [CrossRef] [PubMed]
- Ke, Y.; Liu, P.; An, X.; Song, X.; Ming, D. An online SSVEP-BCI system in an optical see-through augmented reality environment. J. Neural Eng. 2020, 17, 016066. [Google Scholar] [CrossRef] [PubMed]
- Zhu, Y.; Li, Y.; Lu, J.; Li, P. EEGNet with ensemble learning to improve the cross-session classification of SSVEP based BCI from Ear-EEG. IEEE Access 2021, 9, 15295–15303. [Google Scholar] [CrossRef]
- Cherloo, M.N.; Amiri, H.K.; Daliri, M.R. A novel approach for frequency recognition in SSVEP-based BCI. J. Neurosci. Methods 2022, 371, 109499. [Google Scholar] [CrossRef] [PubMed]
- Kwon, J.; Im, C.H. Novel Signal-to-Signal Translation Method Based on StarGAN to Generate Artificial EEG for SSVEP-Based Brain–Computer Interfaces. Expert Syst. Appl. 2022, 203, 117574. [Google Scholar] [CrossRef]
- Mao, X.; Li, W.; Hu, H.; Jin, J.; Chen, G. Improve the classification efficiency of high-frequency phase-tagged SSVEP by a recursive bayesian-based approach. IEEE Trans. Neural Syst. Rehabil. Eng. 2020, 28, 561–572. [Google Scholar] [CrossRef] [PubMed]
- Lin, J.; Liang, L.; Han, X.; Yang, C.; Chen, X.; Gao, X. Cross-target transfer algorithm based on the volterra model of SSVEP-BCI. Tsinghua Sci. Technol. 2021, 26, 505–522. [Google Scholar] [CrossRef]
- Bolaños, M.C.; Ballestero, S.B.; Puthusserypady, S. Filter bank approach for enhancement of supervised Canonical Correlation Analysis methods for SSVEP-based BCI spellers. In Proceedings of the 2021 43rd Annual International Conference of the IEEE Engineering in Medicine & Biology Society (EMBC), Online, 1–5 November 2021; pp. 337–340. [Google Scholar]
- Liu, Q.; Jiao, Y.; Miao, Y.; Zuo, C.; Wang, X.; Cichocki, A.; Jin, J. Efficient representations of EEG signals for SSVEP frequency recognition based on deep multiset CCA. Neurocomputing 2020, 378, 36–44. [Google Scholar] [CrossRef]
- Zhang, H.Y.; Stevenson, C.E.; Jung, T.P.; Ko, L.W. Stress-induced effects in resting EEG spectra predict the performance of SSVEP-based BCI. IEEE Trans. Neural Syst. Rehabil. Eng. 2020, 28, 1771–1780. [Google Scholar] [CrossRef] [PubMed]
- Wei, Q.; Zhu, S.; Wang, Y.; Gao, X.; Guo, H.; Wu, X. A training data-driven canonical correlation analysis algorithm for designing spatial filters to enhance performance of SSVEP-based BCIs. Int. J. Neural Syst. 2020, 30, 2050020. [Google Scholar] [CrossRef] [PubMed]
- Zhao, J.; Zhang, W.; Wang, J.H.; Li, W.; Lei, C.; Chen, G.; Liang, Z.; Li, X. Decision-making selector (DMS) for integrating CCA-based methods to improve performance of SSVEP-based BCIs. IEEE Trans. Neural Syst. Rehabil. Eng. 2020, 28, 1128–1137. [Google Scholar] [CrossRef] [PubMed]
- Chen, Y.; Yang, C.; Chen, X.; Wang, Y.; Gao, X. A novel training-free recognition method for SSVEP-based BCIs using dynamic window strategy. J. Neural Eng. 2021, 18, 036007. [Google Scholar] [CrossRef] [PubMed]
- Ravi, A.; Pearce, S.; Zhang, X.; Jiang, N. User-specific channel selection method to improve SSVEP BCI decoding robustness against variable inter-stimulus distance. In Proceedings of the 2019 Ninth International IEEE/EMBS Conference on Neural Engineering (NER), San Francisco, CA, USA, 20–23 March 2019; pp. 283–286. [Google Scholar]
| Publisher’s Note: MDPI stays neutral with regard to jurisdictional claims in published maps and institutional affiliations. |
© 2022 by the authors. Licensee MDPI, Basel, Switzerland. This article is an open access article distributed under the terms and conditions of the Creative Commons Attribution (CC BY) license (https://creativecommons.org/licenses/by/4.0/).


