1. Introduction
The bipropellant propulsion system has been used in a large number of high-orbit satellites for orbit transfer and attitude control such as the BSS 601/702 satellite, Symphony satellite, and Dongfanghong satellite [
1,
2]. In this system, the apogee engine and attitude-control thrusters share a set of propellant feed systems with dual mode. During the orbital transfer process, the regulated mode is commonly used to feed the propellant for the apogee engine, and then the blowdown mode provides propellants for the thrusters with the operation of attitude control and station keeping after moving into orbit. In blowdown mode, bipropellant thrusters have to operate well with high performance and reliability over a pressure range [
3,
4,
5,
6,
7,
8,
9,
10,
11,
12,
13]. For thrusters, the mixture ratio is an important factor to determine the bipropellant thruster performance and reliability, especially under so many complex conditions.
MMH (monomethyl hydrazine) as the fuel and NTO (nitrogen tetroxide) as the oxidizer is one propellant combination used on high-orbit satellites [
14,
15]. In this study, the mixture ratio of these two propellants focused on the analysis and prediction. The optimal mixture ratio of NTO and MMH used in the bipropellant propulsion system is 1.65, which is also the ratio of the density of the oxidizer to fuel, so that the volume of the two propellants in the system is equal. On one hand, the combustion under this mixture ratio is relatively fuel-rich, which is conducive to organizing a cooling film with a safe working temperature. On the other hand, the NTO tank and MMH tank can achieve the equal-volume requirement for design, filling, and discharge. Once the thruster’s mixture ratio deviates from the norm to a large extent, its thrust and working temperature sequentially move further, affecting the ignition safety in space with a great negative influence on its working life span [
16,
17]. Only a few complex bipropellant propulsion systems have been designed with the precise mixing ratio control of the closed loop [
18]; most are controlled in a conventional way to set a pair of orifices for throttling at the engine’s upstream [
19]. The flow resistance deviation is tested and then accordingly adjusted to meet the accurate requirements in engineering applications [
20].
For attitude control thrusters on orbit, there are three main stages: orbital transfer attitude control, attitude control on orbit, and station keeping for spacecrafts. The pressure conditions at these three stages are different, and thus the range of the mixture ratios under the typical working conditions is shown in
Table 1 [
21]. It shows that the mixture ratio accuracy requirement of the bipropellant thruster is quite high [
22,
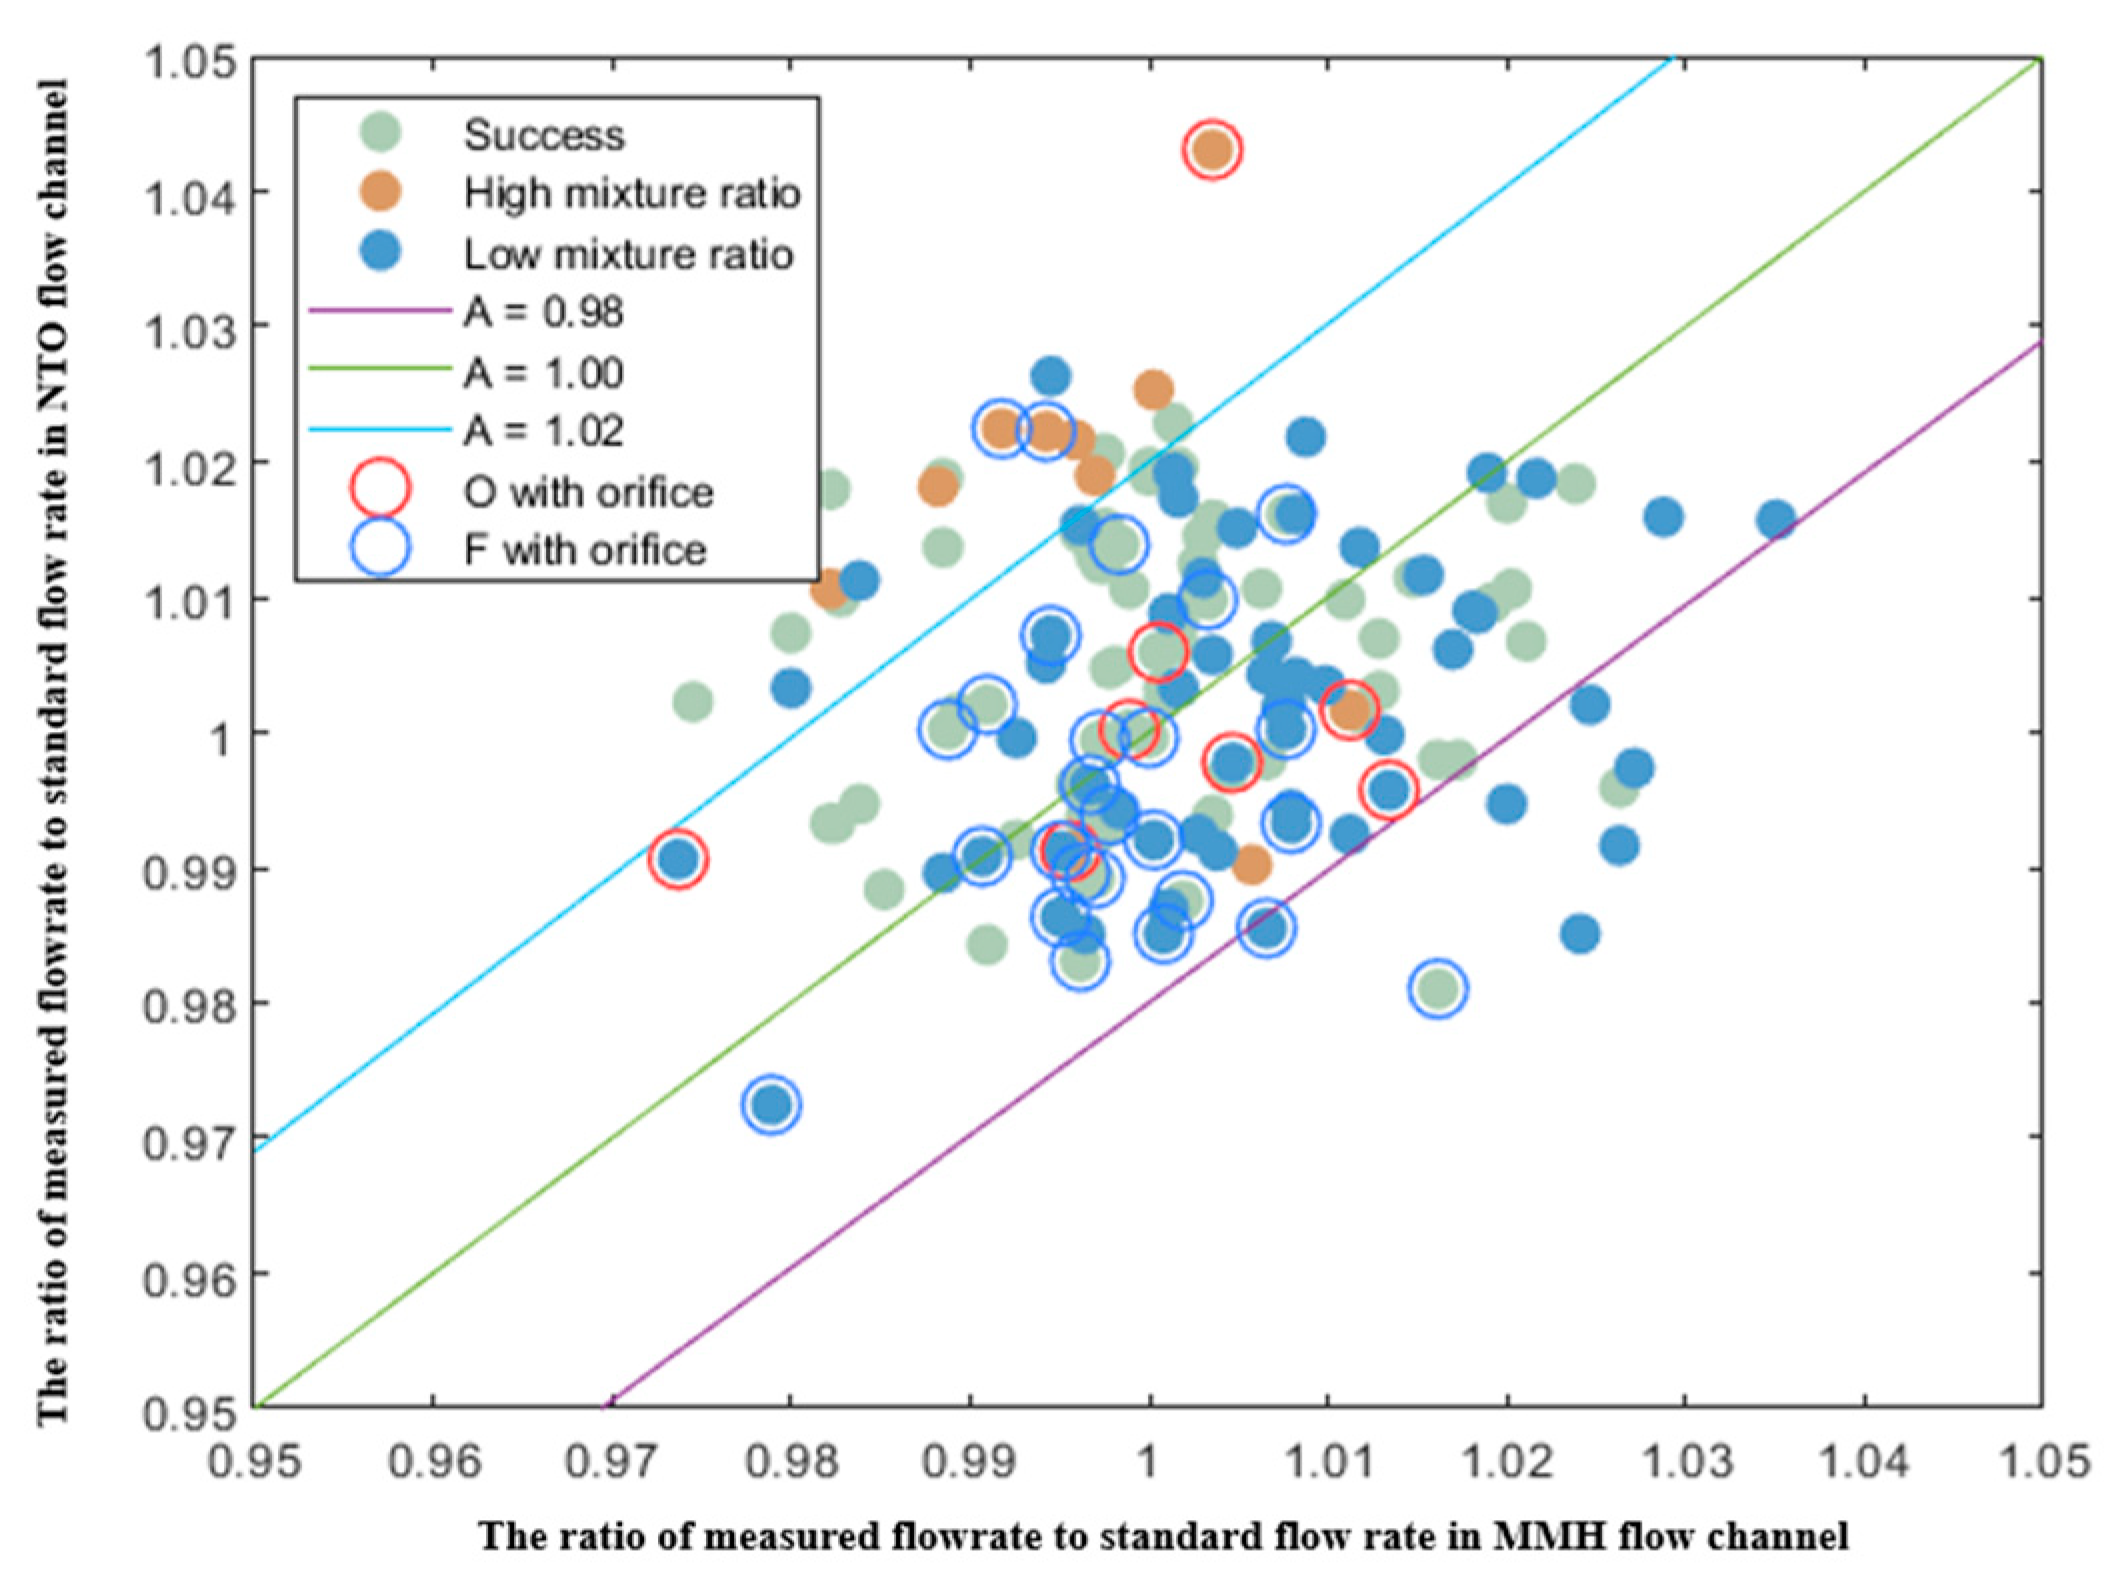
23]. Therefore, each thruster needs to go through liquid-flow tests many times and is then calibrated in the firing test at a rather high cost. The purpose is to provide a relatively accurate mixture ratio with the other performance parameters for space-mounted thrusters, experimentally match those thrusters with similar thrust, and effectively save on the precious propellant for satellites. However, after firing tests for hundreds of thrusters, it was found that there was a huge unexpected difference between the liquid-flow test results and the firing test data. For example, even when the flow rate results of the two thrusters after orifice adjustment were almost the same, their firing test data were still rather far from each other. There is no logical correlation between these two kinds of tests, which makes it difficult to learn the association rules and master the adjustment law, as shown in
Figure 1. The number of thrusters in one batch was around 120, and only about 40 thrusters (represented by green circles) were successful in the firing tests. Therefore, more than 60% of thrusters needed to correct the orifice size after the firing test, but those results after correction cannot be further verified by the firing test. That is, the adjusted thrusters, after the tests, launched to the space orbit still lacked the final mixture ratio verification. In particular, there was no direct logical bridge between the liquid-flow test and real work condition. This might lead to a huge bias in the estimation of the amount of propellant remaining for spacecrafts on orbit.
In the conventional approach to the mixture ratio adjustment, the mixture ratio is predicted by using the flow rate data in the liquid-flow test with a coefficient correction based on experience.
Figure 1 shows the mixture ratio data of a batch of thrusters in the firing tests after orifice adjustment. The data came from the flow rate test, and alcohol was used as the test medium. In the test, under the design inlet pressure, the flow rates of the NTO and MMH channels were measured, respectively, in order to achieve the standard mixing ratio during the firing test. The three straight lines in
Figure 1 are the contour lines of the ratios of the alcohol flow rate deviation between the NTO flow channel and the MMH flow channel. It can be seen that the number of successful cases with an accepted mixture ratio was much less than those that deviated, and the regularity was also not on the logical track. Moreover, there was no significant difference in the impact of the orifice adjustment. It can be concluded that when the A value is large, the proportion of high mixture ratio goes up, otherwise, there are more thrusters with a low mixture ratio. However, this only reflects a qualitative trend, but cannot be quantitatively predicted. It is inferred that there must be some other hidden factors that need to be explored to influence the final results.
The BP neural network is a machine learning method based on a multi-layer neural network [
24,
25]. It can fit all the multi-dimensional nonlinear parameter mapping relations through adaptive weight allocation and the activation function and also has a strong fitting ability with an arbitrary complex pattern. Therefore, this feedforward neural network is consequently used to learn the historical data and analyze the weight of factors that determine the deviation of the mixture ratio. In this way, the influence parameters of each thruster can be processed into sequence data according to the weight value. After this, RNN extracts the features with the highest weight through a “many-to-one” structure [
26,
27], which can effectively solve the problem of sequence classification. The BP method is used to select and sort the test features after the weight comparison of the influence of features on the mixing ratio, and then the RNN method is used to predict the mixing ratio, so was called the BP-RNN chain method, as proposed in this study. The high-precision prediction of the mixture ratio based on a BP-RNN chain method can be realized according to the historical data training, in order to expectedly adjust the orifice size in advance and improve the qualified rate of the thrusters’ mixture ratio in one time in the firing test.
2. Dataset and Network
2.1. Dataset Construction
A total of 480 thrusters test data both in the liquid-flow test and firing test were included in the dataset for fitting, training, and testing. All 480 thrusters came from many batches produced over a three-year period for satellite attitude control, and the thrusters underwent complete liquid-flow tests and firing tests. Through these tests, it was ensured that the thrusters obtained the qualified performance of the specific impulse, thrust and mixture ratio, with the working temperature in a safe range. Features were selected across the whole manufacturing process from injector tests to thruster tests.
In the injector test process, the flow test and spray test are mainly conducted. A swirl injector is a key component that determines the combustion organization and cooling quality of a thruster. The flow test uses deionized water to test the flow rate of the MMH and NTO channels under the design pressure. The flow rate test was performed twice using both the flow meter measurements and a 30 s weighing method. The first was the test after the injector assembly. Once the test result was qualified, the welding manufacturing was carried out. Under the compact structure of the injector, the minimum gap of the flow channel was less than 0.1 mm. The micro deformation caused by the welding might result in great change in the flow rate or a failed spray with a huge negative effect. Thus, a second flow rate retest needs to be conducted after welding. The spray test of the injector also uses deionized water as the test medium. At the design flow rate, two nozzles are ordered to spray at the same time. The SMD (Sauter mean diameter) value is measured by the Malvin droplet size measurement system. Therefore, in the injector stage, there are five important test results that can be used for prediction.
In the thruster test process, in which the thrust chamber and solenoid valve are assembled with the injector, throat size measurements and the thruster flow test are mainly carried out. Except for the chamber throat diameter measurement, the thruster flow rate test was also conducted twice using alcohol as the test medium. The first test measures the flow rate of the MMH and NTO channels with valves but no orifice under the design pressure. In the second test, the orifice needs to be added with a size adjustment according to the Bernoulli equation and modified formula. Therefore, in the thruster test process, there are also five important test results we can use in the network. These 10-dimensional test results were selected for the dataset construction as features.
The selection of the characteristic data included two categories: historical flowrate related data and combustion related data. The historical flow rate related data included: (1) The MMH and NTO flow rate before injector welding; (2) the MMH and NTO flow rate after injector welding; (3) the MMH and NTO flow rate after thruster assembly; and (4) the MMH and NTO flow rate with the adjusted orifice. The combustion related data included the SMD value in the spray atomization test and the throat diameter of the combustion chamber. These results are raw data in the tests, reflecting the important history and technical characteristics in the manufacturing process.
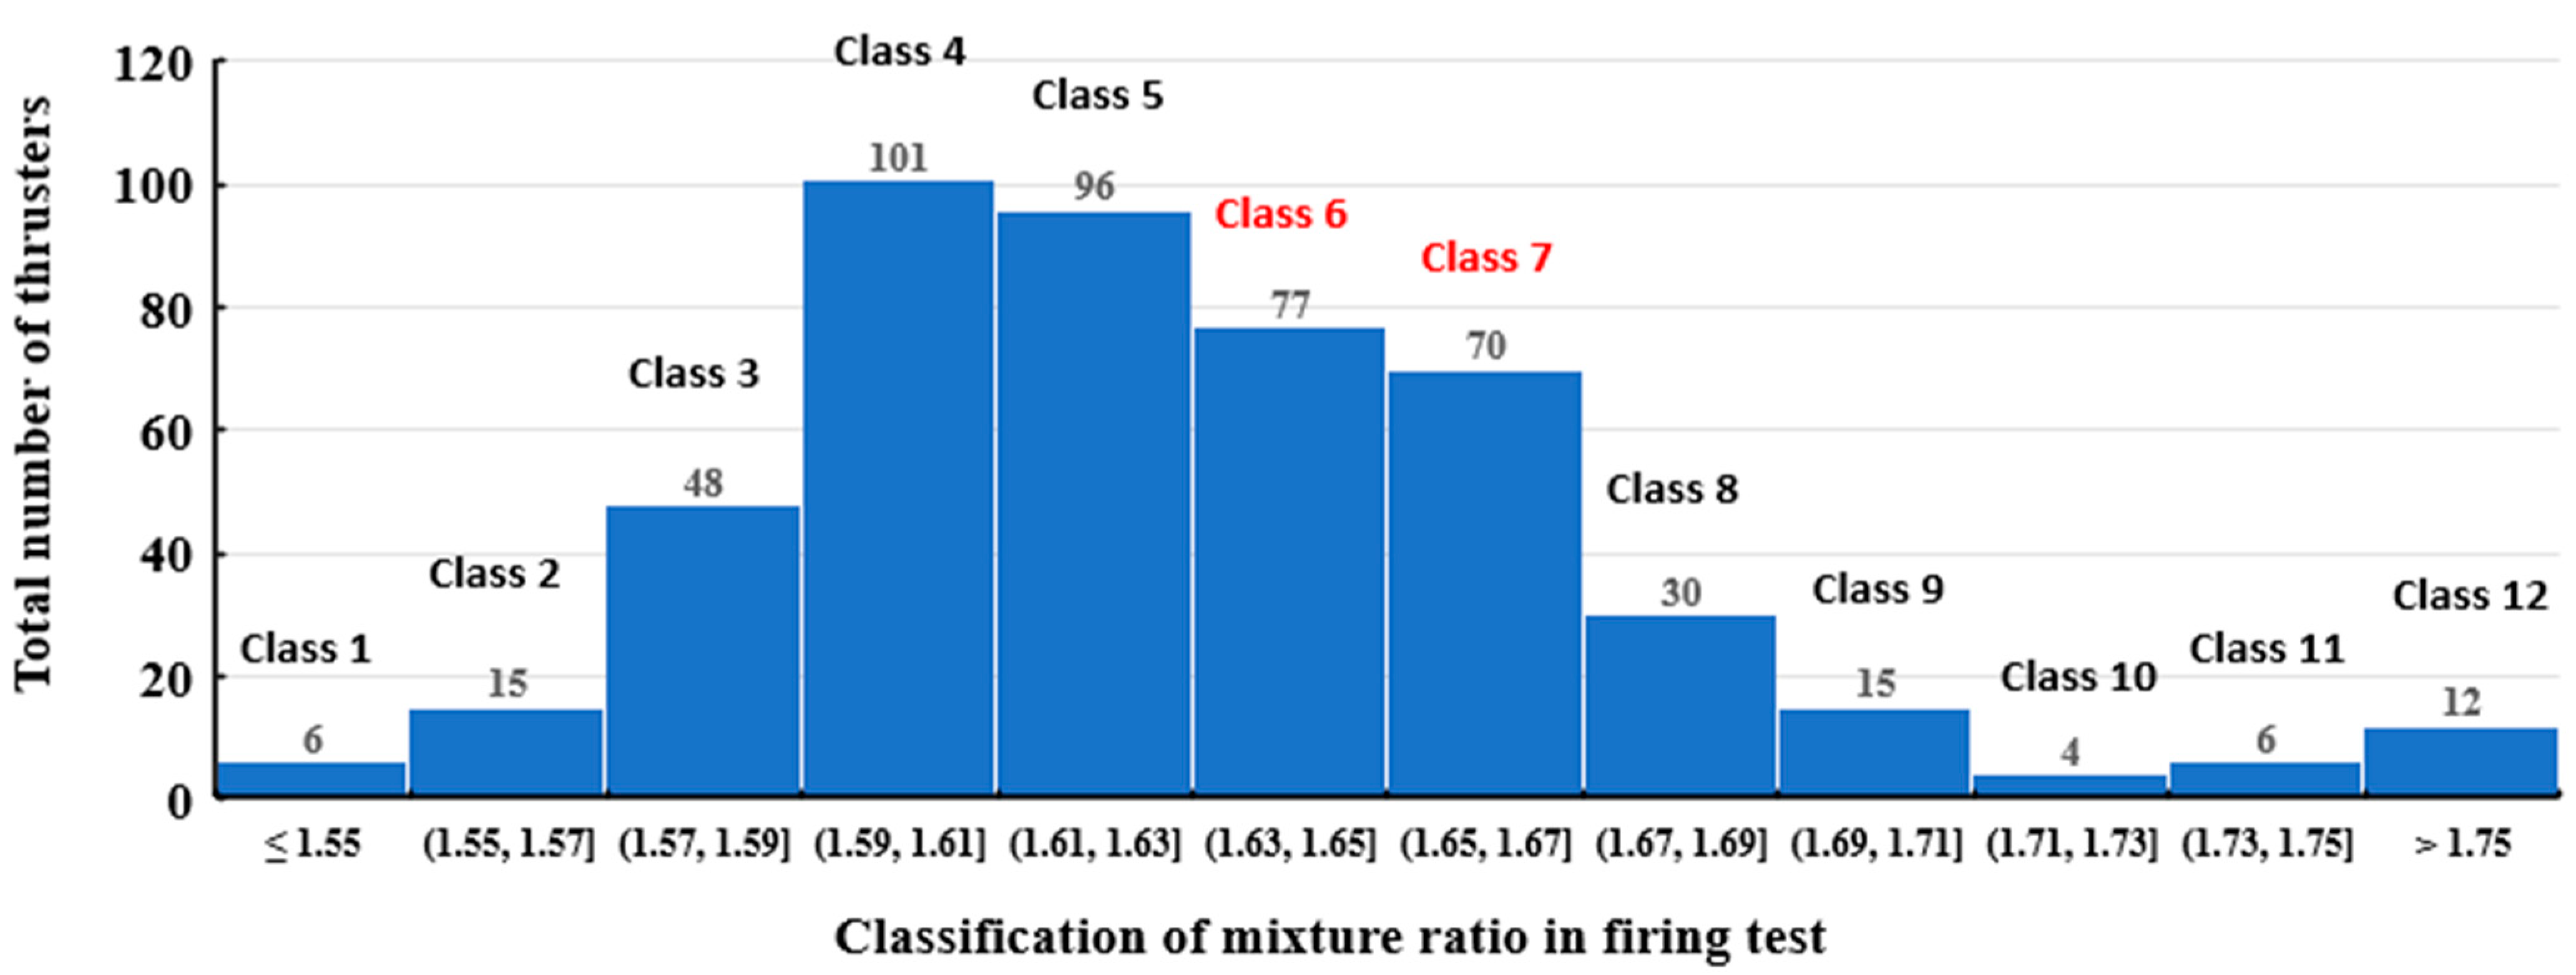
The tested results of the thrusters’ mixture ratio in the firing test were used as the labels of the 10-dimensional features in the dataset. Neural networks are very good at the accurate prediction of classification. Therefore, the mixture ratio results were divided into some classifications. The target mixture ratio was 1.65, so it was set as the middle value. The range of 0.02 was an acceptable deviation, and 1.63–1.65 and 1.65–1.67 were the two classification intervals adjacent to the middle value. Based on this rule, each 0.02 interval was used as a classification range until all of the mixing ratio results of the 480 thrusters were covered, and finally 12 classifications were obtained, as shown in
Figure 2. Classes 1–6 and 7–12 are represented as below and above the standard mixture ratio, respectively. Among them, only class 6 and 7 were qualified. It can be seen in
Figure 2 that the peak regions of the mixture ratio appeared at class 4 and 5, showing that the mixture ratio of many thrusters in the firing test was concentrated in the range of 1.59~1.63.
Because the number of thrusters is limited and relatively insufficient for machine learning, data enhancement was required to enrich our input information. In each group of datasets, the feature value achieved 1:50 data expansion by adding 1% random noise, which was the range of the systematic error in the test, while the corresponding label classification value of the expanded data remained unchanged. In this way, 24,000 sets of data were expanded for network analysis.
2.2. Fitting Network Construction
A BP neural network with a full connection structure was used to conduct the fitting calculation with batch normalization for all 480 thrusters with enhanced data. Compared with other methods, the BP neural network could achieve better fitting results with less data. The purpose was to evaluate the influencing weight of each feature on the final label. Each node of the 10-dimensional features input needed to perform a point-to-point calculation with every neuron in the hidden layer by weighted summation and nonlinear activation. The hidden layer adopted a three-layer structure with 3000, 2000, and 1000 neurons from the first to the third layer, respectively. The number of neurons in each hidden layer were hyperparameters that were determined by network debugging. We computed the hidden neurons for each step with the ReLU function, which is a non-linear activation function used in neural networks. Then, the output value was compared with the correct label of the tested mixture ratio classification in the firing test. Finally, the root mean square error was computed to realize forward propagation for the loss calculation, thus being updated by Adam optimization [
28].
2.3. Prediction Network Construction
The test results of 330 thrusters selected randomly with their enhanced data were regarded as the training set, and the rest were regarded as the test set. As for the RNN, the sequence length of the feature data is not suggested to be long, so the sequence length must be controlled under 5. This bidirectional network was then combined with an influence-based approach. Only the features with a higher weight could be extracted as the sequence data. The factors with a higher weight were put behind in the sequence, so their influence on the final output will increase accordingly. However, the MMH and NTO flow rate with the adjusted orifice must be the last two features to adjust the mixture ratio. Therefore, in the sequence, these two features need to be put behind close to the output, in order to realize a correction for a better prediction target. The number of hidden layers in the RNN was 2, and the number of each hidden layer neurons was 200, which was also determined after many network tests. All weights were randomly initialized with a gaussian distribution. The hidden layer was activated by the Tanh function and LeakyReLU function, which are two different non-linear activation functions, the loss was computed by the CrossEntropyLoss function, which is useful when training a classification problem, and the output model was based on the Softmax layer, which is a generalization of logistic regression that can be used for multi-class classification. The optimization method is the combination of the Adam optimizer in the RNN layer and Adagrad optimizer in the Softmax layer [
29], which was shown to be the most efficient in time and accuracy.
3. Results and Discussion
3.1. Weight Analysis
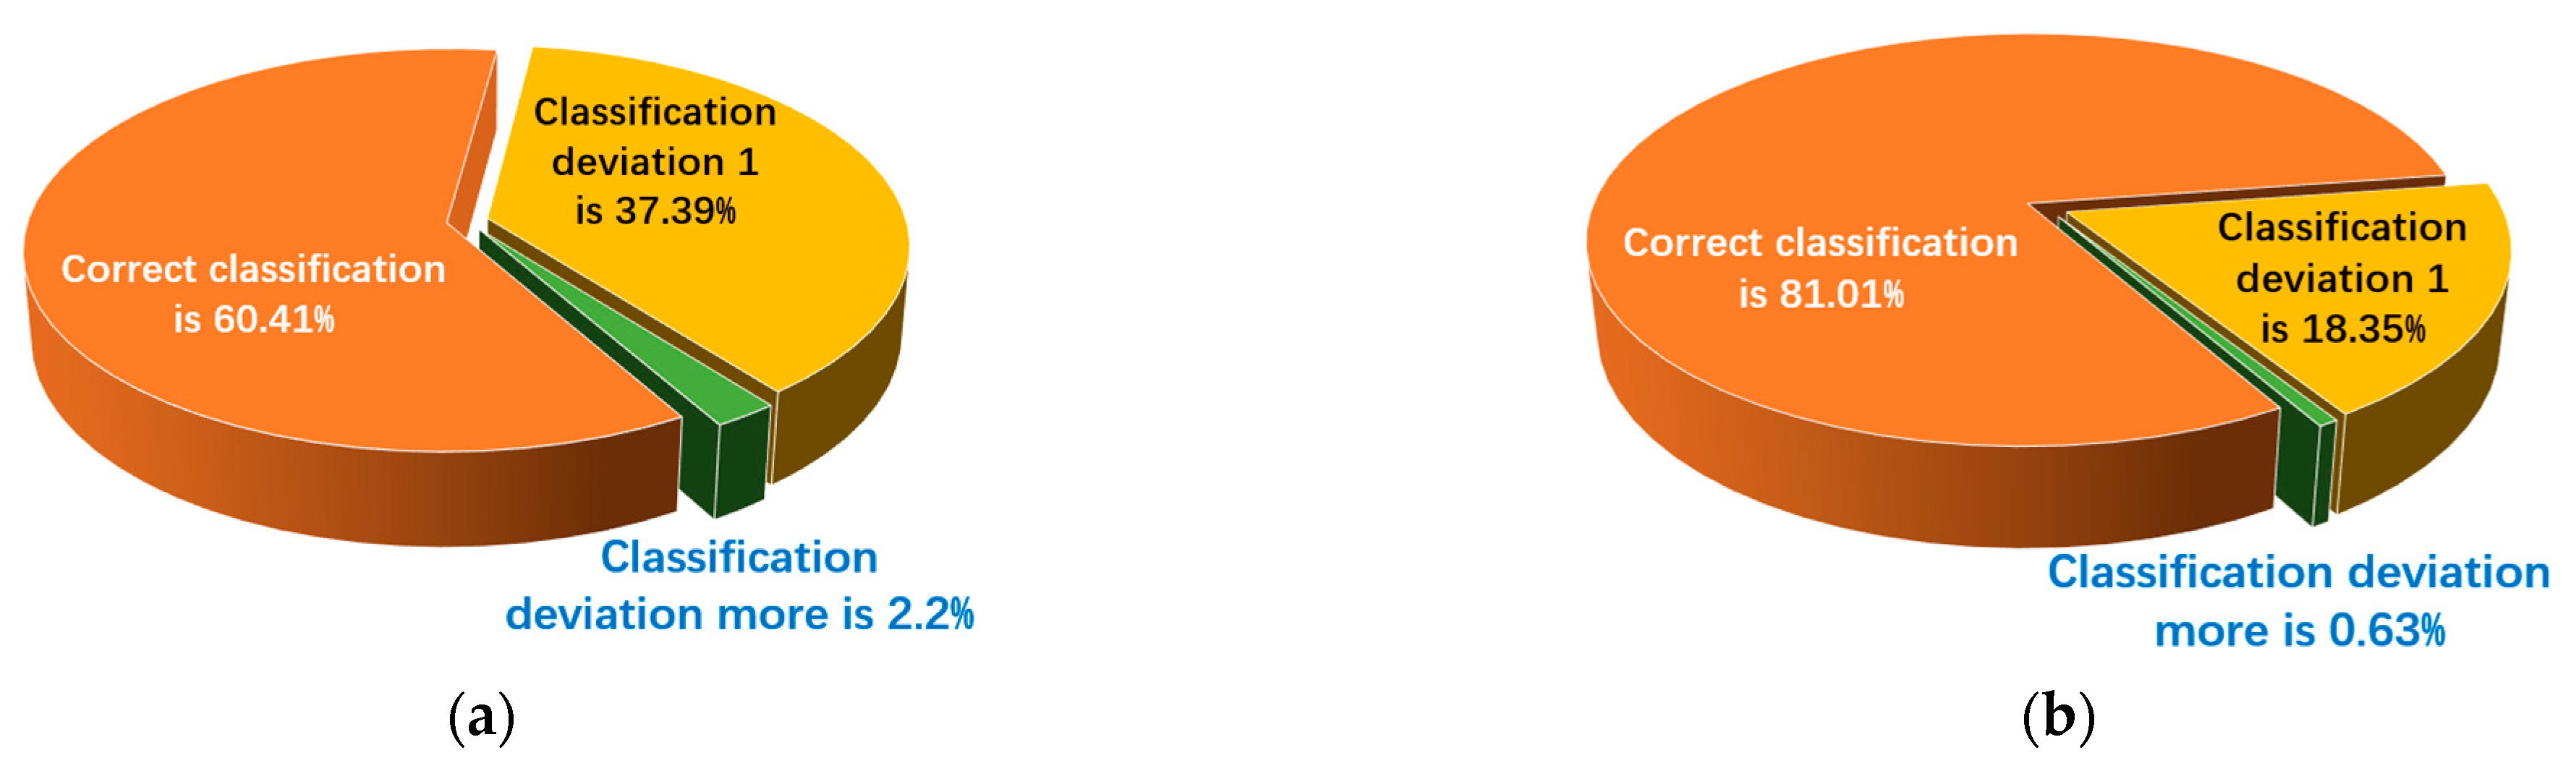
After updating the fully connected BP neural network for 20,000 epochs, the weight of the influence of 10-dimensional parameters on the mixture ratio was learned and fitted. As seen in
Figure 3a, for all of the enhanced data, 60.41% of the fitting results were completely accurate, and 37.39% had a small classification deviation of only 1, which was also acceptable. The predicted results of the mixture ratio close to the critical point could indeed fall into an adjacent classification, so a total sum of 97.8% of the fitting results was acceptable. When focusing on the raw data of the 480 thrusters, as shown in
Figure 3b, the accuracy of the fitting could be further improved. The percentage of the accurate fitting results was 81.01%, and 18.35% obtained a classification deviation of 1. This means that only 0.63% was unacceptable with a large deviation. Therefore, the results of the historical data fitting were reliable.
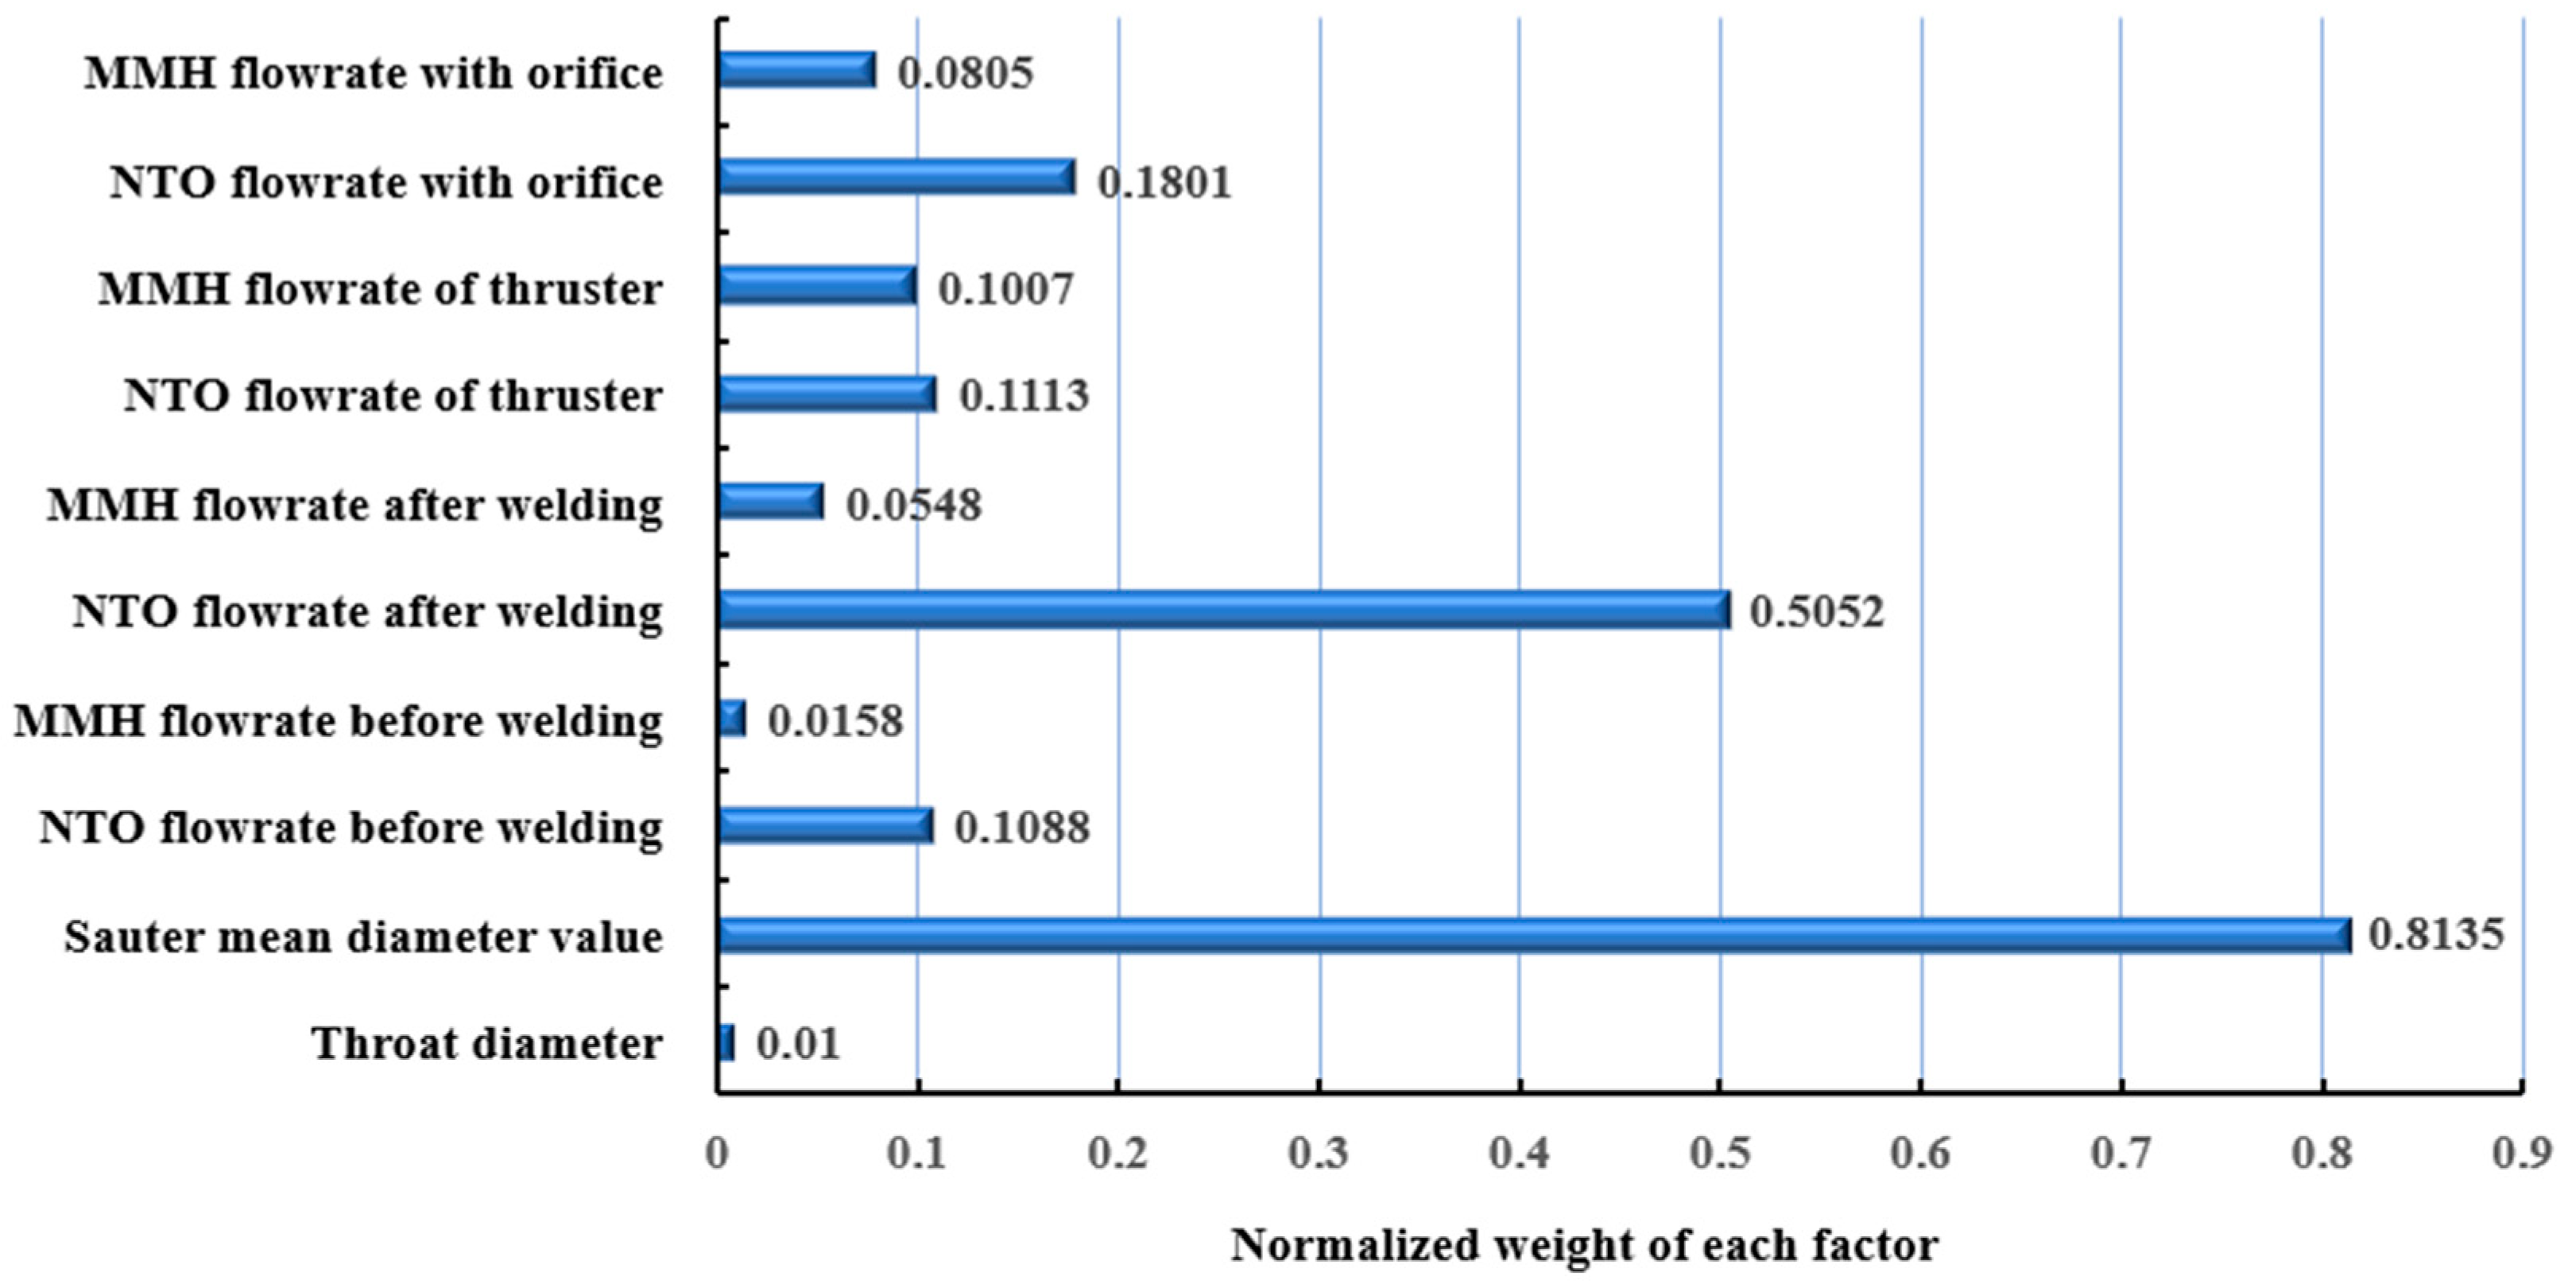
Through normalization, the weight of 10 characteristic features, which means the extent of influencing the mixture ratio, is shown in
Figure 4. The contribution of the SMD value and flow rate after injector welding in the NTO flow channel was shown to effect the mixture ratio more significantly than that of the other features. Compared to the thruster flow rate with the orifice, these two reasons can play more important roles, which are the main hidden reasons why there is often such a large difference between the liquid-flow test results and the firing test data.
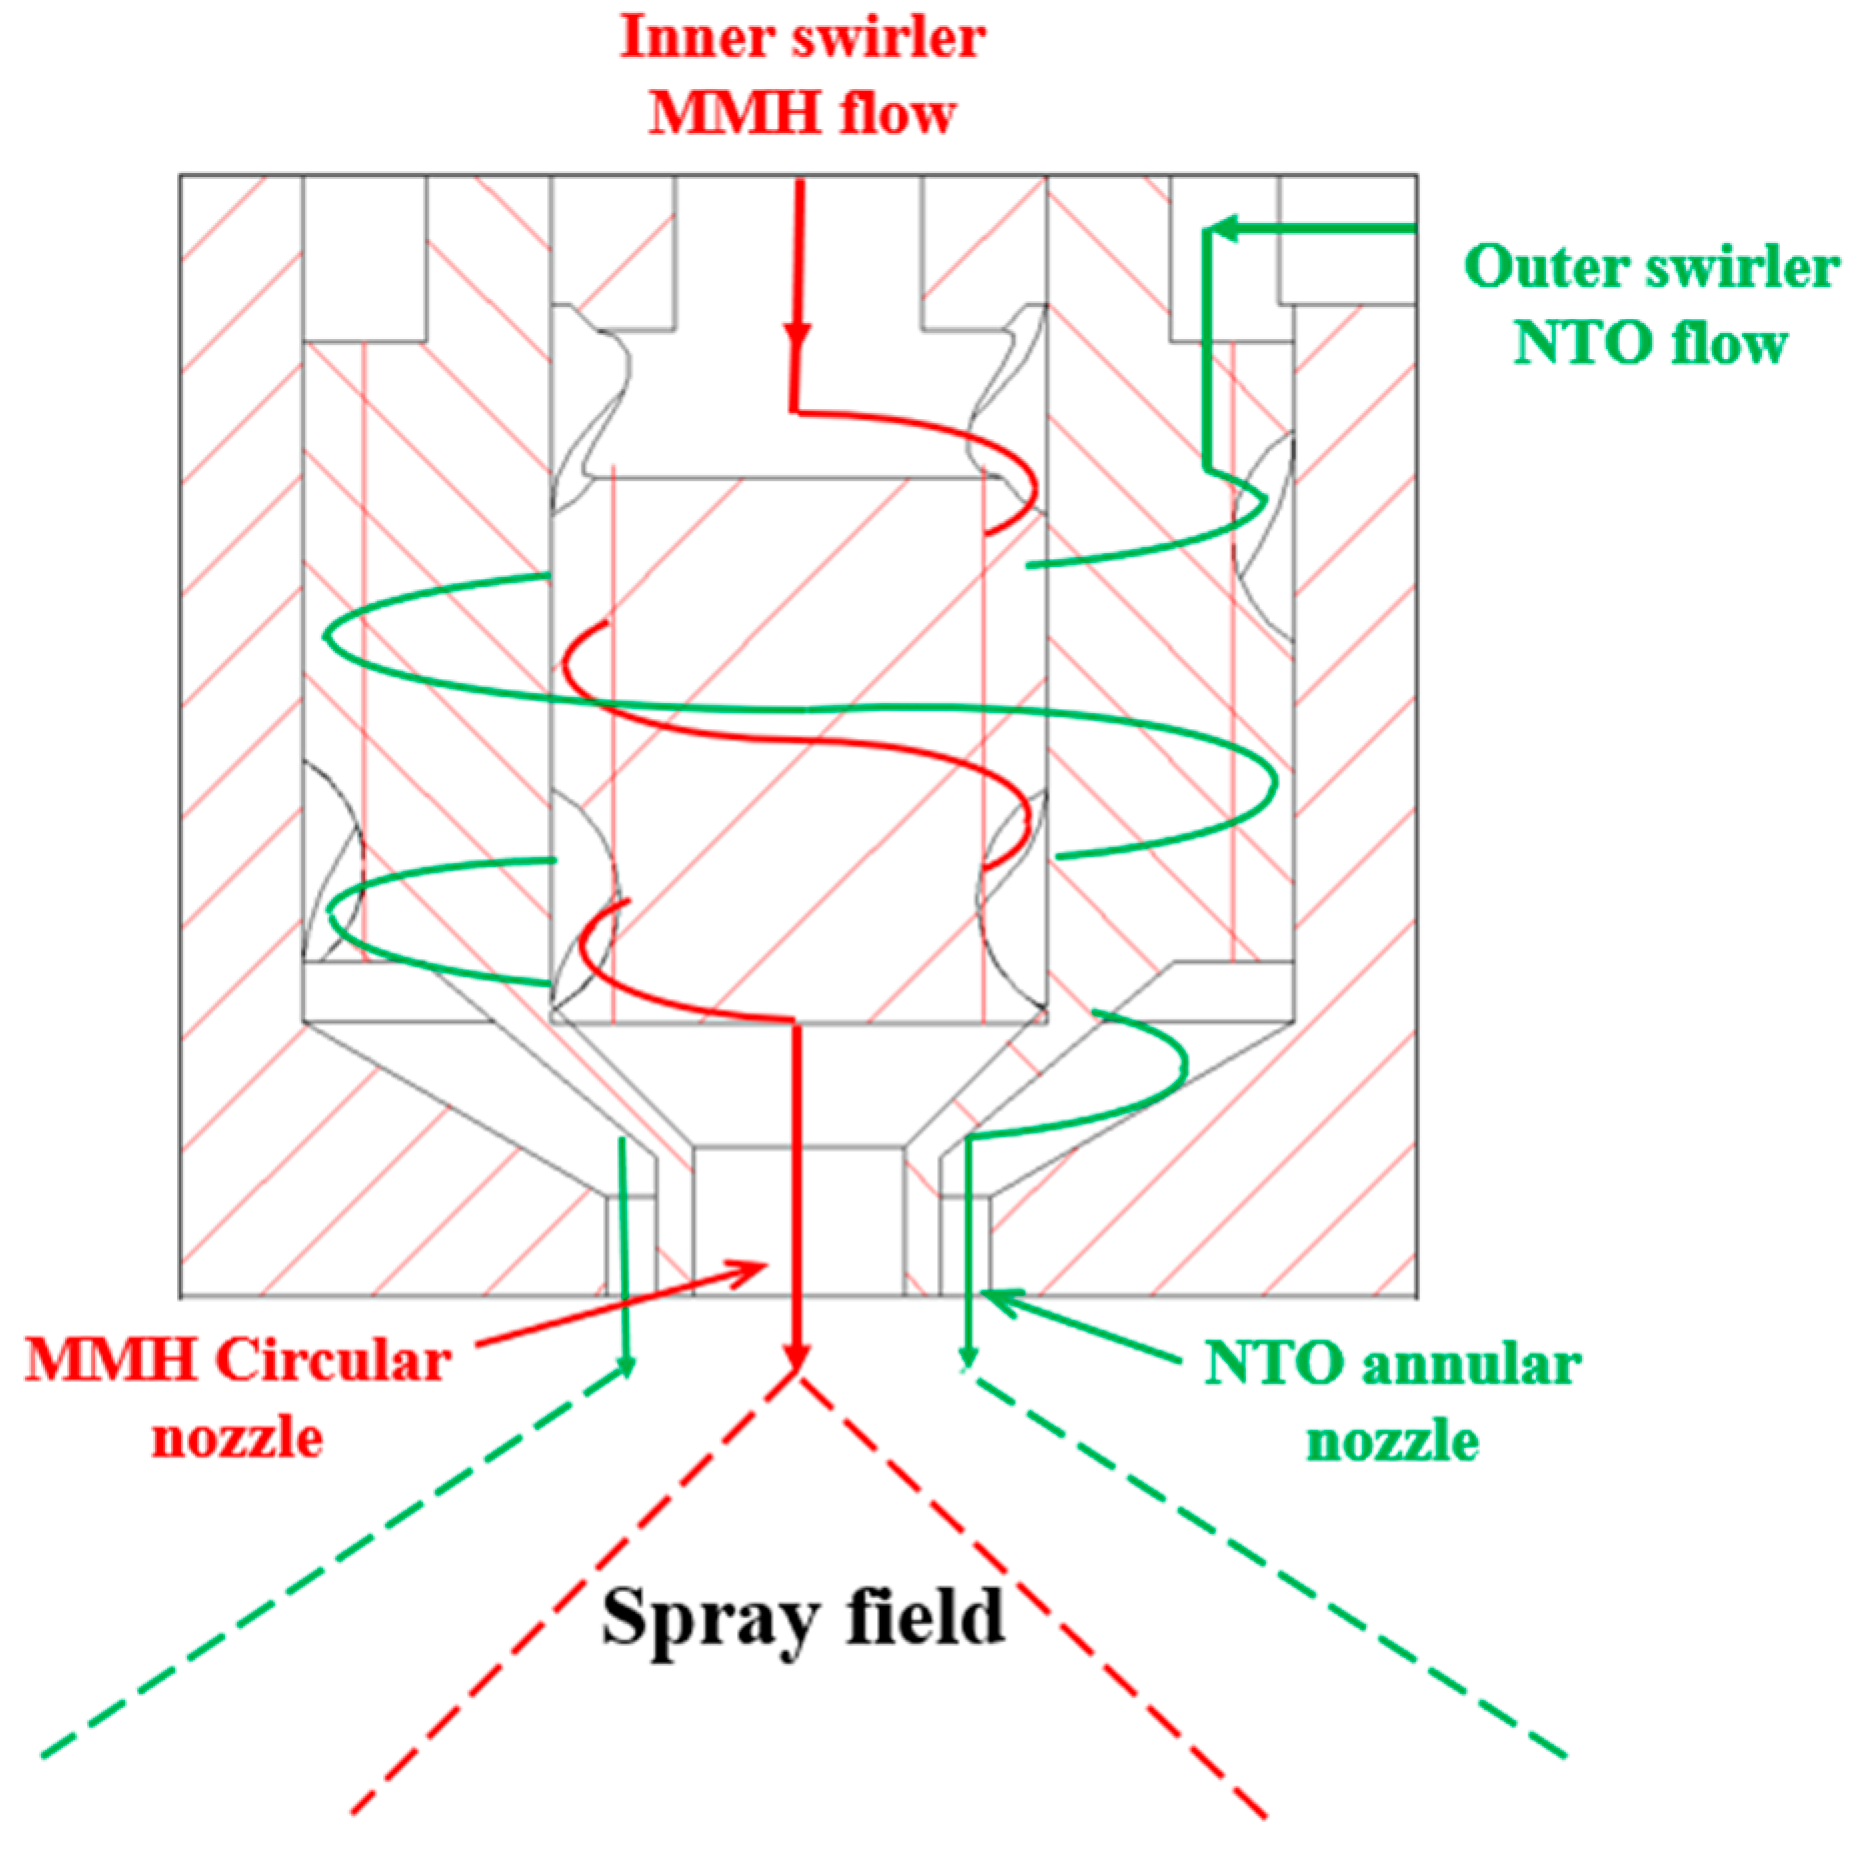
Among all the flow rate related characteristics, the influence of the NTO flow results after injector welding was the largest. This shows that the injector welding process has a great effect on the NTO flow channel. As shown in
Figure 5, compared to the MMH flow channel with a circular nozzle, the NTO flow channel was more sensitive due to its annular nozzle structure. In particular, at welding temperatures of more than 900 degrees, a small deformation of the NTO nozzle gap can significantly affect the subsequent spray atomization and flow characteristics. Therefore, the micro deformation and flow rate change in the NTO flow channel after welding need to be given more attention in the manufacturing process.
Except for the flow rate related features, the SMD value is the factor that has never been previously considered in the mixture ratio adjustment, but has the greatest weight of influence. It shows that atomization and combustion also significantly determine the deviation of the mixture ratio, however, this effect cannot be verified in the flow rate test, but only in the firing tests in the past.
Therefore, these two features were regarded as the sequence features, together with the final flow rate with orifice of the MMH and NTO, and were carried out in the RNN for four-to-one classification prediction of the mixture ratio.
3.2. Mixture Ratio Prediction
As already mentioned, in the input sequence of the RNN, the last two parameters are the NTO and MMH flow rate of the thruster with the orifice because these are the main control parameters that can be used for the mixture ratio adjustment in the last step. The influence weight of the NTO flow rate after welding is smaller than the SMD value, so it is in the first place in the sequence. The input sequence is shown in the following order in
Figure 6. Through mutual transmission between the input layer, hidden layers, and output layer, the information of the data is propagated backward, and the classification result of the predicted mixture ratio classification is given after the last hidden layer.
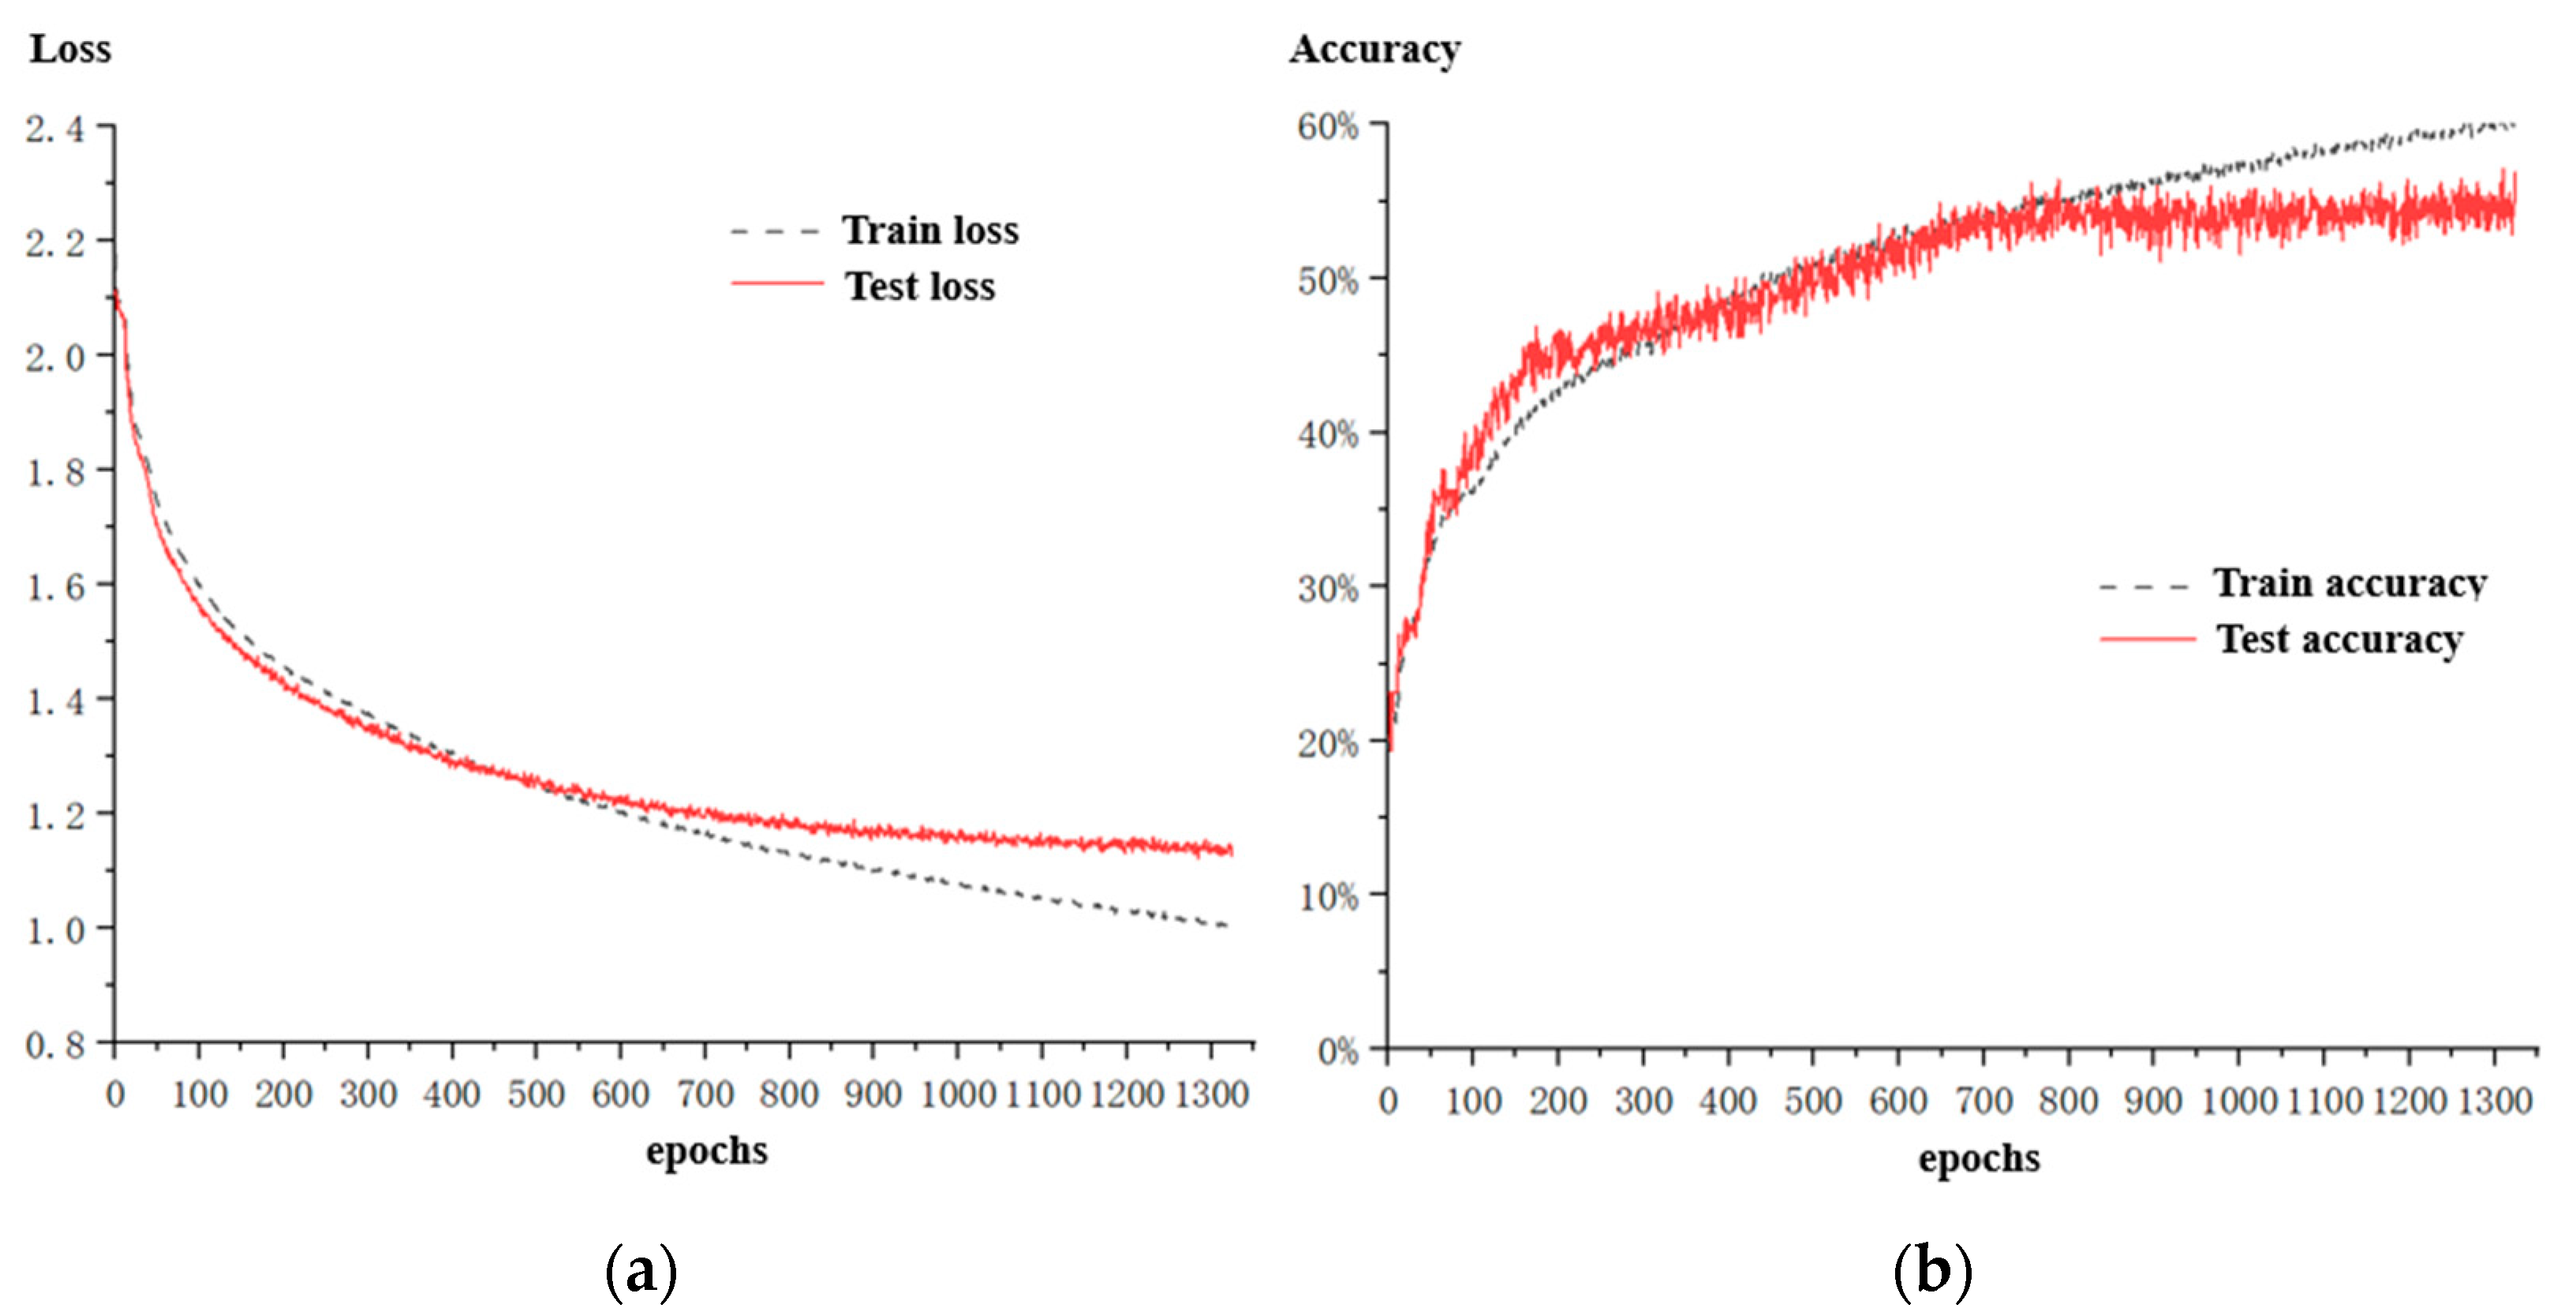
Figure 7 shows the curves of the classification loss and accuracy of the training dataset and test dataset as the number of epochs increased. After many hyperparametric comparisons, at dropout value of 0.1 and weight decay value of 0.01, the loss and accuracy of the test set were stable, slightly lower than that of the training set. When the batch size was 500, the fluctuation of the test accuracy in the iteration process showed its sensibility, but the complete prediction accuracy could still reach above 52%. Considering the accepted deviation of 1, which may fall into an adjacent classification, this percentage increased to around 75%.
Table 2 indicates the prediction accuracy of the enhanced dataset and the raw dataset, respectively. As the amount of training and test data needs to be further accumulated, it is currently considered that this prediction percentage is acceptable.
Compared with the other methods, the BP-RNN chain method can not only obtain more and more accurate predictions with the accumulation of data, but it is also possible to find the key features in the testing process to guide product optimization. With the updated network, we are able to predict the mixture ratio range in advance by tracking historical data, especially the NTO flow rate after welding and the SMD value. When the prediction results do not meet the qualified expectations of classifications 6 or 7, the orifice size can be adjusted by improving its predicted classification in the network calculation until it finally falls into the qualified range.
4. Conclusions
This study presented a BP-RNN solution that implements a two-stage neural network to summarize the 10-dimensional historical data, then extracted and reordered the features with a high weight to build up the bridge between the liquid-flow test and firing test for bipropellant thrusters.
By using multidimensional nonlinear fitting in a BP neutral network through training and updating the weight, the association rule between the 10-dimension features and their mapping labels can be revealed. The NTO flow rate after injector welding and the SMD value were extracted with a high weight of 0.5052 and 0.8135, showing that these two features are the decisive hidden factor affecting the mixture ratio.
According to two high-weight features and the final flow rate with an orifice of two flow channels, the many-to-one classification prediction was realized by using RNN. The percentage of accepted prediction could reach up to above 75% with a deviation not greater than 1. Even though the prediction accuracy of the complete classification was only around 55%, the result was still far higher than the current test qualified rate of about 30%. With the continuous increase in the number of bipropellant thrusters tested in manufacturing, the training dataset can be further accumulated and improved for better prediction accuracy and generalization ability. After the accuracy of the prediction model reaches a high level, the liquid-flow test results can even be directly used for high-precision mixture ratio adjustment without the need for the firing test, thus meeting the low-cost engineering requirement. Furthermore, the prediction of specific working conditions on orbit can also be realized through the analysis of liquid-flow test data on the ground.


 ,
, 

