
Effect of Disperse Red 1 Azobenzene Dye Doping and Annealing on the Thermomechanical and Photomechanical Properties of PMMA Fibers


Abstract
:1. Introduction
2. Theory
2.1. The Elastic Model of Photomechanics
2.2. Photothermal Heating
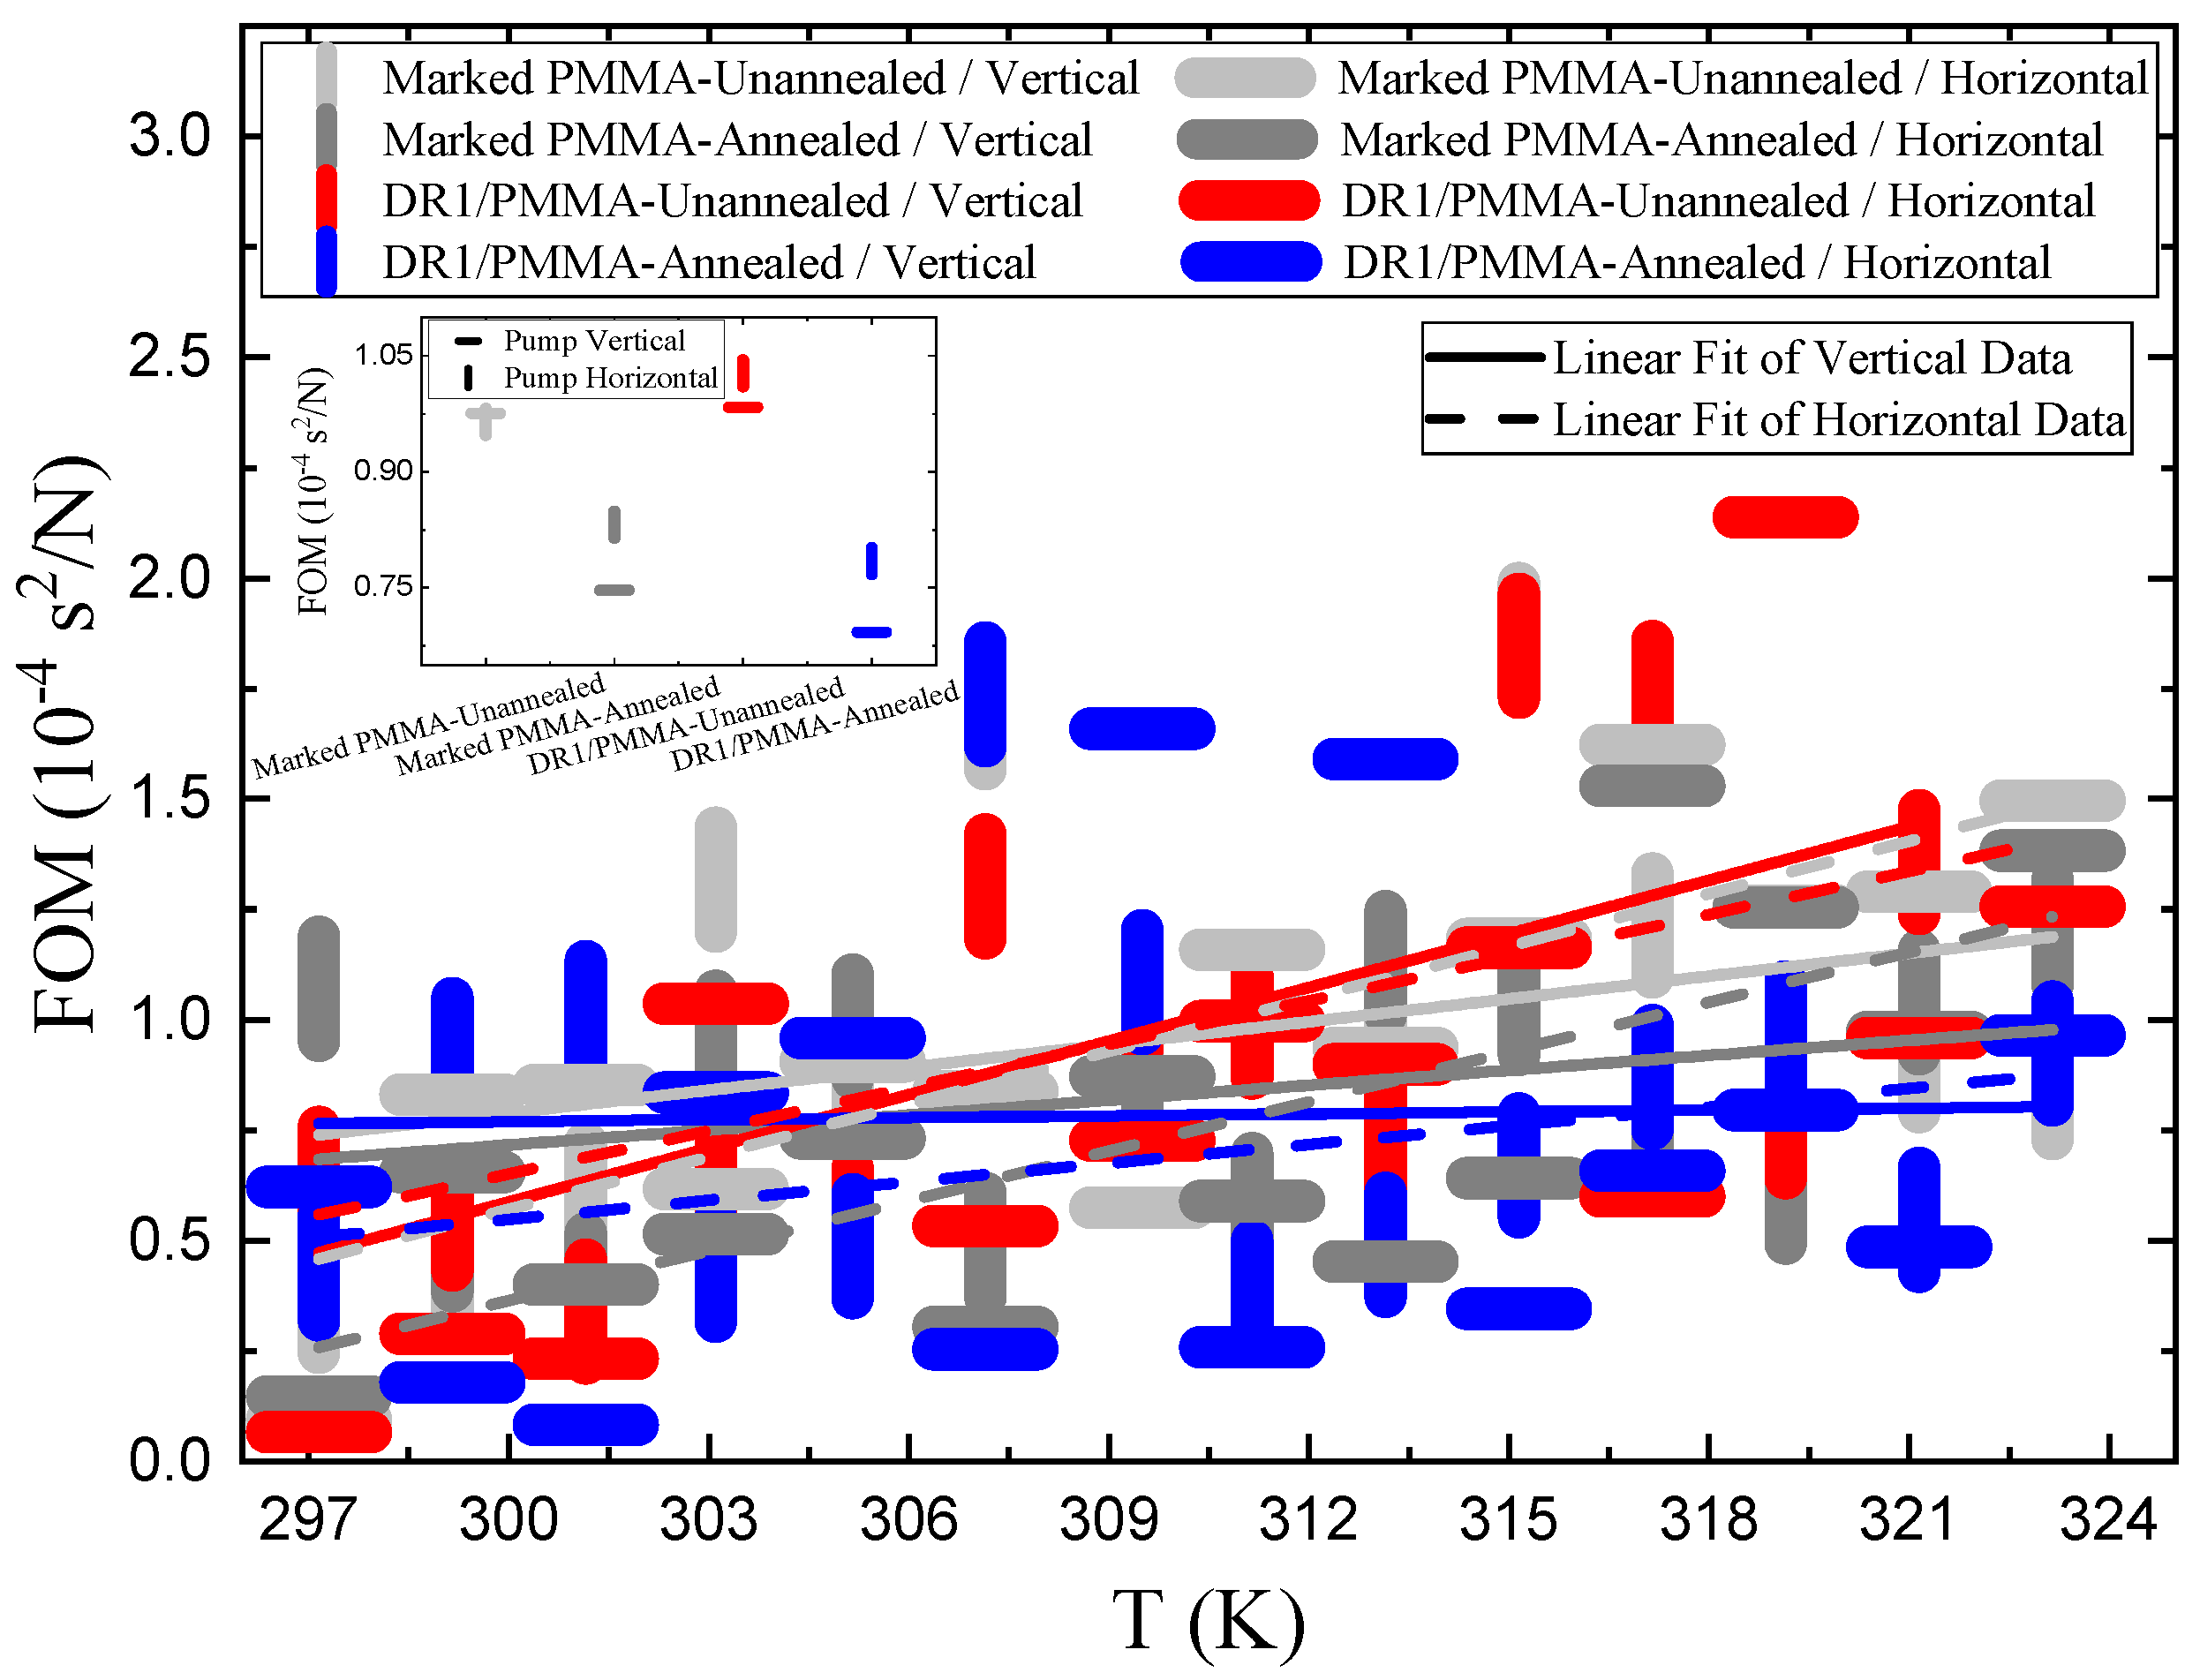
2.3. Photomechanical Efficiency Figure of Merit
3. Experiment
3.1. Sample Preparation
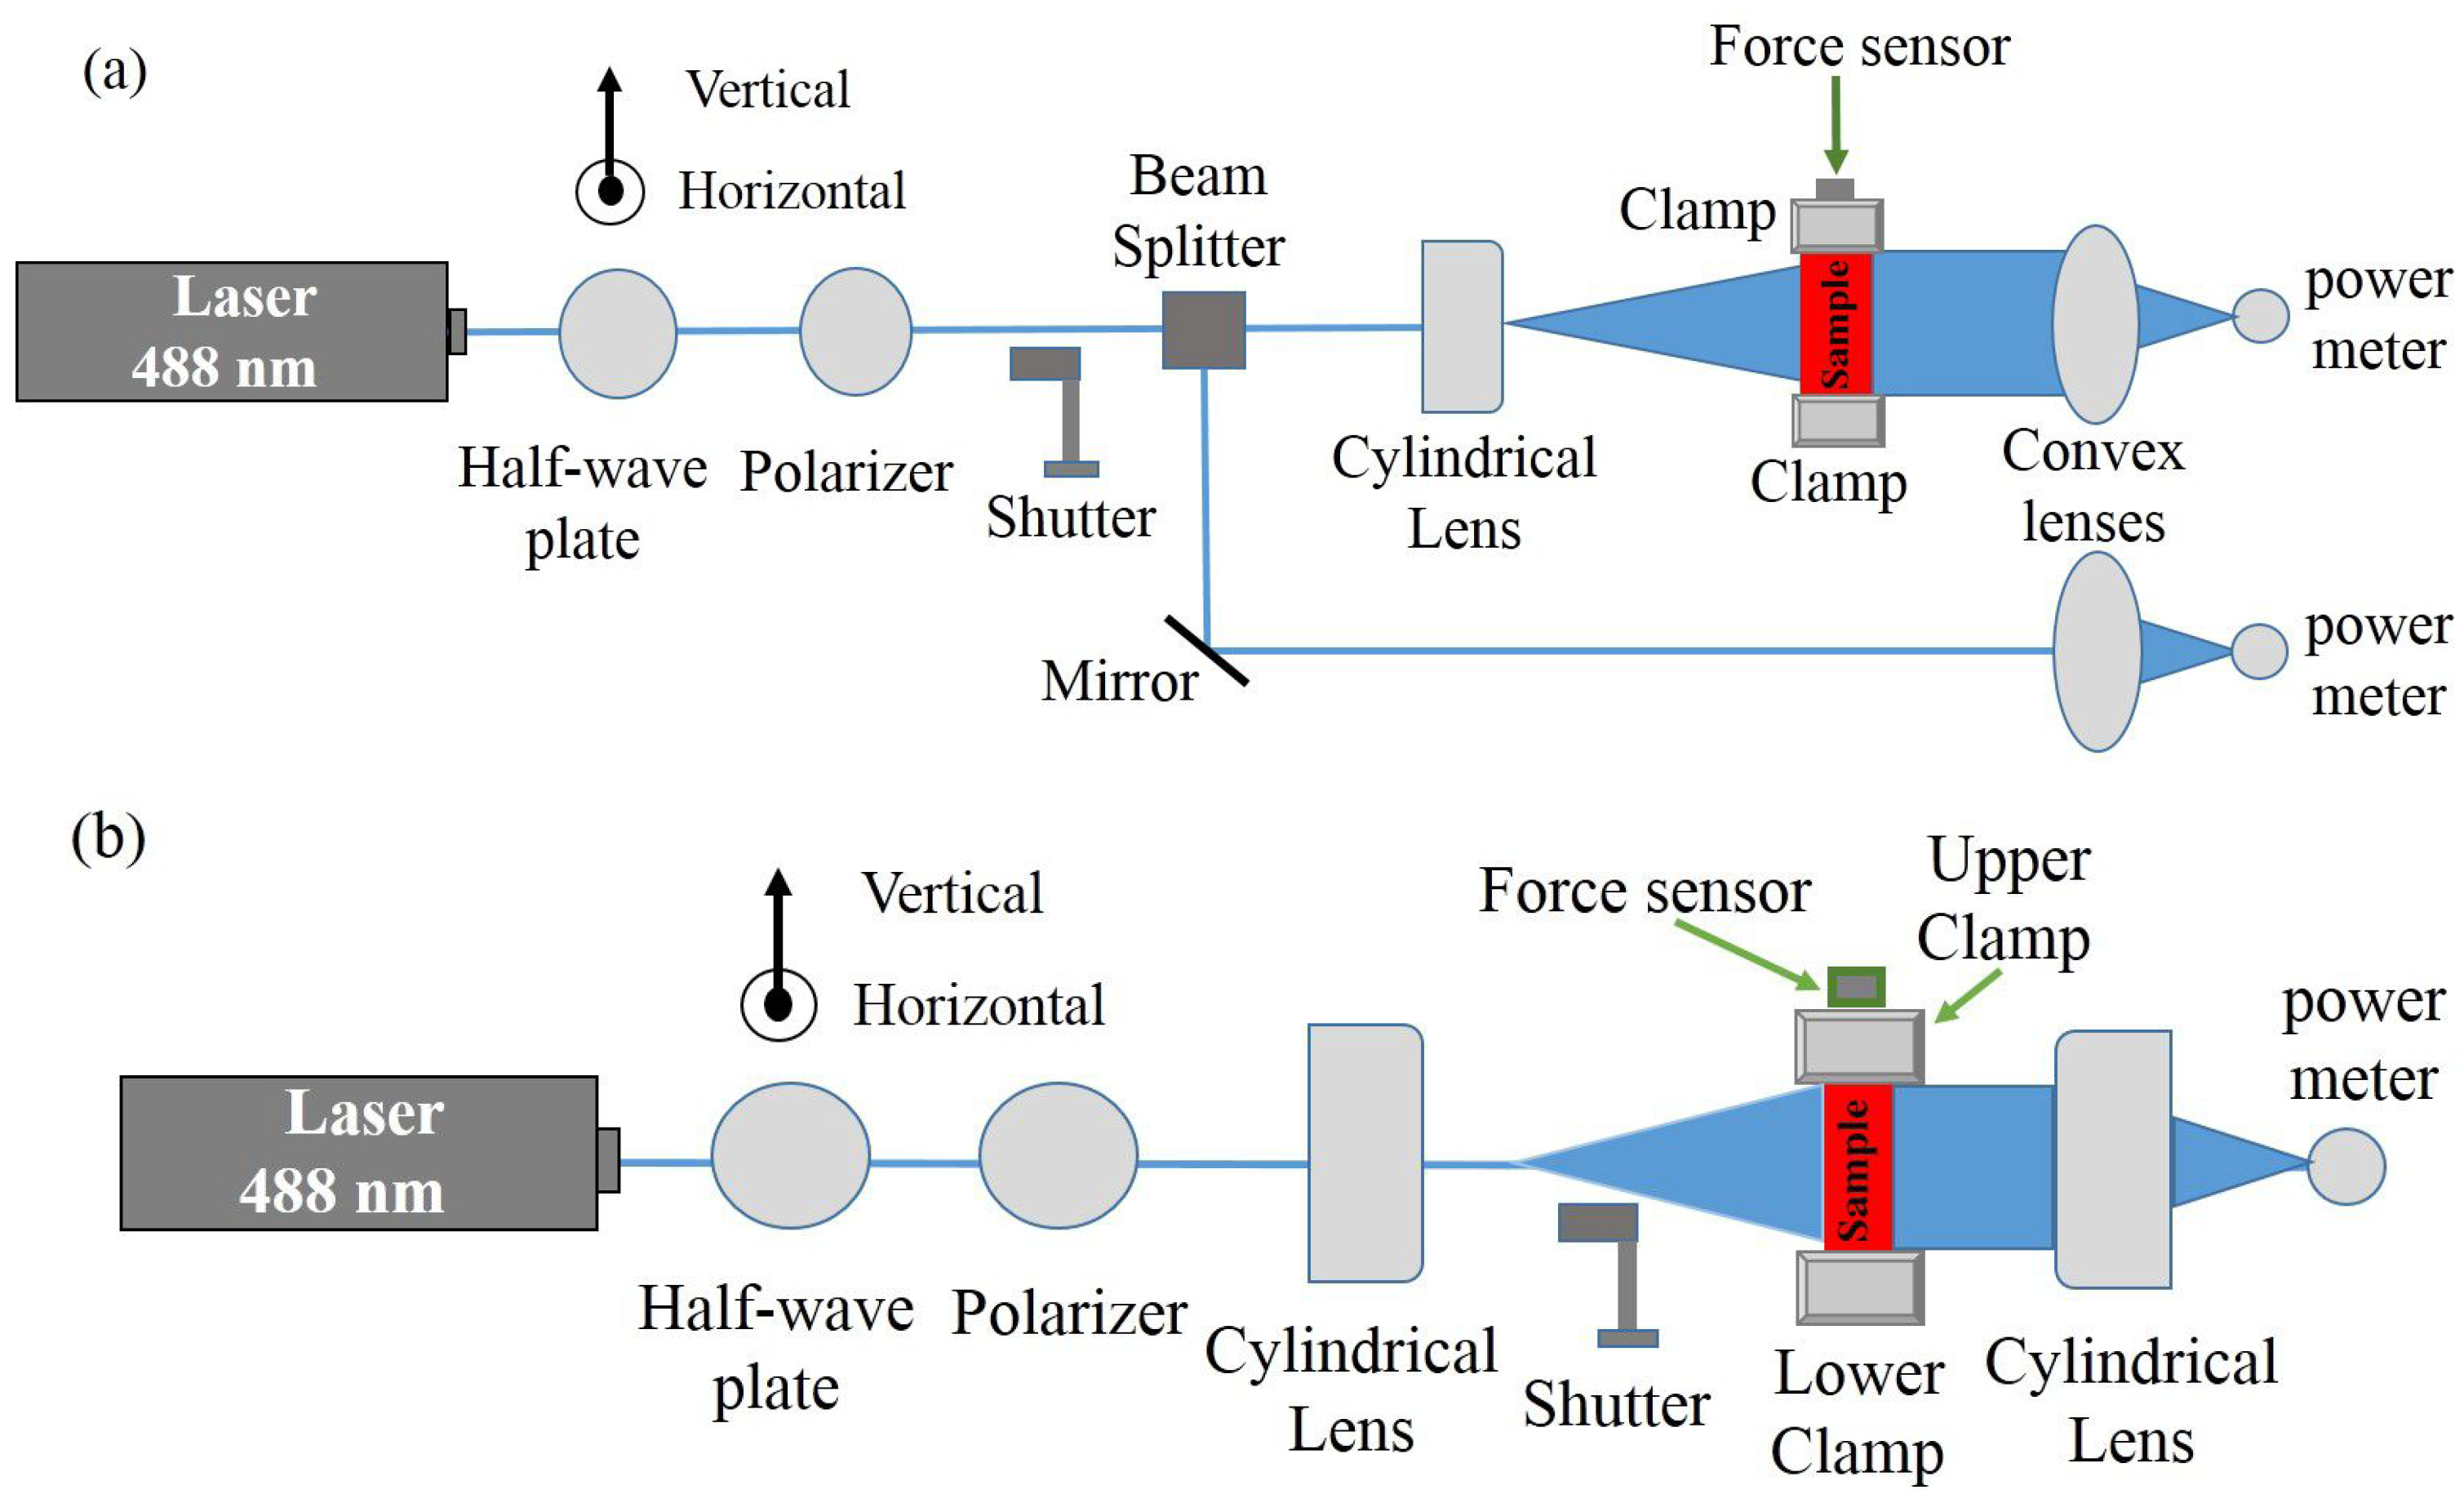
3.2. Apparatus
3.3. Experimental Procedure
4. Results and Discussion
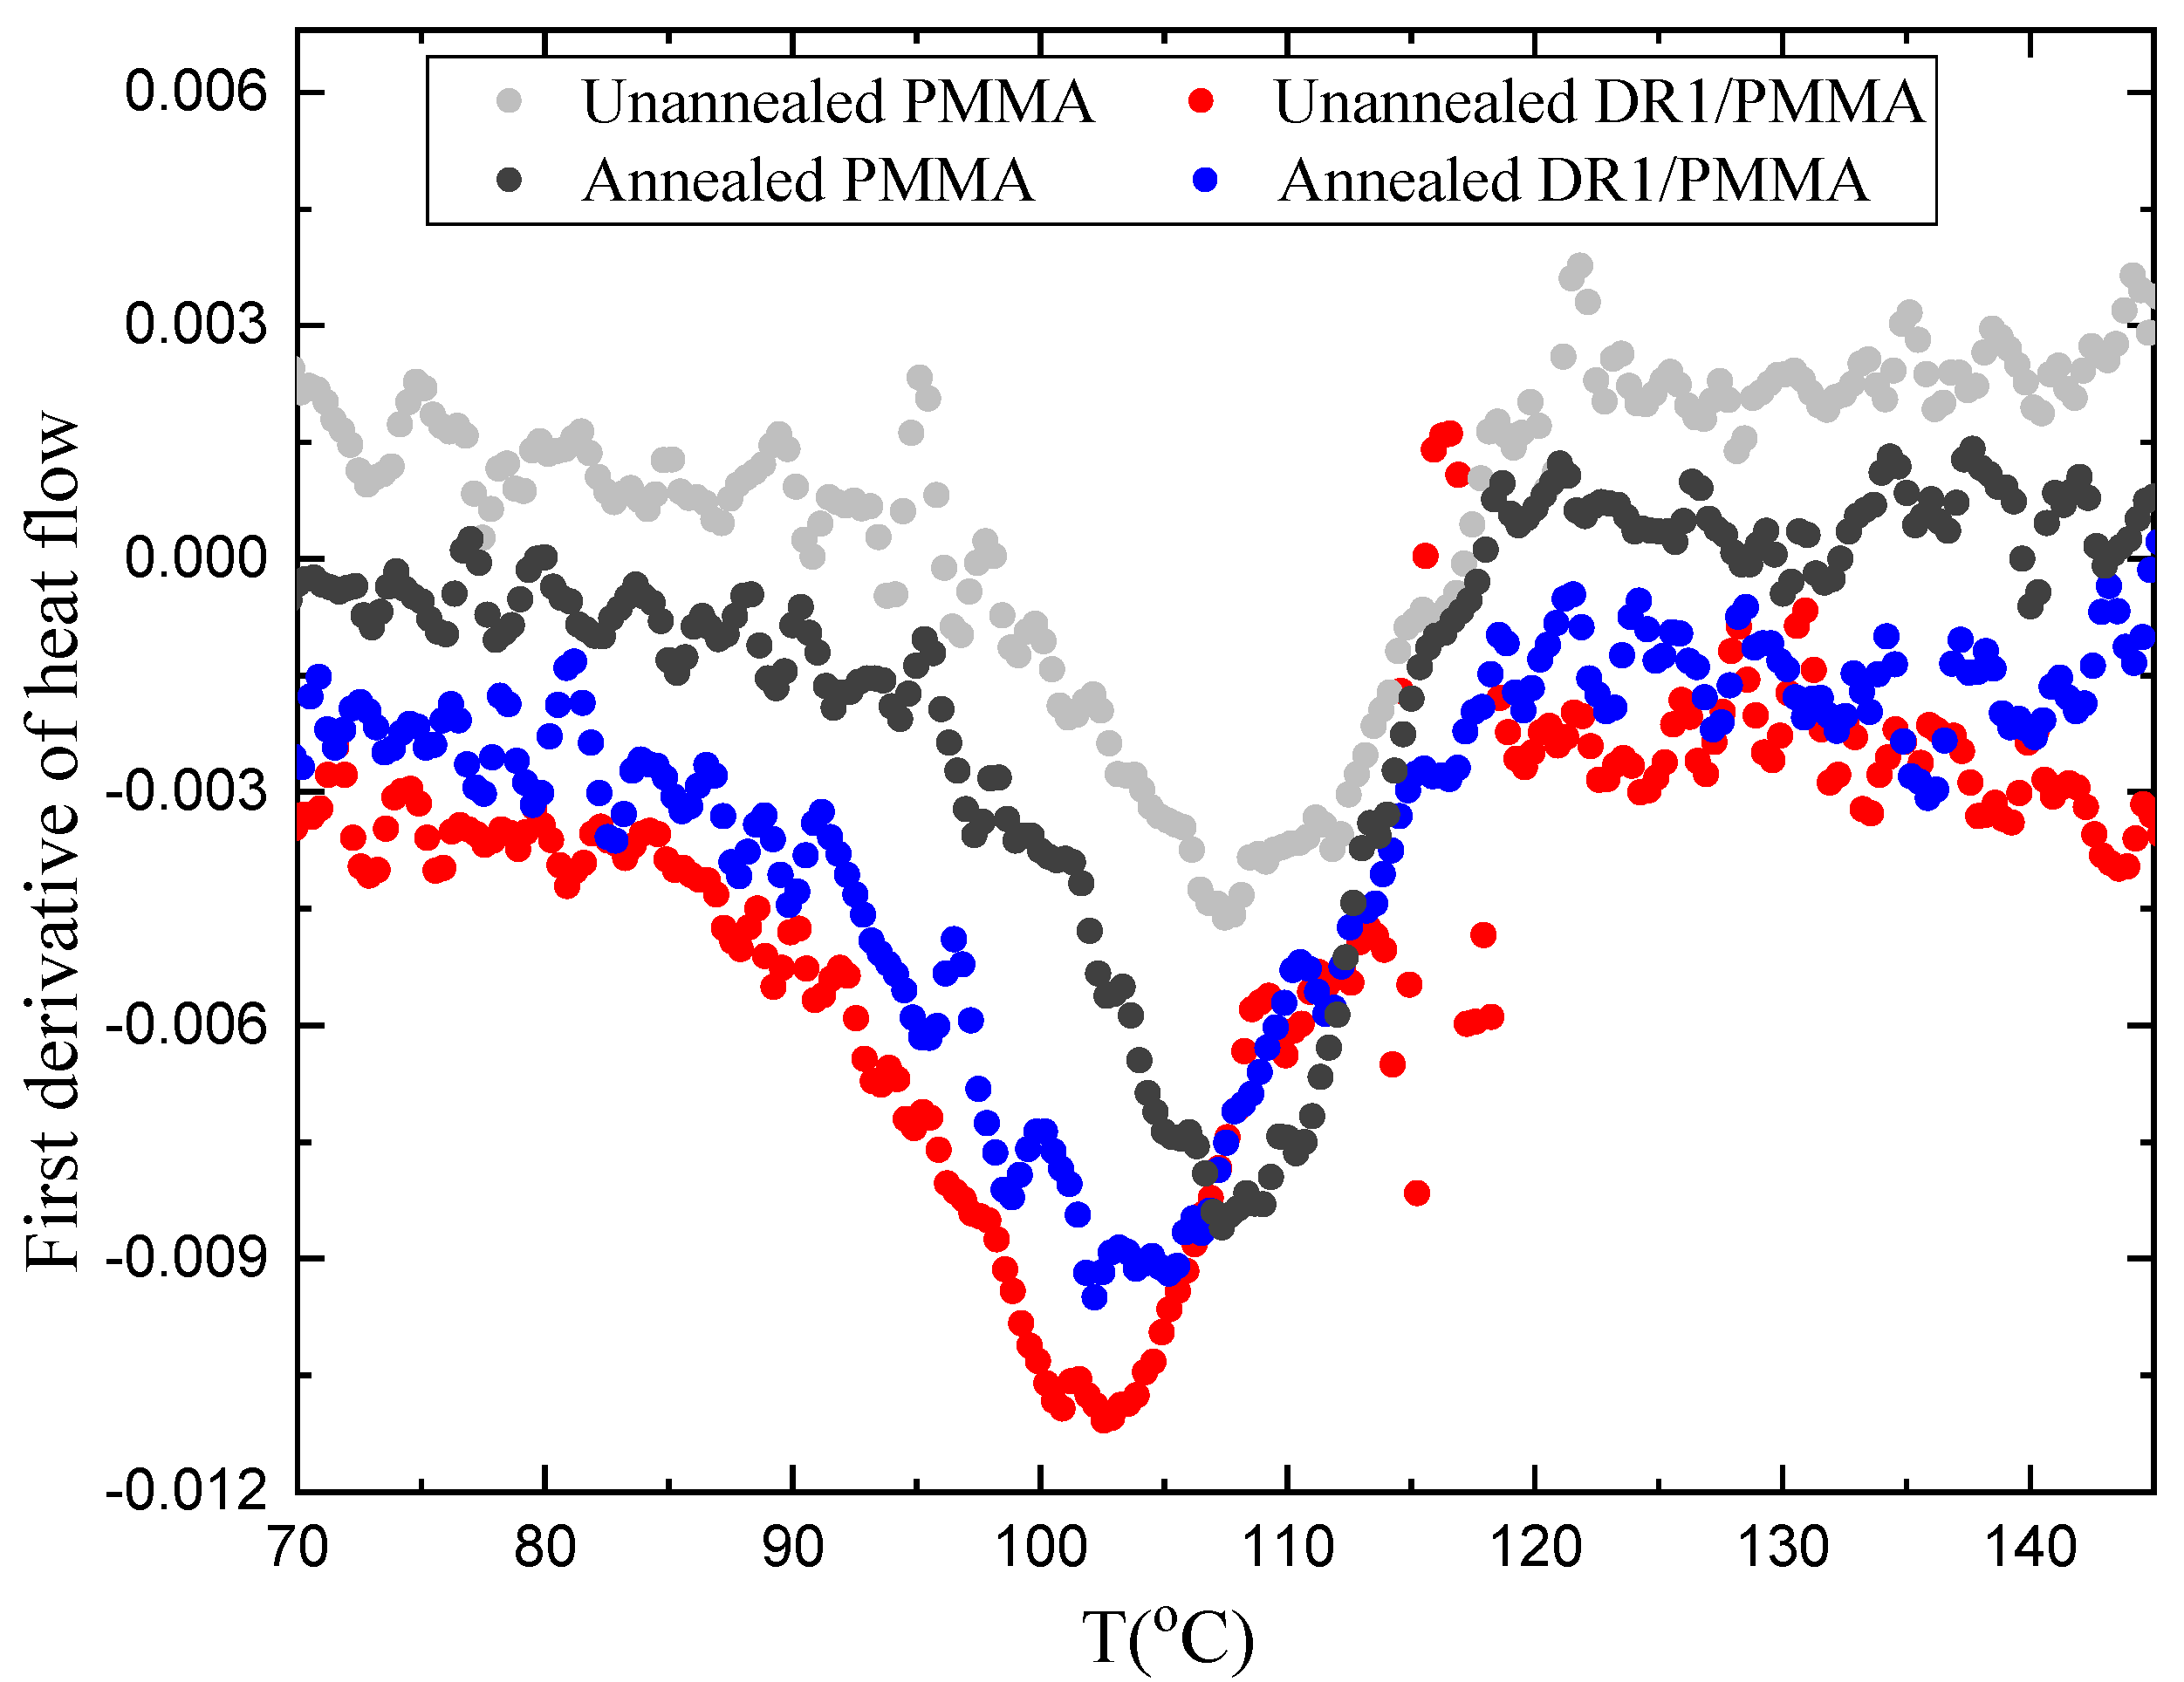
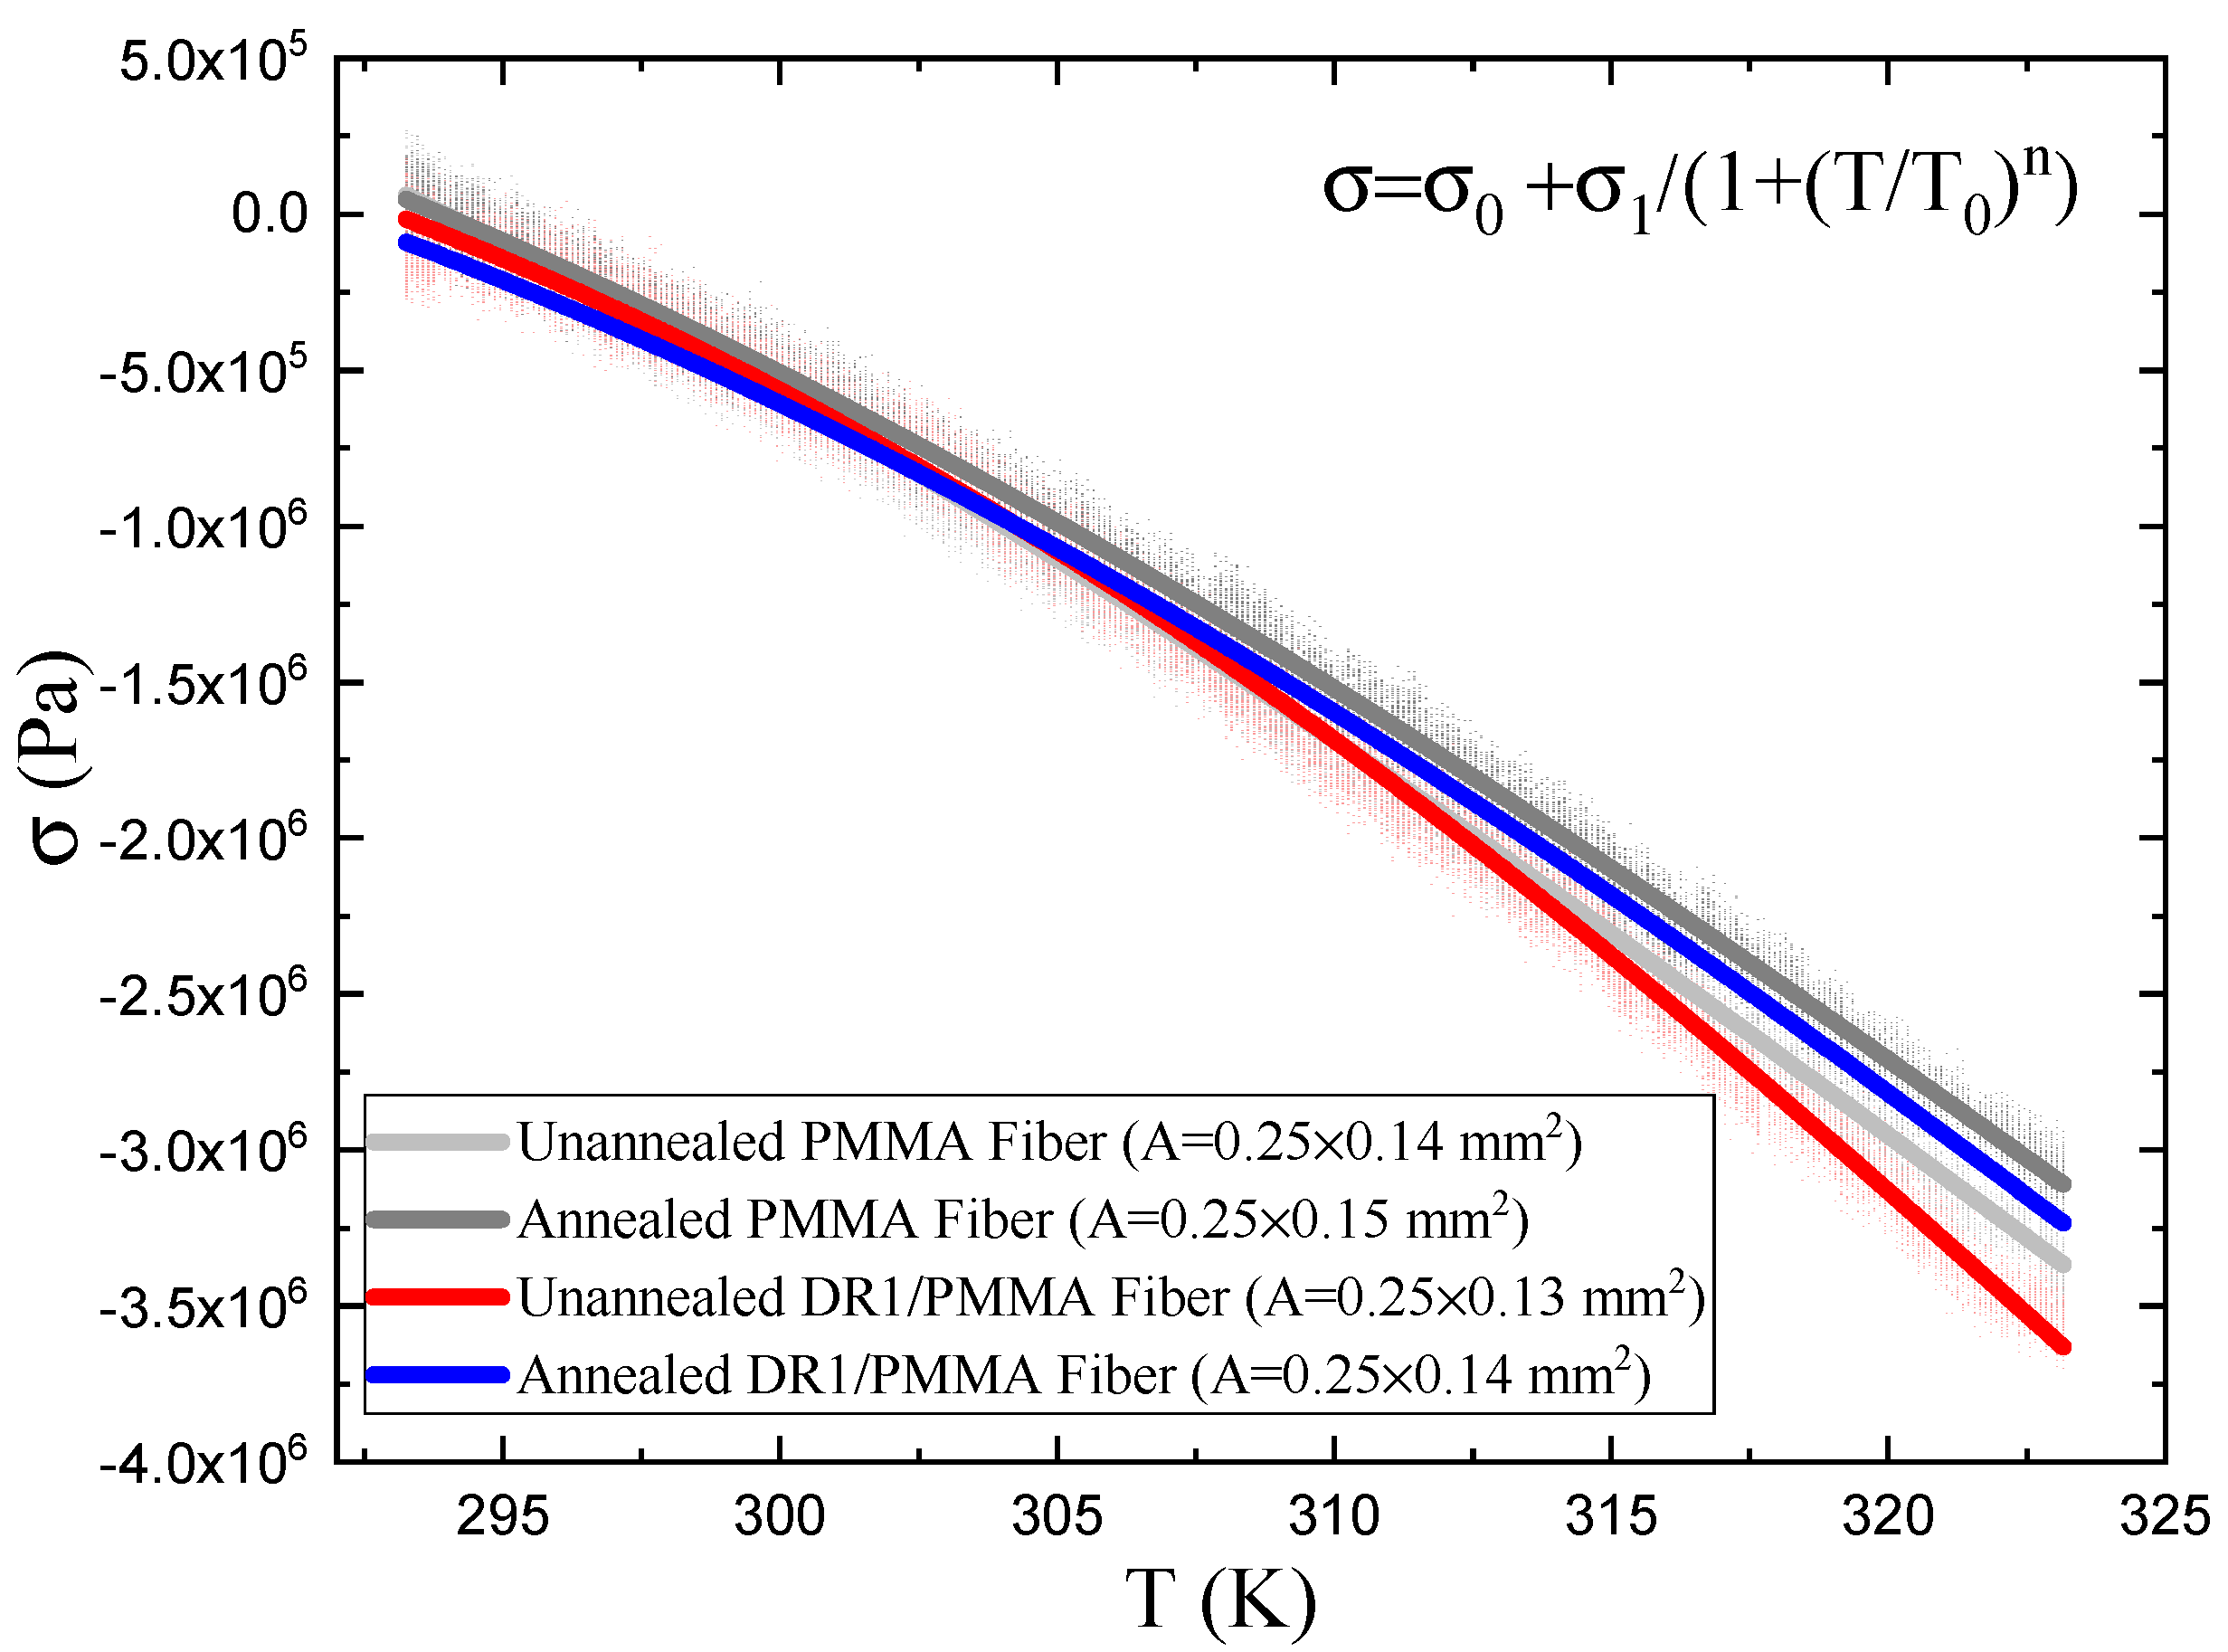
4.1. Temperature-Dependent Measurements
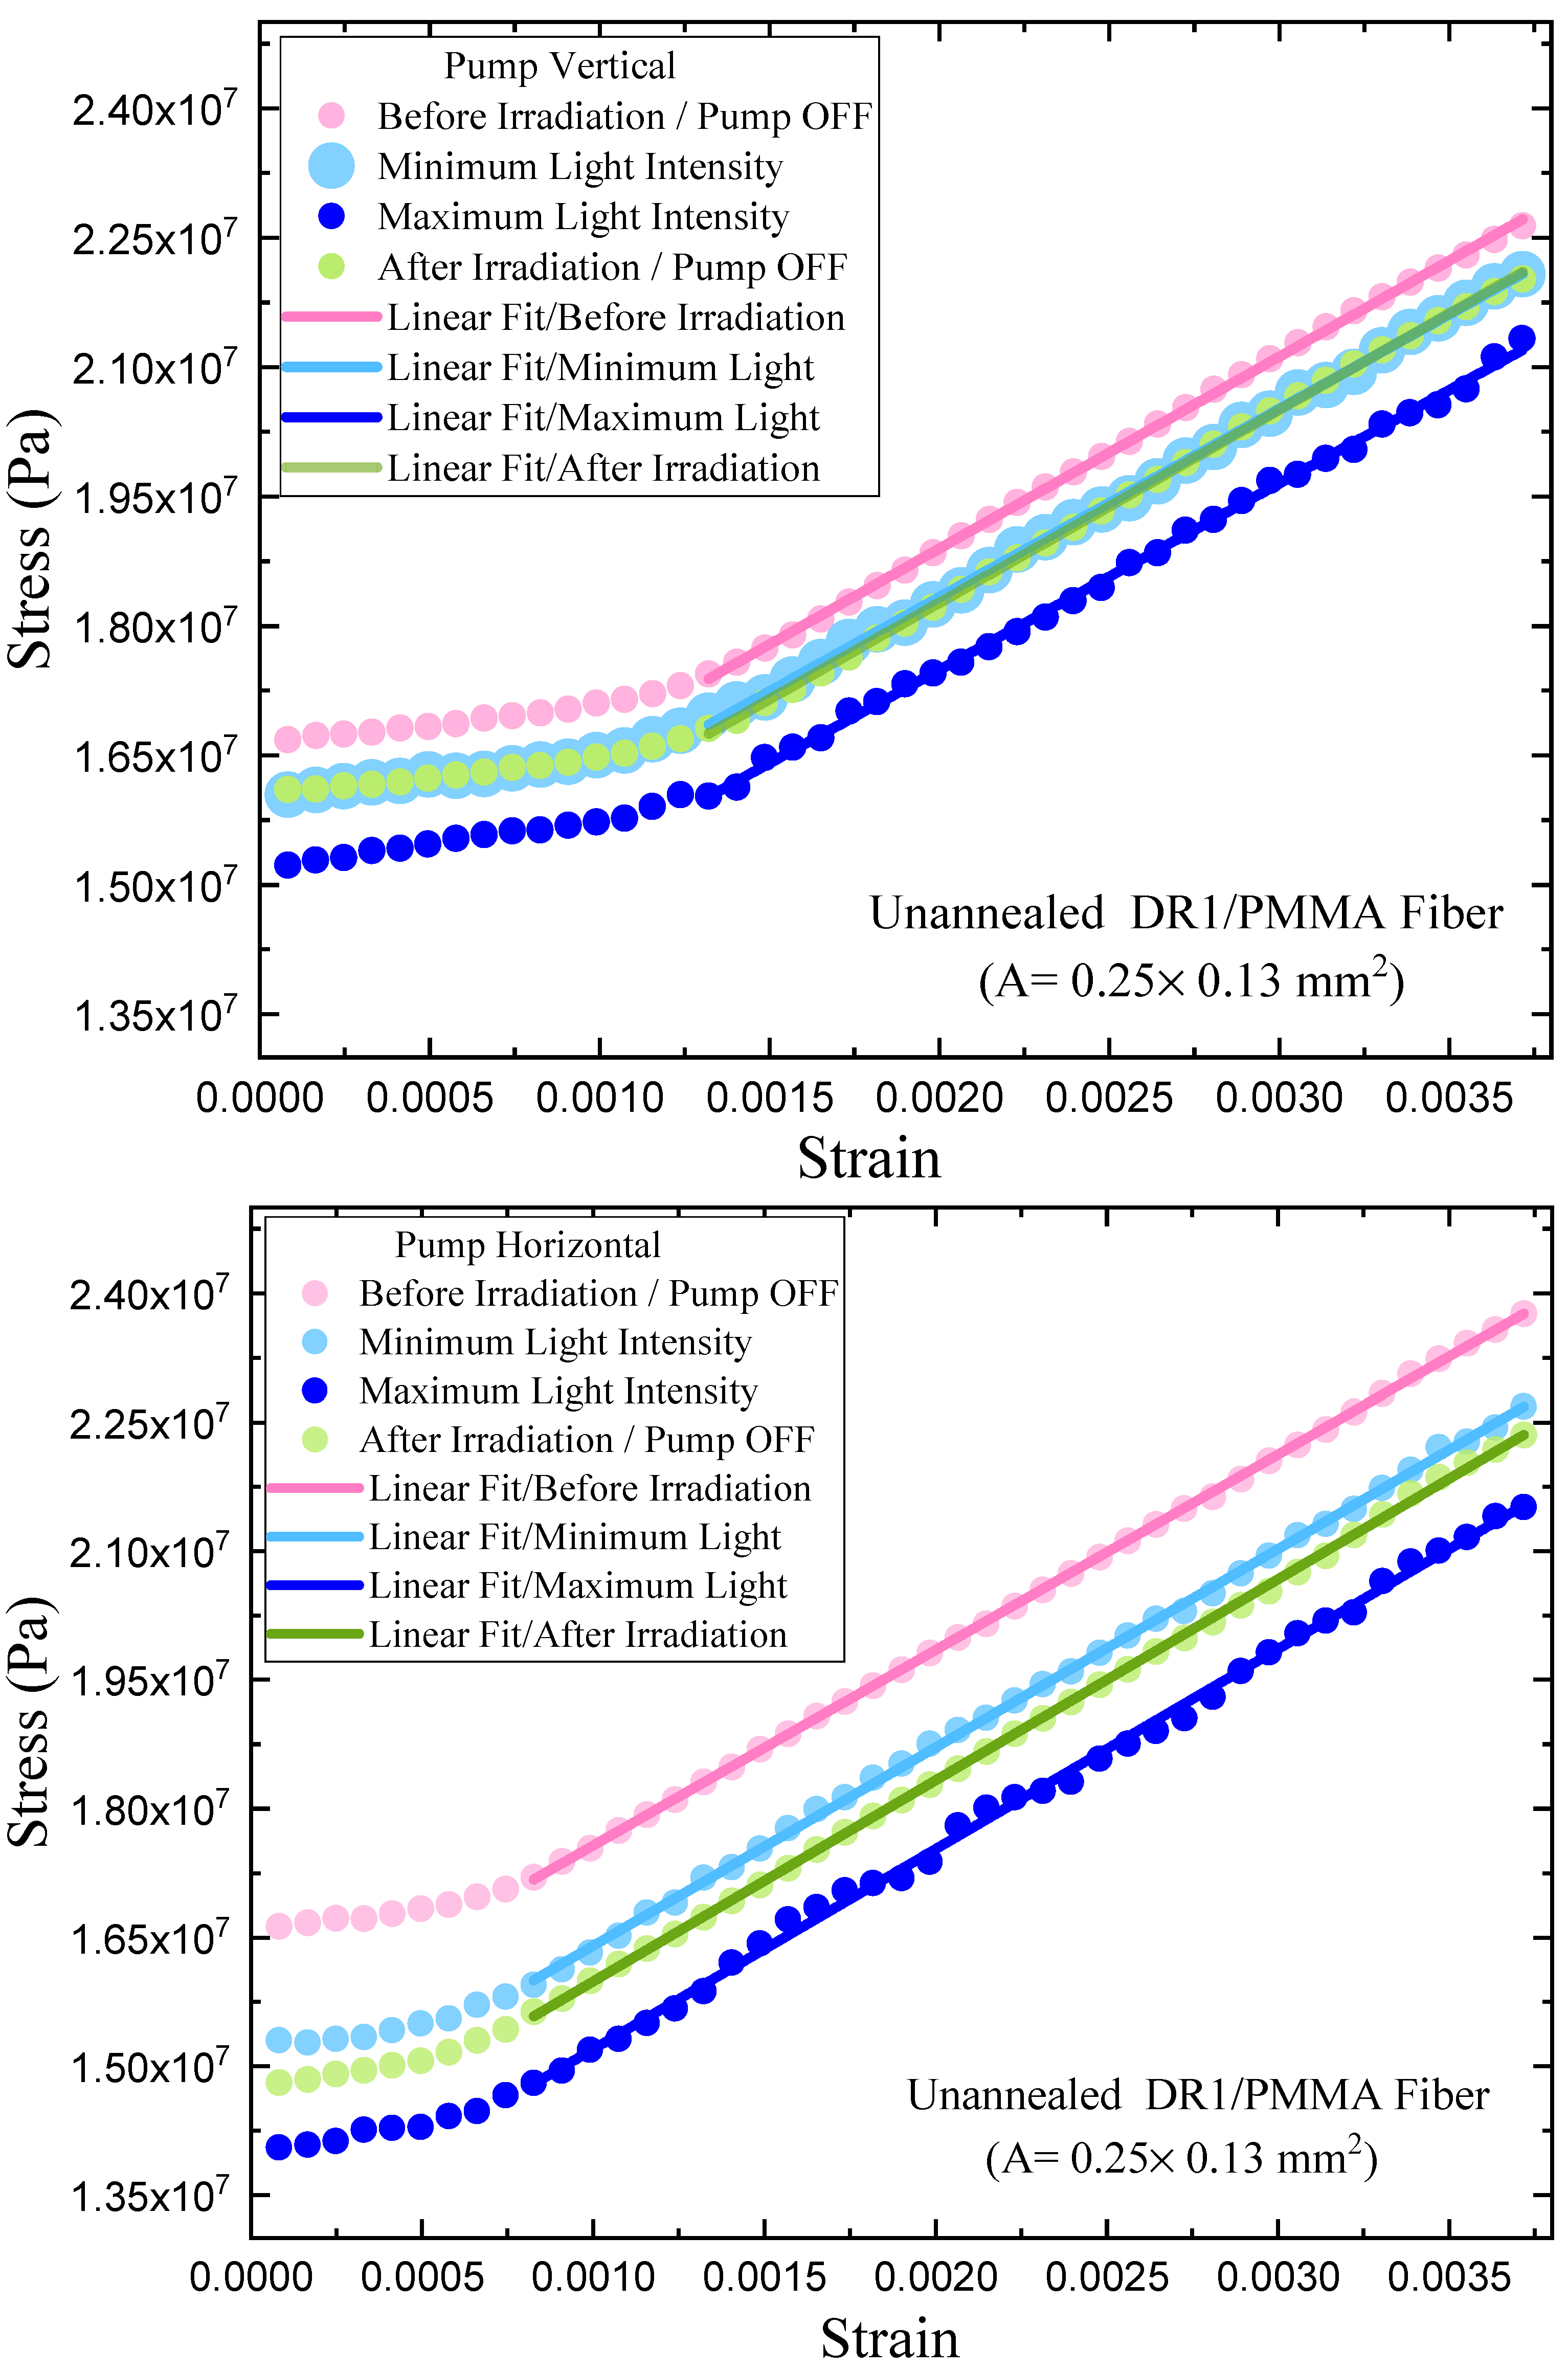
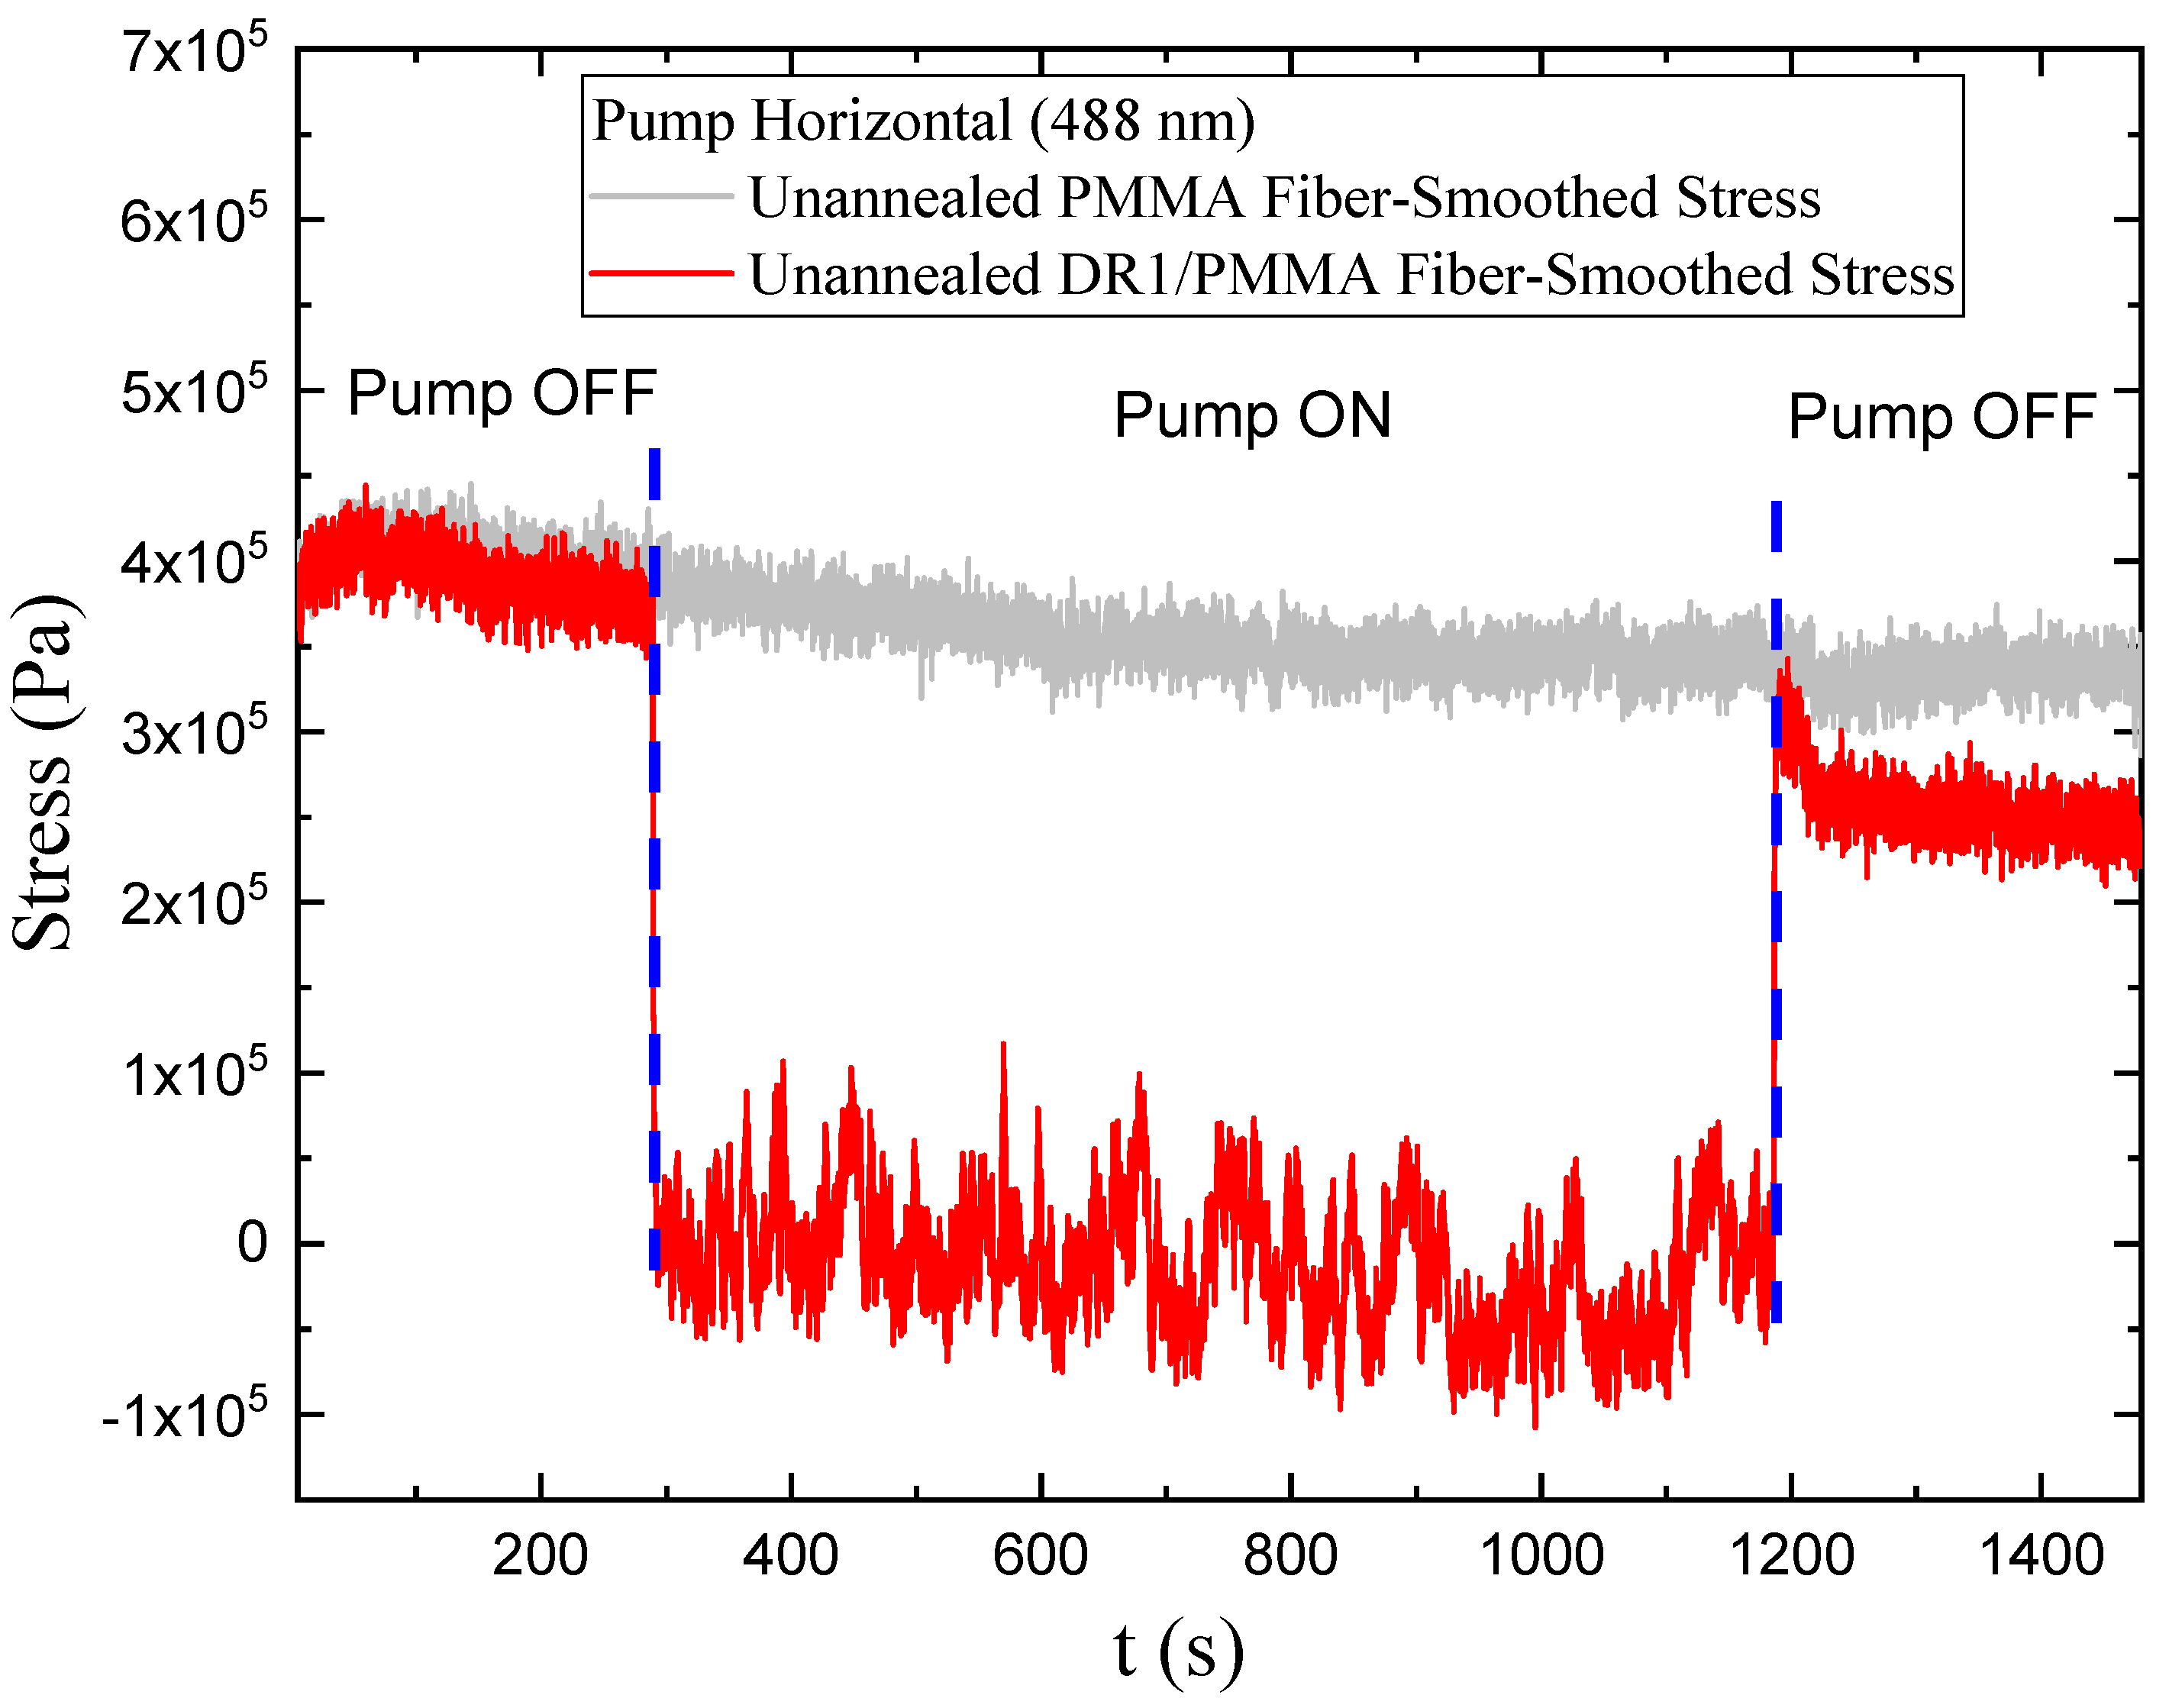
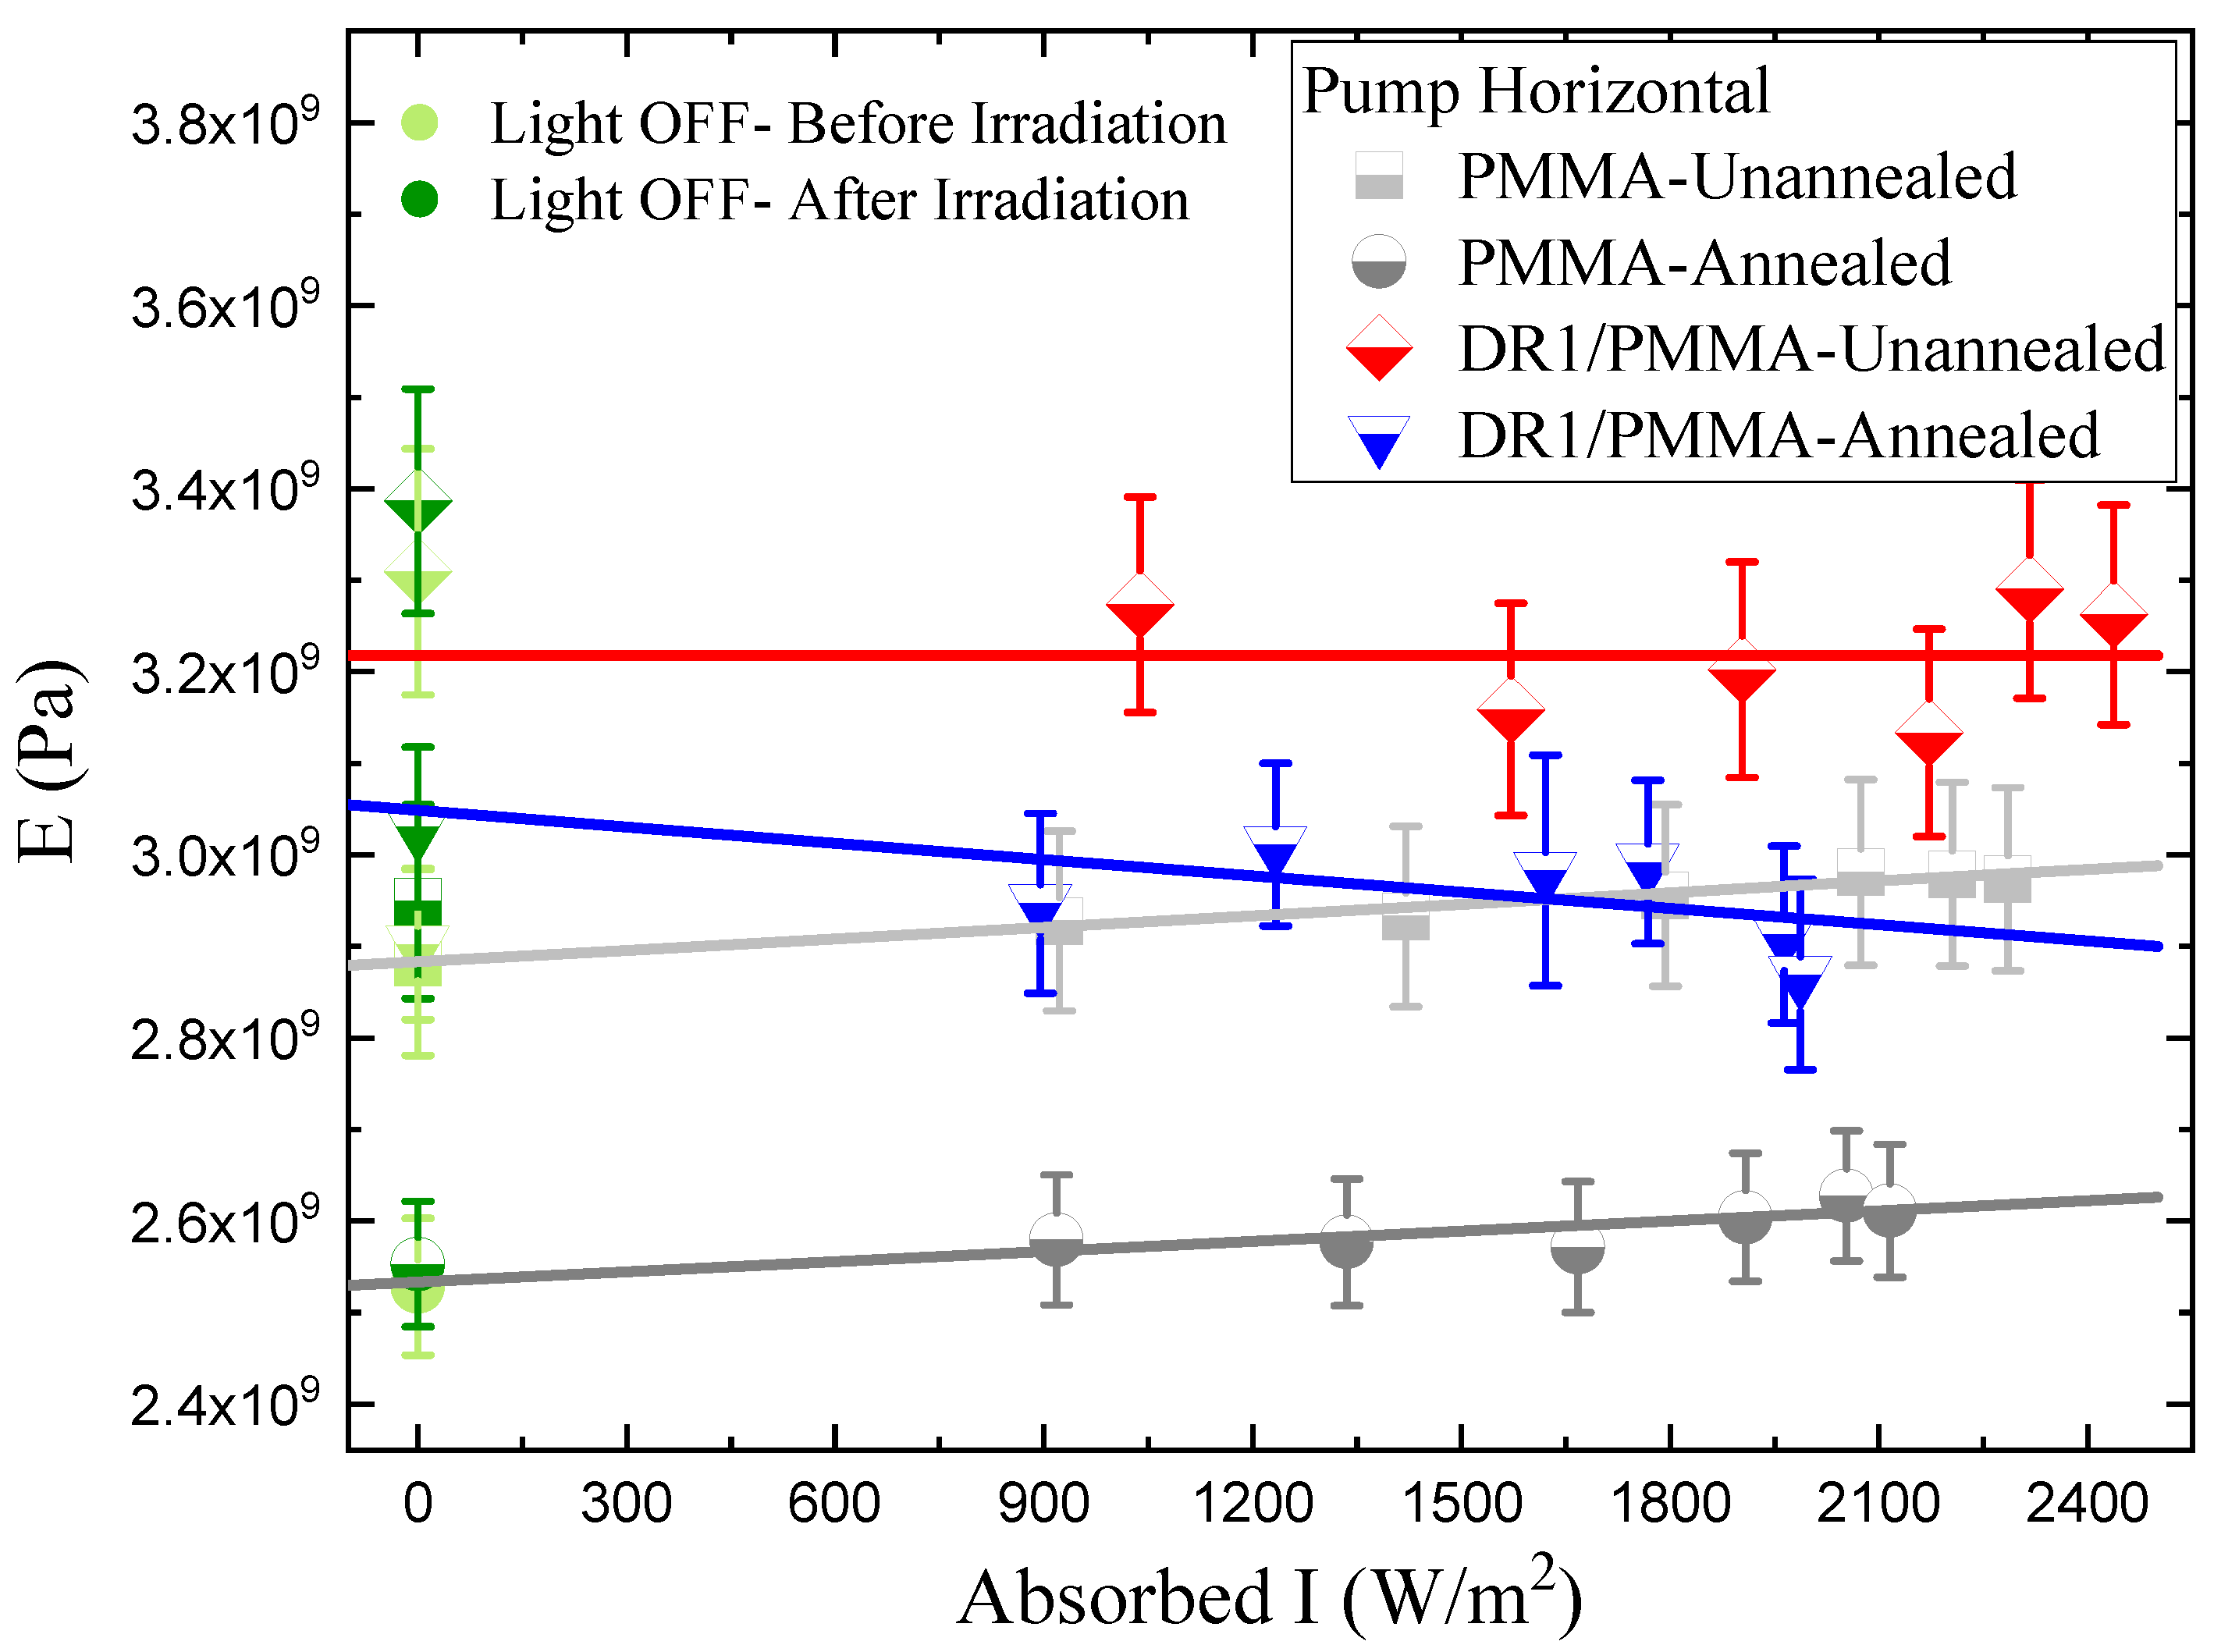
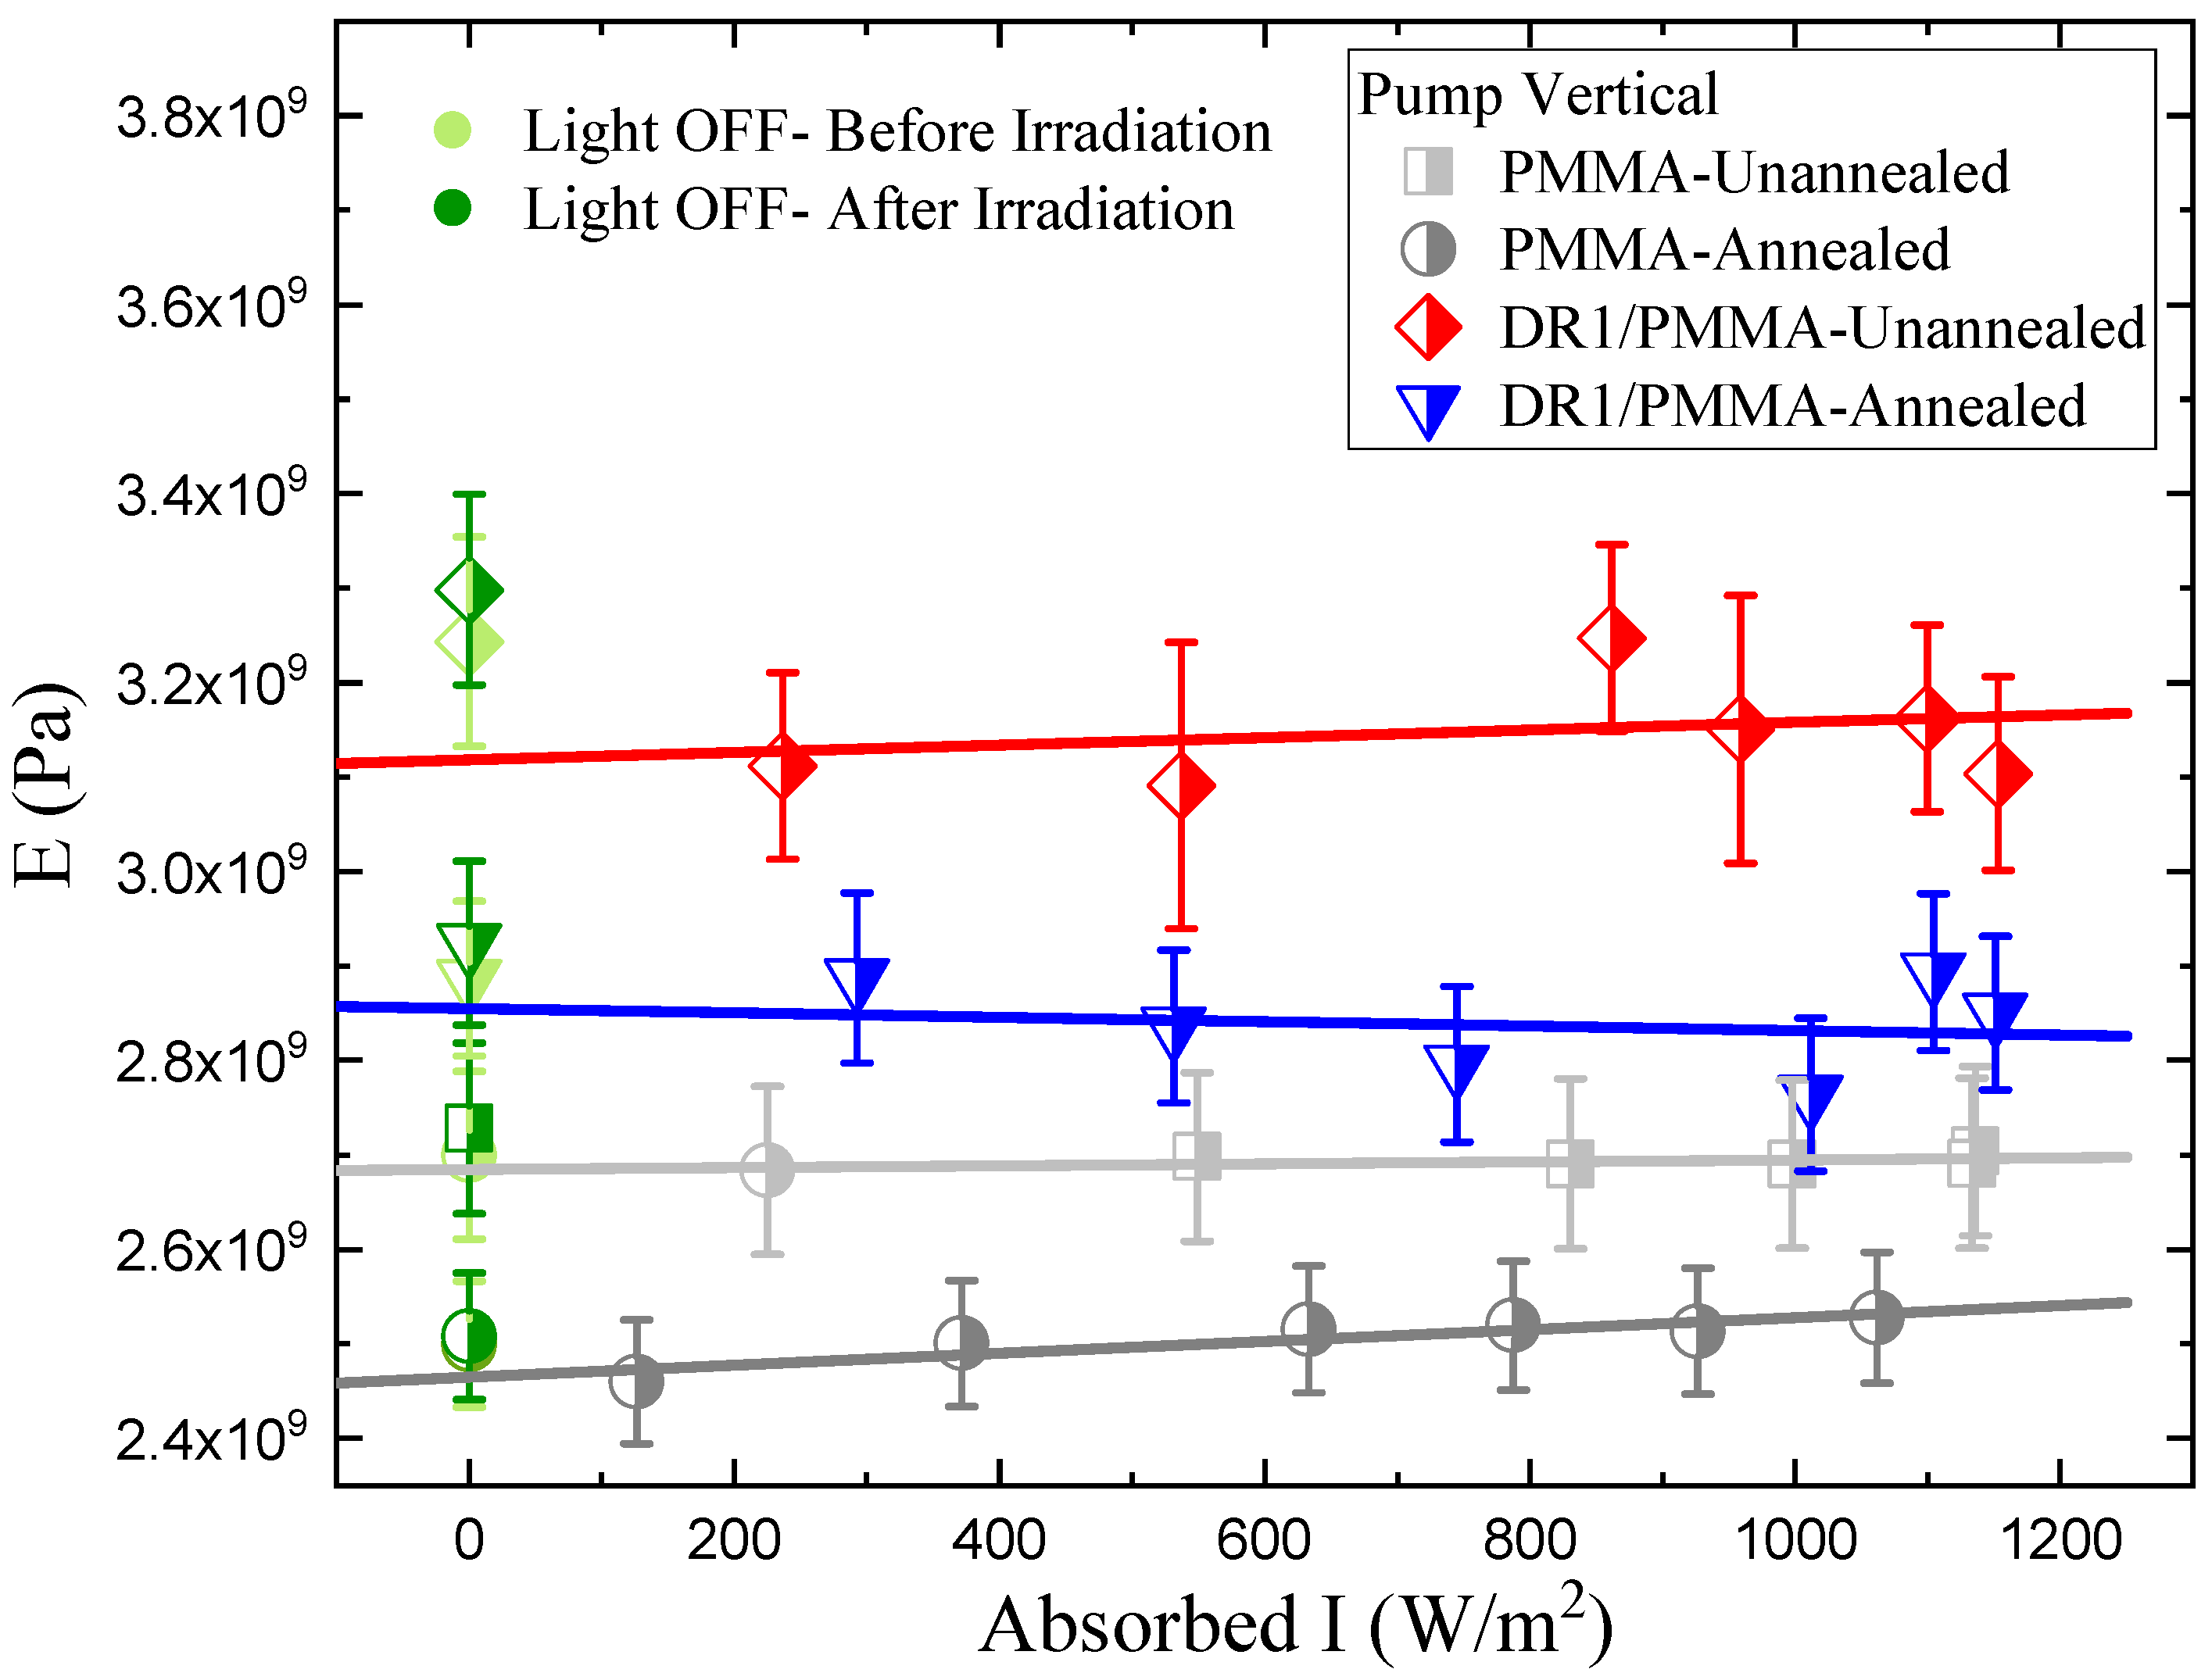
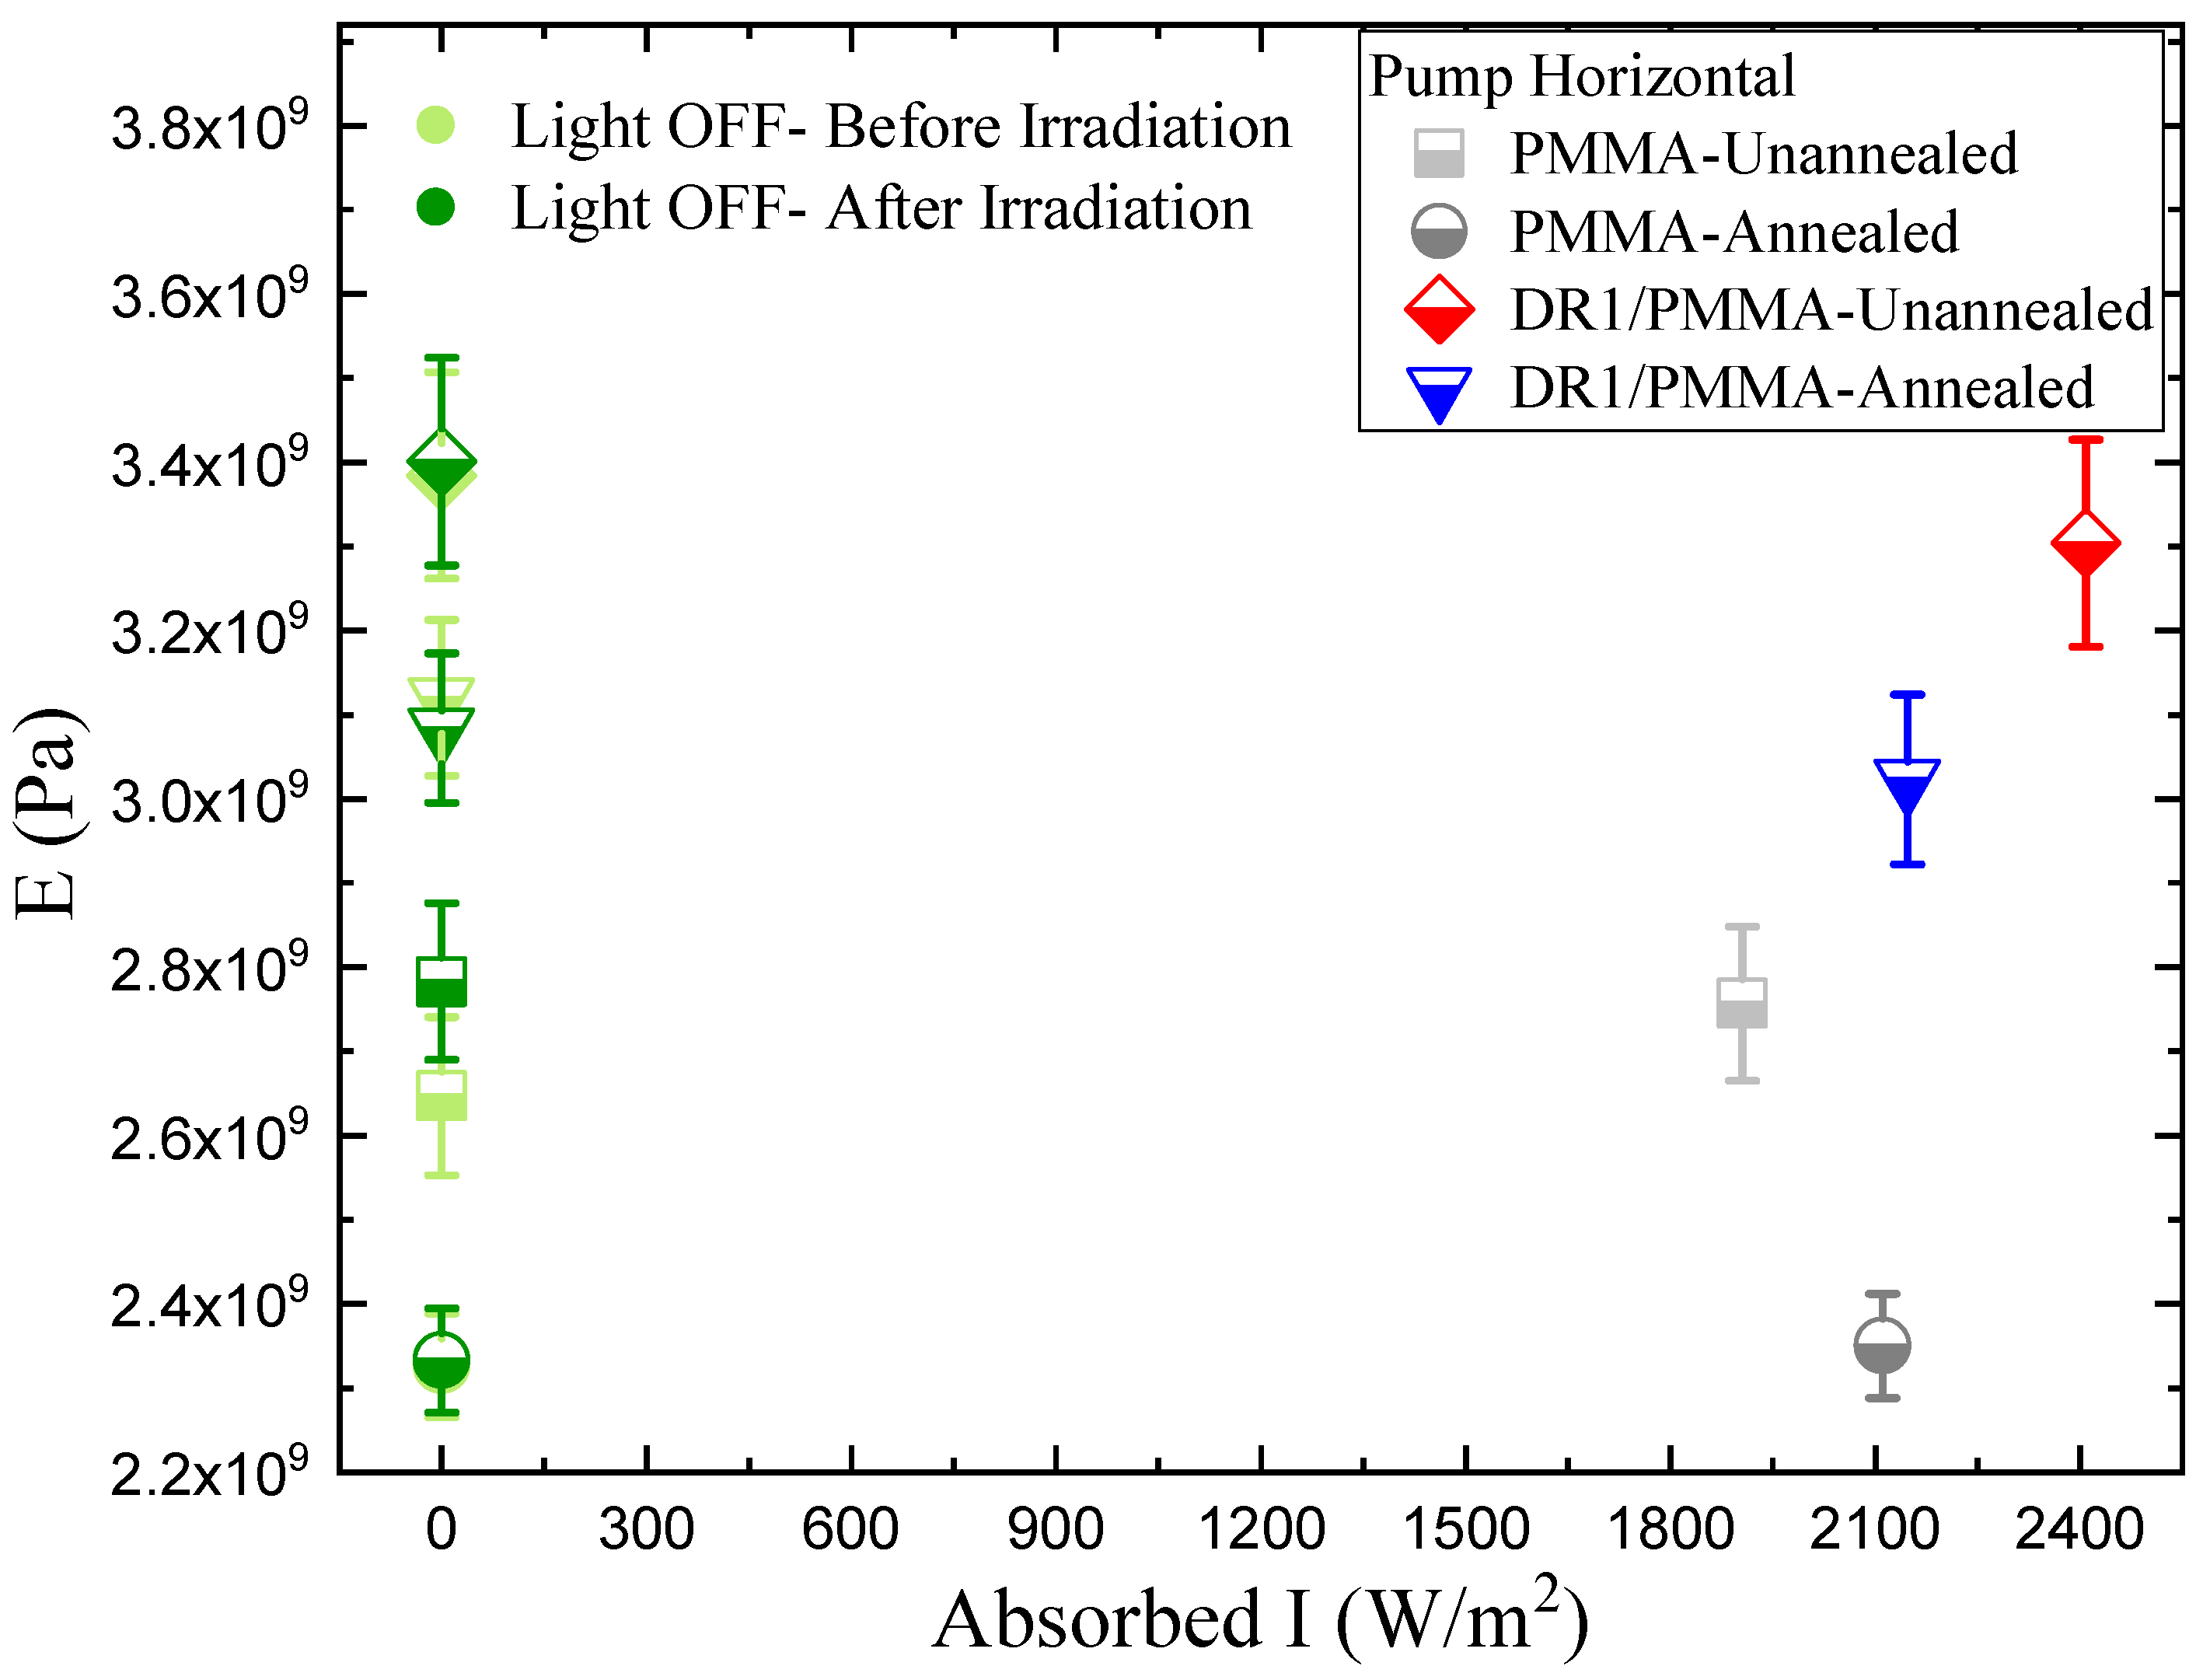
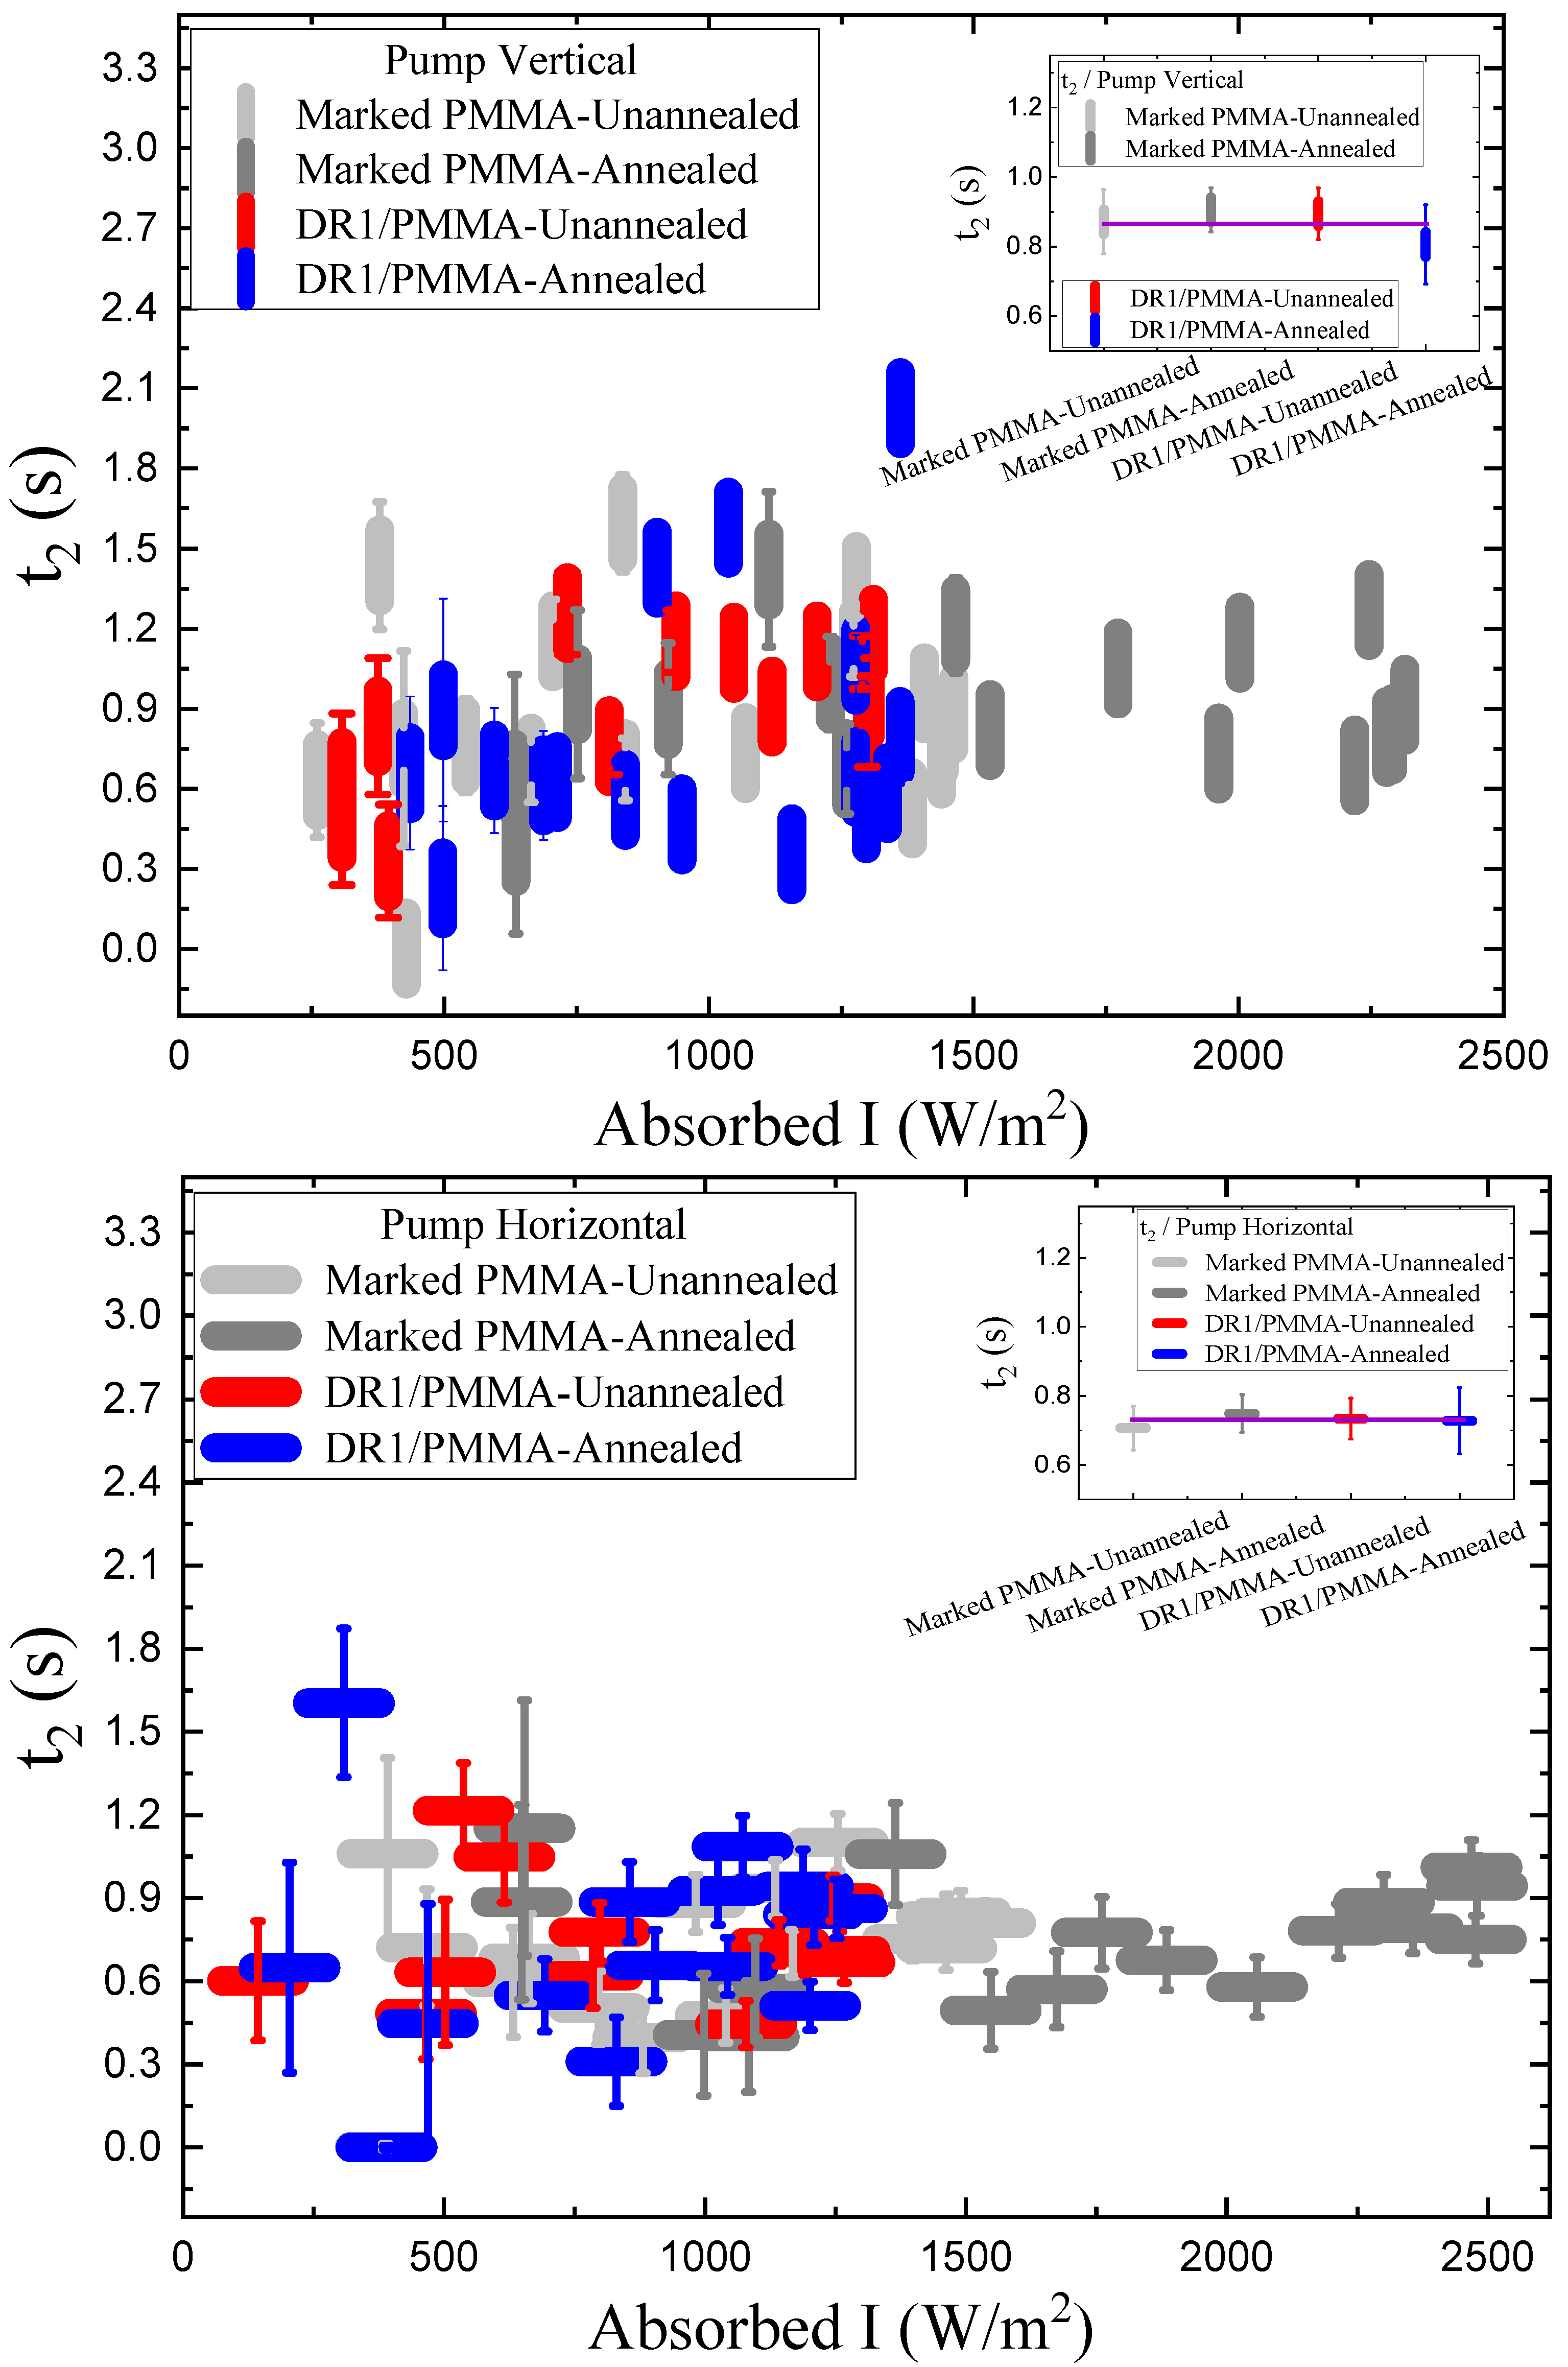
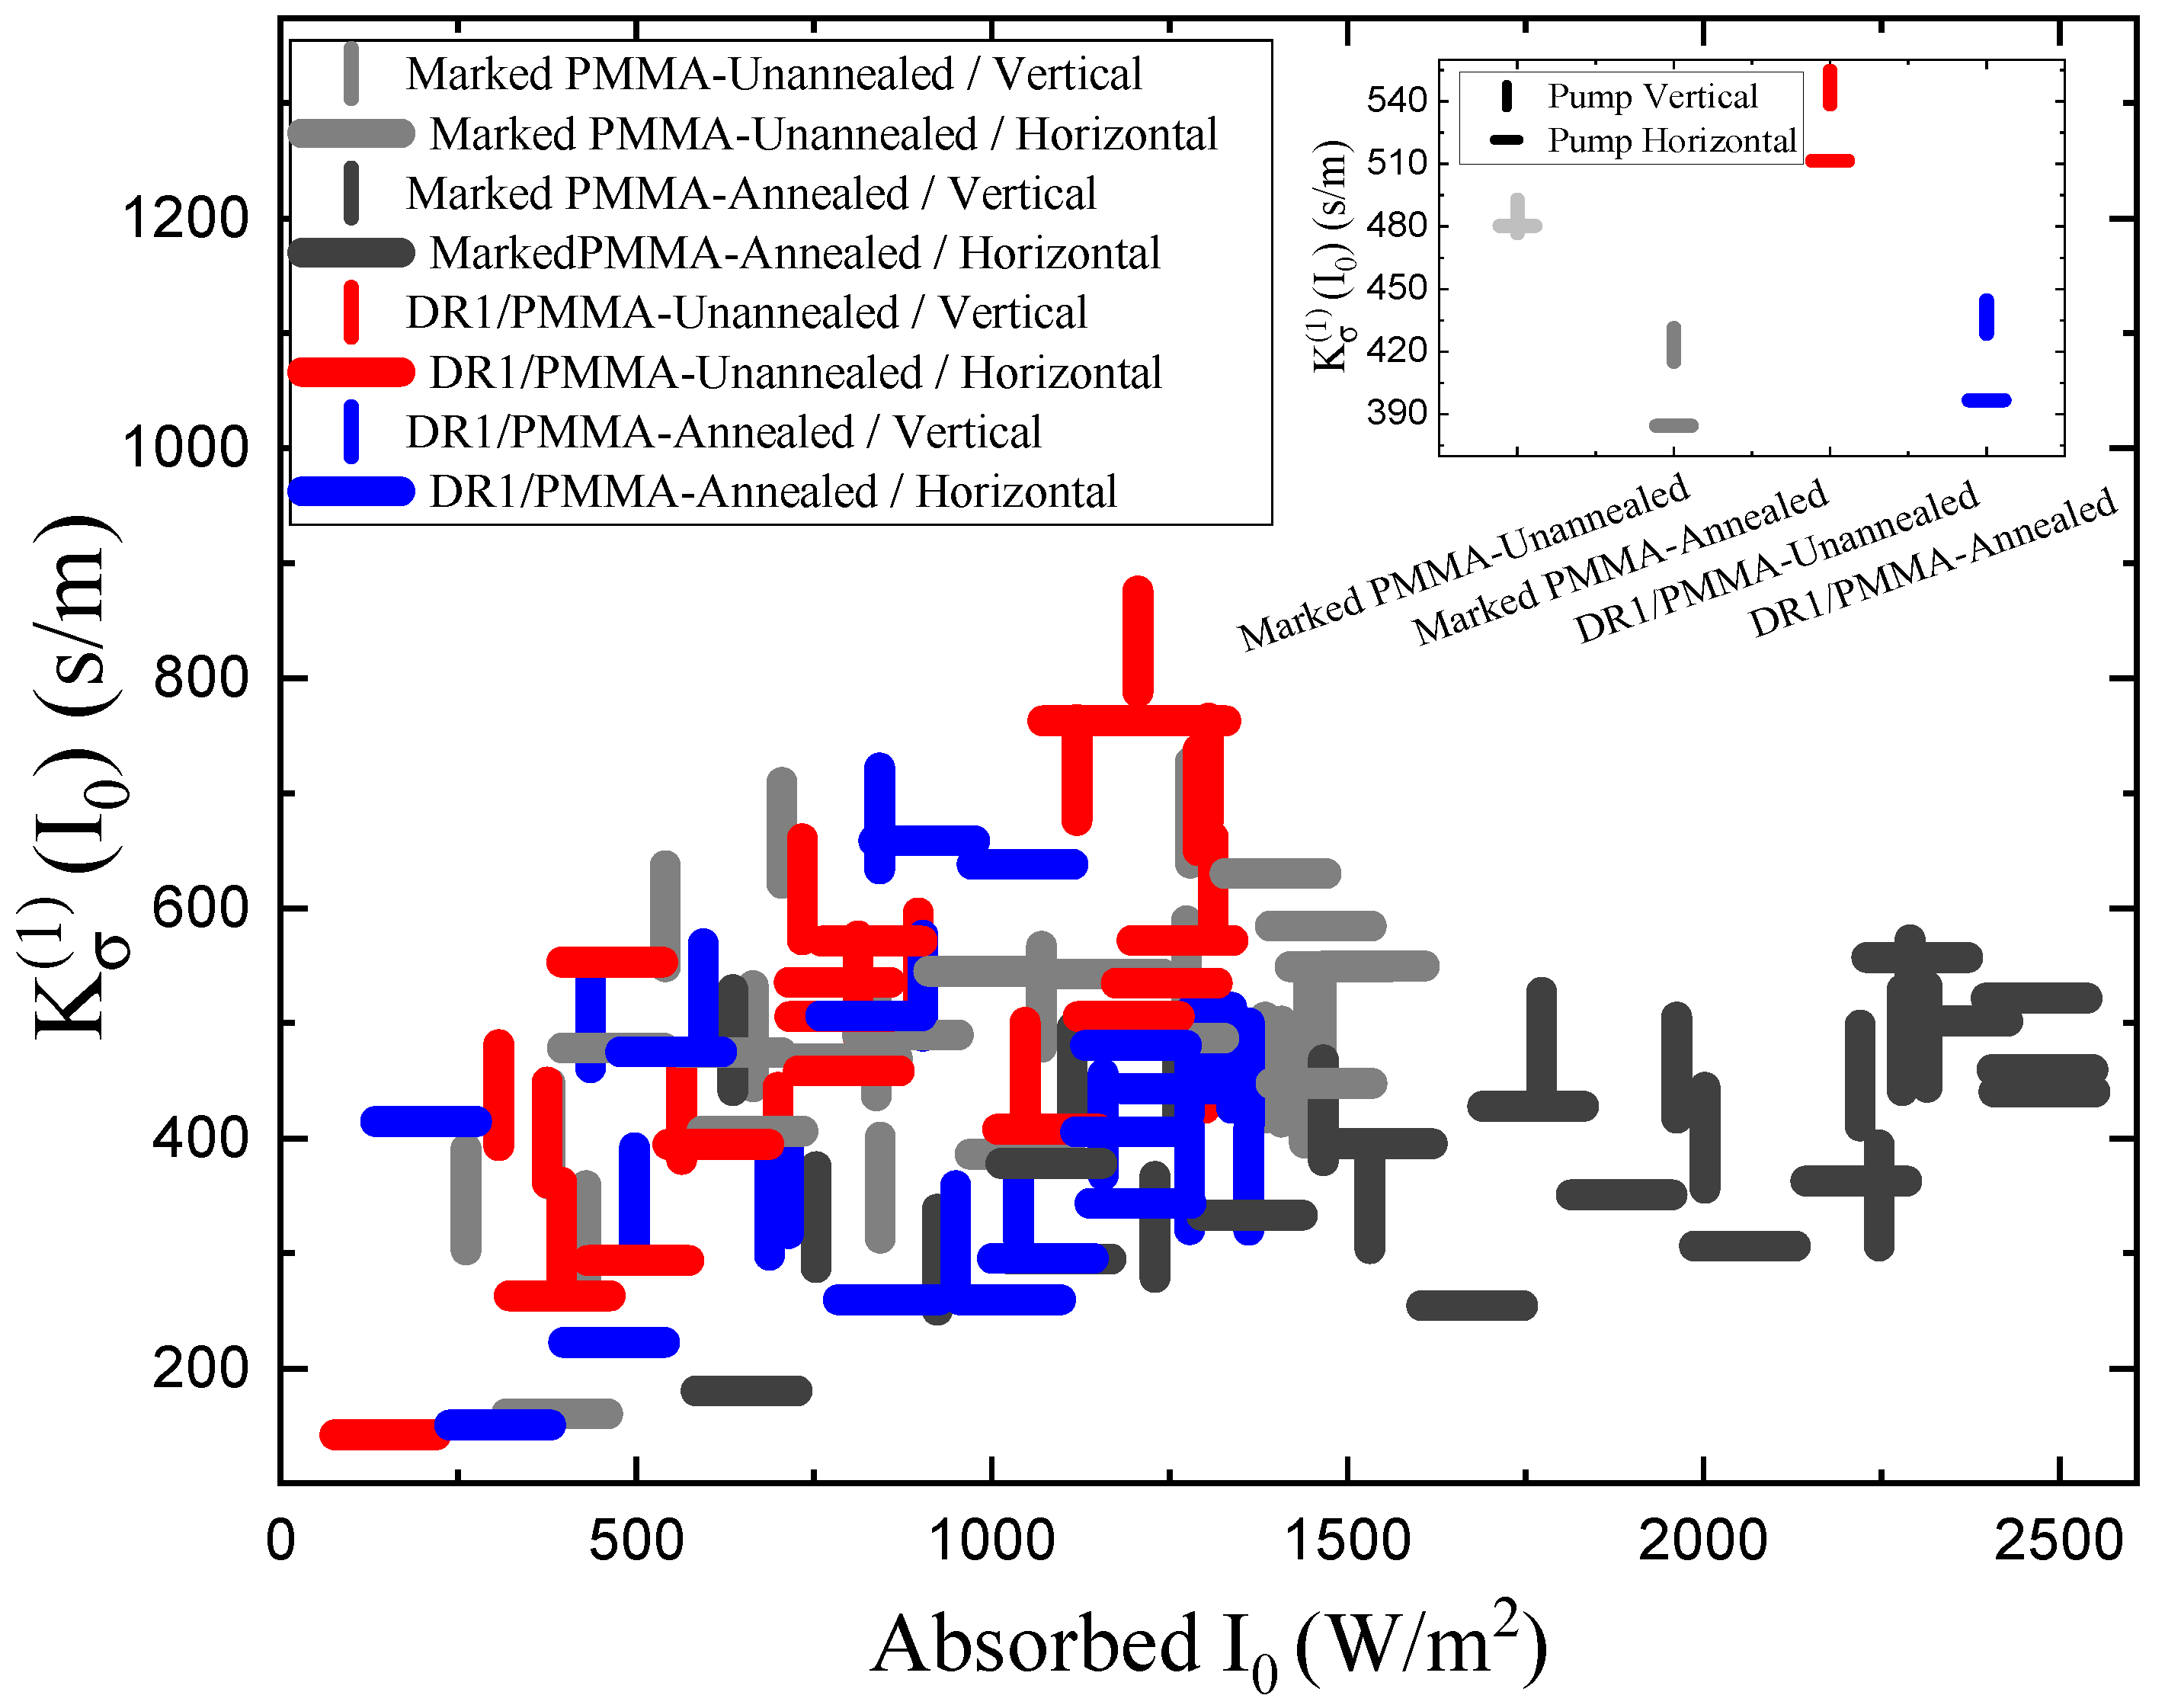
Intensity-Dependent Measurements
5. Conclusions
Author Contributions
Funding
Institutional Review Board Statement
Informed Consent Statement
Data Availability Statement
Acknowledgments
Conflicts of Interest
Sample Availability
Abbreviations
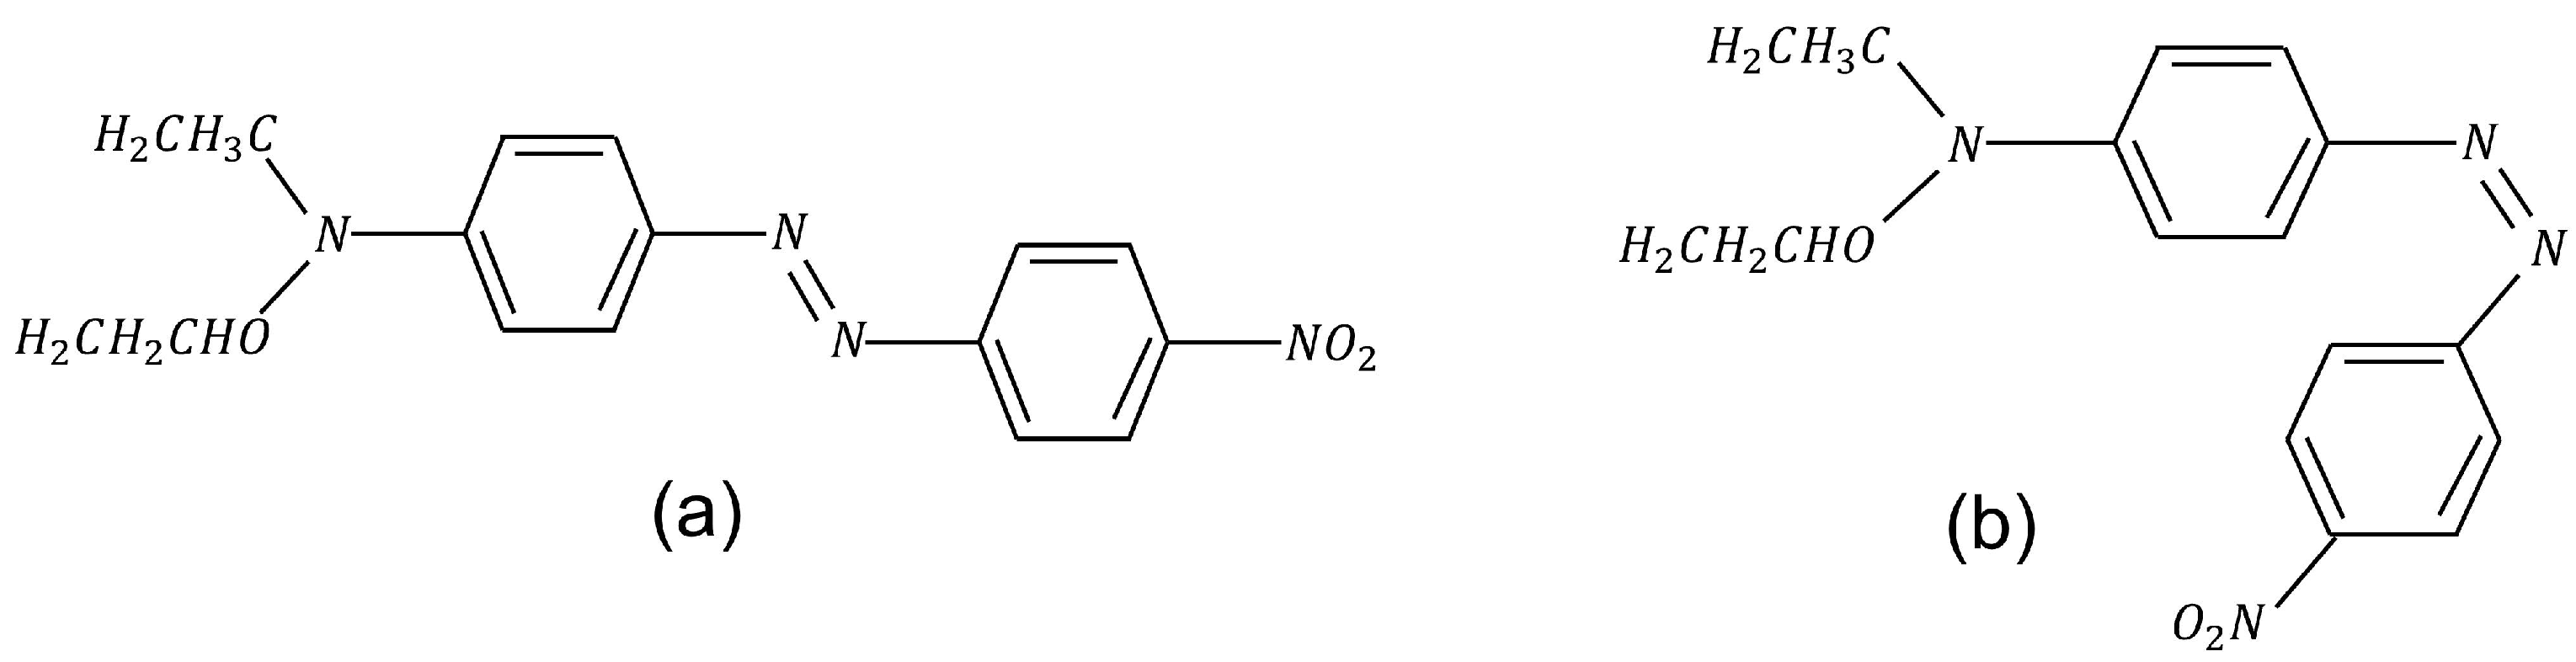
| DR1 | Disperse Red 1 |
| PMMA | Poly(methyl methacrylate) |
| Glass Transition Temperature | |
| POF | Polymer Optical Fiber |
| FOM | Figure of Merit |
| MMA | Methyl Methacrylate |
| INT | Initiator |
| CTA | Chain Transfer Agent |
References
- Xiong, Z.; Peng, G.D.; Chu, P.L. Nonlinear coupling and optical switching in a beta-carotene-doped twin-core polymer optical fiber. Opt. Eng. 2000, 39, 624–627. [Google Scholar] [CrossRef]
- Jiang, C.; Kuzyk, M.G.; Ding, J.L.; Johns, W.E.; Welker, D.J. Fabrication and mechanical behavior of dye-doped polymer optical fiber. J. Appl. Phys. 2002, 92, 4–12. [Google Scholar] [CrossRef]
- Aitchison, J.S.; Villeneuve, A.; Stegeman, G.I. All-optical switching in two cascaded nonlinear directional couplers. Opt. Lett. 1995, 20, 698. [Google Scholar] [CrossRef]
- Asobe, M.; Naganuma, K.; Kaino, T.; Kanamori, T.; Tomaru, S.; Kurihara, T. Switching energy limitation in all-optical switching due to group velocity dispersion of highly nonlinear optical waveguides. Appl. Phys. Lett. 1994, 64, 2922–2924. [Google Scholar] [CrossRef]
- Assanto, G.; Stegeman, G.; Sheik-Bahae, M.; Stryland, E.V. All-optical switching devices based on large nonlinear phase shifts from second harmonic generation. Appl. Phys. Lett. 1993, 62, 1323–1325. [Google Scholar] [CrossRef]
- Eggleton, B.J.; Slusher, R.E.; Judkins, J.B.; Stark, J.B.; Vengsarkar, A.M. All-optical switching in long-period fiber gratings. Opt. Lett. 1997, 22, 883. [Google Scholar] [CrossRef]
- Fork, R. Physics of optical switching. Phys. Rev. A 1982, 26, 2049. [Google Scholar] [CrossRef]
- He, G.S.; Zhu, J.; Baev, A.; Samoć, M.; Frattarelli, D.L.; Watanabe, N.; Facchetti, A.; Ågren, H.; Marks, T.J.; Prasad, P.N. Twisted π-System Chromophores for All-Optical Switching. J. Am. Chem. Soc. 2011, 133, 6675–6680. [Google Scholar] [CrossRef]
- Jinno, M.; Matsumoto, T. Ultrafast, Low Power, and Highly Stable All-Optical Switching inan All Polarization Maintaining Fiber Sagnac Interferometer. IEEE Photonics Technol. Lett. 1990, 2, 349. [Google Scholar] [CrossRef]
- Welker, D.J.; Kuzyk, M.G. All-optical switching in a dye-doped polymer fiber Fabry–Perot waveguide. Appl. Phys. Lett. 1996, 69, 1835–1836. [Google Scholar] [CrossRef]
- Tagaya, A.; Koike, Y.; Kinoshita, T.; Nihei, E.; Yamamoto, T.; Sasaki, K. Polymer optical fiber amplifier. Appl. Phys. Lett. 1993, 63, 883–884. [Google Scholar] [CrossRef]
- Koynov, K.; Saltiel, S.; Buchvarov, I. All-optical switching by means of an interferometer with nonlinear frequency doubling mirrors. J. Opt. Soc. Am. B 1997, 14, 834. [Google Scholar] [CrossRef]
- Silberberg, Y.; Perimutter, P.; Baran, J.E. Digital Optical Switch. Appl. Phys. Lett. 1987, 51, 1230–1232. [Google Scholar] [CrossRef]
- Ono, M.; Hata, M.; Tsunekawa, M.; Nozaki, K.; Sumikura, H.; Chiba, H.; Notomi, M. Ultrafast and energy-efficient all-optical switching with graphene-loaded deep-subwavelength plasmonic waveguides. Nat. Photonics 2019, 14, 37–43. [Google Scholar] [CrossRef] [Green Version]
- Li, Y.; Bhattacharyya, A.; Thomidis, C.; Moustakas, T.D.; Paiella, R. Ultrafast all-optical switching with low saturation energy via intersubband transitions in GaN/AlN quantum-well waveguides. Opt. Express 2007, 15, 17922. [Google Scholar] [CrossRef]
- Zhou, B.; Bernhardt, E.; Bhuyan, A.; Ghorbanishiadeh, Z.; Rasmussen, N.; Lanska, J.; Kuzyk, M.G. Theoretical and experimental studies of photomechanical materials [Invited]. J. Opt. Soc. Am. B 2019, 36, 1492. [Google Scholar] [CrossRef] [Green Version]
- Kuzyk, M.G.; Garvey, D.W.; Canfield, B.K.; Vigil, S.R.; Welker, D.J.; Tostenrude, J.; Breckon, C. Characterization of single-mode polymer optical fiber and electrooptic fiber devices. Chem. Phys. 1999, 245, 327–340. [Google Scholar] [CrossRef]
- Ishiyama, C.; Higo, Y. Effects of humidity on Young’s modulus in poly(methyl methacrylate). J. Polym. Sci. Part B Polym. Phys. 2002, 40, 460–465. [Google Scholar] [CrossRef]
- Hamouda, A.M.S. The influence of humidity on the deformation and fracture behaviour of PMMA. J. Mater. Process. Technol. 2002, 124, 238–243. [Google Scholar] [CrossRef]
- Kuzyk, M.G.; Paek, U.C.; Dirk, C.W. Guest-host polymer fibers for nonlinear optics. Appl. Phys. Lett. 1991, 59, 902–904. [Google Scholar] [CrossRef]
- Mahimwalla, Z.; Yager, K.G.; Ichi Mamiya, J.; Shishido, A.; Priimagi, A.; Barrett, C.J. Azobenzene photomechanics: Prospects and potential applications. Polym. Bull. 2012, 69, 967–1006. [Google Scholar] [CrossRef]
- Kuzyk, M.G.; Dawson, N.J. Photomechanical materials and applications: A tutorial. Adv. Opt. Photonics 2020, 12, 847. [Google Scholar] [CrossRef]
- Ghorbanishiadeh, Z.; Zhou, B.; Karkhaneh, M.S.; Oehler, R.; Kuzyk, M.G. Photothermal and Reorientational Contributions to the Photomechanical Response of DR1 Azo Dye-Doped PMMA Fibers. Appl. Sci. 2021, 12, 315. [Google Scholar] [CrossRef]
- Taniguchi, T.; Asahi, T.; Koshima, H. Photomechanical Azobenzene Crystals. Crystals 2019, 9, 437. [Google Scholar] [CrossRef] [Green Version]
- Riggleman, R.A.; de Pablo, J.J. Antiplasticization and local elastic constants in trehalose and glycerol mixtures. J. Chem. Phys. 2008, 128, 224504. [Google Scholar] [CrossRef] [PubMed]
- Delcambre, S.P.; Riggleman, R.A.; de Pablo, J.J.; Nealey, P.F. Mechanical properties of antiplasticized polymer nanostructures. Soft Matter 2010, 6, 2475. [Google Scholar] [CrossRef]
- Riggleman, R.A.; Douglas, J.F.; de Pablo, J.J. Antiplasticization and the elastic properties of glass-forming polymer liquids. Soft Matter 2010, 6, 292–304. [Google Scholar] [CrossRef]
- Mascia, L.; Kouparitsas, Y.; Nocita, D.; Bao, X. Antiplasticization of Polymer Materials: Structural Aspects and Effects on Mechanical and Diffusion-Controlled Properties. Polymers 2020, 12, 769. [Google Scholar] [CrossRef] [Green Version]
- Soong, S.Y.; Cohen, R.E.; Boyce, M.C.; Chen, W. The effects of thermomechanical history and strain rate on antiplasticization of PVC. Polymer 2008, 49, 1440–1443. [Google Scholar] [CrossRef]
- Lei, D.; Runt, J.; Safari, A.; Newnham, R.E. Dielectric properties of azo dye-poly(methyl methacrylate) mixtures. Macromolecules 1987, 20, 1797–1801. [Google Scholar] [CrossRef]
- Abdel-Wahab, A.A.; Ataya, S.; Silberschmidt, V.V. Temperature-dependent mechanical behaviour of PMMA: Experimental analysis and modelling. Polym. Test. 2017, 58, 86–95. [Google Scholar] [CrossRef] [Green Version]
- Amalia, N.; Yuliza, E.; Margaretta, D.O.; Utami, F.D.; Surtiyeni, N.; Viridi, S.; Abdullah, M. A novel method for characterizing temperature-dependent elastic modulus and glass transition temperature by processing the images of bending cantilever slender beams at different temperatures. AIP Adv. 2018, 8, 115201. [Google Scholar] [CrossRef] [Green Version]
- Sorelli, L.; Fabbri, F.; Frech-Baronet, J.; Vu, A.D.; Fafard, M.; Gacoin, T.; Lahlil, K.; Martinelli, L.; Lassailly, Y.; Peretti, J. A closer look at the light-induced changes in the mechanical properties of azobenzene-containing polymers by statistical nanoindentation. J. Mater. Chem. C 2015, 3, 11055–11065. [Google Scholar] [CrossRef] [Green Version]
- Sekkat, Z.; Wood, J.; Knoll, W. Reorientation Mechanism of Azobenzenes within the Trans ⇒ Cis Photoisomerization. J. Phys. Chem. 1995, 99, 17226–17234. [Google Scholar] [CrossRef]
- Sekkat, Z.; Yasumatsu, D.; Kawata, S. Pure Photoorientation of Azo Dye in Polyurethanes and Quantification of Orientation of Spectrally Overlapping Isomers. J. Phys. Chem. B 2002, 106, 12407–12417. [Google Scholar] [CrossRef]
- Sekkat, Z. Vectorial motion of matter induced by light fueled molecular machines. OSA Contin. 2018, 1, 668. [Google Scholar] [CrossRef]
- Naumov, P.; Chizhik, S.; Panda, M.K.; Nath, N.K.; Boldyreva, E. Mechanically Responsive Molecular Crystals. Chem. Rev. 2015, 115, 12440–12490. [Google Scholar] [CrossRef]
- Chizhik, S.; Sidelnikov, A.; Zakharov, B.; Naumov, P.; Boldyreva, E. Quantification of photoinduced bending of dynamic molecular crystals: From macroscopic strain to kinetic constants and activation energies. Chem. Sci. 2018, 9, 2319–2335. [Google Scholar] [CrossRef] [Green Version]
- Taniguchi, T.; Blanc, L.; Asahi, T.; Koshima, H.; Lambert, P. Statistical Modeling of Photo-Bending Actuation of Hybrid Silicones Mixed with Azobenzene Powder. Actuators 2019, 8, 68. [Google Scholar] [CrossRef] [Green Version]
- Megson, T.H.G. Structural and Stress Analysis, 2nd ed.; Butterworth-Heinemann: Oxford, UK, 2005. [Google Scholar]
- Kuzyk, M.G.; Dirk, C.W.; Sohn, J.E. Mechanisms of quadratic electro-optic modulation of dye-doped polymer systems. J. Opt. Soc. Am. B 1990, 7, 842. [Google Scholar] [CrossRef]
- Bian, S.; Robinson, D.; Kuzyk, M.G. Optically activated cantilever using photomechanical effects in dye-doped polymer fibers. J. Opt. Soc. Am. B 2006, 23, 697. [Google Scholar] [CrossRef] [Green Version]
- Kuzyk, M.G. Polymer Fiber Optics: Materials, Physics, and Applications; CRC Press: Boca Raton, FL, USA, 2006. [Google Scholar]
- Harvey, C.L.M.; Terentjev, E.M. Role of polarization and alignment in photoactuation of nematic elastomers. Eur. Phys. J. E 2007, 23, 185–189. [Google Scholar] [CrossRef] [PubMed]
- Bernhardt, E.A.; Garrison, C.M.; Rasmussen, N.F.; Lanska, J.T.; Kuzyk, M.G. An apparatus for measuring a material’s photomechanical response. Am. J. Phys. 2018, 86, 943–952. [Google Scholar] [CrossRef] [Green Version]
- Dawson, N.J.; Kuzyk, M.G.; Neal, J.; Luchette, P.; Palffy-Muhoray, P. Experimental studies of the mechanisms of photomechanical effects in a nematic liquid crystal elastomer. J. Opt. Soc. Am. B 2011, 28, 1916. [Google Scholar] [CrossRef] [Green Version]
- Dawson, N.J.; Kuzyk, M.G.; Neal, J.; Luchette, P.; Palffy-Muhoray, P. Modeling the mechanisms of the photomechanical response of a nematic liquid crystal elastomer. J. Opt. Soc. Am. B 2011, 28, 2134. [Google Scholar] [CrossRef] [Green Version]
- Moniruzzaman, M.; Zioupos, P.; Fernando, G.F. Investigation of reversible photo-mechanical properties of azobenzene-based polymer films by nanoindentation. Scr. Mater. 2006, 54, 257–261. [Google Scholar] [CrossRef]
- Karageorgiev, P.; Neher, D.; Schulz, B.; Stiller, B.; Pietsch, U.; Giersig, M.; Brehmer, L. From anisotropic photo-fluidity towards nanomanipulation in the optical near-field. Nat. Mater. 2005, 4, 699–703. [Google Scholar] [CrossRef]
- Vapaavuori, J.; Mahimwalla, Z.; Chromik, R.R.; Kaivola, M.; Priimagi, A.; Barrett, C.J. Nanoindentation study of light-induced softening of supramolecular and covalently functionalized azo polymers. J. Mater. Chem. C 2013, 1, 2806. [Google Scholar] [CrossRef]
- Harrison, J.M.; Goldbaum, D.; Corkery, T.C.; Barrett, C.J.; Chromik, R.R. Nanoindentation studies to separate thermal and optical effects in photo-softening of azo polymers. J. Mater. Chem. C 2015, 3, 995–1003. [Google Scholar] [CrossRef]
- Richter, A.; Nowicki, M.; Wolf, B. A Nanoindentation Study of Photo-Induced Changes in Polymers Containing Azobenzene. Mol. Cryst. Liq. Cryst. 2008, 483, 49–61. [Google Scholar] [CrossRef]


| Sample | A (mm2) | E (GPa) |
|---|---|---|
| PMMA-Unannealed | 0.25 × 0.14 | 2.84 (±0.1) |
| PMMA-Annealed | 0.25 × 0.15 | 2.34 (±0.06) |
| DR1/PMMA-Unannealed | 0.25 × 0.13 | 3.23 (±0.1) |
| DR1/PMMA-Annealed | 0.25 × 0.14 | 2.92 (±0.09) |
| Sample | (GPa) | (K) | |
|---|---|---|---|
| PMMA-Unannealed | 2.80 (±0.03) | 343.56 (±1.81) | 24.29 (±2.54) |
| PMMA-Annealed | 2.45 (±0.14) | 377.26 (±8.99) | 9.09 (±3.19) |
| DR1/PMMA-Unannealed | 3.03 (±0.03) | 344.23 (±2.93) | 28.79 (±4.17) |
| DR1/PMMA-Annealed | 3.06 (±0.25) | 361.35 (±8.42) | 11.43 (±5.39) |
| Correlations | (Confidence) | (Confidence) |
|---|---|---|
| PMMA Annealed vs. Unannealed | 2.50 (0.9876) | 3.67 (0.9998) |
| DR1/PMMA Annealed vs. Unannealed | 0.119 (0.0947) | 1.92 (0.9451) |
| PMMA vs. DR1/PMMA, Both Unannealed | 5.42 (0.99999994) | 0.194 (0.1538) |
| PMMA vs. DR1/PMMA, Both Annealed | 2.13 (0.9668) | 1.29 (0.8029) |
| Sample | (kg/m3) | c (J/kg K) | w (mm) |
|---|---|---|---|
| PMMA-Unannealed | 1.19 × 10³ | 1.42 × 10³ | 0.14 |
| PMMA-Annealed | 1.19 × 10³ | 1.42 × 10³ | 0.15 |
| DR1/PMMA-Unannealed | 1.19 × 10³ | 1.42 × 10³ | 0.13 |
| DR1/PMMA-Annealed | 1.19 × 10³ | 1.42 × 10³ | 0.14 |
| Sample | (MPa) | (MPa) | (K) | n |
|---|---|---|---|---|
| PMMA-Unannealed | −10 (±0) | 12.25 (±0.01) | 327.02 (±0.04) | 13.99 (±0.04) |
| PMMA-Annealed | −10 (±0) | 11.86 (±0.01) | 330.64 (±0.03) | 14.29 (±0.04) |
| DR1/PMMA-Unannealed | −10 (±0) | 11.21 (±0.01) | 327.91 (±0.01) | 18.80 (±0.04) |
| DR1/PMMA-Annealed | −10 (±0) | 11.36 (±0.01) | 331.16 (±0.02) | 15.83 (±0.04) |
Publisher’s Note: MDPI stays neutral with regard to jurisdictional claims in published maps and institutional affiliations. |
© 2022 by the authors. Licensee MDPI, Basel, Switzerland. This article is an open access article distributed under the terms and conditions of the Creative Commons Attribution (CC BY) license (https://creativecommons.org/licenses/by/4.0/).
Share and Cite
Ghorbanishiadeh, Z.; Zhou, B.; Sheibani Karkhaneh, M.; Oehler, R.; Kuzyk, M.G. Effect of Disperse Red 1 Azobenzene Dye Doping and Annealing on the Thermomechanical and Photomechanical Properties of PMMA Fibers. Appl. Sci. 2022, 12, 7991. https://doi.org/10.3390/app12167991
Ghorbanishiadeh Z, Zhou B, Sheibani Karkhaneh M, Oehler R, Kuzyk MG. Effect of Disperse Red 1 Azobenzene Dye Doping and Annealing on the Thermomechanical and Photomechanical Properties of PMMA Fibers. Applied Sciences. 2022; 12(16):7991. https://doi.org/10.3390/app12167991
Chicago/Turabian StyleGhorbanishiadeh, Zoya, Bojun Zhou, Morteza Sheibani Karkhaneh, Rebecca Oehler, and Mark G. Kuzyk. 2022. "Effect of Disperse Red 1 Azobenzene Dye Doping and Annealing on the Thermomechanical and Photomechanical Properties of PMMA Fibers" Applied Sciences 12, no. 16: 7991. https://doi.org/10.3390/app12167991
APA StyleGhorbanishiadeh, Z., Zhou, B., Sheibani Karkhaneh, M., Oehler, R., & Kuzyk, M. G. (2022). Effect of Disperse Red 1 Azobenzene Dye Doping and Annealing on the Thermomechanical and Photomechanical Properties of PMMA Fibers. Applied Sciences, 12(16), 7991. https://doi.org/10.3390/app12167991