Article

All-Optical Method of Determining Laser Power from the Photomechanical Effect

1
Computer Science and Engineering Division, University of Michigan, Ann Harbor, MI 48109, USA
2
Department of Physics, Astronomy, Geology, and Environmental Science, Youngstown State University, Youngstown, OH 44555, USA
3
College of Natural and Computational Sciences, Hawaii Pacific University, Kaneohe, HI 96744, USA
4
Department of Physics and Astronomy, Washington State University, Pullman, WA 99163, USA
*
Author to whom correspondence should be addressed.
Appl. Sci. 2022, 12(21), 10708; https://doi.org/10.3390/app122110708
Submission received: 1 October 2022 / Revised: 18 October 2022 / Accepted: 19 October 2022 / Published: 22 October 2022
(This article belongs to the Special Issue Smart Light-Driven Materials and Applications)

Abstract

:
A method to determine the power of a continuous wave laser from photothermal heating of a poly(dimethyl siloxane) film is reported. The base was doped with oil red O and cured on a surface relief grating. The grating period was shown to increase proportional to the temperature by monitoring the decrease in diffraction angle of a probe beam. A 10 s illumination period of a continuous wave (CW) pump beam absorbed by the film increased the film’s temperature, which resulted in a local strain that could be modeled using the two-dimensional heat kernel. The amplitude of the transient response was found to be linearly correlated with the pump laser power.

1. Introduction

Optical power is typically measured by transducing a beam’s light energy into an electrical signal. The pyroelectric effect is the most notable mechanism for converting light energy from pulsed lasers into an electric signal [1,2,3]. A short pulse of light absorbed at the surface of a sensor is converted to thermal energy which in turn causes a temporary shift in the voltage across a pyroelectric crystal. The high sensitivity pyroelectric sensors to transient signals is critical to their operation, where they are designed to measure the energy of the laser pulse. The most common class of CW laser power sensor absorbs light at its surface which produces heat. If the other side of the sensor is held at a constant lower temperature, a gradient forms and heat flows to the lower temperature side. The thermal power is then converted to an electrical signal by either thermocouples or semiconductors with large thermoelectric efficiencies [4,5,6,7]. Thermoelectric and thermopile laser sensors measure an assumed static temperature gradient from a CW laser source and ill-equipped to measure sub-microsecond heat impulses. Likewise, pyroelectric sensors that measure transient signals are ill-suited for CW laser power measurements. Another class of laser power sensor directly converts light energy into an electrical current via exciton formation and separation near a photodiode’s pn-junction [8,9]. The photodiode sensor is typically used for CW laser power measurements; however, some low-energy laser pulse sensors are based on photodiodes (for example, a broad assortment of commercial sensors are available from Ophir (https://www.ophiropt.com, accessed 12 October 2022) or Gentec-EO (https://www.gentec-eo.com/, accessed 12 October 2022)).
The operating wavelength range of laser thermal power/energy sensors depends on the spectral profile of the light-absorbing material. Thus, the surface of a laser thermal sensor can be coated by a thin film to tune the sensor’s spectral response. The wavelength range of photodiode sensors is limited to response of the diode material [10]. For example, some Si photodiodes protected by fused silica windows have a response range from about 200 nm to 1100 nm [11], whereas InGaAs photodiodes have a near infrared response range typically between 800 nm and 1800 nm [12]. In this paper, we introduce a new type of CW laser power sensor based on the macroscopic deformation of a material under illumination, which is referred to as the photomechanical effect [13,14]. There are many types of materials that can have large photomechanical strains over a broad range of wavelengths making them well-suited for laser power measurements. A large assortment of photomechanical materials can be synthesized, fabricated, or purchased at relatively low cost. Some of these materials can be processed with ease using small benchtop equipment.
There are a few well-studied mechanisms responsible for the photomechanical effect. Light striking a piezoelectric material can cause a photostrictive strain from the photovoltaic effect [15,16]. Another mechanism that causes light-induced deformations is observed in prestrained polymers/elastomers crosslinked with nematic mesogens [17,18] and doped with azobenzene and other photochromic dyes [19,20,21,22,23]. Trans-cis photoisomerization of the photochromic molecules disrupts the orientational order of the mesogens which leads to a contraction along the director in the nematic phase [24,25,26,27,28]. Photomechanical effects are also observed in photochromic polymers, which are polymeric materials with backbones that contain photochromic moieties, where trans-cis photoisomerization can cause macroscopic mechanical deformations [29,30,31,32,33,34,35,36]. The most common mechanism associated with the photomechanical effect is photothermal heating, where materials are heated upon absorbing light which increases their temperature [37,38,39,40,41,42]. Photothermal heating can cause a reduction in the orientational order of mesogens in the previously mentioned liquid crystal polymers/elastomers which also results in a contraction along the director [43,44,45]. Materials expand volumetrically when heated [46,47], where large coefficients of thermal expansion and small heat capacities offer the greatest photomechanical strains in isotropic materials. When small azobenzene dyes such as disperse red 1 are doped in amorphous polymers, a small portion of the linear strain has been attributed to molecular reorientation of dopant molecules [48,49].
The type of photomechanical actuation exhibited by a material is determined by its shape and microscopic properties [50,51,52]. Uniaxial strain has been demonstrated in chromophore-doped polymer optical fibers, where bistable switches have been created using feedback from reflective ends [53,54,55,56]. Asymmetric pumping of fibers and thin planar materials can result in photomechanical cantilevers [57,58,59]. Bilayer materials with mismatched photo-induced strains can also act as photomechanical cantilevers [60,61,62,63,64,65,66]. Photomechanical devices benefit from expansions, contractions, bends, twists, and other complex deformations of photomechanical materials [67,68]. Many classes of photomechanical devices have been reported such as swimmers [69,70], flyers [71], walkers [72,73], tumblers [74], crawlers [75,76], motors [77], energy harvesters [78,79,80,81,82,83], microlens with tunable focal lengths [84], various biomimetic devices [85,86,87,88,89], and the photophone [90]. Photomechanical devices have also been shown to work as series [91,92,93] and parallel [94,95] components of a photomechanical system.
In this study, we investigate the photomechanical effect as a means of determining the power of a CW laser. A free-standing, dye-doped, polydimethylsiloxane (PDMS) layer with a surface relief grating expands after being heated by a pump laser, where the angle of a probe laser’s diffracted beam can be used to determine the grating period as a function of time. The PDMS elastomer was chosen for several reasons. A transmission diffraction grating was embossed on the PDMS surface due to its excellent optical transparency, which is in contrast to opaque light scattering photomechanical materials such as liquid crystal elastomers. The photo-induced strain in PDMS is linearly dependent on the illumination intensity for isotropic materials like PDMS that thermally expand when heated. Materials such as liquid crystal elastomers have nonlinear strain responses to both heat and light caused by the change in orientational order of the mesogens [17]. Restricting the material to have a single mechanism for a strain response to light further increases the linearity of a device as opposed to allowing additional slower responses such as photoisomerization observed in some photochromic polymers [96,97] and liquid crystal polymer networks [98] as well as reorientation effects from azobenzene-doped amorphous polymers [57]. Lastly, the coefficient of thermal expansion of PDMS is much greater than common thermoplastic polymers such as poly(methyl methacrylate) [99]. The cost of PDMS per unit volume is comparable with common plastic materials while have the formerly mentioned advantage, and it is easily cured in solvent-free formulations for soft-lithography applications.

2. Materials and Methods

The patterned PDMS elastomers were fabricated from Sylgard 184 which uses a 10:1 mix ratio for the base and curing agent. A 5 mL volume of base was first added to a 20 mL vial. The diazo chromophore, Oil red O, was mixed into the base yielding a concentration of 0.5 wt.% followed by agitation. The curing agent was then added to the base and rigorously mixed. Bubble formation occured after mixing so the vial was covered with Parafilm® and small holes were poked through the surface. The vial was placed in a vacuum concentrator for 5 min until the bubbles were removed from the mixture.
A diffraction grating was written on the surface of a PDMS elastomer in a similar manner as that described in References [100,101]. The burnable DVD was first split and the exposed surface relief grating was cleaned of any dye with 70% ethanol. Two spacers were placed on the grating surface with their long axis perpendicular to the diffraction grating groove direction as illustrated in Figure 1. The dye, base, and curing agent mixture was poured onto the grating surface between the two spacers. The mixture was then blade coated to uniform thickness by dragging a trowel over the two spacers. The blade-coated fluid was immediately transferred to an oven and cured at 80 C for two hours, which resulted in a 550 µm-thick elastomeric film. An atomic force microscope (AFM) was used to confirm the quality of the surface-relief grating, where an image from one of the samples is shown in Figure 1d.
The cured sample was cut into a circular piece with a tail from which it was hung. The hanger and sample were enclosed in a polycarbonate box. The box was surrounded with foam insulation except in two locations. One polycarbonate window allowed the pump and probe beams to pass through the box. The other window was covered by a bandpass filter to block any residual 532 nm pump light while transmitting the diffracted 650 nm probe beam. A linear CCD array (TCD1501C [102]) with a ∼7 µm width per pixel was placed outside the box and oriented perpendicular to the incident probe beam’s direction of propagation. The diffracted probe beam had an initial length of ∼10.5 cm as measured from the sample to the linear CCD array.
Temperature measurements were performed by placing a thermistor and heating element inside the box and connecting them to a thermostat. To create a stable temperature inside the box that could be reasonably adjusted with a thermostat, the initial temperature was raised a few degrees above the laboratory room’s temperature. The angle of the diffracted probe beam was recorded by the linear CCD array in 1.5 C increments.
For pump power measurements, the pump and probe lasers were aligned so that both beam spots were centered on the same location over the surface of the film. Figure 1e shows images of the pump and probe laser spots and topological profiles after Weiner noise filtering. Both the 532 nm pump and 650 nm probe beams were in operation for more than 10 min prior to any experimentation so that they could reach a temperature equilibrium and stabilize the output power. The pump beam was passed through a variable density filter to control the pump power. Infrared light with a wavelength of 1064 nm was removed from the pump beam with a KG-1 filter. Shutters were used to toggle the pump and probe beams on/off. As shown in Figure 1b, a beam splitter sent some of the pump to a reference detector and let the rest of the beam pass through to the polycarbonate window and illuminate the dye-doped PDMS sample.

3. Results

The sample’s grating period L increases with temperature due to thermal expansion. An increase in the grating period reduces the angle of the diffracted probe beam. The absolute angle was measured by the linear CCD array, where a Gaussian function was fitted to the intensity profile at different steady-state temperatures. The Gaussian function is given by
G y = A σ 2 π e y y 0 2 / 2 σ 2 ,
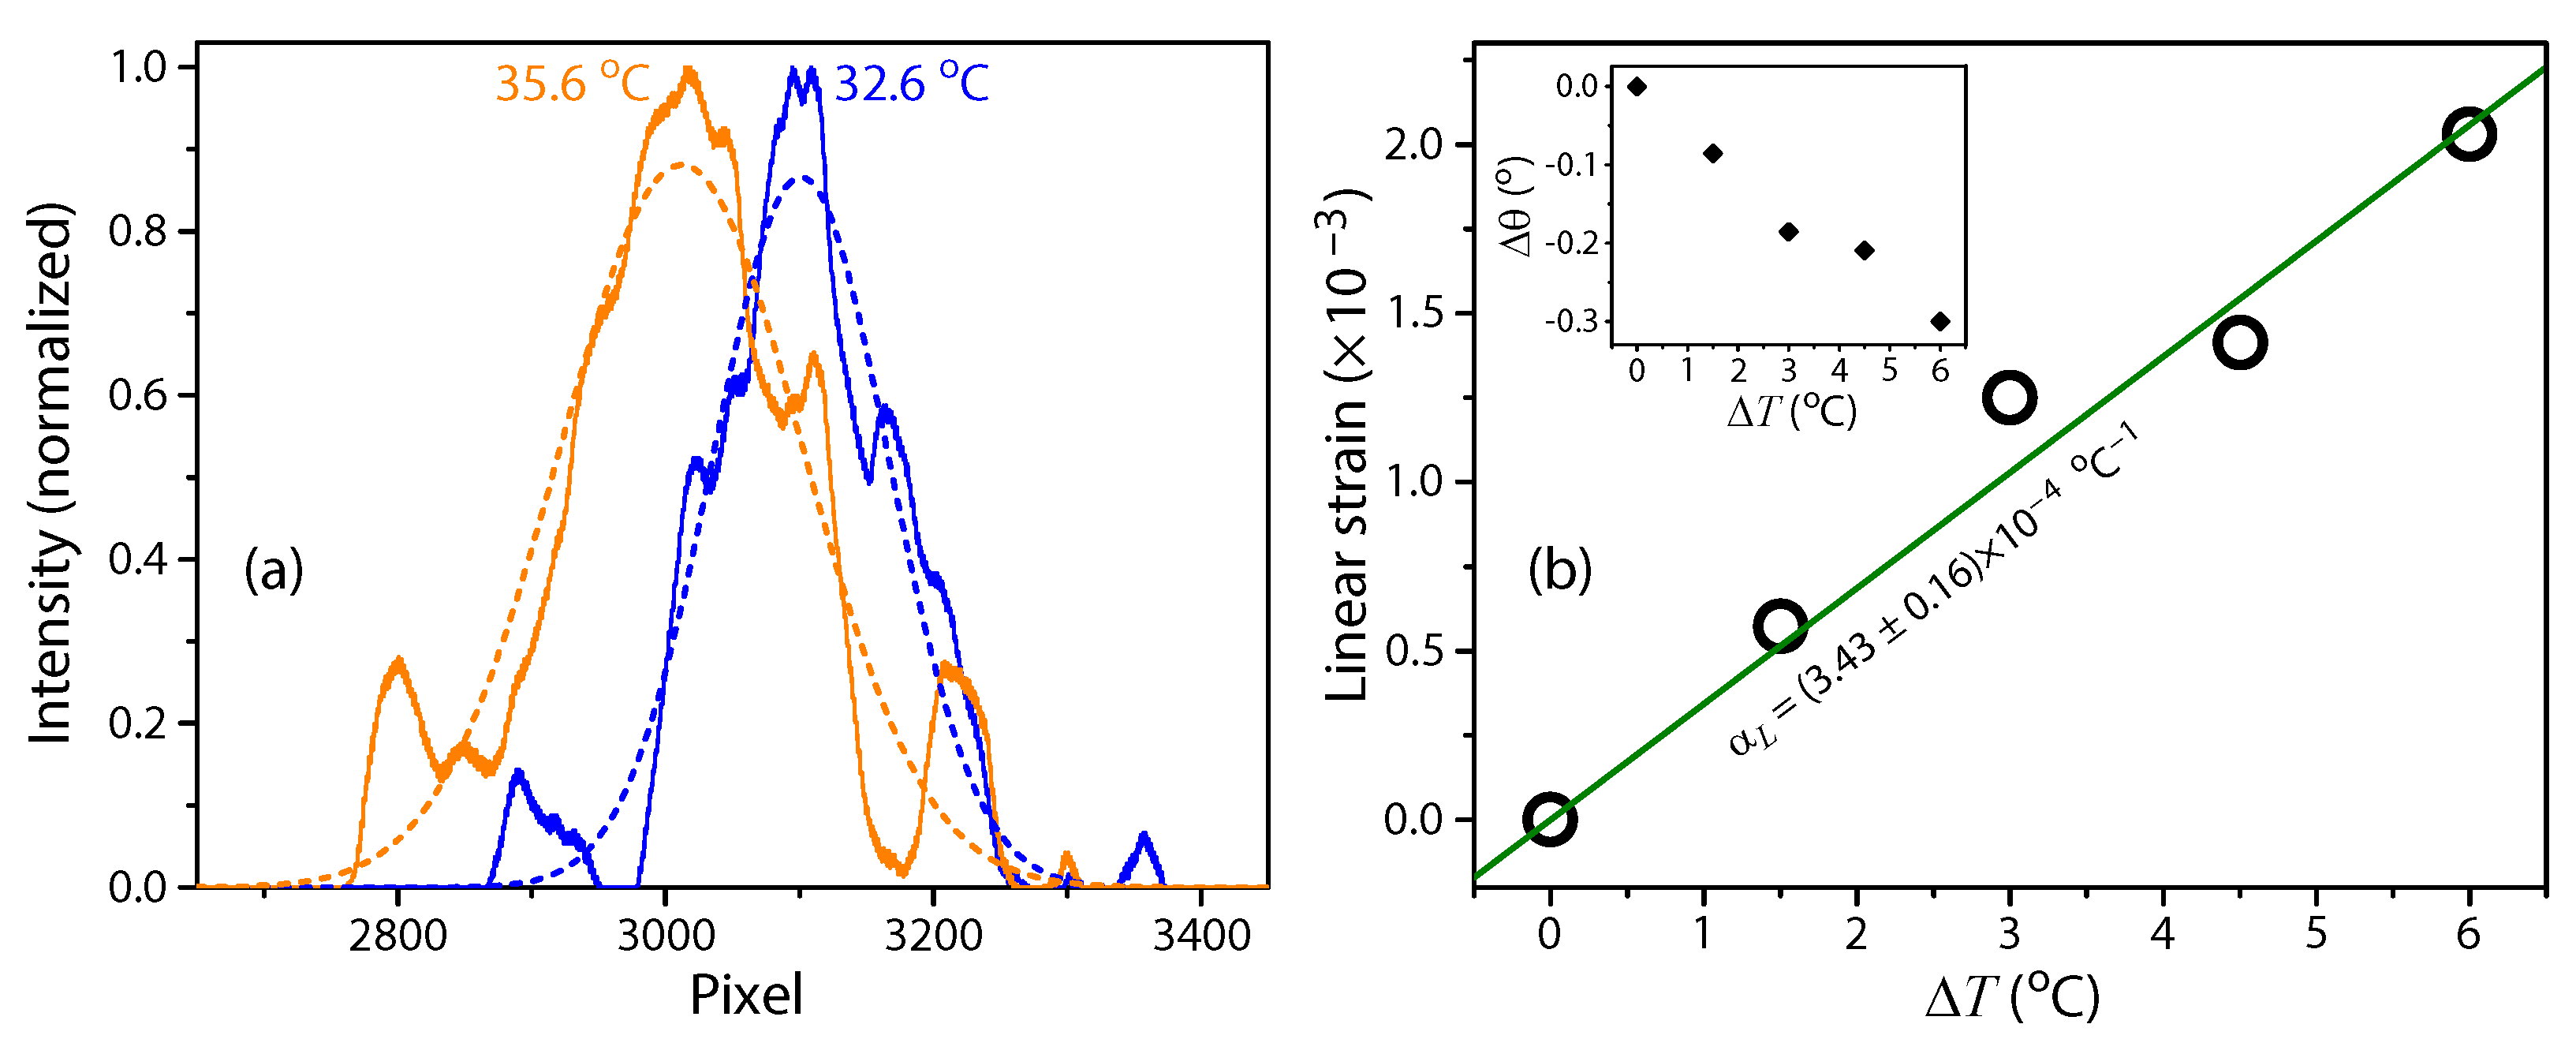
where A is the area of the Gaussian, y 0 is the location of the peak, and σ is the standard deviation. The position of the Gaussian peak was used to determine the angle θ of the diffracted beam at each elevated temperature. Figure 2a shows the normalized intensity profile incident on the linear CCD array for two different elevated temperatures along with the Gaussian fits to those profiles.
The grating period was determined by the equation
L sin θ n L sin θ pr = n λ ,
where θ pr is the incident angle of the probe beam, θ n is the angle of the diffracted beam, n = + 1 for the first-order diffraction beam, λ = 650 nm for the probe diode laser. When the incident angle of the probe beam in the experimental apparatus is negligibly small, θ pr 0 , Equation (2) simplifies to the form
L sin θ n = n λ .
The grating period was assumed to changed solely from thermal expansion of the PDMS. To first-order approximation, the change in the grating period, Δ L = L L 0 with L 0 being the initial grating period at an initial temperature T 0 , depends linearly on the change in temperature Δ T = T T 0 . The linear thermal expansion equation relating the linear strain Δ L / L 0 to the change in temperature is given by
Δ L L 0 = α L Δ T ,
where α L is the linear coefficient of thermal expansion.
The linear strain as a function of temperature change is shown in Figure 2b. From Equation (4), the slope of the graph gives the linear coefficient of thermal expansion. The value of 340 ppm/ C quoted by the technical data sheet [103] is within the experimental value of 343 ± 16 ppm/ C determined by linear regression with the line being constrained through the origin. The grating period shifted < 2 nm, but the method has a high degree of sensitivity owing to the diffracting beam acting as an optical lever. A polymer with a typical coefficient of thermal expansion of an order of magnitude less than PDMS can also be measured with the same precision by simply increasing the arm length of the optical lever (propagation length of the diffracted probe beam) by an order of magnitude.
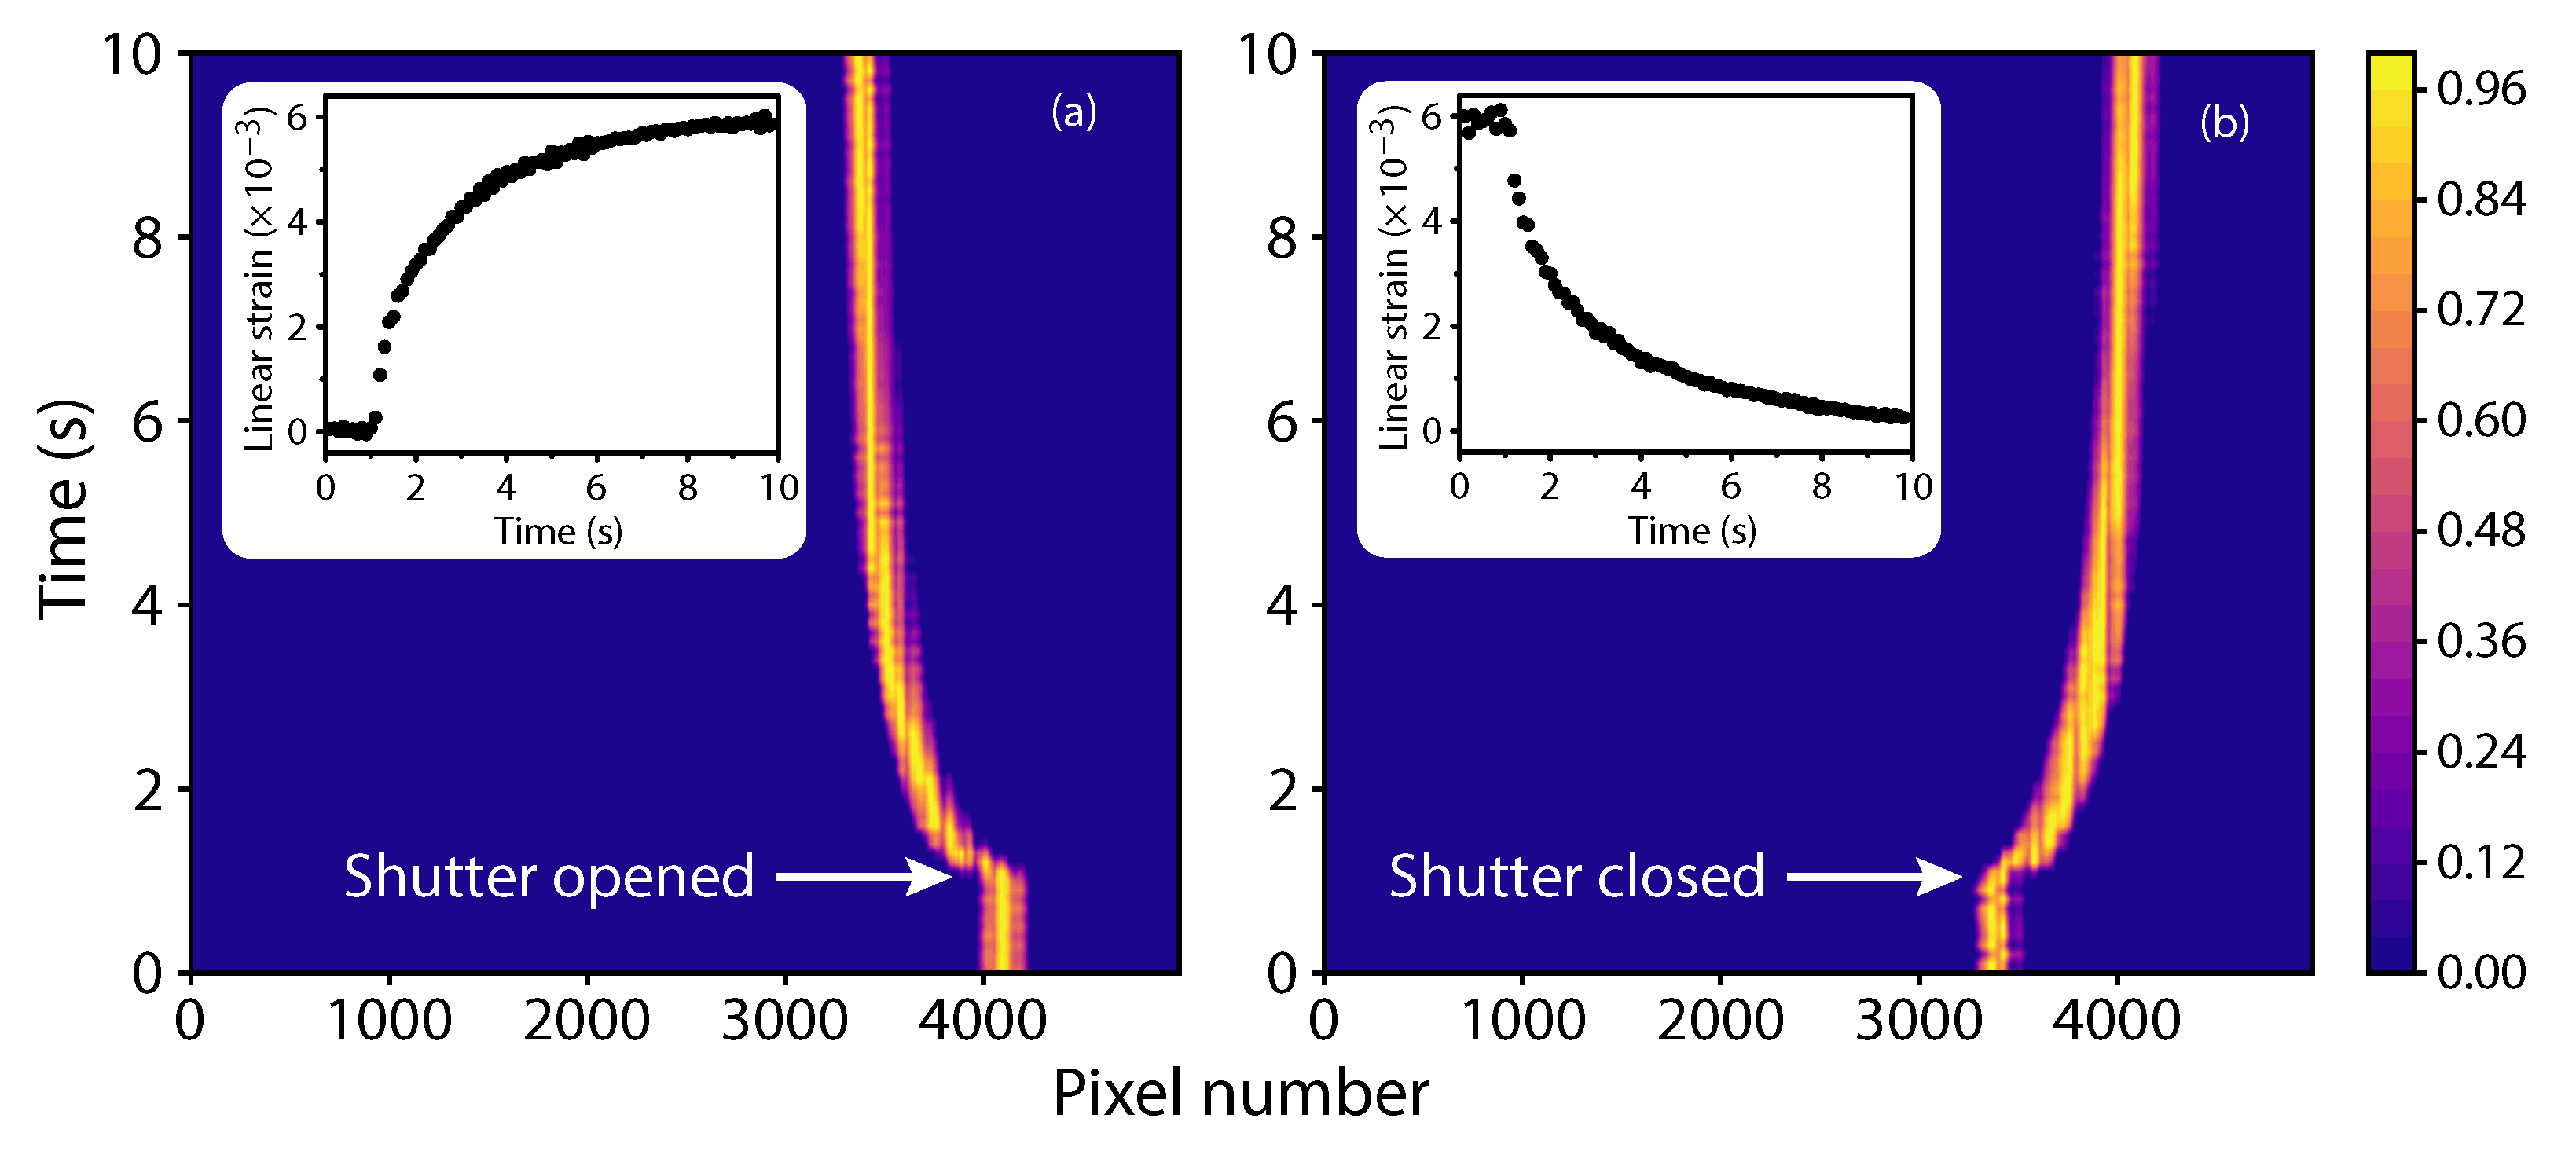
A diode pumped, frequency doubled, Nd-doped garnet laser with CW operation was focused on the 650 nm probe beam after letting the enclosed sample reach the ambient temperature in the laboratory. After filtering the infrared light from the green laser beam, the transmittance of the film was measured to be ∼0.8%. The transmittance remained constant over time while illuminated by the pump, and optical hole burning effects were not observed at the maximum pump power over the experimental illumination period of ∼10 s. Data from the linear CCD array was collected at 100 ms intervals. The data stream from the linear CCD array was immediately recorded after the external shutter in front of the red probe laser was opened. The green pump laser’s external shutter was opened ∼1 s after data recording began. Absorption of the pump laser resulted in photothermal heating of the dye-doped PDMS which resulted in thermal expansion. This thermal expansion is observed from the time-dependent decrease in the diffracted beam’s angle as measured with the linear CCD array. Figure 3a shows a contour plot of the intensity as a function of time and position on the linear CCD array. Note that the maximum values of 1 shown in the color-scale of Figure 3 are from normalization and not from any saturation of the CCD array. The CCD array only detects the probe beam, where the pump beam is filtered below the detection threshold of the linear CCD array. The thermal expansion of PDMS is a reversible process where Figure 3b shows the grating period being restored after closing the shutter in front of the pump beam. The insets of Figure 3 show the peak vertical position of the diffracted beam incident on the array as determined from Gaussian fits at each time step.
The linear strain as a function of time can be determined from the peak positions of the time-dependent intensity profile shown in the example illustrated in Figure 3. The contour plots show normalized profiles of the diffracted probe beam incident on the CCD array. The probe beam intensity was tuned to an intensity level that resulted in a peak intensity that was midway between the CCD threshold and saturation intensity limits. The diffraction angle as a function of time is first determined from the peak position and the experimental dimensions. The grating period is calculated using Equation (3) and the strain follows as Δ L / L 0 .
A straightforward model connecting the time dependence of the local strain to the thermalization of the absorbed pump power through the local PDMS temperature is afforded by the heat kernel. For a localized heat impulse Q being delivered at time t and at x = 0 , we expect the temperature field
T ( x , t ) = β Q t γ e x 2 4 D t
where γ is a positive exponent that depends on the effective (spatial) dimensionality of the heat flow field and β and D are constants depending on the assumed isotropic thermal conductivity and heat capacity. Linearity of the heat flow equations allows us to build up the effect of a continuously constant supplied heating over a two-dimensional variegated spatial distribution by adding the individual effects up in the Green’s function methodology, to arrive at
T ¯ ( t ) = β d 2 x d 2 x 0 t d t P ( t ) ( t t ) γ e ( x x ) 2 4 D ( t t ) Y ( x , x ) .
here T ¯ ( t ) represents a probe spot-averaged temperature and Y ( x , x ) is a function that represents the spatial overlap between the pump and probe. In the case where the geometry of the pump and probe spots are fixed but not well characterized, we cannot rigorously compute the above integral; however, on physical grounds, the spatial part of the integrations is expected to remove the temporal singularity in the exponent γ . Thus, T ¯ ( t ) becomes a non-singular monotonic function of time when the shutter is opened, i.e., when P ( t ) = P 0 H t t on with P 0 being a constant, H being the Heaviside step function, and t on corresponding to the time at which the shutter is opened. Realizing the spatial variability of the exponential function in the integrand dominates its behavior, we expect
Δ L L α L T ¯ ( t ) α L β P 0 H t t on 1 + f ( t ) e a 2 4 D ( t t on ) ,
where a is a fixed length scale associated with the size and relative positions of both the pump and probe beams. When f ( t ) < < 1 , the resultant equation appears as the temperature measured at some point a distance away from a single point source of heat, which reduces to
Δ L L α L β P 0 H t t on e a 2 4 D ( t t on ) .
To further test the accuracy of our model and determine the fit parameters, we also recorded the strain after the pump beam was blocked. Assuming that f ( t ) is negligible during both illumination and dark periods, there are three shared fit parameters ( t on , t off , and a 2 / 4 D ) for a toggled pump beam that follows a “barrier” function, P t = P 0 H t t on H t t off , where t off occurs at the time in which the shutter is closed. Under the above approximations, the time-dependent strain function is of the form
Δ L L α L β P 0 H t t on e a 2 4 D t t on H t t off e a 2 4 D t t off .
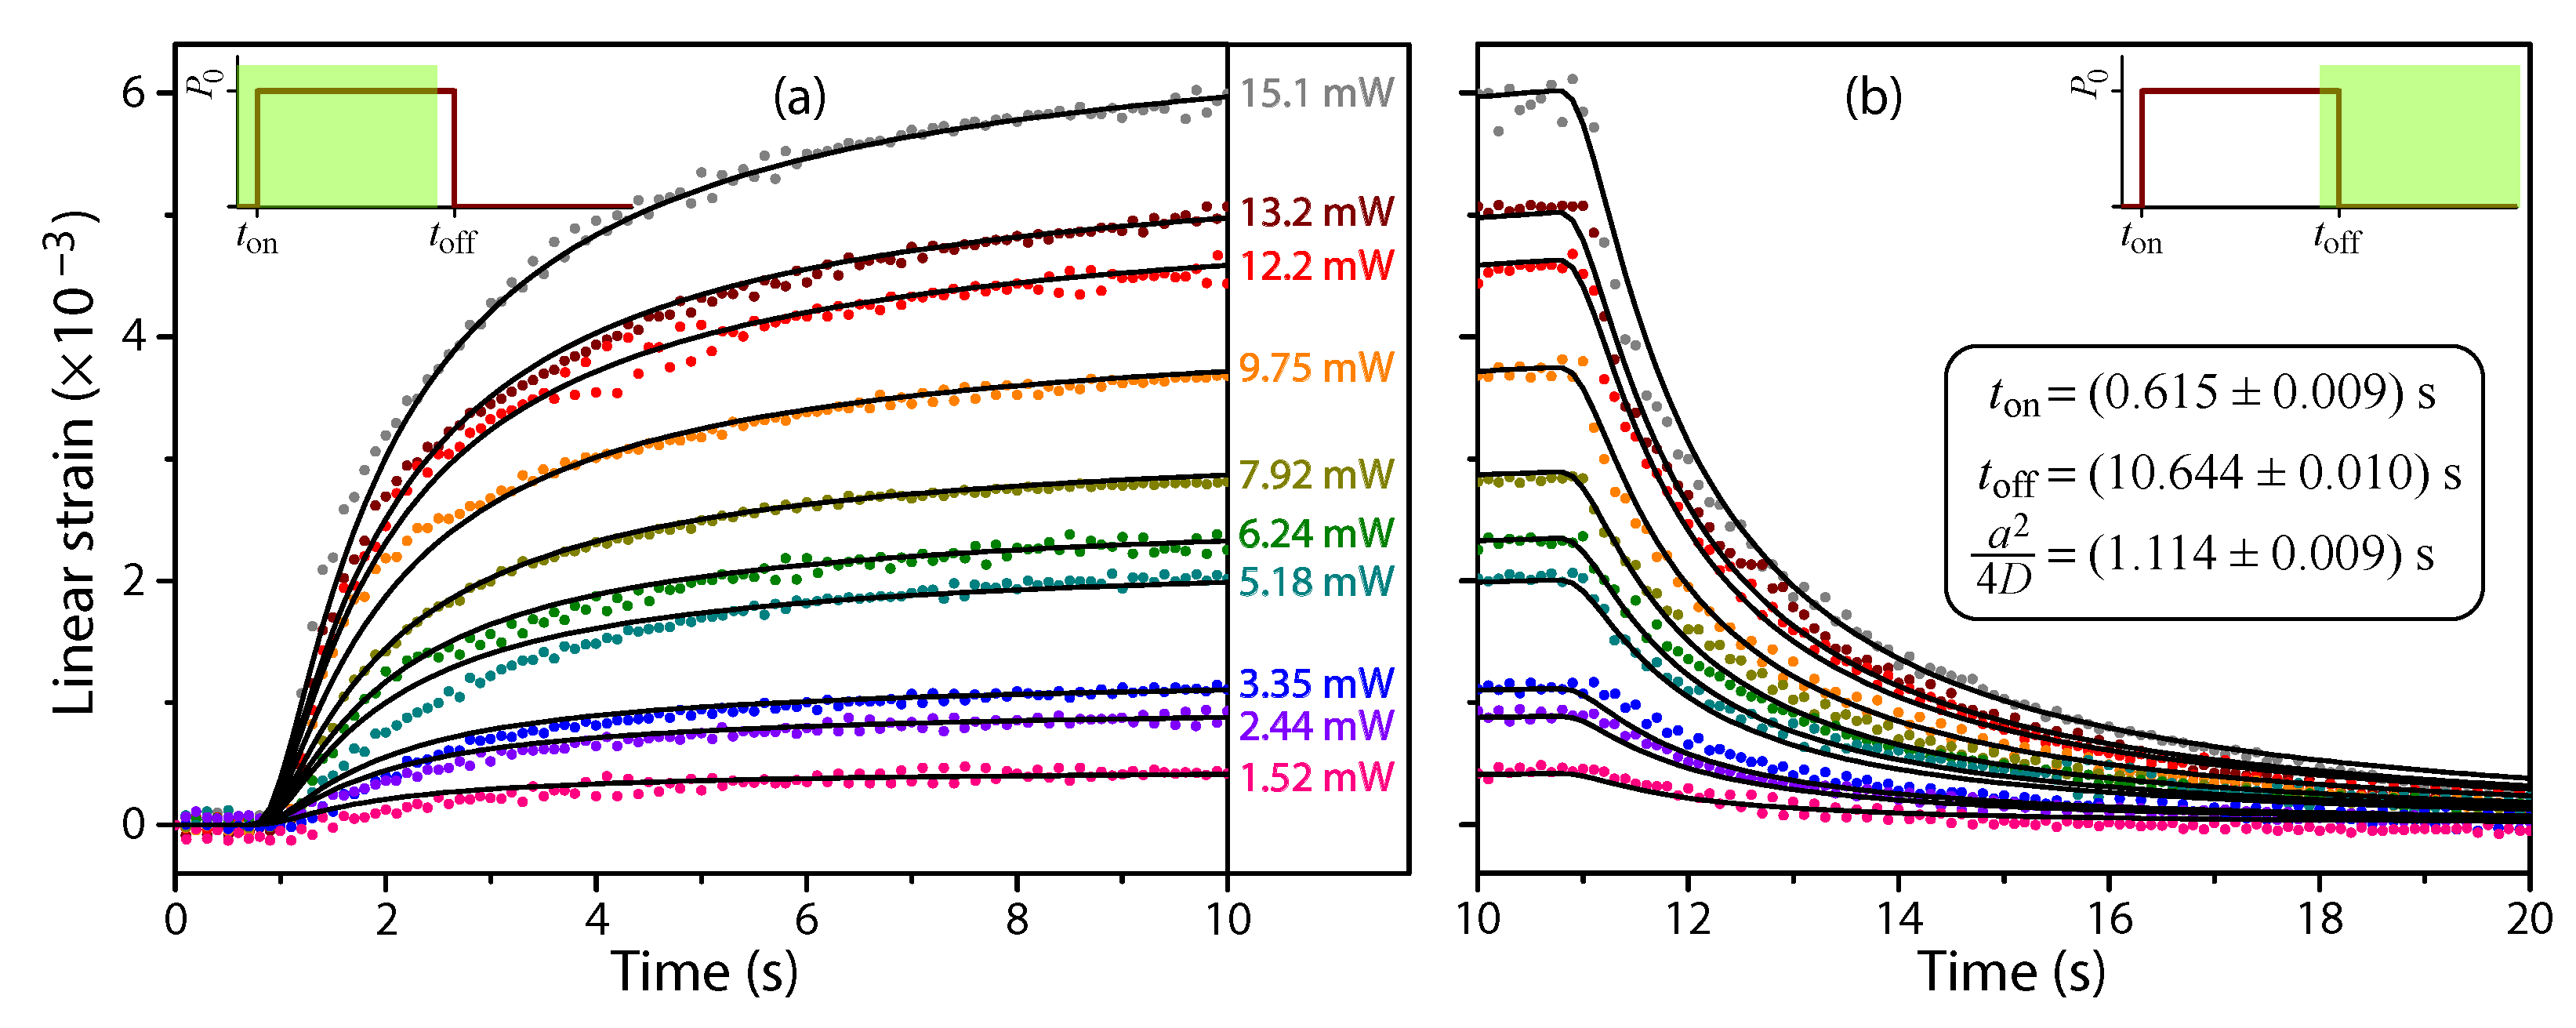
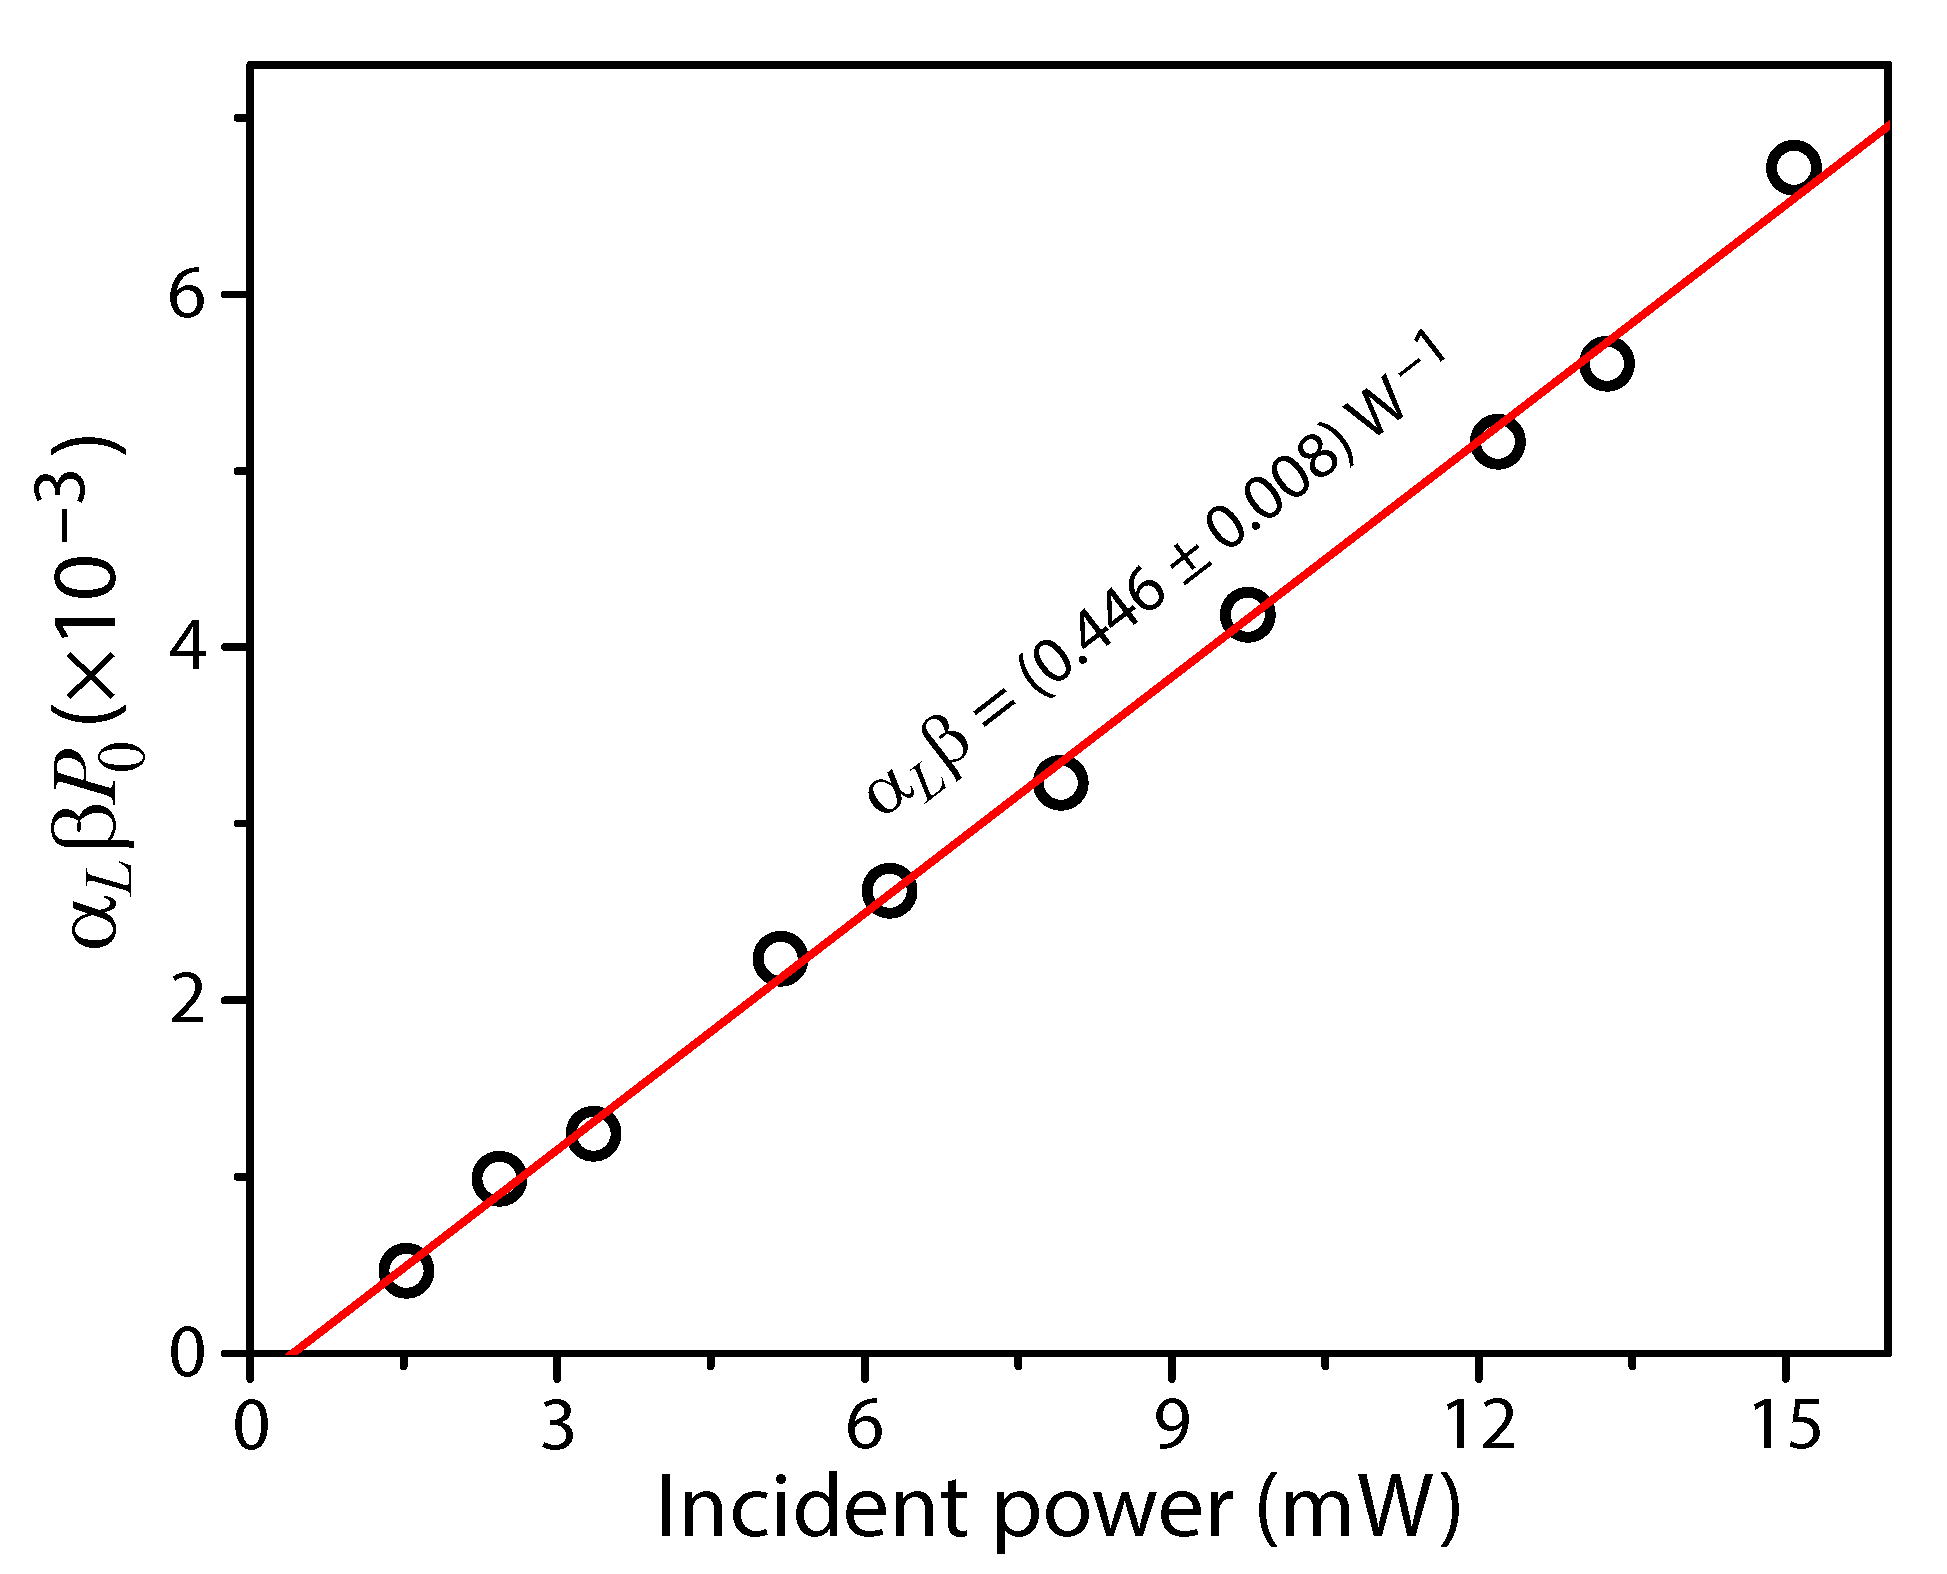
Equation (9) leads to fit parameters that are determined within a few percent. The fitted curves plotted against the experimental data are shown in Figure 4. The measured α L β P 0 values plotted against the measured optical pump power are shown in Figure 5, where the maximum strain at t is given by α L β P 0 . A slope of α L β = ( 0.446 ± 0.008 ) W 1 was determined from linear regression. Dividing this slope by the experimentally determined value for α L and using a linear approximation to propagate the uncertainty, it follows that β = 1.30 ± 0.06 C/mW.

4. Discussion

The coefficient of thermal expansion was determined by transmitting a 650 nm laser beam through a dye-doped PDMS film with an embossed diffraction grating on the back. The strain depends linearly on the temperature of the sample which allows for the linear coefficient of thermal expansion to be determined within a < 5 % uncertainty. Although this measurement was used to determine the β parameter for the proposed thermal model of a transparent sample doped with oil red O, the results indicate that any transparent elastomer cured on a form with a surface relief grating, or a thermoplastic embossed with a grating, could have its linear coefficient of thermal expansion measured with the reported method. Furthermore, the method could easily be expanded to opaque materials by placing the grating on the same side as the incident probe beam to create a reflective surface grating. Furthermore, placing the probe beam on the opposite side of the pump beam would allow for a more compact experiment or enclosed device design. In such a geometry, an inorganic dye could be doped in PDMS, or another material with a large photomechanical strain, to make a CW laser power sensor that is both (i) based on the photomechanical effect and (ii) resistant to photobleaching. For transmission-based power sensors with the probe and pump beam on the same side, self-healing chromophore/polymer pairs could be implemented to increase longevity [104,105,106,107,108]. The versatility of this method for determining a linear coefficient of thermal expansion and the ability for micron sized samples that have grating periods in the hundreds of nanometers makes it useful for determining coefficients of low volume materials that are either high in cost to procure or low in yield to produce. A well-characterized sample could also be used as a thermometer, similar to the PDMS-clad fiber Bragg grating temperature sensor developed by Park et al. [109].
This proposed model for a pump laser power sensor works satisfactorily because the strain was linearly correlated with the pump power referenced by a photodiode detector. A single, passive rate parameter a 2 / 4 D was found to fit the data for all experimental pump powers. The model does suffer from deviations with experimental values at short time-scales immediately after the shutter was actuated. In fact, pump flash measurements of the shutter times in the each automated experiment confirm that the physical open and close times of the shutter relative to the beginning of each data run are at ( 1.00 ± 0.05 ) s and ( 11.00 ± 0.05 ) s. These experimental values are about 300– 400 ms greater than the values for t on and t off fitted by our model. The reasons for the deviations in shutter times follow from the assumptions that (1) the heat source is a point source in a two-dimensional plane with the temperature measured at an adjacent point on the plane point near it (i.e., f ( t ) is not negligible at small time scales), (2) the absorption of the pump is uniform through the thin film while also absorbing most of the intensity, and (3) the two-dimensional plane is perfectly insulated from the three-dimensional environment. The second assumption is only true for low absorption films, where high absorption films will inherently suffer from slow diffusion constants when surface absorption dominates. The first assumption requires a well-focused beam to make a better approximation while the last assumption admits a Green’s function for a two-dimensional heat equation that does not include loss to the environment. The two-dimensional heat equation can obviously be reformulated to contain a loss term that is linearly dependent on the local temperature, which would follow a Robin-type boundary condition for a disk in three dimensions. The simplicity of solution for a two-dimensional Green’s function without loss at the boundary and the idealness of the fits at long time-scales allows the current model to be used for real-time power measurements in devices with current microprocessor capabilities.
The method for measuring laser power via the photomechanical effect presented in this paper is well-suited for device applications. If the diffraction pattern is placed on the same side as the probe beam to create a reflected diffraction beam, then an enclosure can be designed with a port exposing a PDMS sample doped with an opaque dye. The linear CCD array that collected position data is the same type of electronic sensor found in most portable spectrometers, which are commonly used in optical experiments. Thus, a portable spectrometer could be designed to have a second port devoted to laser power measurements and use the same electronic sensor. Because Gaussian fitting along the linear CCD array requires so little memory and processing, cheap, low-power microprocessors can easily determine each gaussian peak in real time making this method viable for portable devices.
For the experimentalist on a budget, the long and precise linear CCD array used in this study could be swapped out for the two-dimensional CCD array in a camera with the lens removed. The range of the adapted power sensor design would be decreased; however, alignment between the direction of the one-dimensional grating and the orientation of the linear CCD array’s long axis would no longer be required.
Additional analysis of the temperature profile over a large film’s area, which is not exposed to the pump beam, is necessary for a user-friendly device. Materials or additives that significantly increase the thermal diffusivity will be necessary to create a laser power sensor with a large exposure surface. On the other hand, thin films of materials with a small thermal diffusivity could be used to map a pump beam’s intensity profile by scanning over the film surface with a small probe laser. Finally, there will be a level of intensity at which the maximum strain varies nonlinear with the pump intensity; however we were only able to achieve a maximum of 15.2 mW of pump power after filtering the 1064 nm fundamental wavelength out of the 532 nm pump beam with a KG-1 filter. A higher power pump beam is required to determine the intensity level at which nonlinear processes occur for the Oil Red O-doped PDMS material used in this study.

5. Conclusions

A dye-doped PDMS film was cured over a polycarbonate substrate with a surface relief grating. A method of determining the linear coefficient of thermal expansion was demonstrated by heating the sample and detecting the angular shift of the first-order diffraction beam with a linear CCD array. The manufacturer reported value for the linear coefficient of thermal expansion of undoped PDMS was within the uncertainty of our measurement. Previous studies have shown that a diffraction pattern can be embossed on the surface of thermoplastics under conditions of elevated temperature and pressure [110,111,112], which increases the library of materials that can be studied with this method.
The increase in grating period from photothermal heating by a pump beam was detected from small changes in the diffraction angle of a probe beam. The change in grating period was found to depend linearly on the pump power, and thereby allowing the method to be easily made into a power sensor. Furthermore, the laser power sensor can be integrated into a portable spectrometer with the same linear CCD array. The experimental dimensions used in this study resulted in a ∼1 mW sensitivity and a resolution of a few percent. The power detection range for sensors based on this method could be adjusted by changing the arm length, even through mirrored reflections, of the diffracted probe beam.

Author Contributions

Conceptualization, N.J.D. and M.C.; methodology, N.J.D. and M.C.; software, N.J.D. and F.S.; validation, F.S., R.T.S., M.C. and N.J.D.; formal analysis, N.J.D., M.C. and F.S.; investigation, F.S., R.T.S., M.C. and N.J.D.; resources, N.J.D. and M.C.; data curation, N.J.D.; writing—original draft preparation, N.J.D., M.C. and F.S.; writing—review and editing, F.S., R.T.S., M.C. and N.J.D.; visualization, F.S., R.T.S., M.C. and N.J.D.; supervision, N.J.D. and M.C.; project administration, N.J.D.; funding acquisition, N.J.D. All authors have read and agreed to the published version of the manuscript.

Funding

This research was funded in part by the Hawaii Pacific University, College of Natural and Computational Sciences, Scholarly Endeavors Program.

Institutional Review Board Statement

Not applicable.

Informed Consent Statement

Not applicable.

Data Availability Statement

Data produced by this work is available at https://doi.org/10.17632/4c2whwytgg.1 (accessed on 18 October 2022).

Acknowledgments

N.D. thanks the educational science laboratory staff (Pat Allen, Pansa Cecchini, Heidi Cutia, Christian Marin, Heidi Reiter, and Sierra Rose) for helping with supplies and use of small equipment.

Conflicts of Interest

The authors declare no conflict of interest.

Sample Availability

Samples of the Oil Red O-doped PDMS material used in this study are available from N.J.D.

Abbreviations

The following abbreviations are used in this manuscript:
CCDCharge coupled device
DVDDigital video disc
PDMSPolydimethylsiloxane
CWContinuous wave
AFMAtomic force microscope

References

  1. Putley, E. Chapter 6 The Pyroelectric Detector. In Infrared Detectors; Willardson, R., Beer, A.C., Eds.; Semiconductors and Semimetals; Elsevier: Amsterdam, The Netherlands, 1970; Volume 5, pp. 259–285. [Google Scholar] [CrossRef]
  2. Lachambre, J.L. A Pyroelectric Energy Meter. Rev. Sci. Instrum. 1971, 42, 74–77. [Google Scholar] [CrossRef]
  3. Touayar, O.; Sifi, N.; Ktari, T.; Bastié, J. Experimental evaluation of a pyroelectric detector linearity used for pulsed laser energy absolute measurement. Sens. Actuator A Phys. 2005, 120, 482–489. [Google Scholar] [CrossRef]
  4. Sakurai, K.; Mitsuhashi, Y.; Honda, T. A Laser Microcalorimeter. IEEE Trans. Instrum. Meas. 1967, 16, 212–219. [Google Scholar] [CrossRef]
  5. Gunn, S.R. Calorimetric measurements of laser energy and power. J. Phys. E Sci. Instr. 1973, 6, 105–114. [Google Scholar] [CrossRef]
  6. Kodato, S.; Naito, Y.; Kuroda, K.; Kodama, S. A high-accuracy quick-response optical power sensor with μc-Ge:H thin film. Sens. Actuator A Phys. 1991, 28, 63–68. [Google Scholar]
  7. Kuroda, K.; Kodato, S. Quick response, high accuracy standard optical power meter. In Proceedings of the IECON ’91: 1991 International Conference on Industrial Electronics, Control and Instrumentation, Kobe, Japan, 28 October–1 November 1991; Volume 3, pp. 2433–2438. [Google Scholar]
  8. Schiel, E.; Bolmarcich, J. Absolute measurement of GaAs diodes radiation using solar cells. Proc. IEEE 1963, 51, 1780–1781. [Google Scholar] [CrossRef]
  9. Deb, S.; Mukherjee, M. Measurement of radiant power output with a solar cell. IEEE J. Quantum Electron. 1965, 1, 219–220. [Google Scholar] [CrossRef]
  10. Schinke, D.P.; Smith, R.G.; Hartman, A.R. Photodetectors. In Semiconductor Devices for Optical Communication; Kressel, H., Ed.; Springer: Berlin/Heidelberg, Germany, 1982; pp. 63–87. [Google Scholar] [CrossRef]
  11. Thorlabs, Inc. Product Specification Sheet: FDS010 Photodiode. 2010. Available online: https://datasheetspdf.com/pdf-file/1310902/Thorlabs/FDS010/1 (accessed on 12 October 2022).
  12. Thorlabs, Inc. FGA10 InGaAs Photodiode. 1997. Available online: https://datasheetspdf.com/pdf-file/1310910/Thorlabs/FGA10/1 (accessed on 12 October 2022).
  13. White, T.J. Photomechanical Materials, Composites, and Systems: Wireless Transduction of Light into Work; John Wiley & Sons: Hoboken, NJ, USA, 2017. [Google Scholar]
  14. Sekkat, Z. Enhancement of molecular mobility in solid polymers by light: Fundamentals and applications. Appl. Phys. B Lasers Opt. 2022, 128, 19. [Google Scholar] [CrossRef]
  15. Uchino, K.; Aizawa, M. Photostrictive Actuator Using PLZT Ceramics. Jpn. J. Appl. Phys. 1985, 24, 139–141. [Google Scholar] [CrossRef]
  16. Uchino, K. Photostrictive Actuators Based on Piezoelectrics. In Advanced Piezoelectric Materials—Science and Technology, 2nd ed.; Elsevier: Amsterdam, The Netherlands, 2017; pp. 755–785. [Google Scholar]
  17. Warner, M.; Terentjev, E.M. Liquid Crystal Elastomers; Oxford University Press: Oxford, UK, 2005. [Google Scholar]
  18. Saed, M.O.; Torbati, A.H.; Nair, D.P.; Yakacki, C.M. Synthesis of Programmable Main-chain Liquid-crystalline Elastomers Using a Two-stage Thiol-acrylate Reaction. J. Vis. Exp. 2016, 107, e53546. [Google Scholar] [CrossRef] [Green Version]
  19. Marshall, J.E.; Terentjev, E.M. Photo-sensitivity of dye-doped liquid crystal elastomers. Soft Mater. 2013, 9, 8547–8551. [Google Scholar] [CrossRef]
  20. Garcia-Amorós, J.; Martínez, M.; Finkelmann, H.; Velasco, D. Photoactuation and thermal isomerisation mechanism of cyanoazobenzene-based liquid crystal elastomers. Phys. Chem. Chem. Phys. 2014, 16, 8448–8454. [Google Scholar] [CrossRef]
  21. Lahikainen, M.; Kuntze, K.; Zeng, H.; Helantera, S.; Hecht, S.; Priimagi, A. Tunable Photomechanics in Diarylethene-Driven Liquid Crystal Network Actuators. ACS Appl. Mater. Interfaces 2020, 12, 47939–47947. [Google Scholar] [CrossRef] [PubMed]
  22. Sun, J.; Wang, F.; Zhang, H.; Liu, K. Azobenzene-Based Photomechanical Biomaterials. Adv. NanoBiomed Res. 2021, 1, 2100020. [Google Scholar] [CrossRef]
  23. Wei, Z.; Bai, R. Temperature-modulated photomechanical actuation of photoactive liquid crystal elastomers. Extrem. Mech. Lett. 2022, 51, 101614. [Google Scholar] [CrossRef]
  24. Corbett, D.; Warner, M. Linear and nonlinear photoinduced deformations of cantilevers. Phys. Rev. Lett. 2007, 99, 174302. [Google Scholar] [CrossRef]
  25. Corbett, D.; Warner, M. Changing liquid crystal elastomer ordering with light—A route to opto-mechanically responsive materials. Liq. Cryst. 2009, 36, 1263–1280. [Google Scholar] [CrossRef]
  26. Ube, T.; Ikeda, T. Cross-Linked Liquid-Crystalline Polymers as Photomobile Materials. In Mechanically Responsive Materials for Soft Robotics; Wiley-VCH Verlag GmbH & Co. KGaA: Weinheim, Germany, 2020; pp. 209–232. [Google Scholar]
  27. Grabowski, P.; Haberko, J.; Wasylczyk, P. Photo-Mechanical Response Dynamics of Liquid Crystal Elastomer Linear Actuators. Materials 2020, 13, 2933. [Google Scholar] [CrossRef]
  28. Bai, R.; Bhattacharya, K. Photomechanical coupling in photoactive nematic elastomers. J. Mech. Phys. Solids 2020, 144, 104115. [Google Scholar] [CrossRef]
  29. Wang, D.H.; Lee, K.M.; Yu, Z.; Koerner, H.; Vaia, R.A.; White, T.J.; Tan, L.S. Photomechanical Response of Glassy Azobenzene Polyimide Networks. Macromolecules 2011, 44, 3840–3846. [Google Scholar] [CrossRef]
  30. He, L.H. Deformation of amorphous azobenzene-containing polymer films induced by polarized light. Acta Mech. Sin. 2012, 28, 1203–1208. [Google Scholar] [CrossRef]
  31. Wang, D.H.; Lee, K.M.; Koerner, H.; Yu, Z.; Vaia, R.A.; White, T.J.; Tan, L.S. Flexural-Torsional Photomechanical Responses in Azobenzene-Containing Crosslinked Polyimides. Macromol. Mater. Eng. 2012, 297, 1167–1174. [Google Scholar] [CrossRef]
  32. Hosono, N.; Yoshikawa, M.; Furukawa, H.; Totani, K.; Yamada, K.; Watanabe, T.; Horie, K. Photoinduced Deformation of Rigid Azobenzene-Containing Polymer Networks. Macromolecules 2013, 46, 1017–1026. [Google Scholar] [CrossRef]
  33. Wang, D.H.; Wie, J.J.; Lee, K.M.; White, T.J.; Tan, L.S. Impact of Backbone Rigidity on the Photomechanical Response of Glassy, Azobenzene-Functionalized Polyimides. Macromolecules 2014, 47, 659–667. [Google Scholar] [CrossRef]
  34. Wen, H.; Zhang, W.; Weng, Y.; Hu, Z. Photomechanical bending of linear azobenzene polymer. RSC Adv. 2014, 4, 11776–11781. [Google Scholar] [CrossRef]
  35. Toccafondi, C.; Occhi, L.; Cavalleri, O.; Penco, A.; Castagna, R.; Bianco, A.; Bertarelli, C.; Comoretto, D.; Canepa, M. Photochromic and photomechanical responses of an amorphous diarylethene-based polymer: A spectroscopic ellipsometry investigation of ultrathin films. J. Mater. Chem. C 2014, 2, 4692–4698. [Google Scholar] [CrossRef] [Green Version]
  36. Kondo, M. Photomechanical materials driven by photoisomerization or photodimerization. Polym. J. 2020, 52, 1027–1034. [Google Scholar] [CrossRef]
  37. Loomis, J.; King, B.; Burkhead, T.; Xu, P.; Bessler, N.; Terentjev, E.; Panchapakesan, B. Graphene-nanoplatelet-based photomechanical actuators. Nanotechnology 2012, 23, 045501. [Google Scholar] [CrossRef] [Green Version]
  38. Ansari, S.; Rahima, C.; Muralidharan, M.N. Photomechanical Characteristics of Thermally Reduced Graphene Oxide-Polydimethylsiloxane Nanocomposites. Polym. Plast. Technol. Eng. 2013, 52, 1604–1610. [Google Scholar] [CrossRef]
  39. Sánchez-Arévalo, F.M.; Garnica-Palafox, I.M.; Jagdale, P.; Hernández-Cordero, J.; Rodil, S.E.; Okonkwo, A.O.; Hernandez, F.C.R.; Tagliaferro, A. Photomechanical response of composites based on PDMS and carbon soot nanoparticles under IR laser irradiation. Opt. Mater. Express 2015, 5, 1792–1805. [Google Scholar] [CrossRef]
  40. Hiremath, S.; Kulkarni, S.M. Photomechanical actuation of polydimethylsiloxane/carbon black nanocomposite. Micro Nano Lett. 2020, 15, 437–440. [Google Scholar] [CrossRef]
  41. López-Lugo, J.D.; Pimentel-Domínguez, R.; Benítez-Martínez, J.A.; Hernández-Cordero, J.; Vélez-Cordero, J.R.; Sánchez-Arévalo, F.M. Photomechanical Polymer Nanocomposites for Drug Delivery Devices. Molecules 2021, 26, 5376. [Google Scholar] [CrossRef]
  42. Ghorbanishiadeh, Z.; Zhou, B.; Sheibani Karkhaneh, M.; Oehler, R.; Kuzyk, M.G. Photothermal and Reorientational Contributions to the Photomechanical Response of DR1 Azo Dye-Doped PMMA Fibers. Appl. Sci. 2021, 12, 315. [Google Scholar] [CrossRef]
  43. Dawson, N.J.; Kuzyk, M.G.; Neal, J.; Luchette, P.; Palffy-Muhoray, P. Experimental Studies of the Mechanisms of Photomechanical Effects in a Nematic Liquid Crystal Elastomer. J. Opt. Soc. Am. B 2011, 28, 1916–1921. [Google Scholar] [CrossRef] [Green Version]
  44. Dawson, N.J.; Kuzyk, M.G.; Neal, J.; Luchette, P.; Palffy-Muhoray, P. Modeling the mechanisms of the photomechanical response of a nematic liquid crystal elastomer. J. Opt. Soc. Am. B 2011, 28, 2134–2141. [Google Scholar] [CrossRef] [Green Version]
  45. Wu, Z.; Cheng, P.; Zhao, W.; Fang, J.; Xu, T.; Chen, D. Allyl sulfide-based visible light-induced dynamically reshaped liquid crystalline elastomer/SWCNT nanocomposites capable of multimode NIR photomechanical actuations. New J. Chem. 2020, 44, 10902–10910. [Google Scholar] [CrossRef]
  46. Dannis, M.L. Thermal expansion measurements and transition temperatures, first and second order. J. Appl. Polym. Sci. 1959, 1, 121–126. [Google Scholar] [CrossRef]
  47. Drebushchak, V.A. Thermal expansion of solids: Review on theories. J. Therm. Anal. Calorim. 2020, 142, 1097–1113. [Google Scholar] [CrossRef]
  48. Ye, X.; Kuzyk, M.G. Photomechanical response of disperse red 1 azobenzene dye-doped PMMA polymer fiber. Opt. Commun. 2014, 312, 210–215. [Google Scholar] [CrossRef]
  49. Bhuyan, A. Mechanism of the Photomechanical Response in Composite Polymeric Materials. Ph.D. Thesis, Washington State University, Pullman, WA, USA, 2020. [Google Scholar]
  50. Hu, J.; Wang, W.; Yu, H. Endowing Soft Photo-Actuators with Intelligence. Adv. Intell. Syst. 2019, 1, 1900050. [Google Scholar] [CrossRef] [Green Version]
  51. Kuzyk, M.G.; Dawson, N.J. Photomechanical materials and applications: A tutorial. Adv. Opt. Photonics 2020, 12, 847–1011. [Google Scholar] [CrossRef]
  52. Zhuo, Z.; Lin, J.; Li, J.; Wu, S.; Hu, W.; Gong, J. Research progress of mechanically flexible molecular crystals: From bending mechanisms to applications. Chem. Eng. J. 2022, 450, 138333. [Google Scholar] [CrossRef]
  53. Welker, D.J.; Kuzyk, M.G. Optical and Mechanical Multistability in a Dye-Doped Polymer Fiber Fabry-Perot Waveguide. Appl. Phys. Lett. 1995, 66, 2792–2794. [Google Scholar] [CrossRef]
  54. Welker, D.J.; Kuzyk, M.G. All-optical switching in a dye-doped polymer fiber Fabry-Perot waveguide. Appl. Phys. Lett. 1996, 69, 1835–1836. [Google Scholar] [CrossRef]
  55. Welker, D.J.; Kuzyk, M.G. Suppressing Vibrations in a Sheet with a Fabry-Perot Photomechanical Device. Opt. Lett. 1997, 22, 417–418. [Google Scholar] [CrossRef]
  56. Kuzyk, M.G.; Garvey, D.W.; Vigil, S.R.; Welker, D.J. All-optical devices in polymer optical fiber. Chem. Phys. 1999, 245, 533–544. [Google Scholar] [CrossRef]
  57. Bian, S.; Robinson, D.; Kuzyk, M.G. Optically activated cantilever using photomechanical effects in dye-doped polymer fibers. J. Opt. Soc. Am. B 2006, 23, 697–708. [Google Scholar] [CrossRef] [Green Version]
  58. Wang, E.; Desai, M.S.; Lee, S.W. Light-Controlled Graphene-Elastin Composite Hydrogel Actuators. Nano Lett. 2013, 13, 2826–2830. [Google Scholar] [CrossRef] [Green Version]
  59. Zhao, J.; Xu, P.; Yu, Y.; Li, K. Controllable vibration of liquid crystal elastomer beams under periodic illumination. Int. J. Mech. Sci. 2020, 170, 105366. [Google Scholar] [CrossRef]
  60. Liu, H.; Niu, D.; Jiang, W.; Zhao, T.; Lei, B.; Yin, L.; Shi, Y.; Chen, B.; Lu, B. Illumination-oriented and thickness-dependent photomechanical bilayer actuators realized by graphene-nanoplatelets. Sensor. Actuat. A Phys. 2016, 239, 45–53. [Google Scholar] [CrossRef]
  61. Niu, D.; Jiang, W.; Liu, H.; Zhao, T.; Lei, B.; Li, Y.; Yin, L.; Shi, Y.; Chen, B.; Lu, B. Reversible Bending Behaviors of Photomechanical Soft Actuators Based on Graphene Nanocomposites. Sci. Rep. 2016, 6, 27366. [Google Scholar] [CrossRef] [Green Version]
  62. Zhou, Y.; Hauser, A.W.; Bende, N.P.; Kuzyk, M.G.; Hayward, R.C. Waveguiding Microactuators Based on a Photothermally Responsive Nanocomposite Hydrogel. Adv. Funct. Mater. 2016, 26, 5447–5452. [Google Scholar] [CrossRef]
  63. Leeladhar; Raturi, P.; Kumar, A.; Singh, J.P. Graphene-polydimethylsiloxane/chromium bilayer-based flexible, reversible, and large bendable photomechanical actuators. Smart Mater. Struct. 2017, 26, 095030. [Google Scholar] [CrossRef]
  64. Leeladhar; Singh, J.P. Human skin-inspired multiresponsive actuators based on graphene oxide/polydimethylsiloxane bilayer film: Bi-directional transformation of semi-tube into plane sheet/tube under different stimuli. Smart Mater. Struct. 2020, 29, 75022. [Google Scholar] [CrossRef]
  65. Wang, J.; Huang, S.; Zhang, Y.; Liu, J.; Yu, M.; Yu, H. Hydrogen Bond Enhances Photomechanical Swing of Liquid-Crystalline Polymer Bilayer Films. ACS Appl. Mater. Interfaces 2021, 13, 6585–6596. [Google Scholar] [CrossRef]
  66. Satapathy, P.; Adiga, R.; Kumar, M.; Hegde, G.; Prasad, S.K. Porous nanocarbon particles drive large magnitude and fast photomechanical actuators. J. Nanostruct. Chem. 2022, 12, 235–248. [Google Scholar] [CrossRef]
  67. Kim, T.; Zhu, L.; Al-Kaysi, R.O.; Bardeen, C.J. Organic Photomechanical Materials. ChemPhysChem 2014, 15, 400–414. [Google Scholar] [CrossRef]
  68. Zhou, B.; Yan, D. Recent advances of dynamic molecular crystals with light-triggered macro-movements. Appl. Phys. Rev. 2021, 8, 041310. [Google Scholar] [CrossRef]
  69. Camacho-Lopez, M.; Finkelmann, H.; Palffy-Muhoray, P.; Shelley, M. Fast liquid-crystal elastomer swims into the dark. Nat. Mater. 2004, 3, 307–310. [Google Scholar] [CrossRef]
  70. Ma, S.; Li, X.; Huang, S.; Hu, J.; Yu, H. A Light-Activated Polymer Composite Enables On-Demand Photocontrolled Motion: Transportation at the Liquid/Air Interface. Angew. Chem. (Int. Ed.) 2019, 58, 2655–2659. [Google Scholar] [CrossRef]
  71. Song, T.; Lei, H.; Clancy, A.J.; Ma, S.; Yu, H.; Zhang, L. Supramolecular hydrogen bond enables Kapton nanofibers to reinforce liquid-crystalline polymers for light-fueled flight. Nano Energy 2021, 87, 106207. [Google Scholar] [CrossRef]
  72. Uchino, K. Ceramic Actuators: Principles and Applications. MRS Bull. April 1993, 29, 42. [Google Scholar] [CrossRef]
  73. Mu, J.; Hou, C.; Wang, H.; Li, Y.; Zhang, Q.; Zhu, M. Origami-inspired active graphene-based paper for programmable instant self-folding walking devices. Sci. Adv. 2015, 1, e1500533. [Google Scholar] [CrossRef] [PubMed] [Green Version]
  74. Yu, L.; Yu, H. Light-powered tumbler movement of graphene oxide/polymer nanocomposites. ACS Appl. Mater. Interfaces 2015, 7, 3834–3839. [Google Scholar] [CrossRef]
  75. Gelebart, A.H.; Jan Mulder, D.; Varga, M.; Konya, A.; Vantomme, G.; Meijer, E.W.; Selinger, R.L.B.; Broer, D.J. Making waves in a photoactive polymer film. Nature 2017, 546, 632–636. [Google Scholar] [CrossRef] [PubMed] [Green Version]
  76. Norikane, Y.; Saito, K. Crawling Motion of Crystals on Solid Surfaces by Photo-induced Reversible Crystal-to-Melt Phase Transition. In Mechanically Responsive Materials for Soft Robotics; Wiley-VCH Verlag GmbH & Co. KGaA: Weinheim, Germany, 2020; pp. 83–103. [Google Scholar]
  77. Dradrach, K.; Rogóż, M.; Grabowski, P.; Xuan, C.; Wȩgłowski, R.; Konieczkowska, J.; Schab-Balcerzak, E.; Piecek, W.; Wasylczyk, P. Traveling Wave Rotary Micromotor Based on a Photomechanical Response in Liquid Crystal Polymer Networks. ACS Appl. Mater. Interfaces 2020, 12, 8681–8686. [Google Scholar] [CrossRef] [PubMed]
  78. Uǧur, G.; Chang, J.; Xiang, S.; Lin, L.; Lu, J. A Near-Infrared Mechano Responsive Polymer System. Adv. Mater. 2012, 24, 2685–2690. [Google Scholar] [CrossRef] [PubMed]
  79. Wie, J.J.; Wang, D.H.; Tondiglia, V.P.; Tabiryan, N.V.; Vergara-Toloza, R.O.; Tan, L.S.; White, T.J. Photopiezoelectric Composites of Azobenzene-Functionalized Polyimides and Polyvinylidene Fluoride. Macromol. Rapid Commun. 2014, 35, 2050–2056. [Google Scholar] [CrossRef] [PubMed]
  80. Tang, R.; Liu, Z.; Xu, D.; Liu, J.; Yu, L.; Yu, H. Optical Pendulum Generator Based on Photomechanical Liquid-Crystalline Actuators. ACS Appl. Mater. Interfaces 2015, 7, 8393–8397. [Google Scholar] [CrossRef] [PubMed]
  81. Wei, W.; Gao, J.; Yang, J.; Wei, J.; Guo, J. A NIR light-triggered pyroelectric-dominated generator based on a liquid crystal elastomer composite actuator for photoelectric conversion and self-powered sensing. RSC Adv. 2018, 8, 40856–40865. [Google Scholar] [CrossRef] [Green Version]
  82. Xiong, Y.; Zhang, L.; Weis, P.; Naumov, P.; Wu, S. A solar actuator based on hydrogen-bonded azopolymers for electricity generation. J. Mater. Chem. A 2018, 6, 3361–3366. [Google Scholar] [CrossRef] [Green Version]
  83. Zhao, D.; Liu, Y. Photomechanical vibration energy harvesting based on liquid crystal elastomer cantilever. Smart Mater. Struct. 2019, 28, 075017. [Google Scholar] [CrossRef]
  84. Mejia, J.C.; Aizawa, M.; Hisano, K.; Matsumoto, K.; Hashimoto, S.; Kubo, S.; Shishido, A. Surface Topographical Control of a Liquid Crystal Microlens Array Embedded in a Polymer Network. Appl. Sci. 2022, 12, 7901. [Google Scholar] [CrossRef]
  85. Wani, O.M.; Zeng, H.; Priimagi, A. A light-driven artificial flytrap. Nat. Commun. 2017, 8, 15546. [Google Scholar] [CrossRef] [PubMed] [Green Version]
  86. Hu, J.; Li, X.; Ni, Y.; Ma, S.; Yu, H. A programmable and biomimetic photo-actuator: A composite of a photo-liquefiable azobenzene derivative and commercial plastic film. J. Mater. Chem. C 2018, 6, 10815–10821. [Google Scholar] [CrossRef]
  87. Li, X.; Ma, S.; Hu, J.; Ni, Y.; Lin, Z.; Yu, H. Photo-activated bimorph composites of Kapton and liquid-crystalline polymer towards biomimetic circadian rhythms of Albizia julibrissin leaves. J. Mater. Chem. C 2019, 7, 622–629. [Google Scholar] [CrossRef]
  88. Luo, P.; Xiang, S.; Li, C.; Zhu, M. Photomechanical polymer hydrogels based on molecular photoswitches. J. Polym. Sci. 2021, 59, 2246–2264. [Google Scholar] [CrossRef]
  89. Zhu, C.; Qin, L.; Lu, Y.; Sun, J.; Yu, Y. Photomechanical Liquid Crystal Polymers and Bioinspired Soft Actuators. In Mechanically Responsive Materials for Soft Robotics; John Wiley & Sons, Ltd.: Hoboken, NJ, USA, 2020; Chapter 9; pp. 233–256. [Google Scholar] [CrossRef]
  90. Bell, A.G. On the Production and Reproduction of Sound by Light. Proc. Am. Assoc. Adv. Sci. 1881, 29, 115–136. [Google Scholar] [CrossRef]
  91. Dawson, N.J.; Kuzyk, M.G.; Neal, J.; Luchette, P.; Palffy-Muhoray, P. Cascading of liquid crystal elastomer photomechanical optical devices. Opt. Commun. 2011, 284, 991–993. [Google Scholar] [CrossRef] [Green Version]
  92. Dawson, N.J.; Kuzyk, M.G.; Neal, J.; Luchette, P.; Palffy-Muhoray, P. Integration of liquid crystal elastomer photomechanical optical devices. In Proceedings of the Liquid Crystals XVI, San Diego, CA, USA, 12–16 August 2012; Volume 8475, pp. 41–48. [Google Scholar] [CrossRef]
  93. Kuenstler, A.S.; Kim, H.; Hayward, R.C. Liquid Crystal Elastomer Waveguide Actuators. Adv. Mater. 2019, 31, 1901216. [Google Scholar] [CrossRef]
  94. Zhao, D.; Liu, Y. Programmable liquid crystal elastomer matrix through photomechanical responses. J. Appl. Polym. Sci. 2020, 137, 48997. [Google Scholar] [CrossRef]
  95. Niu, D.; Jiang, W.; Li, D.; Ye, G.; Luo, F.; Liu, H. Reconfigurable shape-morphing flexible surfaces realized by individually addressable photoactuator arrays. Smart Mater. Struct. 2021, 30, 125032. [Google Scholar] [CrossRef]
  96. Fang, L.; Zhang, H.; Li, Z.; Zhang, Y.; Zhang, Y.; Zhang, H. Synthesis of Reactive Azobenzene Main-Chain Liquid Crystalline Polymers via Michael Addition Polymerization and Photomechanical Effects of Their Supramolecular Hydrogen-Bonded Fibers. Macromolecules 2013, 46, 7650–7660. [Google Scholar] [CrossRef]
  97. Wie, J.J.; Wang, D.H.; Lee, K.M.; White, T.J.; Tan, L.S. The contribution of hydrogen bonding to the photomechanical response of azobenzene-functionalized polyamides. J. Mater. Chem. C 2018, 6, 5964–5974. [Google Scholar] [CrossRef]
  98. Min Lee, K.; Lynch, B.M.; Luchette, P.; White, T.J. Photomechanical effects in liquid crystal polymer networks prepared with m-fluoroazobenzene. J. Polym. Sci. Part A Polym. Chem. 2014, 52, 876–882. [Google Scholar] [CrossRef]
  99. Kim, J.H.; Jang, K.L.; Ahn, K.; Yoon, T.; Lee, T.I.; Kim, T.S. Thermal expansion behavior of thin films expanding freely on water surface. Sci. Rep. 2019, 9, 7071. [Google Scholar] [CrossRef] [PubMed] [Green Version]
  100. Zou, C.; Lin, L.Y. Grating-patterned Perovskite Light Emitting Diodes for Enhanced Performance. In Proceedings of the CLEO. Optica Publishing Group, San Jose, CA, USA, 5–10 May 2019; p. JTu2A.113. [Google Scholar] [CrossRef]
  101. Li, G.; Qin, J.; Wang, Y.; Wu, Y.; Li, M.; Chen, J. Microscale gratings patterned in perovskite films to promote the electron-optical conversion efficiency of perovskite light-emitting diodes. Appl. Opt. 2022, 61, 35–40. [Google Scholar] [CrossRef] [PubMed]
  102. Toshiba. Data Sheet: TCD1501C. 1997. Available online: https://pdf1.alldatasheet.com/datasheet-pdf/view/32203/TOSHIBA/TCD1501C.html (accessed on 3 October 2022).
  103. The Dow Chemical Company. Technical Data Sheet: SYLGARD 184 Silicone Elastomer. 2017. Available online: https://pdf1.alldatasheet.com/datasheet-pdf/view/1425043/ETC/SYLGARD-184.html (accessed on 3 October 2022).
  104. Anderson, B.R.; Hung, S.T.; Kuzyk, M.G. Imaging studies of temperature dependent photodegradation and self-healing in disperse orange 11 dye-doped polymers. J. Chem. Phys. 2016, 145, 024901. [Google Scholar] [CrossRef] [PubMed]
  105. Stubbs, N.; Bridgewater, M.; Stubbs, M.; Kabir, A.; Crescimanno, M.; Kuzyk, M.G.; Dawson, N.J. Polylactic acid promotes healing of photodegraded disperse orange 11 molecules. Opt. Mater. 2018, 76, 11–15. [Google Scholar] [CrossRef]
  106. Christianson, N.D.; Lu, Y.; Dawson, N.J. Recovery of photodegraded rhodamine 6g in ester-containing polymer matrices. Photochem. Photobiol. Sci. 2019, 18, 2865–2874. [Google Scholar] [CrossRef]
  107. Anderson, B.R.; Kuzyk, M.G. Imaging studies of photodegradation and self-healing in anthraquinone derivative dye-doped PMMA. Phys. Chem. Chem. Phys. 2020, 22, 28154–28164. [Google Scholar] [CrossRef] [PubMed]
  108. Lu, Y.; Lowther, Z.; Christianson, N.D.; Li, Z.; Baer, E.; Kuzyk, M.G.; Dawson, N.J. Demonstration of a self-healing all-polymer distributed Bragg reflector laser. Appl. Phys. Lett. 2020, 116, 103301. [Google Scholar] [CrossRef]
  109. Park, C.S.; Joo, K.I.; Kang, S.W.; Kim, H.R. A PDMS-Coated Optical Fiber Bragg Grating Sensor for Enhancing Temperature Sensitivity. J. Opt. Soc. Korea 2011, 15, 329–334. [Google Scholar] [CrossRef] [Green Version]
  110. Schift, H.; Heyderman, L.J.; Maur, M.A.d.; Gobrecht, J. Pattern formation in hot embossing of thin polymer films. Nanotechnology 2001, 12, 173–177. [Google Scholar] [CrossRef]
  111. Ponelyte, S.; Prosycevas, I.; Guobiene, A.; Balciunas, R.; Puiso, J. Formation of MEMS nanocomposit layers and investigation of their mechanical properties. Mechanika 2009, 2, 77–82. [Google Scholar]
  112. Song, Z.; Qian, M.; Zhang, H.; Wang, T.; Ding, G.; Liu, J. The fabrication and molecular alignment of poly(ethylene oxide) grating film based on hot embossing technology. New J. Chem. 2019, 43, 16604–16611. [Google Scholar] [CrossRef]
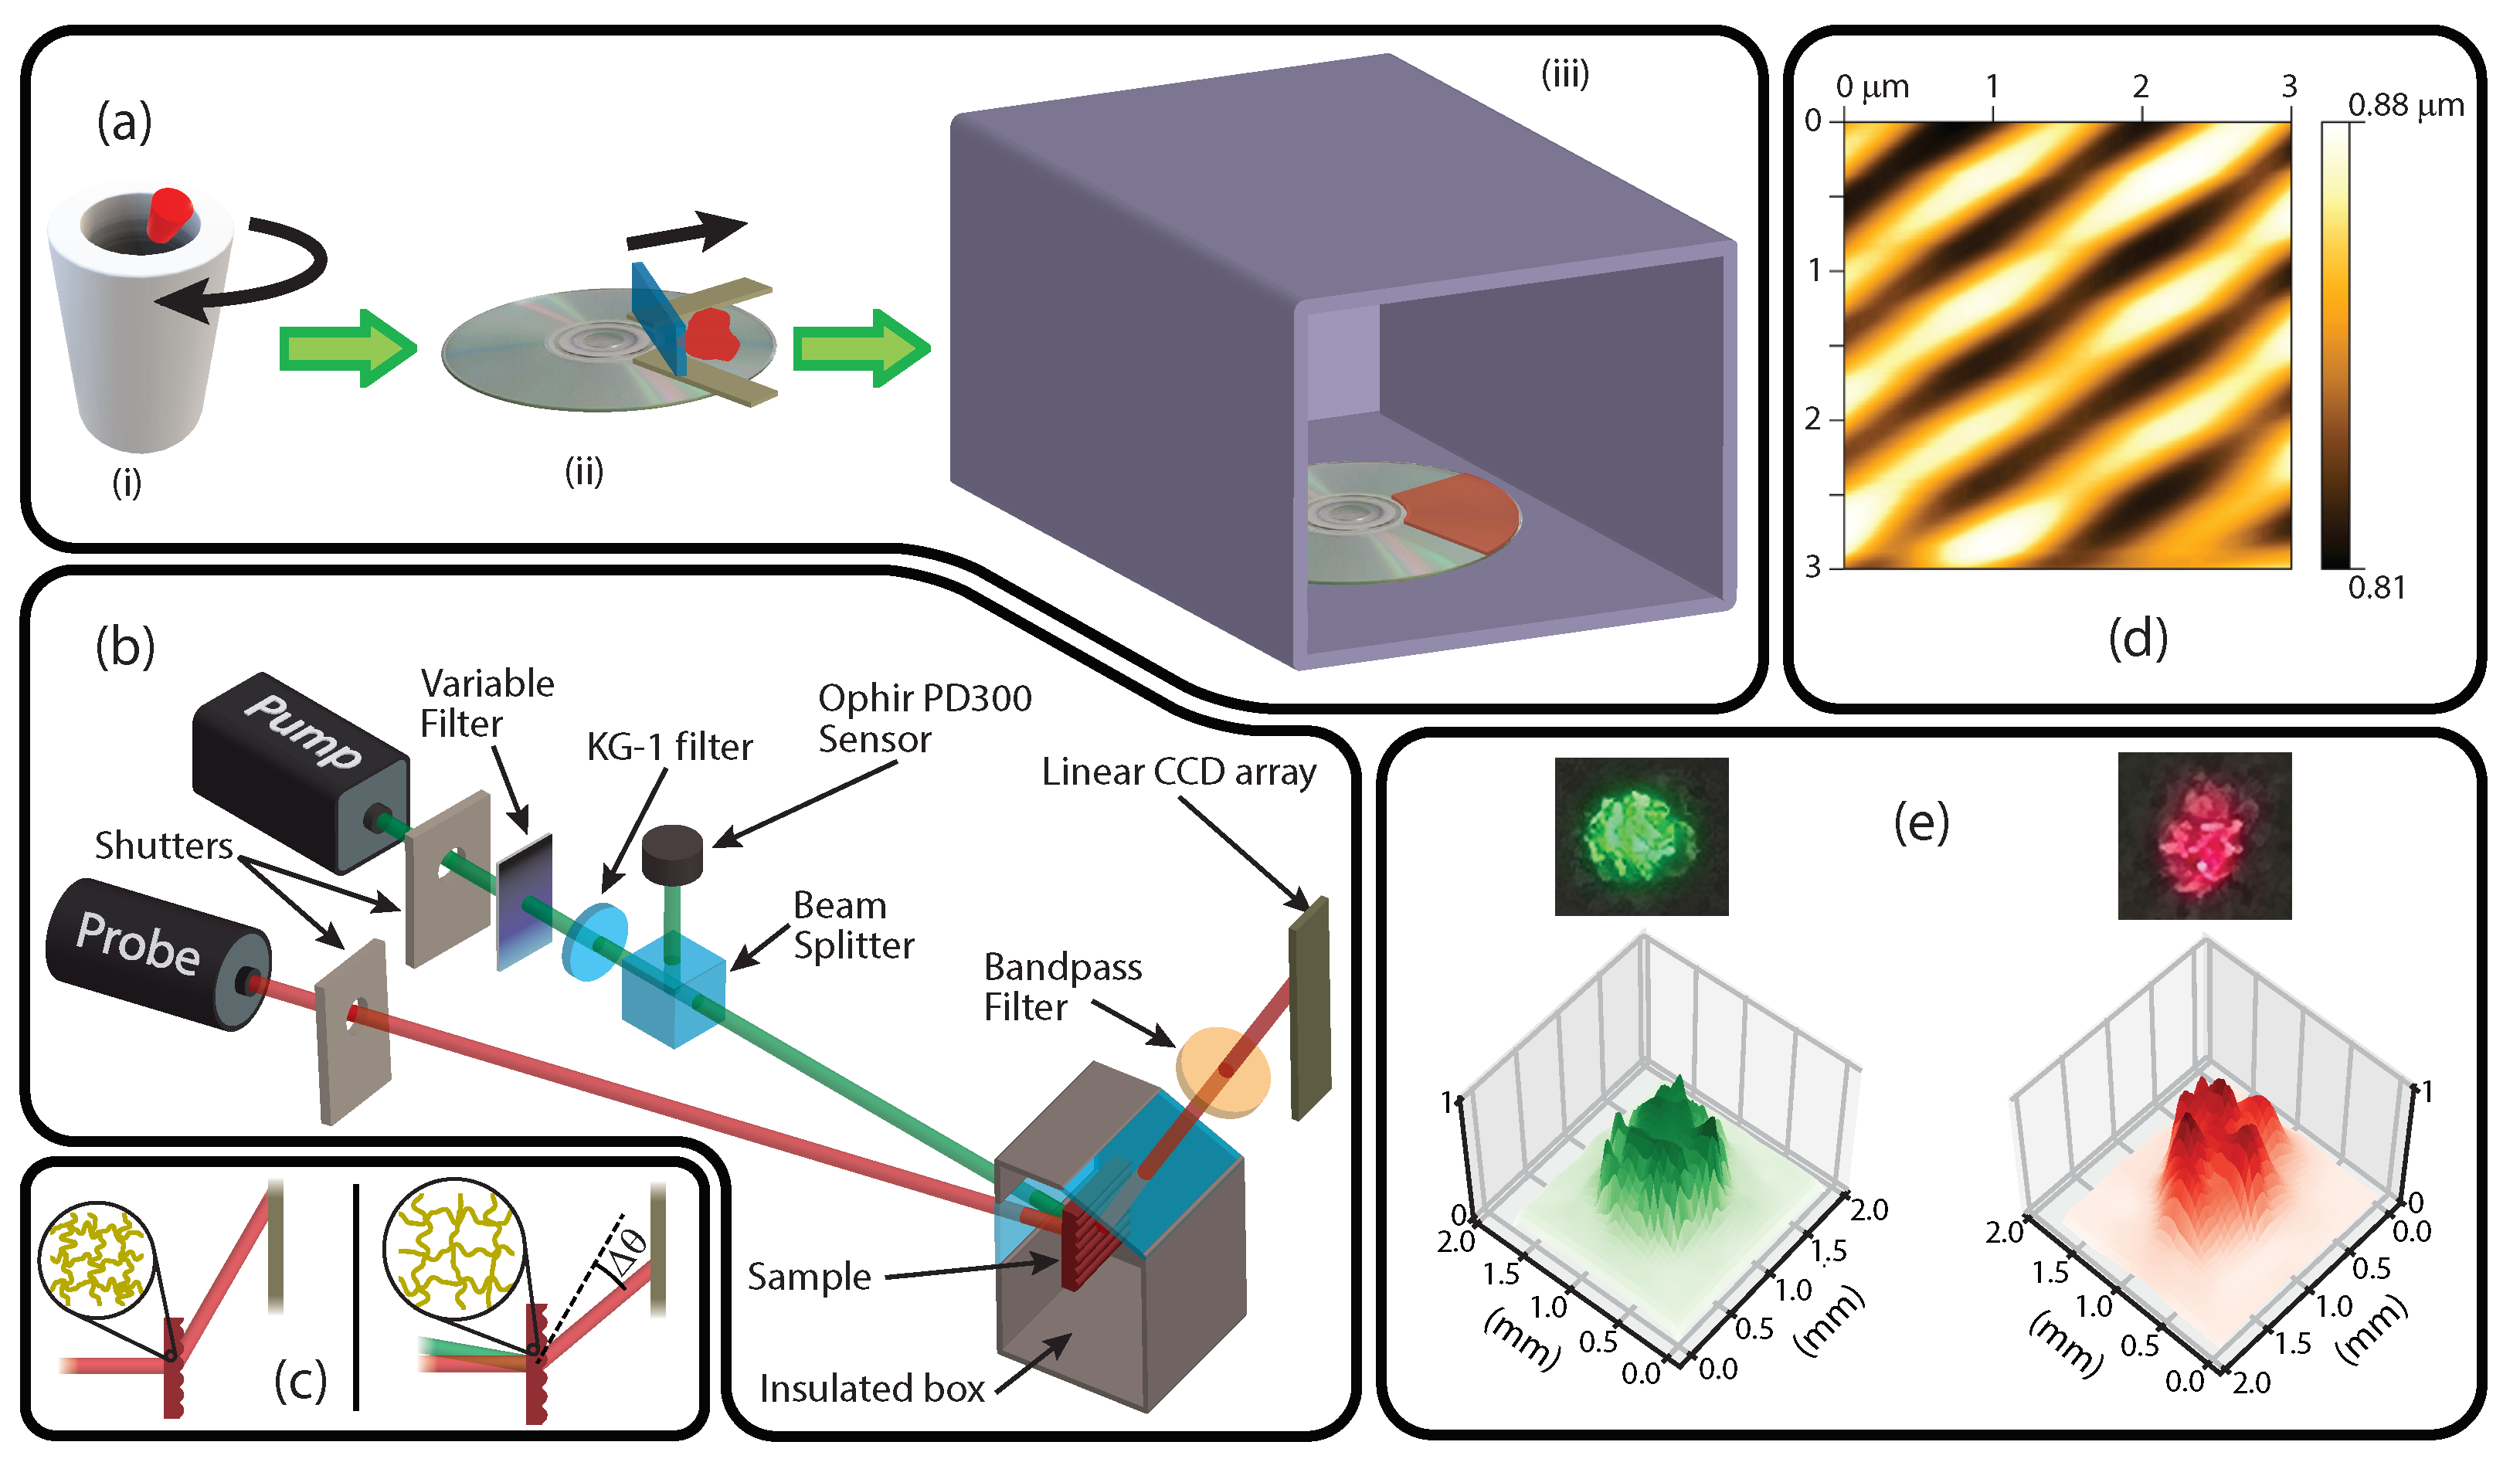
Figure 1. (a) Illustrated steps for fabricating the dye-doped PDMS sample including (i) mixing and centrifuging under vacuum, (ii) pouring between guides and blade coating, and (iii) placing in an oven to cure. (b) The optical experiment with a probe beam for measuring the coefficient of thermal expansion as well as the pump laser power. (c) Illustration of an elastomer expanding via photothermal heating, where the stretched diffraction grating causes the diffracted probe beam’s angle to decrease. (d) An AFM image of the grating structure on the surface of the PDMS sample. (e) The beam profiles incident at the sample plane for the pump and probe lasers.
Applsci 12 10708 g001
Figure 2. (a) The solid lines show the intensity profile of the n = + 1 diffracted beam incident on the surface of the linear CCD array. Gaussian fits to both experimental intensity profiles are given by the dashed lines. (b) A straight line was fitted to the linear strain as a function of temperature. The strain was determined from the change in the diffraction beam’s angle shown in the lower left inset. The upper right inset shows the peak position of the Gaussian fits as a function of temperature used to determine the angle of the diffraction beam.
Applsci 12 10708 g002
Figure 3. (a) A contour plot of the normalized diffraction beam profile incident on the linear CCD array as a function of time when a 15.1 mW, 532 nm pump laser is incident on the sample. The color bar on the right side of the graphs is given from 0 to 1 because the data was normalized (and not because of detector saturation). The inset shows the strain as a function of time calculated from the change in peak position of the diffracted probe beam determined from Gaussian fits. (b) A second contour plot showing the diffracted beam returning to its initial position on the linear CCD array when the pump beam is blocked.
Applsci 12 10708 g003
Figure 4. Plots of the strain as a function of time for many values of the pump laser power P 0 . The solid lines are fitted to the entire data set for all pump powers and during both the illumination and dark periods. The fitted lines all share the same values for t on , t off , and a 2 / 4 D . The insets illustrate the square pump pulse with the two boxed regions showing the period of data collection when the shutter is (a) opened and (b) closed.
Applsci 12 10708 g004
Figure 5. The dimensionless amplitude of the model α L β P 0 shows a linear dependence with the incident pump power referenced by a calibrated Ophir PD300 photodiode detector.
Applsci 12 10708 g005
Publisher’s Note: MDPI stays neutral with regard to jurisdictional claims in published maps and institutional affiliations.