Article

Statistical and Comparative Analysis of Multi-Channel Infrared Anomalies before Earthquakes in China and the Surrounding Area

1
Key Laboratory of Infrared System Detection and Imaging Technology, Shanghai Institute of Technical Physics, Chinese Academy of Sciences, Shanghai 200083, China
2
University of Chinese Academy of Sciences, Beijing 100049, China
*
Author to whom correspondence should be addressed.
Appl. Sci. 2022, 12(16), 7958; https://doi.org/10.3390/app12167958
Submission received: 8 July 2022 / Revised: 2 August 2022 / Accepted: 5 August 2022 / Published: 9 August 2022

Abstract

:
Abundant infrared remote sensing images and advanced information processing technologies are used to predict earthquakes. However, most studies only use single long-wave infrared data or its products, and the accuracy of prediction is not high enough. To solve this problem, this paper proposes a statistical method based on connected domain recognition to analyze multi-channel anomalies. We extract pre-seismic anomalies from multi-channel infrared remote sensing images using the relative power spectrum, then calculate positive predictive values, true positive rates and probability gains in different channels. The results show that the probability gain of the single-channel prediction method is extremely low. The positive predictive value of four-channel anomalies is 41.94%, which is higher than that of single-channel anomalies with the same distance threshold of 200 km. The probability gain of the multi-channel method is 2.38, while that of the single-channel method using the data of any channel is no more than 1.26. This study shows the advantages of the multi-channel method to predict earthquakes and indicates that it is feasible to use multi-channel infrared remote sensing images to improve the accuracy of earthquake prediction.

1. Introduction

Earthquake prediction is a complex and challenging theme. Since scientists discovered pre-seismic infrared abnormal phenomena in the 1980s [1], scholars around the world have undertaken various relevant research. Qiang et al. put forward a relatively reasonable theoretical mechanism, which indicates that the main causes of the abnormal temperature increase before the earthquake are gases released from the earth’s crust and the change of the electric field, based on various observations and experiments [2]. The change of water content in the earth’s surface soils is also able to cause infrared anomalies before earthquakes [3]. Some experiments proved that the infrared radiation of the rock changes when it is pressed by stress [4]. Their studies provide theoretical support for the development of earthquake prediction using infrared radiation data.
Infrared remote sensing images have a definite advantage of wide-field and continuous observation over ground-based observation and are widely applied to earthquake prediction [5,6,7,8]. Most researchers only analyzed single-type data, mainly using long-wave infrared radiation or its products, such as land surface temperature (LST) and outgoing long-wave radiation (OLR) [9,10,11]. In some case studies, the pre-seismic infrared anomaly is discovered from remote sensing images as a common phenomenon [12,13,14]. There are only a few studies about the middle-wave infrared anomalies before earthquakes, whose trend is similar to the anomalies in the long-wave channel [5,15]. Other earthquake case studies found that there are abnormal changes in water vapor content in the atmosphere before and after the event [16,17]. Most infrared data used to predict earthquakes are from NOAA satellites, Terra/Aqua satellites and Fengyun satellites [18,19]. Wei et al. found the infrared anomalies before the Ms8.0 earthquake in Sichuan, China, using single-channel images from the FY-2C satellite [20]. Ouzounov et al. found the anomalies before several strong earthquakes in Xinjiang, China, using OLR data from NOAA satellites and the FY-2D satellite [21]. Zhong et al. found the infrared anomaly associated with the 2017 M6.5 Jiuzhaigou earthquake from the data of two Fengyun satellites (FY-2E and FY-2G) [22].
Researchers have proposed different methods that were successfully used to extract pre-seismic anomalies, such as robust satellite techniques [23], interquartile, wavelet transform, Kalman filter methods [24], power spectrum [25] and some artificial intelligent methods [26]. Although abundant remote sensing data and advanced information processing technologies are used to predict earthquakes, there has not been any stable and valid algorithm to eliminate the influence of non-seismic factors, such as seasonal changes, weather conditions and human activities [18]. This is because of the complexity and variability of the earth system and the space environment. As a result, most methods merely work well in a few cases, lacking statistical evidence. Some statistical results in a small region show that there is an infrared anomaly before most earthquakes, but they did not analyze the proportion of the anomalies followed by an earthquake. In a study of 20 earthquakes in the Tibet region, the anomalies of the brightness temperature appeared before 17 earthquakes, and that of long-wave radiation appeared before 16 earthquakes [27]. The accuracy of earthquake prediction is unable to be estimated without PPV. Some statistical studies show a low positive predictive value (PPV). The statistical results based on the robust satellite techniques indicate the true positive rate (TPR) is high but the PPV of pre-seismic infrared anomalies, which is 25.9% in Sichuan province, is too low to put into practice [28]. The accuracy of earthquake prediction in the statistics by Jiao and Shan is 6.01% [29]. The PPV calculated by Filizzola et al. is 7.61% [23]. This means that most prediction results are wrong. Some studies do not even support the feasibility of earthquake prediction based on infrared remote sensing data [30]. Although some researchers obtained the PPV of 76.1% and the TPR of 67.1%, the spatiotemporal occupation of anomalies is high at 43.4%, which may cause a large prediction range and excessive public panic [31].
To explore a more valid algorithm for earthquake prediction using the data of infrared remote sensing, both data and research methods are improved. For one thing, multi-channel infrared images are used in this paper, and the four channels could provide more information about the state of the earth’s surface and atmosphere. For another thing, the statistical method based on connected region recognition is proposed to analyze the correlation between infrared anomalies and earthquakes, which could recognize spatiotemporal characteristics of anomalies in the long-term and wide-region studies. In this paper, the relative power spectrum method is respectively used to extract the anomalies from data of every channel. Both statistical analysis and case study are used to compare the prediction performance of the data from any single channel. Finally, four-channel anomalies are analyzed statistically. The results show that multi-channel anomalies could provide larger PPV and probability gain. It proves the potential of multi-channel infrared data in earthquake prediction and shows that it is possible to identify anomalies associated with earthquakes using multi-dimensional or multi-source data. The statistical method based on connected region recognition could be used to analyze pre-seismic anomalies from most kinds of remote sensing data. It lays the foundation for more data to be used in earthquake prediction.

2. Materials and Methods

The full research method is shown in Figure 1. Section 2.1 introduces the data and research range (time and region). The wavelet decomposition and relative power spectrum are used to extract anomalies from the time series on every pixel, which is detailed in Section 2.2. Then, the statistical method based on connected region recognition is proposed to analyze the correlation between anomalies and earthquakes, which is detailed in Section 2.3.

2.1. Data and Study Area

Feng Yun-2G is the fifth operational satellite of the first generation of geostationary meteorological satellites launched by China on 31 December 2014, which can observe the parameters of the earth’s surface and atmosphere widely and continuously. The main remote sensor is the visible and infrared spin scanning radiometer with 5 channels, including one visible channel (VIS), one medium-wave infrared channel (IR4), one water vapor channel (IR3) and two long-wave infrared channels (IR1 and IR2). The detailed parameters of each channel are shown in Table 1.
In this paper, the original data are the images from four infrared channels of the Feng Yun-2G satellite, which are provided by the National Satellite Meteorological Center. (http://satellite.nsmc.org.cn/PortalSite/Data/Satellite.aspx, accessed on 25 June 2022). One full-disk data file is generated every half hour or one hour. The file structure is shown in Figure 2, including file attributes and scientific datasets. Every file includes the geographic location of the image center, cloud classification, five-channel images and calibration tables and is saved as the hierarchical data format (HDF). The red digits are the number of the datasets, while the white digits are the size of one dataset. Moreover, the center also provides a lookup table so that the users could calculate the longitude and latitude of every pixel in the image.
Due to the high transmittance of the earth’s atmosphere in the atmospheric windows, the radiation value from two long wave channels and one middle wave channel mainly depends on the temperature and the emissivity of the earth’s surface. The emissivity of the same target is usually constant. The peak wavelength of most objects on the earth’s surface is in the long-wave infrared channel, so the brightness temperature data from the long-wave infrared channel could show the temperature change trend of most objects on the earth’s surface [32]. The data from the medium-wave infrared channel show the temperature change of the high-temperature targets and are affected by the reflection of solar radiation in the daytime, so data at night are selected in this paper. The water vapor channel is in the strong absorption band of water vapor, which is one of the main infrared absorption gases in the earth’s atmosphere [33].
China is located between the Pacific seismic zone and Euro–Asia seismic zone, so earthquakes happen frequently there, especially in Qinghai–Tibet Plateau, Yunnan–Guizhou Plateau and Taiwan. In China, the terrain is high in the west and low in the east, as shown in Figure 3. The lines in different colors are the different types of plate boundaries. The topography data are provided by the University of Califonia San Diego. (http://topex.ucsd.edu/marine_topo/mar_topo.html, accessed on 23 July 2022). China has a wide territory and rich soil resources, mainly including 15 types of soil. The variation of water content in the soil during the earthquake preparation period may also lead to anomalies in infrared remote sensing images [3]. The study area of this paper is between 0° N to 60° N and 70° E to 140° E, including China and the surrounding area. All images in this region from June 2015 to December 2020 are applied to extract abnormal signals. There are 358 earthquakes with a magnitude over five in the area from 31 January 2016 to 1 January 2021. The strongest earthquake in the study range was the earthquake with a magnitude of 7.3 that happened in Kyushu, Japan on 16 April 2016. According to the theoretical model proposed by Dobrovolsky, the relationship between the radius of earthquake preparation region R and the earthquake magnitude M is shown in Equation (1) [34].
R = 100.43M,
The earthquake magnitude in this study is between 5 and 7.3, so the radius of the influenced region varies from 141 to 1377 km.

2.2. Anomaly Extraction

The relative power spectrum is a common method to extract seismic information from infrared remote sensing images and is used in some case studies with significant results. The process is shown in Figure 4 and was programmed using Python in the Spyder platform. The algorithm is introduced in detail as follows [35,36]:
(1)
Pre-processing: We could not gather complete earth surface radiation data because of cloud coverage and the limitation of the remote sensing system. Some pre-processing is necessary before extracting anomalies. Infrared radiation could not go through clouds, so the infrared images in the region covered by clouds reveal the temperature of the top of the clouds, which is far lower than that of the earth’s surface. After obtaining brightness temperatures by the look-up table method, we remove the invalid values that are 1.5-times the standard deviation below the average to decrease the effect of clouds [27]. Then, the average temperature every day is calculated. Finally, the spatiotemporal data become continuous through the nearest-neighbor interpolation method.
(2)
Wavelet decomposition: The infrared radiation on the earth’s surface is also affected by seasonal changes, weather conditions, geological activities, human activities, and so on. High-frequency information and low-frequency information are separated by wavelet decomposition and wavelet reconstruction. The low-pass part of seventh-order wavelet decomposition retains long-period information and is regarded as the background field. The low-pass part of second-order wavelet decomposition eliminates high-frequency information and is used to attenuate the influence of weather and human factors. The low-pass part of the second-order wavelet decomposition is subtracted by that of the seventh-order wavelet decomposition to eliminate the background field and high-frequency components.
(3)
Power spectrum: The power spectrum reflects the change of signal power with frequency. We take 64 days as the window length and 1 day as the step length to calculate the time–frequency distribution of the power spectrum in each window [37].
(4)
Characteristic frequency: We calculate the relative amplitude for each pixel and frequency, and select the frequency with the largest amplitude change as the characteristic frequency to obtain the spatiotemporal data of the relative power spectrum at the characteristic frequency.
In this paper, the algorithm is used to process the data from every channel of FY-2G, respectively, to compare the difference between channels and improve prediction performance using multi-channel data.

2.3. Statistical Method

Accuracy of earthquake prediction is the basis of practical application, because wrong predictions may cause serious economic losses and public panic. The PPV of infrared abnormal signals can evaluate the accuracy of its application in earthquake prediction, which is defined as the proportion of abnormal signals related to an earthquake in total anomalies, as shown in Equation (2) [28].
PPV = N 0 N a ,
where N0 is the number of abnormal signals related to an earthquake, and Na is the number of total abnormal signals in the research area. To calculate the PPV, we propose a method based on the connected domain to identify the spatiotemporal occupancy range of abnormal signals. We deem the point where the relative power spectrum is more than five as abnormal. The connected region of abnormal points is regarded as the spatial–temporal range of a single abnormal phenomenon, and abnormal regions with relatively small areas or short-term are ignored to eliminate the infrared radiation increase caused by human activities. In this paper, an anomaly that covers less than 500 pixels or lasts less than 3 days is ignored. In previous studies, anomalies appeared on average one to three weeks before the earthquake [38]. As a result, the anomaly is regarded to be related to the earthquake, if the distance between the abnormal region and the epicenter is less than the distance threshold (Td) and the anomaly appears within one month before the earthquake.
The TPR is the proportion of earthquakes with pre-seismic infrared abnormalities in total earthquakes, which is defined as Equation (3) [28].
TPR = N 1 N e ,
where N1 is the number of earthquakes with any pre-seismic anomaly, and Ne is the number of total earthquakes in the research area. It is used to assess the universality of infrared anomalies before earthquakes.
It provides higher PPV and TPR to increase the distance threshold, but the spatial accuracy of prediction would decrease. Therefore, earthquake prediction needs to predict more earthquakes successfully with lower spatiotemporal occupancy. The probability gain is the ratio of TPR to spatiotemporal occupancy, shown as Equation (4) [39,40]. It can be regarded as a criterion for selecting the optimal distance threshold.
Gain = TPR τ ,
where TPR is the true positive rate, τ is the fraction of space–time occupied by the predicted range, and is associated with the distance threshold. Matlab platform was used for statistical analysis and results display.

3. Results and Discussion

3.1. Channels Comparison

Some previous research found the epicenter of an impending earthquake may be far from the anomaly [41,42,43,44,45], so both the abnormal region and the region around the anomaly should be considered as the predicted region. The possibility that there is any upcoming earthquake in the predicted region is larger if the area of the predicted region is larger. PPVs with different distance thresholds in four channels are calculated and shown in Figure 5. There are a total of 619 anomalies from 2016 to 2020, including 155 in the IR1 channel, 161 in the IR2 channel, 132 in the IR3 channel, and 171 in the IR4 channel. PPVs vary obviously with the change of the distance threshold. The difference between the PPVs in any two channels is less than 0.08 for the same distance threshold. It means that there is not much difference between the PPVs of anomalies from different channels.
Figure 6 shows the TPRs with different distance thresholds in four channels. The TPRs in the two long-wave infrared channels are similar. The TPR in the IR4 channel is the highest among all channels whatever the distance threshold is, while that in the IR1 channel is the lowest. The difference between the TPRs in the IR2 channel and the IR3 channel becomes large with the increase in the distance threshold. The long-wave infrared channels (IR1 and IR2) behave worse on PPV and TPR, although they were earlier used for earthquake prediction.
The infrared anomalies of 358 earthquakes in the study area were analyzed statistically. As shown in Figure 7, the horizontal axis is a four-digit number whose four digits represent the state of four channels (IR1, IR2, IR3, IR4) successively, where 1 means there was an anomaly before the earthquake, and 0 means there was no anomaly before the earthquake. For example, 1111 means there were abnormalities in all four channels. The state of the anomalies in the two long-wave channels is similar. There were only 26 earthquakes with four-channel anomalies within 400 km around the epicenter, and 18 of them were within 200 km.
As shown in Figure 8, the Gain in each channel varies slightly with the distance threshold. The probability gain cannot be improved by changing the distance threshold. The gains in the IR3 channel are highest among those in all four channels for the same distance threshold and only a little higher than that in other channels.

3.2. Case Study

Considering regional differences, three seismic cases in different provinces were taken as examples. Detailed seismic information is shown in Table 2. The magnitude of the Sichuan earthquake was the largest. All three earthquakes occurred at shallow depths.

3.2.1. Sichuan Earthquake

There was a strong earthquake with a magnitude of 7.0 in Sichuan at 21:19:46 on 8 August 2017 (LT). The epicenter was at 103.82° E, 33.20° N. The depth was 20 km. At 07:27:52 on the next day (LT), an earthquake with a magnitude of 6.6 occurred in Xinjiang. The epicenter was at 82.89° E, 44.27° N. The depth was 11 km.
The information on pre-seismic anomalies in different channels is shown in Table 3. In Table 3, the start time and the end time are the numbers of days that the start time and end time of the anomaly relative to the earthquake time. Negative numbers are before the earthquake and positive numbers are after the earthquake. The anomalies of the two long-wave channels appeared 25 days before the earthquake, as shown in Figure 9. On that day, there were discrete high-value points north of the epicenter in the images of the four channels, and the anomaly area of the long-wave infrared channels was larger, so it was identified earlier. As shown in Figure 10, there were high-amplitude and large-area anomalies in four channels on the 19 days before the earthquake. On that day, IR1, IR2 and IR4 obtained their maximum abnormal value. The anomalies were located between the epicenters of the two earthquakes and more close to that of the Sichuan earthquake. Figure 11 shows the largest coverage area of anomalies in the earthquake preparation region. During the abnormal period, the abnormal area of the four channels went through two times of increase and decrease. The abnormal area in the IR3 channel was less than 500 pixels 19 days before the earthquake, while that in the IR4 channel was also too small during the first time of increase and decrease. They are both ignored in Table 3. Anomalies in all channels lasted until 18 days before the earthquake.

3.2.2. Taiwan Earthquake

An earthquake with a magnitude of 5.2 happened in Taiwan on 16 December 2018, 05:21:05 (LT). The location of the epicenter was 23.71° N, 121.80° E, and the focal depth was 26 km. On the same day, an earthquake with a magnitude of 5.7 broke out at 12:46:07 (LT) in Sichuan. The location of the epicenter was 28.24° N, 104.95° E, and the focal depth was 12 km.
As shown in Table 4, the IR3 channel appeared abnormal at first, and anomalies in other channels appeared simultaneously and disappeared simultaneously, which were a little later than that in the IR3 channel. In images from the IR3 channel, a high-value region arose on 6 December 2018, shown in Figure 12. In the IR3 channel image, there was a weak anomaly between the two epicenters. Relatively, there were more obvious anomalies in the high latitude region, but they were far from the two epicenters, which is not significant for the prediction of this earthquake. It became an isolated region on 8 December 2018, while the anomalies in the other three channels just started, as shown in Figure 13. The anomalous positions of the two long-wave channels and the medium-wave channel were close, but the anomaly area of the medium-wave channel was smaller. The anomaly area of the IR3 channel was the largest, and it has obvious location deviation from the other three channels. On 9 December 2018, the anomalies in IR1 and IR3 obtained their maximums, as shown in Figure 14. In the abnormal region of the IR3 channel image, the southern part is closer to the epicenter of Taiwan, in which anomaly intensity was significantly higher than that in the northern part. Similar to the first case, the anomaly occurred between the epicenters of the two earthquakes. The abnormal region was mainly on the land and distributed along the coastline. The epicenter of the Taiwan earthquake was at the edge of the anomaly. The anomaly in the IR3 channel was closest to the epicenter. There was only 1.7 km between the anomaly and the epicenter. The anomalies in four channels all disappeared completely on 12 December 2018. According to Figure 15, the anomalies went through appearance, increase, decrease and disappearance before the earthquake. The anomaly in the IR4 channel intersected with that in other channels, but the distance from the epicenter was far beyond the radius of the earthquake preparation region calculated theoretically.

3.2.3. Tibet Earthquake

Tibet is located on the Qinghai–Tibet Plateau with high altitudes and complex terrain. There was an earthquake with a magnitude of 5.6 at 17:22:14 on 19 July 2019. The epicenter was located at 27.67° N, 92.89° E. The depth was 10 km. Anomalies before the earthquake are shown in Table 5. From 30 days to 20 days before the earthquake, only the IR4 channel showed abnormalities. Anomalies in the IR3 and IR4 channels appeared on the 11th day before the earthquake. IR1 and IR2 showed abnormalities later. The occurrence time and disappearance time of the anomalies in the four channels were relatively close. The relative powers spectrum on 9 July 2019 is shown in Figure 16. Anomalies in all four channels were close in location. The distance between the anomalies and the epicenter is 11.5 km. The cover area of the anomalies before and after the earthquake is shown in Figure 17. The variation trend of the cover area of anomalies in the four channels is similar during the four-channel abnormal period. For this seismic case, the anomalies of the four channels show obvious similarities in spatiotemporal characteristics and the evolution process.

3.3. Multi-Channel Anomalies

To improve the accuracy of earthquake prediction, we scan the relative power spectrum data in the four channels and identify the region of four-channel anomalies, which means the region where all of the four channels are abnormal at the same time. The statistical result is shown in Table 6. A larger distance threshold can improve PPV and TPR, but can not improve the probability gain. The probability gain is the highest when the distance threshold is 200 km. Figure 18 shows the comparison between the PPV, TPR and gain of multi-channel methods with that of the single-channel method with the distance threshold of 200 km. The PPV and probability gain of the multi-channel method are higher than that of any single-channel method. In particular, the probability gain is roughly doubled, although the TPR is very small. Only 19 earthquakes are associated with the multi-channel anomalies because the multi-channel method only considers simultaneous anomalies of four channels, and earthquakes with anomalies of no more than three channels will be missed. The locations of the epicenters of these 19 earthquakes are shown in Figure 19. Four-channel infrared anomalies were found before the earthquakes in different regions, which indicates the phenomenon is not only suitable for a specific region. The distribution of anomaly time is shown in Figure 20. Eight earthquakes occurred one to two weeks after the anomalies appeared. Only one earthquake occurred three to four weeks after the anomaly appeared. Figure 21 is the Molchan diagram of the different methods. The spatiotemporal occupancy of the four-channel anomaly is much smaller than that of the single-channel anomaly. Although the miss rate is so high, enough small space–time occupations could provide a high value of probability gain.
To compare the multi-channel method with other methods, the authors, data, study region, study period, earthquake magnitude and their results in previous studies are shown in Table 7 [23,28,29,31,46]. The anomaly time means the number of days from anomaly to earthquake. The multi-channel method could obtain the highest probability gain, although the TPR is the lowest. This means that this method reduces the uncertainty of earthquake prediction more obviously than other methods. The PPV of the multi-channel method is also the highest in the studies on earthquakes of magnitude five and above. It means that the multi-channel method has higher accuracy in earthquake prediction than previous methods for earthquakes with magnitude five or above.

4. Conclusions

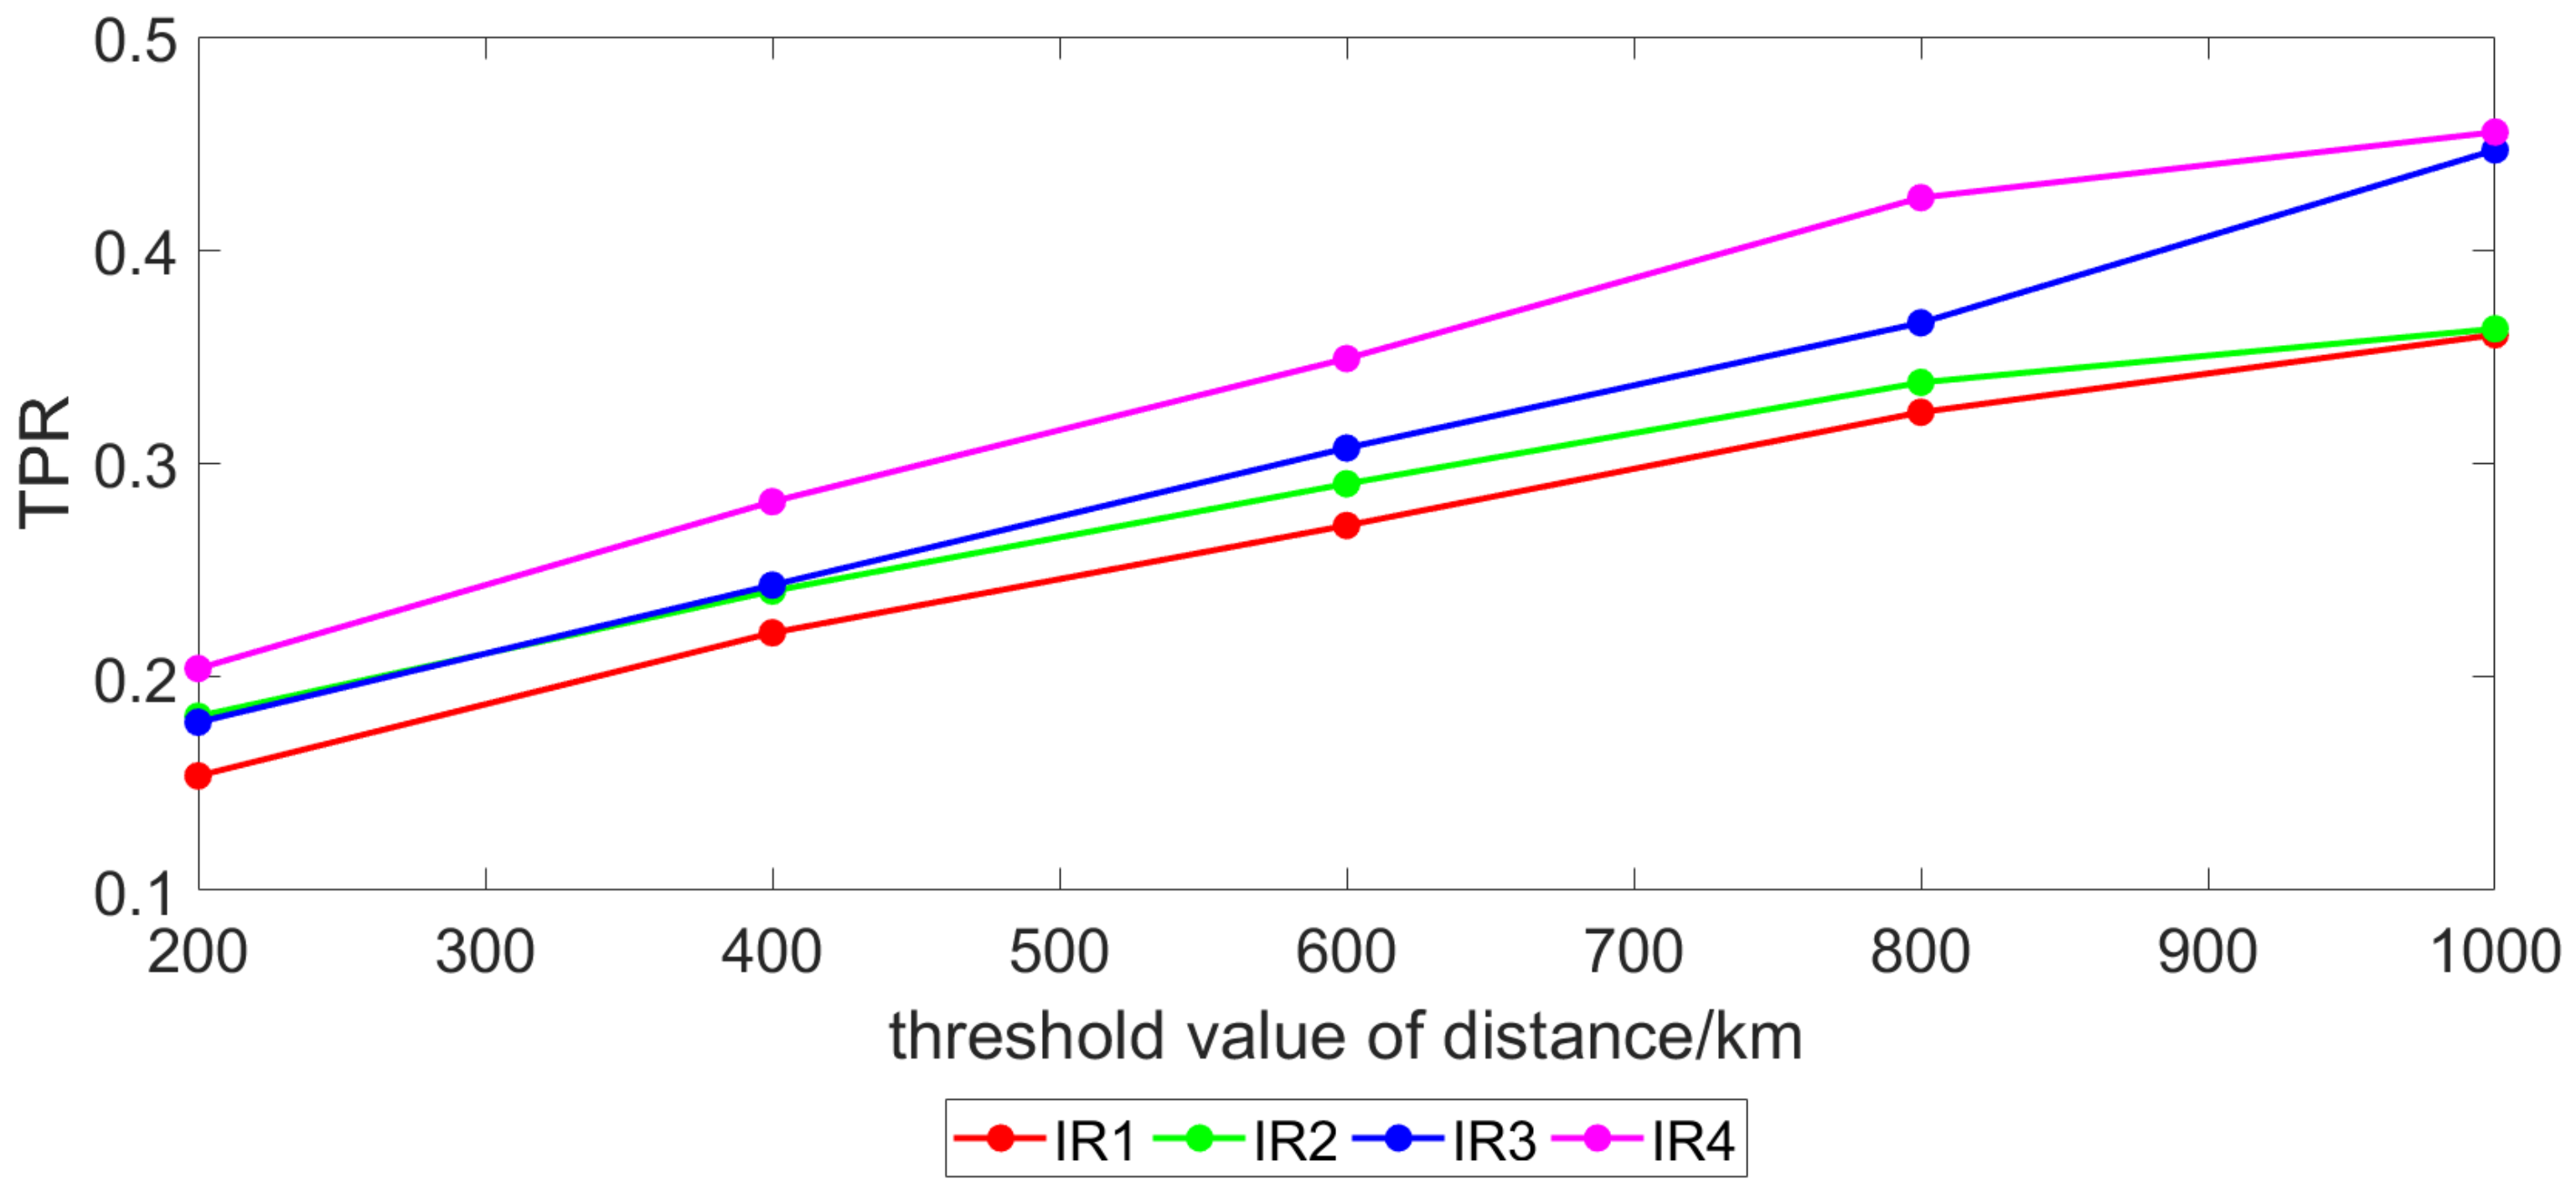
Based on the relative power spectrum method, we propose a statistical method based on connected domain recognition to calculate the PPVs, TPRs and probability gains in different channels. The results show that the PPV and TPR could be improved by increasing the distance threshold. The probability gain is low and its change with distance threshold is not obvious. In addition, we also statistically analyzed the multi-channel infrared anomalies before 358 earthquakes. There is at least one channel anomaly within one kilometer of the epicenter within one month before 36.87% of the earthquakes, but there are only 26 earthquakes with four-channel anomalies within 400 km of the epicenter and 18 earthquakes with four-channel anomalies within 200 km of the epicenter.
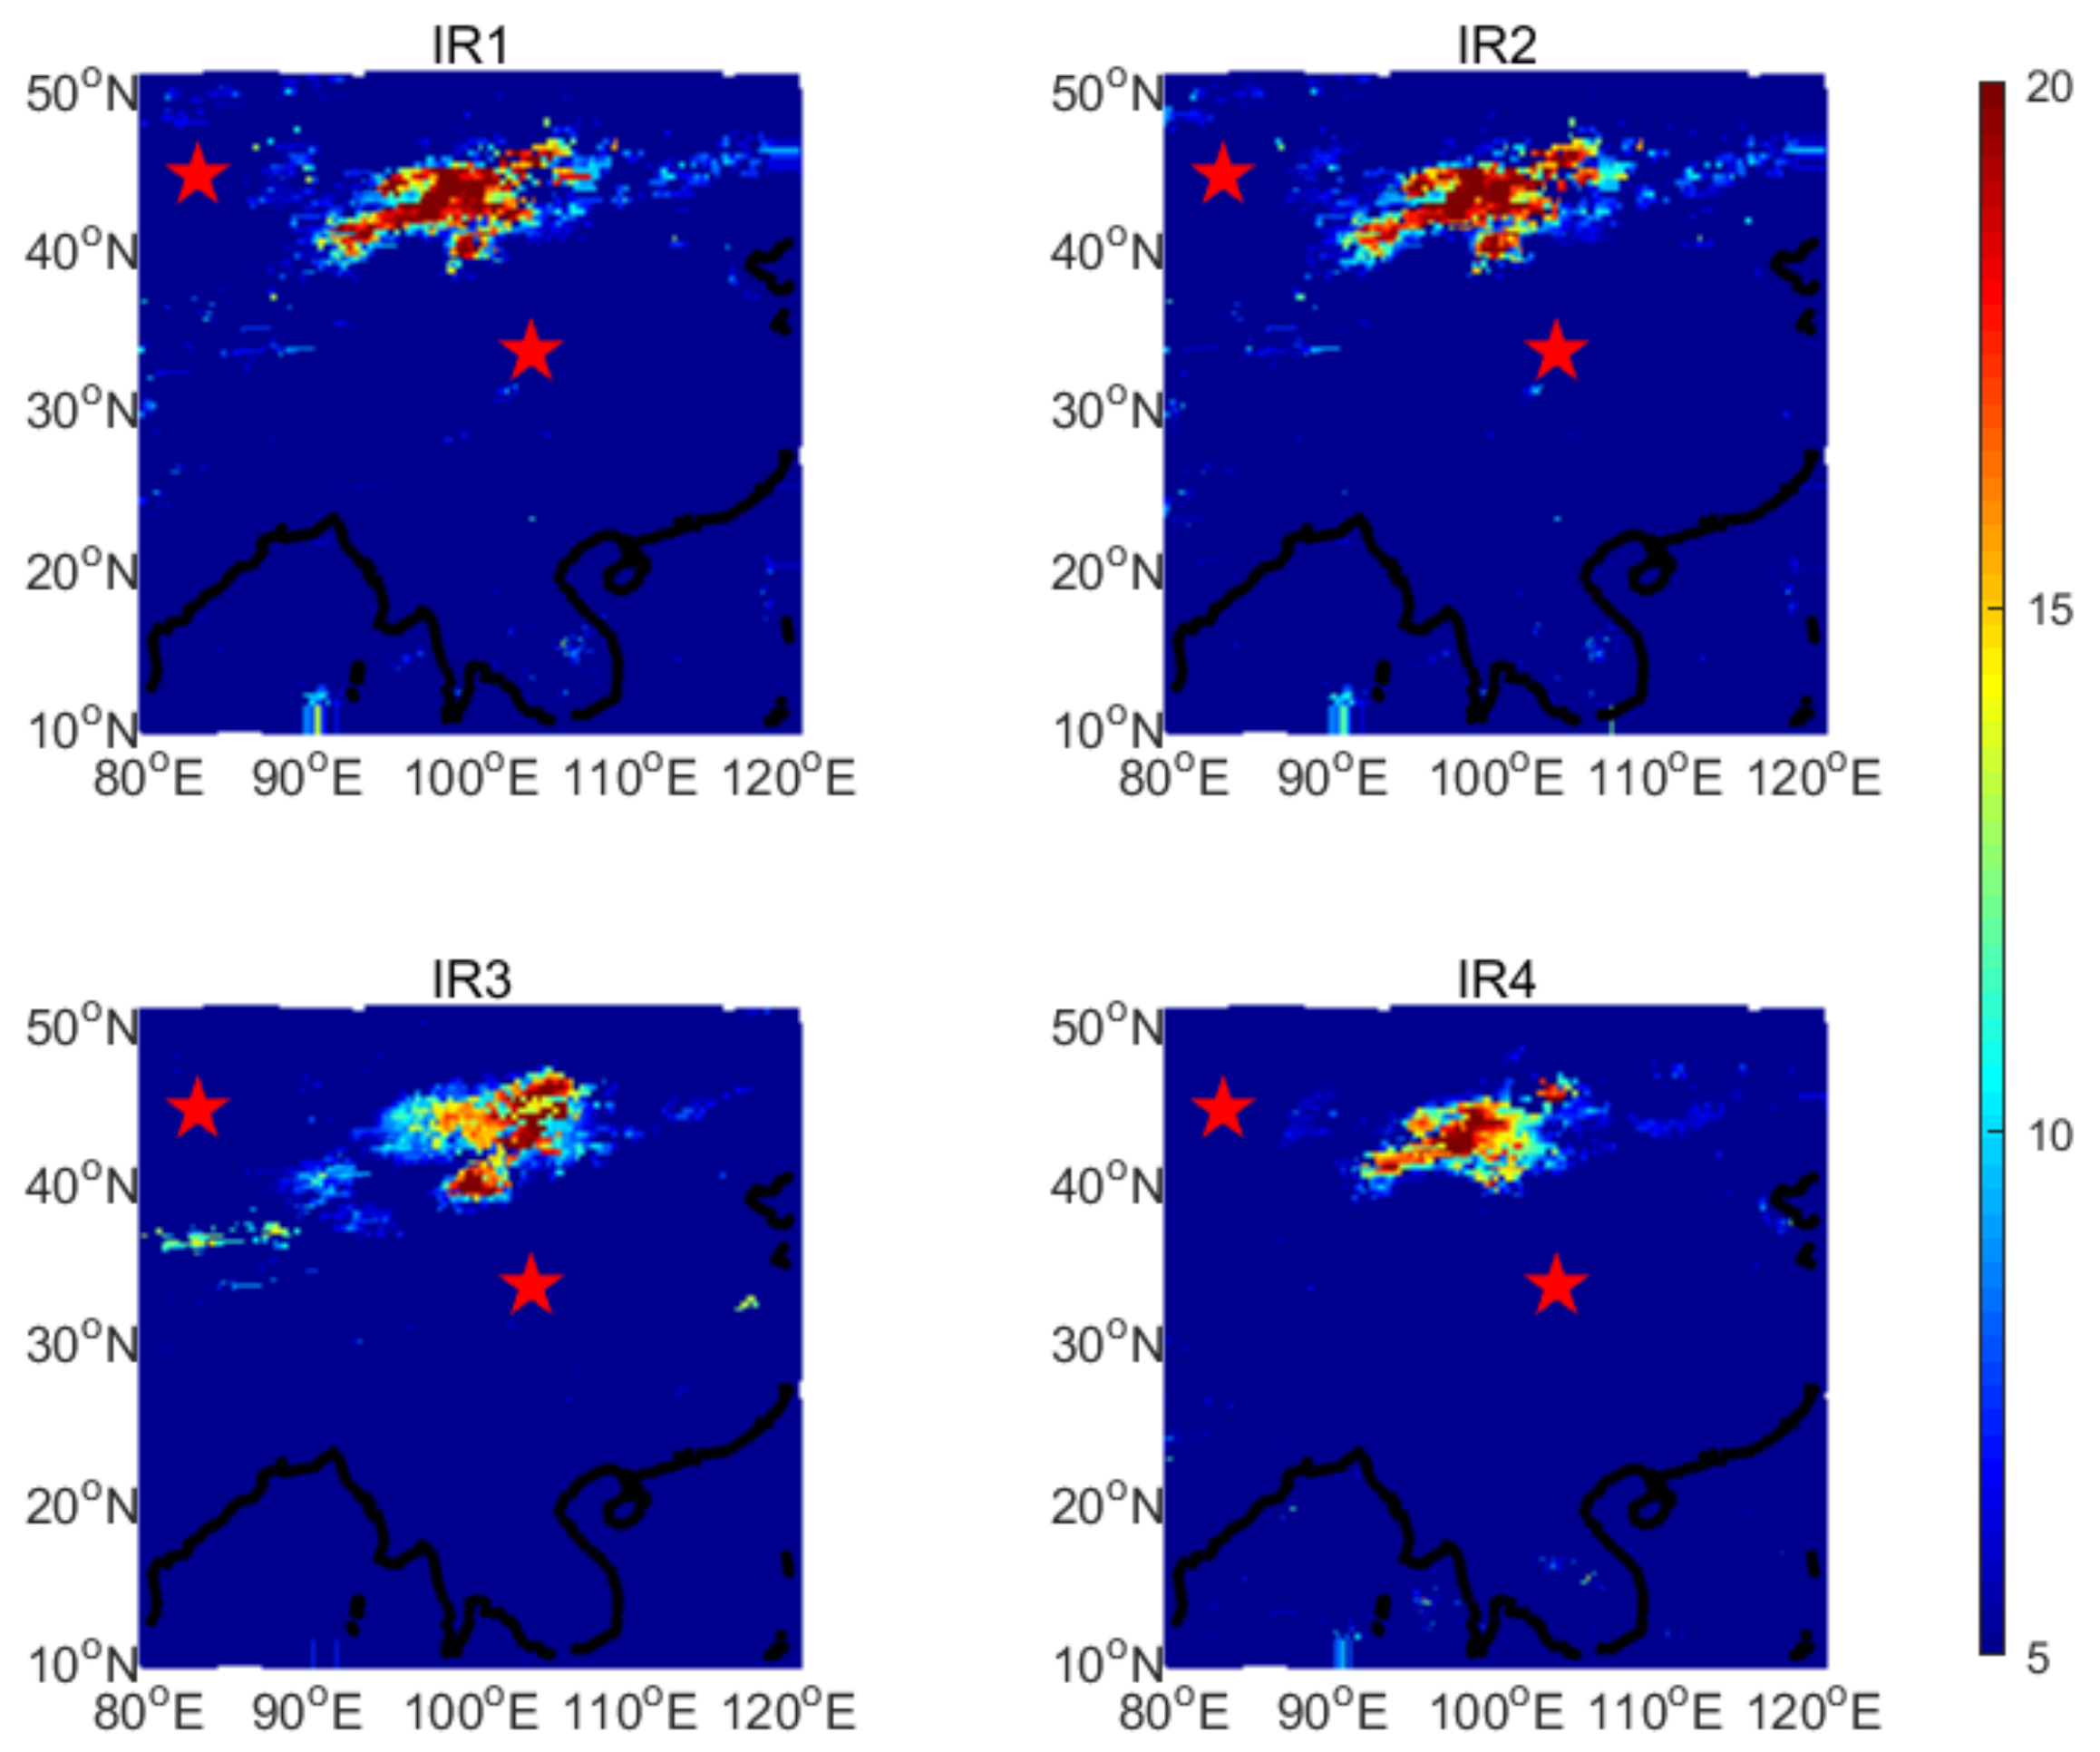
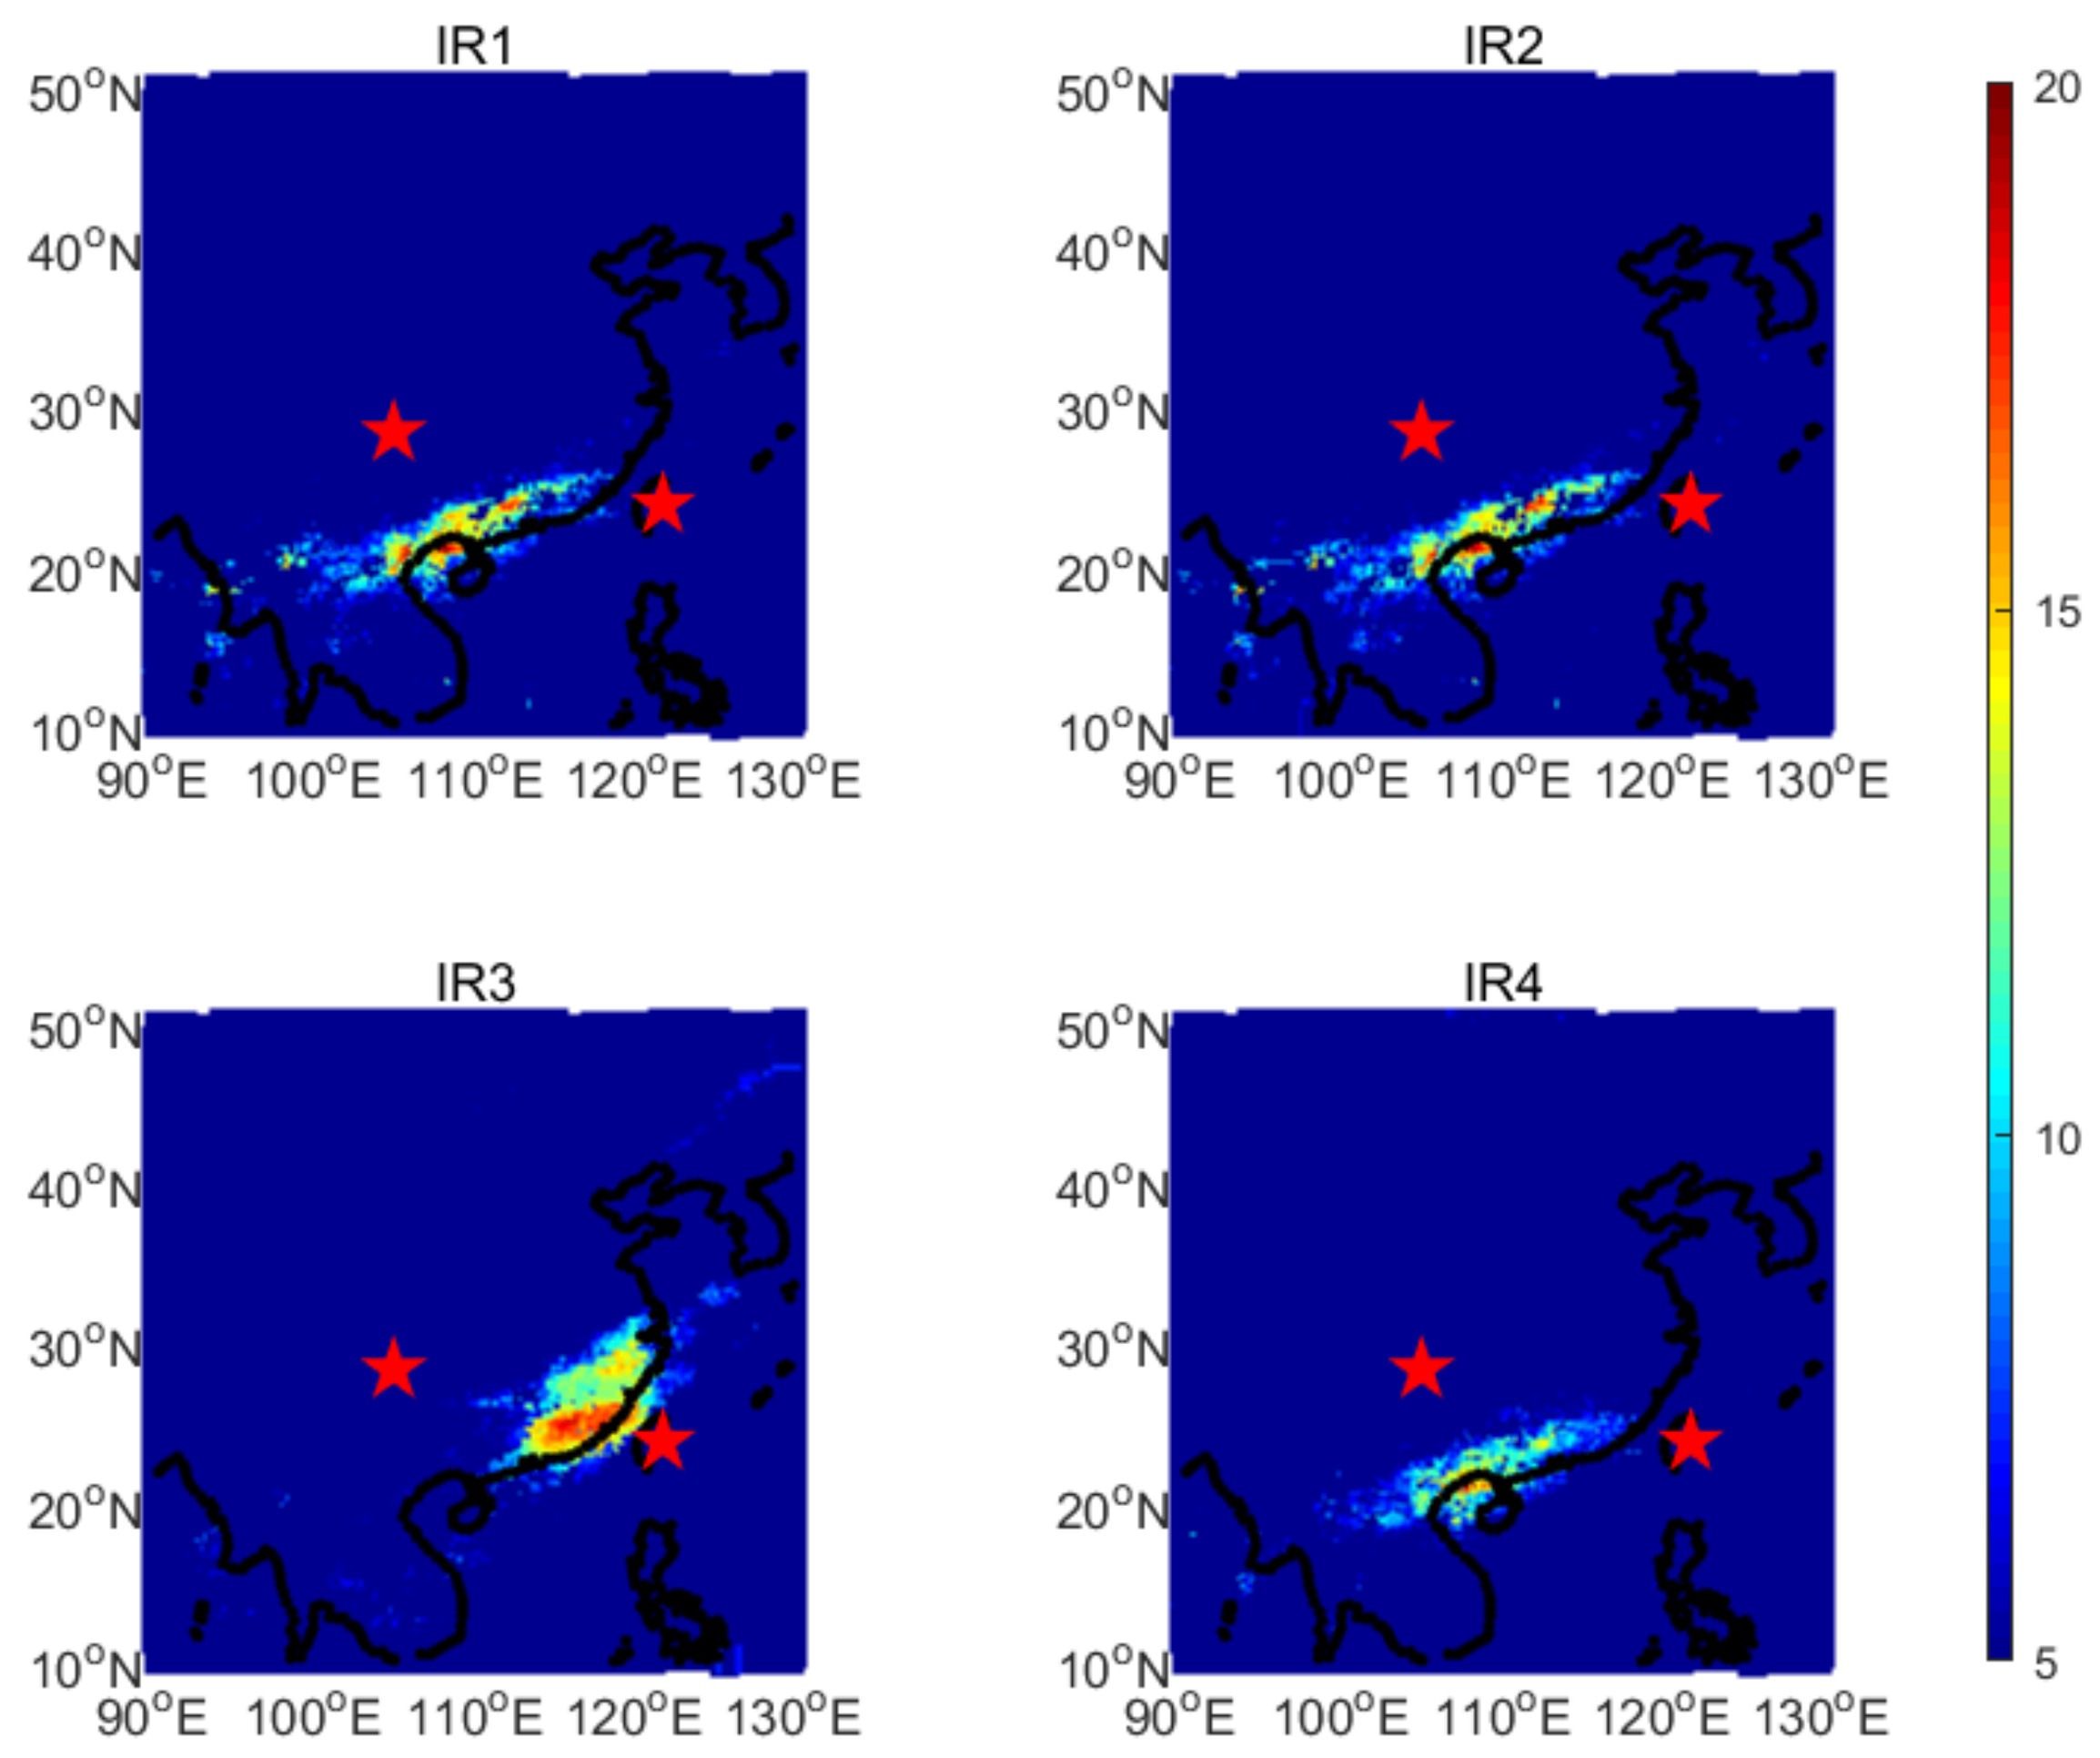
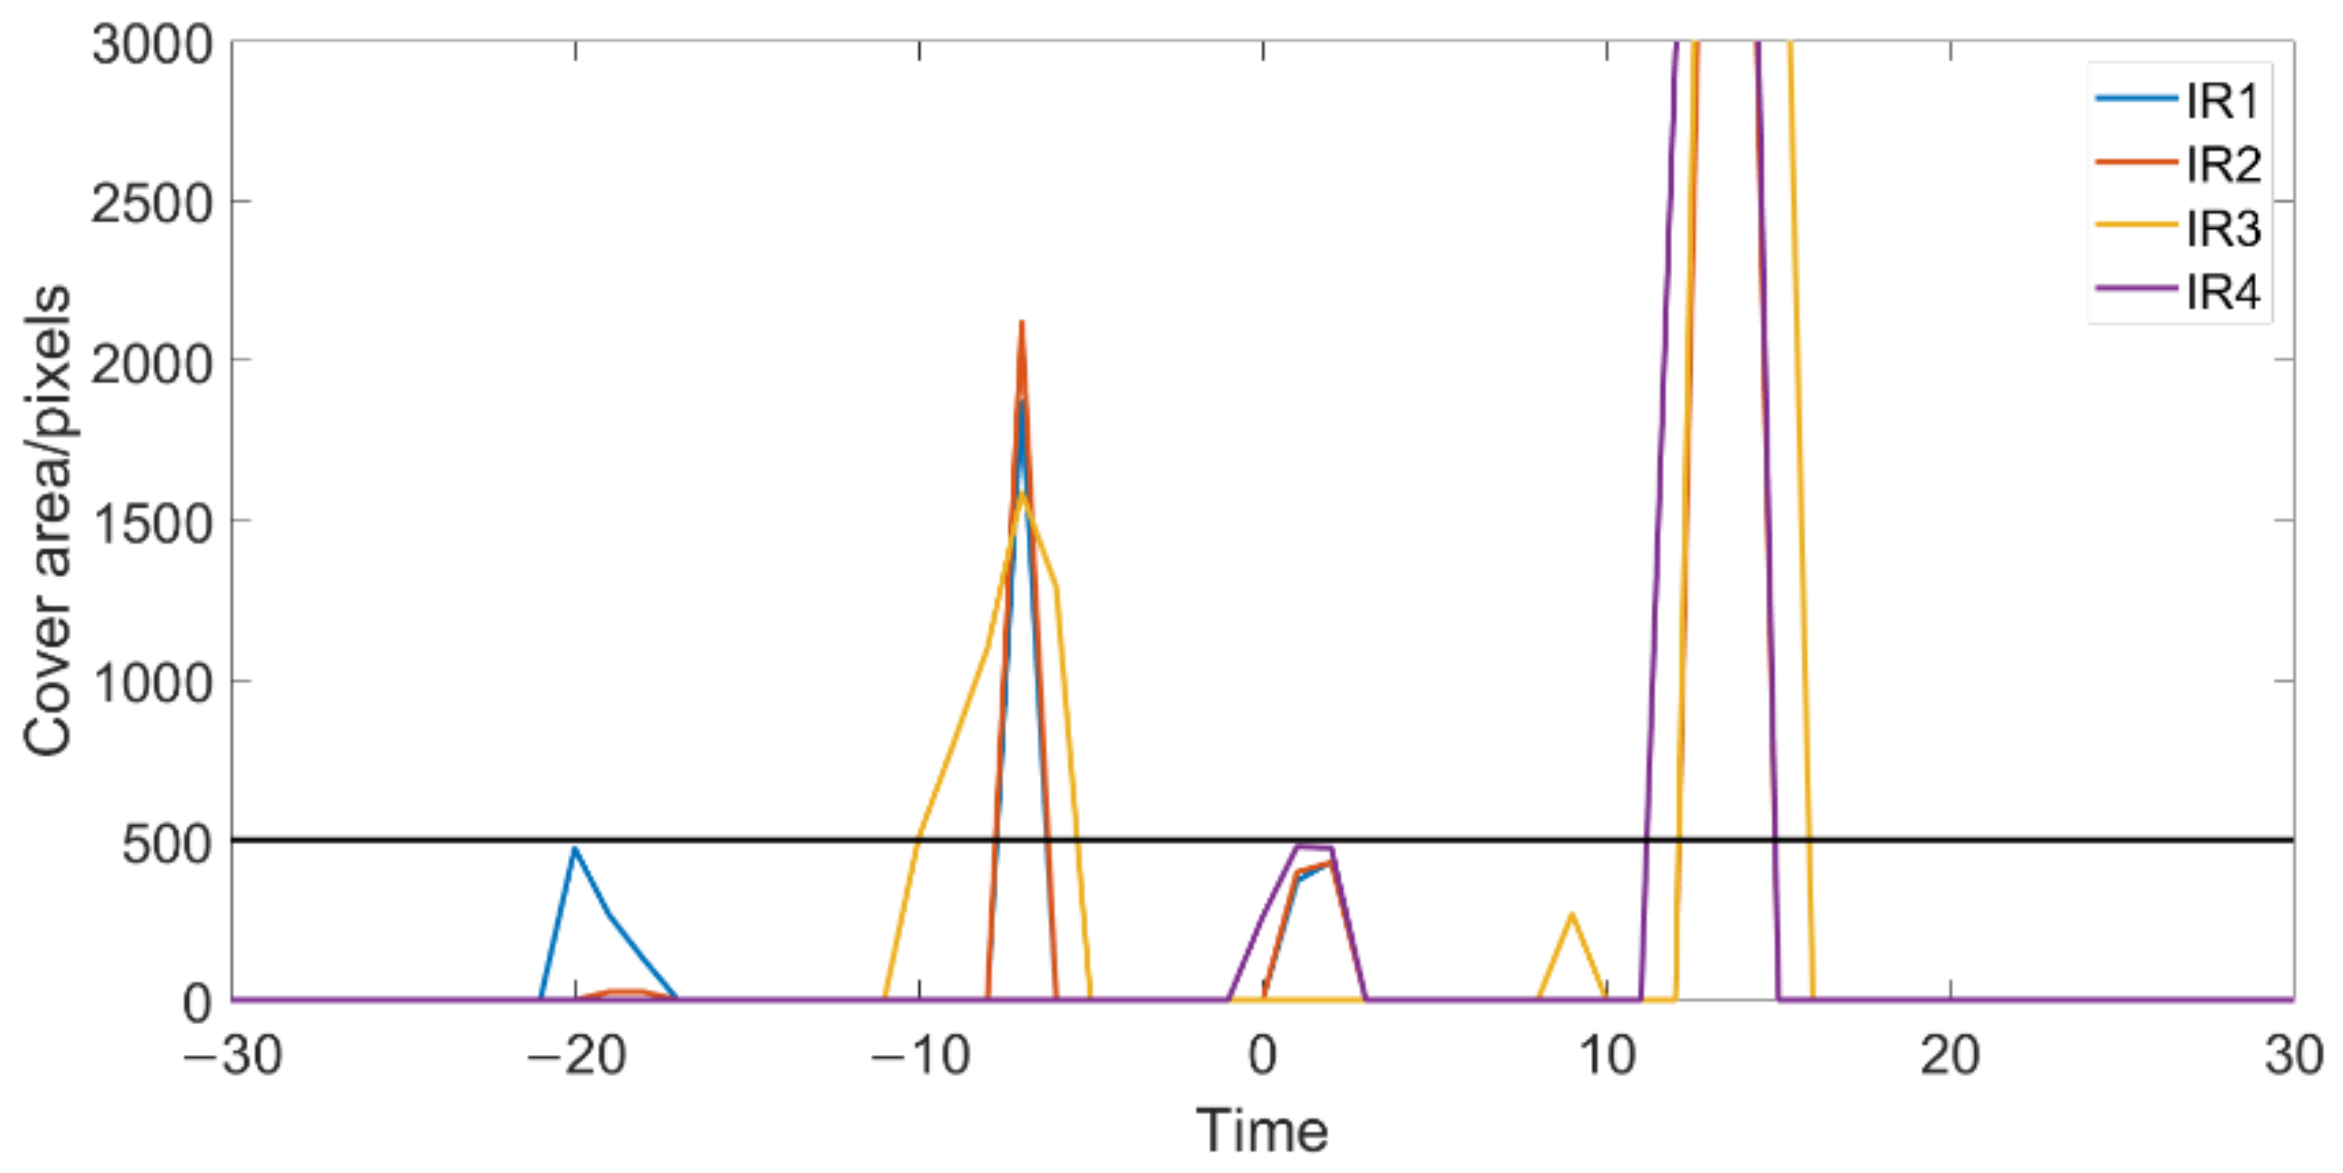
In the study of three earthquake cases, four-channel anomalies appeared and disappeared before the earthquake. The epicenter is at or some distance from the edge of the anomaly. Due to the low PPV and probability gain of the earthquake prediction method using single-channel data, multi-channel infrared remote sensing images are used for earthquake prediction. The PPV of four-channel anomalies is 41.94%. This is higher than that of single-channel anomalies at the same distance threshold of 200 km. Meanwhile, the method causes a lower TPR. Significantly, the spatial–temporal occupancy of four-channel anomalies is very low, and the probability gain is doubled.
This study shows the difference between pre-earthquake anomalies in multi-channel infrared remote sensing images and indicates that multi-channel infrared remote sensing images may have more advantages in the PPV and the probability gain of earthquake prediction than single-channel data. In earthquake prediction, the PPV, which indicates the reliability of the algorithm, is more important than the TPR. This is because the accurate prediction of a single earthquake can also save a lot of life and property. However, it is still difficult to use the four-channel infrared data to obtain high enough accuracy for the practical application of earthquake prediction. The purpose of this paper is to show the advantages of multi-channel data over single-channel data. The results could be compared with other types of pre-seismic anomalies to study the mechanism of anomalies during the earthquake preparation period and explore a better method for earthquake prediction.
Earthquake prediction needs a lot of remote sensing data and ground-based observation data. In future studies, we can improve the performance of earthquake prediction with the following aspects:
a.
FY-2 contains eight satellites. By assimilating data from multiple satellites, it is possible to capture longer observations and count more earthquakes;
b.
The second generation of Fengyun geostationary meteorological satellites (FY-4) carried the advanced geostationary radiation imager and the geostationary interferometric infrared sounder. The former has 14 infrared channels, while the latter can detect the temperature and humidity of the vertical atmosphere. The data may provide more information for earthquake prediction;
c.
The new prediction method that combines remote sensing data and surface observation data should be explored.
The anomaly extraction algorithm in this paper can be used for time series analysis of other remote sensing data, and the statistical method can be used for other types of wide-field and long-time spatial–temporal data. Some parameters may need to be adjusted for using other data.

Author Contributions

Conceptualization, G.C.; methodology, F.C.; investigation, Y.Y.; writing—original draft preparation, Y.Y.; writing—review and editing, F.C.; supervision, G.C.; funding acquisition, F.C. All authors have read and agreed to the published version of the manuscript.

Funding

This research received no external funding.

Institutional Review Board Statement

Not applicable.

Informed Consent Statement

Not applicable.

Data Availability Statement

Not applicable.

Acknowledgments

Thanks to the National Satellite Meteorological Center of China for providing the data of the FY-2G satellite.

Conflicts of Interest

The authors declare no conflict of interest.

References

  1. Gornyi, V.I.; Sal’Man, A.G.; Tronin, A.A.; Shilin, B.V. The terrestrial outgoing infrared radiation as an indicator of seismic activity. Dokl. Akad. Nauk. Sssr 1988, 301, 67–69. [Google Scholar]
  2. Qiang, Z.J.; Kong, L.C.; Zheng, L.Z.; Guo, M.H.; Wang, G.P.; Zhao, Y. An experimental study on temperature increasing mechanism of satellitic thermo-infrared. Acta Seismol. Sin. 1997, 10, 247–252. [Google Scholar] [CrossRef]
  3. Guo, Z.Q.; Qiang, S.Q.; Wang, C.; Liu, Z.; Gao, X.; Zhang, W.G.; Yu, Y.; Zhang, H.; Qiu, J.H. The mechanism of earthquake’s thermal infrared radiation precursory on remote sensing images. In Proceedings of the IEEE International Geoscience and Remote Sensing Symposium (IGARSS 2002)/24th Canadian Symposium on Remote Sensing, Toronto, ON, Canada, 24–28 June 2002; pp. 2036–2038. [Google Scholar]
  4. Sun, H.; Ma, L.; Liu, W.; Spearing, A.; Han, J.; Fu, Y. The response mechanism of acoustic and thermal effect when stress causes rock damage. Appl. Acoust. 2021, 180, 108093. [Google Scholar] [CrossRef]
  5. Ouzounov, D.; Freund, F. Mid-infrared emission prior to strong earthquakes analyzed by remote sensing data. Adv. Space Res. 2004, 33, 268–273. [Google Scholar] [CrossRef]
  6. Qiang, Z.J.; Li, L.Z.; Dian, C.G.; Xu, M.; Ge, F.S. Use remote sensing technique to predict earthquakes. In Proceedings of the Optical Remote Sensing for Industry and Environmental Monitoring, Beijing, China, 15–17 September 1998; Volume 3504, pp. 342–345. [Google Scholar]
  7. Tronin, A.A. Remote sensing and earthquakes: A review. Phys. Chem. Earth Parts A/B/C 2006, 31, 138–142. [Google Scholar] [CrossRef]
  8. Wu, L.X.; Liu, S.J.; Wu, Y.H. The experiment evidences for tectonic earthquake forecasting based on anomaly analysis on satellite infrared image. In Proceedings of the 2006 IEEE International Geoscience and Remote Sensing Symposium, Denver, CO, USA, 31 July–4 August 2006; p. 2158. [Google Scholar] [CrossRef]
  9. Ouzounov, D.; Liu, D.; Chunli, K.; Cervone, G.; Kafatos, M.; Taylor, P. Outgoing long wave radiation variability from IR satellite data prior to major earthquakes. Tectonophysics 2007, 431, 211–220. [Google Scholar] [CrossRef]
  10. Song, D.; Xie, R.; Zang, L.; Yin, J.; Qin, K.; Shan, X.; Cui, J.; Wang, B. A new algorithm for the characterization of thermal infrared anomalies in tectonic activities. Remote Sens. 2018, 10, 1941. [Google Scholar] [CrossRef] [Green Version]
  11. Su, B.; Li, H.; Ma, W.; Zhao, J.; Yao, Q.; Cui, J.; Yue, C.; Kang, C. The outgoing longwave radiation analysis of medium and strong earthquakes. IEEE J. Sel. Top. Appl. Earth Obs. Remote Sens. 2021, 14, 6962–6973. [Google Scholar] [CrossRef]
  12. Bellaoui, M.; Hassini, A.; Bouchouicha, K. Pre-seismic anomalies in remotely sensed land surface temperature measurements: The case study of 2003 Boumerdes earthquake. Adv. Space Res. 2017, 59, 2645–2657. [Google Scholar] [CrossRef]
  13. Khalili, M.; Alavi, P.; Seyed, K.; Abdollahi, E.; Seyed, S. Using Robust Satellite Technique (RST) to determine thermal anomalies before a strong earthquake: A case study of the Saravan earthquake (16 April 2013, MW = 7.8, Iran). J. Asian Earth Sci. 2019, 173, 70–78. [Google Scholar] [CrossRef]
  14. Jing, F.; Shen, X.H.; Kang, C.L.; Xiong, P. Variations of multi-parameter observations in atmosphere related to earthquake. Nat. Hazards Earth Syst. Sci. 2013, 13, 27–33. [Google Scholar] [CrossRef] [Green Version]
  15. Guo, X.; Zhang, Y.S.; Wei, C.X.; Zhong, M.J. Anomalies of middle infrared brightness before 2008 Yutian Ms7.3 and 2010 Yushu Ms7.1 earthquakes. Acta Seismol. Sin. 2014, 36, 175–183. [Google Scholar] [CrossRef]
  16. Dey, S.; Sarkar, S.; Singh, R. Anomalous changes in column water vapor after Gujarat earthquake. Adv. Space Res. 2004, 33, 274–278. [Google Scholar] [CrossRef]
  17. Liu, S.; Cui, L.; Wu, L.; Wang, Z. Analysis on the water vapor anomaly before Wenchuan earthquake based on MODIS data. In Proceedings of the 2009 IEEE International Geoscience and Remote Sensing Symposium, Cape Town, South Africa, 12–17 July 2009; pp. 412–415. [Google Scholar] [CrossRef]
  18. Zhao, X.; Pan, S.; Sun, Z.; Guo, H.; Zhang, L.; Feng, K. Advances of satellite remote sensing technology in earthquake prediction. Nat. Hazards Rev. 2021, 22, 03120001. [Google Scholar] [CrossRef]
  19. Sekertekin, A.; Inyurt, S.; Yaprak, S. Pre-seismic ionospheric anomalies and spatio-temporal analyses of MODIS Land surface temperature and aerosols associated with 24 September 2013 Pakistan Earthquake. J. Atmos. Sol. Terr. Phys. 2020, 200, 105218. [Google Scholar] [CrossRef]
  20. Wei, L.; Guo, J.; Liu, J.; Lu, Z.; Li, H.; Cai, H. Satellite thermal infrared earthquake precursor to the Wenchuan Ms 8.0 earthquake in Sichuan, China, and its analysis on geo-dynamics. Acta Geol. Sin. Engl. Ed. 2009, 83, 767–775. [Google Scholar] [CrossRef]
  21. Ouzounov, D.; Pulinets, S.; Sun, K.; Shen, X.; Kafatos, M. Atmosphere response to pre-earthquake processes revealed by satellite and ground observations. Case study for few strong earthquakes in Xinjiang, China (2008–2014). Ann. Geophys. 2020, 63, 552. [Google Scholar] [CrossRef]
  22. Zhong, M.; Shan, X.; Zhang, X.; Qu, C.; Guo, X.; Jiao, Z. Thermal infrared and ionospheric anomalies of the 2017 MW6.5 jiuzhaigou earthquake. Remote Sens. 2020, 12, 2843. [Google Scholar] [CrossRef]
  23. Filizzola, C.; Corrado, A.; Genzano, N.; Lisi, M.; Pergola, N.; Colonna, R.; Tramutoli, V. RST Analysis of anomalous TIR sequences in Relation with earthquakes occurred in Turkey in the period 2004–2015. Remote Sens. 2022, 14, 381. [Google Scholar] [CrossRef]
  24. Saradjian, M.R.; Akhoondzadeh, M. Thermal anomalies detection before strong earthquakes (M > 6.0) using interquartile, wavelet and Kalman filter methods. Nat. Hazards Earth Syst. Sci. 2011, 11, 1099–1108. [Google Scholar] [CrossRef]
  25. Wei, C.X.; Zhang, Y.S.; Guo, X.; Hui, S.X.; Qin, M.Z.; Zhang, Y. Thermal Infrared Anomalies of Several Strong Earthquake Remote sensing observations of pre-earthquake thermal anomalies. Sci. World J. 2013, 2013, 208407. [Google Scholar] [CrossRef] [Green Version]
  26. Akhoondzadeh, M. A comparison of classical and intelligent methods to detect potential thermal anomalies before the 11 August 2012 Varzeghan, Iran, earthquake (Mw = 6.4). Nat. Hazards Earth Syst. Sci. 2013, 13, 1077–1083. [Google Scholar] [CrossRef]
  27. Lu, X.; Meng, Q.Y.; Gu, X.F.; Zhang, X.D.; Xie, T.; Geng, F. Thermal infrared anomalies associated with multi-year earthquakes in the Tibet region based on China’s FY-2E satellite data. Adv. Space Res. 2016, 58, 989–1001. [Google Scholar] [CrossRef]
  28. Zhang, Y.; Meng, Q. A statistical analysis of TIR anomalies extracted by RSTs in relation to an earthquake in the Sichuan area using MODIS LST data. Nat. Hazards Earth Syst. Sci. 2019, 19, 535–549. [Google Scholar] [CrossRef] [Green Version]
  29. Jiao, Z.H.; Shan, X.J. Statistical framework for the evaluation of earthquake forecasting: A case study based on satellite surface temperature anomalies. J. Asian Earth Sci. 2021, 211, 104710. [Google Scholar] [CrossRef]
  30. Pavlidou, E.; van der Meijde, M.; van der Werff, H.; Hecker, C. Time series analysis of land surface temperatures in 20 earthquake cases worldwide. Remote Sens. 2018, 11, 61. [Google Scholar] [CrossRef] [Green Version]
  31. Zhang, Y.; Meng, Q.Y.; Ouillon, G.; Sornette, D.; Ma, W.Y.; Zhang, L.L.; Zhao, J.; Qi, Y.; Geng, F. Spatially variable model for extracting TIR anomalies before earthquakes: Application to Chinese Mainland. Remote Sens. Environ. 2021, 267, 112720. [Google Scholar] [CrossRef]
  32. Richards, A.; Johnson, G. Atmospheric effects on infrared imaging systems. In Proceedings of the SPIE European Symposium on Optics and Photonics in Security and Defence, Bruges, Belgium, 26–29 September 2005; pp. 1–14. [Google Scholar] [CrossRef]
  33. Kirkham, M.B. Chapter 25Solar radiation, black bodies, heat budget, and radiation balance. In Principles of Soil and Plant Water Relations, 2nd ed.; Academic Press: Cambridge, MA, USA, 2014; pp. 453–472. [Google Scholar]
  34. Dobrovolsky, I.P.; Zubkov, S.I.; Miachkin, V.I. Estimation of the size of earthquake preparation zones. Pure Appl. Geophys. 1979, 117, 1025–1044. [Google Scholar] [CrossRef]
  35. Wei, C.; Lu, X.; Zhang, Y.; Guo, Y.; Wang, Y. A time-frequency analysis of the thermal radiation background anomalies caused by large earthquakes: A case study of the Wenchuan 8.0 earthquake. Adv. Space Res. 2019, 65, 435–445. [Google Scholar] [CrossRef]
  36. Xie, T.; Ma, W. Possible thermal brightness temperature anomalies associated with the Lushan (China) M S7.0 earthquake on 20 April 2013. Earthq. Sci. 2015, 28, 37–47. [Google Scholar] [CrossRef] [Green Version]
  37. Zhang, X.; Zhang, Y.; Tian, X.; Zhang, Q.; Tian, J. Tracking of thermal infrared anomaly before one strong earthquake-in the case of Ms6.2 earthquake in Zadoi, Qinghai on 17 October 2016. J. Phys. Conf. Ser. 2017, 910, 012048. [Google Scholar] [CrossRef]
  38. Bhardwaj, A.; Singh, S.; Sam, L.; Joshi, P.; Bhardwaj, A.; Martín-Torres, F.J.; Kumar, R. A review on remotely sensed land surface temperature anomaly as an earthquake precursor. Int. J. Appl. Earth Obs. Geoinf. 2017, 63, 158–166. [Google Scholar] [CrossRef]
  39. Zechar, J.D.; Jordan, T.H. Testing alarm-based earthquake predictions. Geophys. J. Int. 2008, 172, 715–724. [Google Scholar] [CrossRef] [Green Version]
  40. Eleftheriou, A.; Filizzola, C.; Genzano, N.; Lacava, T.; Lisi, M.; Paciello, R.; Pergola, N.; Vallianatos, F.; Tramutoli, V. Long-term RST analysis of anomalous TIR sequences in relation with earthquakes occurred in Greece in the period 2004–2013. Pure Appl. Geophys. 2015, 173, 285–303. [Google Scholar] [CrossRef] [Green Version]
  41. Lu, G.J.; Zhang, H.; Li, H.; Wang, J.L. Infrared brightness temperature changes before moderate to strong earthquakes in north China. Earthquake 2018, 38, 96–106. [Google Scholar]
  42. Lü, Q.-Q.; Ding, J.-H.; Cui, C.-Y. Probable satellite thermal infrared anomaly before the Zhangbei Ms = 6.2 earthquake on 10 January 1998. Acta Seism. Sin. 2000, 13, 203–209. [Google Scholar] [CrossRef]
  43. Wang, Y.; Zhang, Y.; Wei, C. Comparative study on thermal infrared anomaly characteristics of several moderate and strong earthquakes in Yunnan province. Imaging Sci. Photochem. 2019, 37, 215–226. [Google Scholar]
  44. Zhang, L.; Guo, X.; Zhang, X.; Tu, H. Anomaly of thermal infrared brightness temperature and basin effect before Jiuzhaigou MS7.0 earthquake in 2017. Acta Seismol. Sin. 2018, 40, 797–808. [Google Scholar]
  45. Zhang, X.; Zhang, Y.S.; Guo, X.; Wei, C.X.; Zhang, L.F. Analysis of thermal infrared anomaly in the Nepal MS8.1 earthquake. Earth Sci. Front. 2017, 24, 227–233. [Google Scholar] [CrossRef]
  46. Fu, C.-C.; Lee, L.-C.; Ouzounov, D.; Jan, J.-C. Earth’s outgoing longwave radiation variability prior to M ≥ 6.0 earthquakes in the Taiwan area during 2009–2019. Front. Earth Sci. 2020, 8, 364. [Google Scholar] [CrossRef]
Figure 1. The flow of the research method.
Applsci 12 07958 g001
Figure 2. The structure of the data file.
Applsci 12 07958 g002
Figure 3. The terrain in the study area.
Applsci 12 07958 g003
Figure 4. Flow chart of anomaly extraction algorithm.
Applsci 12 07958 g004
Figure 5. Positive predictive values in different channels at different distance thresholds.
Applsci 12 07958 g005
Figure 6. True positive rates in different channels at different distance thresholds.
Applsci 12 07958 g006
Figure 7. Infrared anomalies before earthquakes.
Applsci 12 07958 g007
Figure 8. Probability gains in different channels at different distance thresholds.
Applsci 12 07958 g008
Figure 9. Power spectrum images on 14 July 2017.
Applsci 12 07958 g009
Figure 10. Power spectrum images on 20 July 2017.
Applsci 12 07958 g010
Figure 11. The cover area of the anomalies before and after the Sichuan earthquake.
Applsci 12 07958 g011
Figure 12. Power spectrum images on 6 December 2018.
Applsci 12 07958 g012
Figure 13. Power spectrum images on 8 December 2018.
Applsci 12 07958 g013
Figure 14. Power spectrum images on 9 December 2018.
Applsci 12 07958 g014
Figure 15. The cover area of the anomalies before and after Taiwan earthquake.
Applsci 12 07958 g015
Figure 16. Power spectrum images on 7 July 2019.
Applsci 12 07958 g016
Figure 17. The cover area of the anomalies before and after Tibet earthquake.
Applsci 12 07958 g017
Figure 18. Comparison of single-channel method and multi-channel method.
Applsci 12 07958 g018
Figure 19. Epicentres of earthquakes following four-channel anomaly.
Applsci 12 07958 g019
Figure 20. The number of days between anomalies and earthquakes.
Applsci 12 07958 g020
Figure 21. Molchan diagram of different methods.
Applsci 12 07958 g021
Table 1. The specific information of each channel.
ChannelSpectral IntervalSpatial Resolution
VIS0.55–0.75 μm1.25 km (5 km)
IR110.3–11.3 μm5 km
IR211.5–12.5 μm5 km
IR36.3–7.6 μm5 km
IR43.5–4.0 μm5 km
Table 2. Seismic information.
ProvinceDateMagnitude (M)Latitude (°N)Longitude (°E)Depth (km)
Sichuan8 August 20177.033.20103.8220
Taiwan16 December 20185.223.71121.8026
Tibet19 July 20195.627.6792.8910
Table 3. The spatial–temporal characteristics of anomalies before the Sichuan earthquake.
ChannelStart Time (Days)End Time (Days)MaximumTime of Maximum (Days)Maximum Cover Area (Pixes)Distance (km)
IR1−25−1828.9379−192275244.1042
IR2−25−1829.9185−192569244.1042
IR3−24−2227.2232−24765267.2322
−20−1826.1566−191447482.0594
IR4−21−1825.7784−191146567.8146
Table 4. The spatial–temporal characteristics of anomalies before the Taiwan earthquake.
ChannelStart Time (Days)End Time (Days)MaximumTime of Maximum (Days)Maximum Cover Area (Pixes)Distance (km)
IR1−8−522.1271−72068134.1929
IR2−8−521.1125−62202134.1929
IR3−10−619.0396−715871.6510
IR4−8−523.6295−61625240.8767
Table 5. The spatial–temporal characteristics of anomalies before the Tibet earthquake.
ChannelStart Time (Days)End Time (Days)MaximumTime of Maximum (Days)Maximum Cover Area (Pixels)Distance (km)
IR1−10−625.8302−10236611.4747
IR2−10−621.7490−7256911.4747
IR3−11−517.1277−9314711.4747
IR4−30−2036.5649−257125184.2958
−11−535.2557−9323711.4747
Table 6. Statistical result of multi-channel anomalies.
Distance Threshold200 km400 km600 km800 km1000 km
PPV0.41940.45160.48390.54840.6129
TPR0.05310.06700.07540.10610.1117
Gain2.38331.98691.62861.77311.5110
Table 7. The statistical results in previous studies.
AuthorsDataRegionPeriodMagnitudePPVTPRGainAnomaly Time
Ching-Chou Fu et al. [46]OLR 1Taiwan, China2009–2019≥6.0None 577%None<25 days
Ying Zhang et al. [28]ST 2Sichuan, China2002–2018≥5.025.9%10.8%<1.5<30 days
Ying Zhang et al. [31]OLRChina2007–2017≥4.076.1%58.1%1.34<50days
Carolina Filizzola et al. [23]TIR 3Turkey2004–2015≥4.032.9%≈12% 61.3<30 days
≥5.0None≈20%2.2
Zhong-Hu Jiao et al. [29]STGlobal2010–2018≥5.07.61%98.4%None<120 days
Yingbo Yue et al.BT 4China2016–2020≥5.041.9%5.3%2.38<30 days
1. OLR means outgoing long-wave radiation; 2. ST means land surface temperature; 3. TIR means thermal infrared radiation; 4. BT means brightness temperature; 5. None means that the parameter was not mentioned in the study; 6. ≈ means the value was estimated according to the point in the images.
Publisher’s Note: MDPI stays neutral with regard to jurisdictional claims in published maps and institutional affiliations.

