Article

Compressive Strength of Aged Timber Members in Traditional Building: Considering Differences in Heartwood and Sapwood

1
School of Civil Engineering, Chongqing University, Chongqing 400044, China
2
School of Civil Engineering, Beijing Jiaotong University, Beijing 100044, China
*
Author to whom correspondence should be addressed.
Appl. Sci. 2022, 12(15), 7719; https://doi.org/10.3390/app12157719
Submission received: 17 June 2022 / Revised: 18 July 2022 / Accepted: 26 July 2022 / Published: 31 July 2022
(This article belongs to the Special Issue Design and Assessment of Timber Structures)

Abstract

:
This paper compares the parallel-to-grain compressive strengths of wood sample specimens with defects with those of the associated timber log samples. The Chinese fir (Cunninghamia lanceolata) was examined using the static test method. We analyzed the effects of sampling position along the radial direction of the log sample and the age of timber on the parallel-to-grain compressive strength. We then developed time-dependent strength models of the heartwood (HW) and sapwood (SW). These models can be used to evaluate the strength of an aged timber member, using only the service duration, without taking material samples. The degradation of compressive strength over time was then analyzed using an existing multivariate time-dependent model that includes the stress level. The failure strength of the HW was found to be close to that of the SW when at low stress levels. The estimates of the compressive strength of timber members based on these models were better than those recommended by the Chinese National Standard.

1. Introduction

Traditional buildings have suffered different degrees of damage, mainly due to external loads and material strength degradation [1]. Long-term loading can lead to material damage [2,3]. Due to an environment suitable for fungi growth, the decay of timber members in traditional buildings is common [4], which in turn leads to a decrease in the strength of wood components [5]. Systematic research on the effect of aging on the mechanical properties of timber has been carried out in Japan during the 1950s and 1960s [6,7,8,9,10,11]. The effect of load history was also studied in Europe and the United States in the 1980s and 1990s [12,13,14,15]. More reports [16,17,18,19,20] on the static and impact strengths and dynamic properties of aged timber have also been published. All of these studies significantly contribute to new knowledge of the material science of timber for the protection of aging traditional heritage timber structures.
A timber member in an existing building usually cannot be replicated, especially in aging heritage buildings. A destructive test is usually not applicable to obtain the strength of timber material. On the other hand, the strength of clear specimen samples (without flaw) from the timber member can be easily obtained. Some experimental studies have considered the correlation between the strengths of clear specimens and the corresponding wood logs with the aim to develop a long-term strength model of timber [21,22]. A relationship between the strengths of clear specimens and wood logs was later established, based on reliability theory [23,24,25]. Other researchers investigated the development of wood grading methods and the correlation of results from different methods, which included visual inspection, clear specimen tests, log tests, and nondestructive tests [26,27,28].
The parallel-to-grain compressive strength of clear specimens obtained between the 1950s and 2020s are summarized in Figure 1, which is drawn based on the data of new and old materials in Appendix A. The Y-axis label in Figure 1 is the percentage difference of parallel-to-grain compressive strength between the aged timber ( σ O ) and new timber ( σ N ), denoted as ( σ O σ N ) / σ N % . They have been obtained from samples ranging from 50 to 1800 years old (Appendix A).
There are many cases in Figure 1 where the parallel-to-grain compressive strength of aged timber is greater than that of new timber. This is not consistent with the common belief that the strength of aged timber is less than that of new timber [26,29]. This suggests that the parallel-to-grain compressive strength of clear specimens is not representative of the strength of on-site structural members with damage and decay, which accumulates with service life. Although creep increases with the time, the creep rate slows as the amount of accumulated creep increases [30]. Therefore, it is necessary to evaluate the strength of timber members based on the strength of the natural specimen with damage and decay.
The important fact that defects are not uniformly distributed across the cross-section of a timber member has long been ignored. The sapwood (SW) is subject to natural decay soon after the tree is felled because of its high moisture content (MC) and rich nutrients that welcome fungi and insects. The heartwood (HW) has a low MC and contains ingredients such as tannins, aromatic oils, and calcium carbonate, which are toxic to fungi [5]. The heartwood also decays, but is more resistant to corrosion than the sapwood. There is a significantly different presence of defects between the SW and the HW, resulting in their different strengths. Therefore, it is necessary to study the strength differences of the heartwood and sapwood.
The strengths of specimens from both the HW and SW are experimentally studied in this report. The Chinese fir (Cunninghamia lanceolata) is examined using the static test method. The wood species will be referred to as CL for the rest of this paper. Owing to the difficulty in obtaining samples of different ages for comparison, this study only considered aged timber, which was approximately 100 years old, and new timber. The mechanical properties of the same wood species at different ages from the refurbishment of traditional heritage buildings can be included for further comparison in the future.

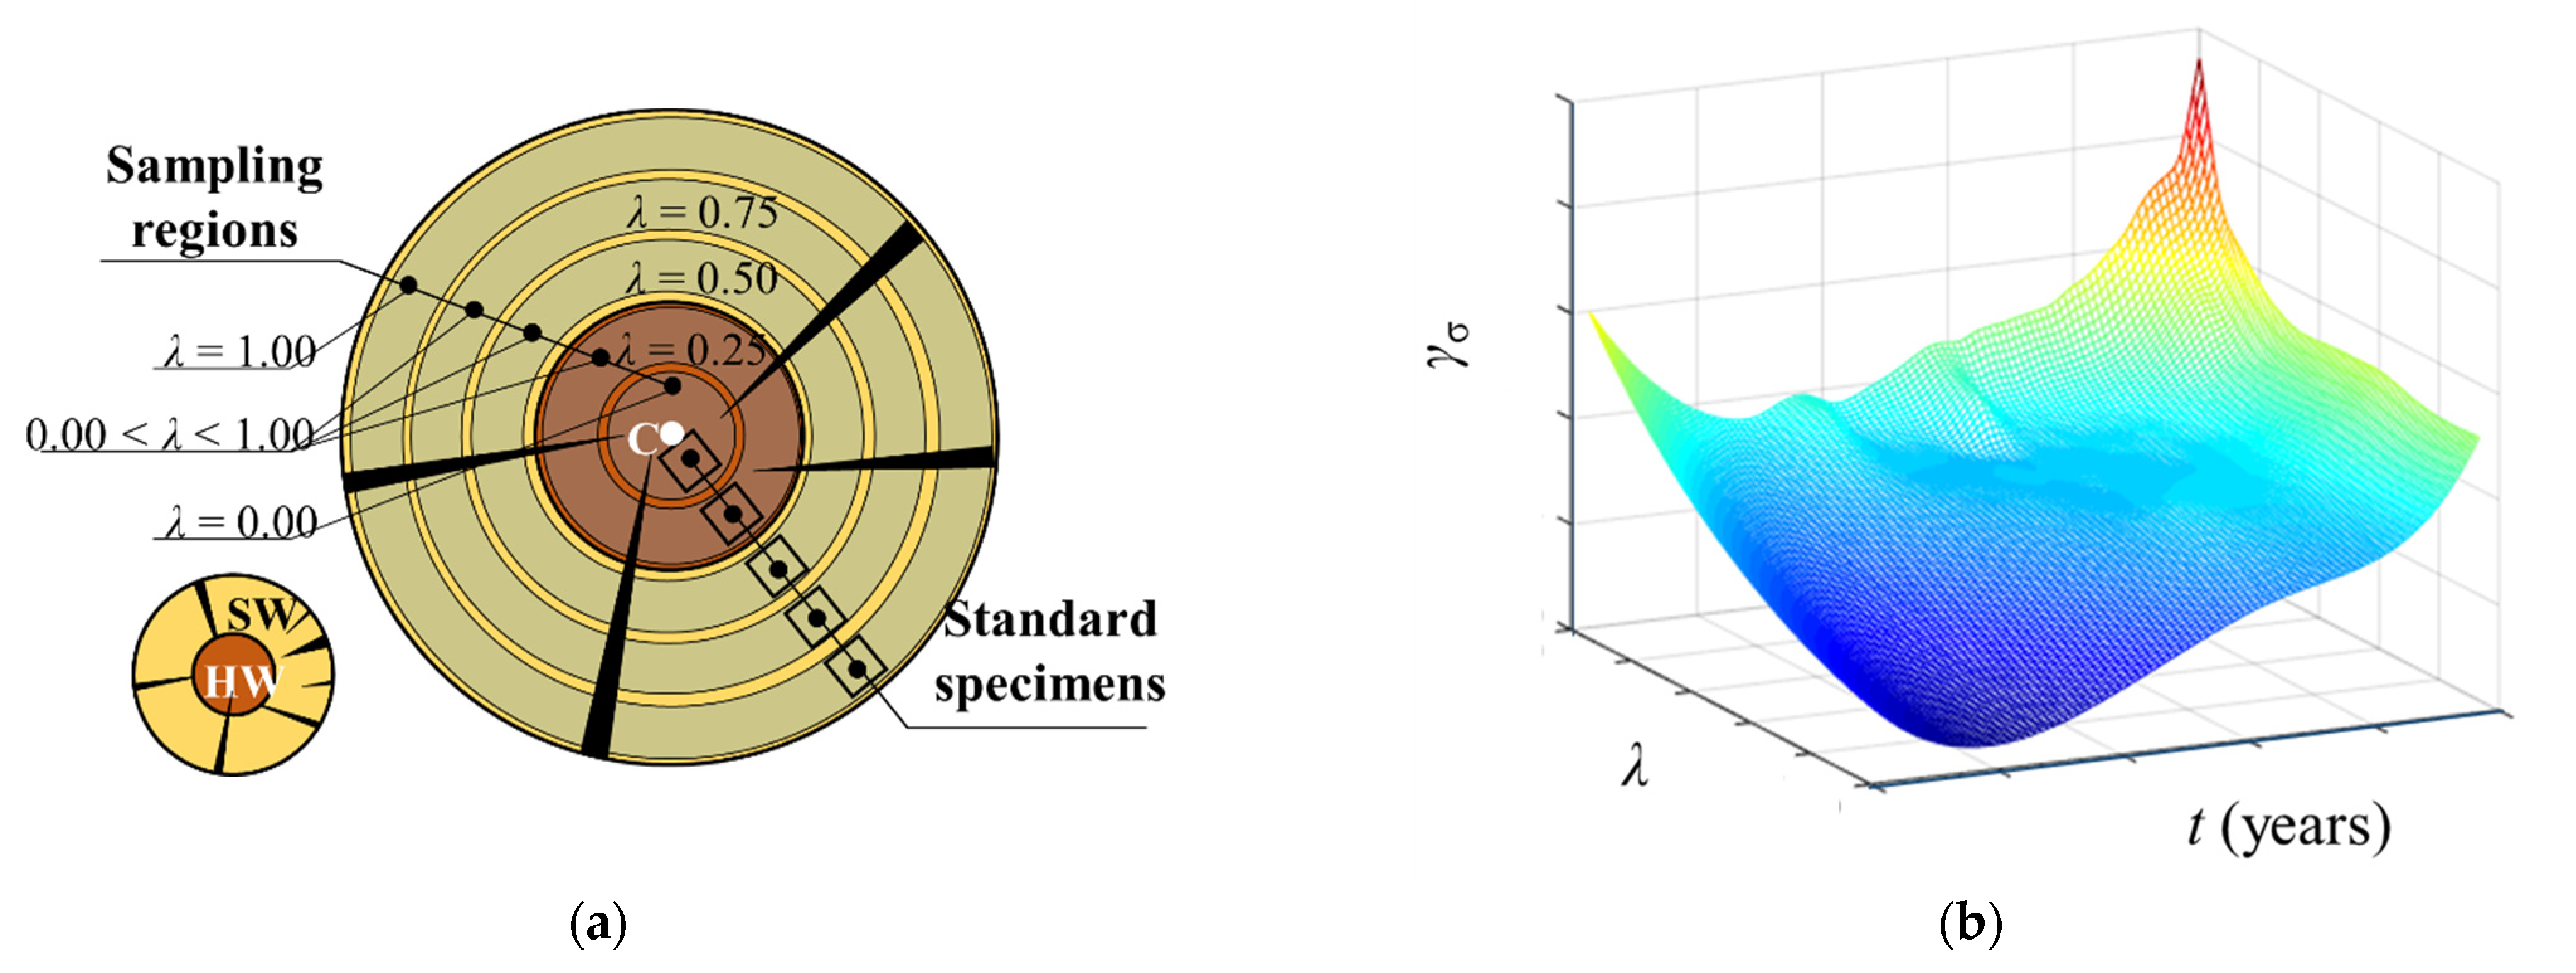
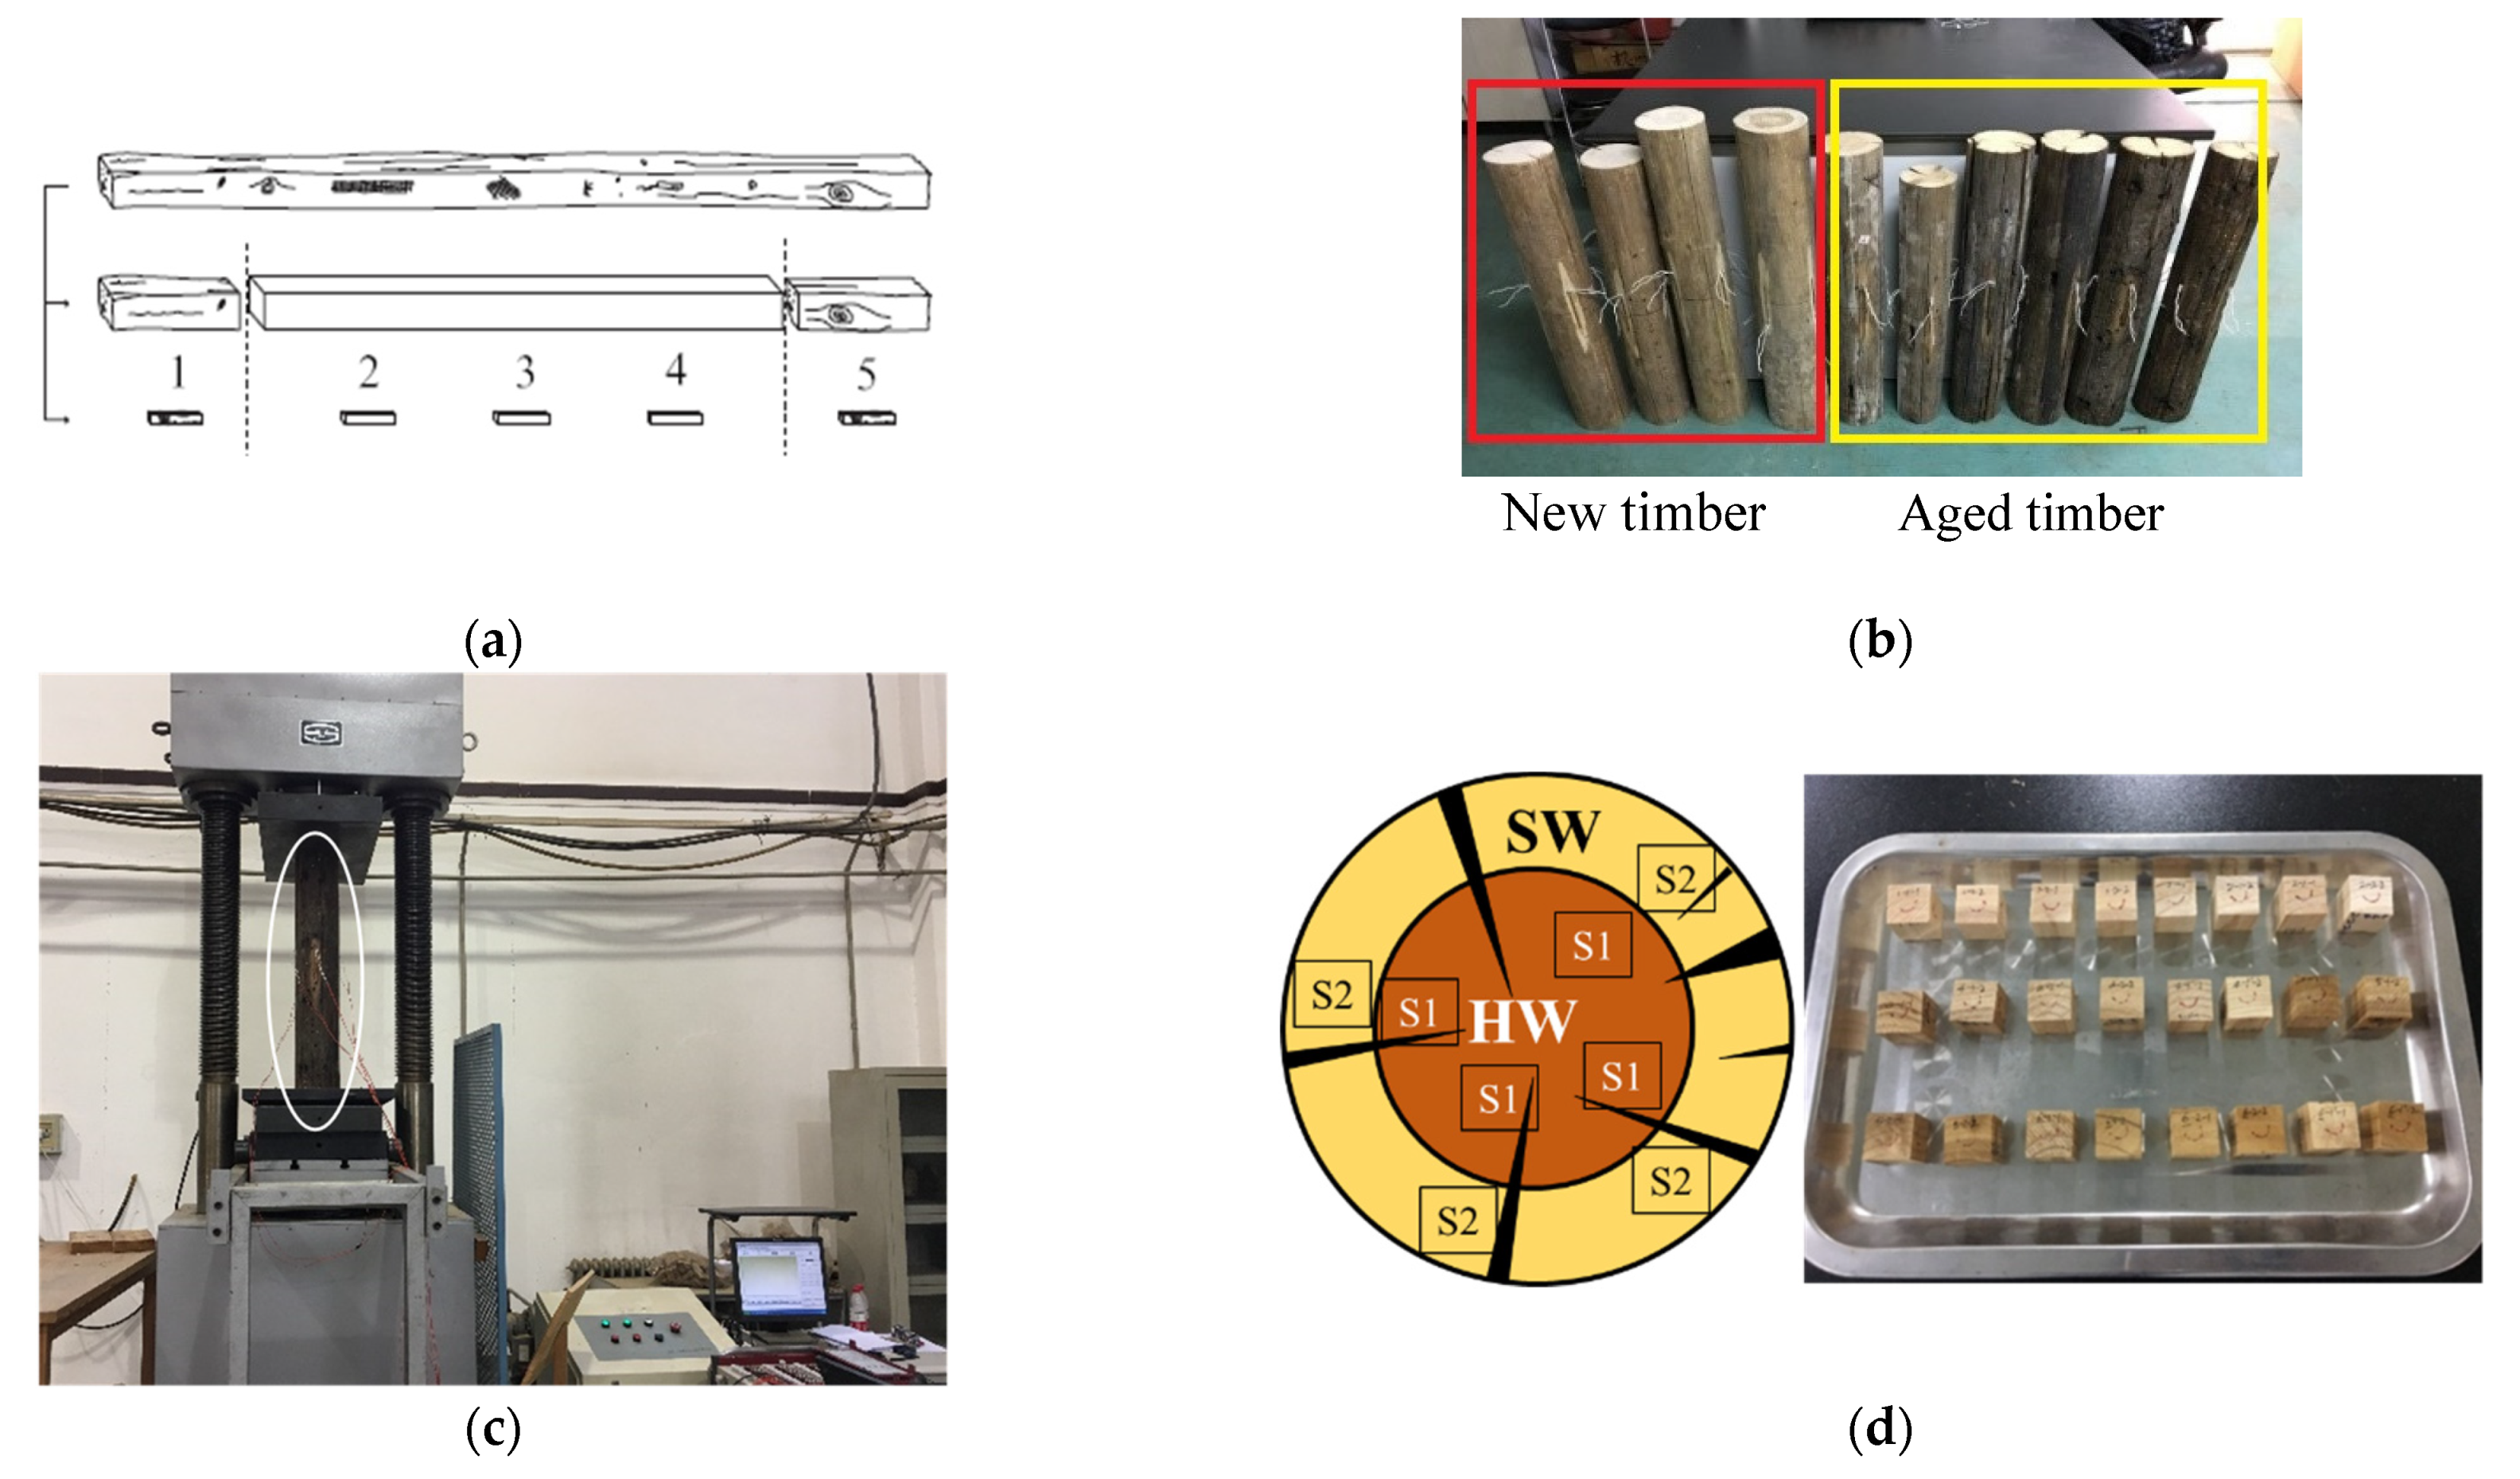
2. Materials and Methods

Test specimens in this study were prepared from both aged and new logs with natural defects, similar to those used in actual traditional heritage timber structures. They were prepared according to standard [31], and we refer to them as ‘standard specimens’ instead of ‘clear specimens’. The standard specimens shown in Figure 2a were prepared from both aged and new logs of the HW and SW.
A schematic diagram of the compressive strength ratio γ σ , sampling position λ , and service life t is plotted in Figure 2b. This is a schematic description of the methodology proposed in this report, indicating what could be done if additional statistical data was available for comparison. γ σ denotes the ratio of average parallel-to-grain compressive strength of the log sample, f m , to that of the standard specimen, f c . The definition of sampling position, λ , is depicted in Figure 2a. The parallel-to-grain compressive strength, f m , of a log sample in a specific traditional timber structure can be estimated from Figure 2b using the compressive strength ratio, γ σ , for a given service life, t , and sampling position, λ , of standard specimens tested in the experiment. Thus, only the service life of the timber member is needed to obtain its strength, with no need to obtain test samples from the aged timber structure.
Chinese fir is a popular wood species used for construction in southern China. The properties from five log samples, three aged and two new, are included in this study. The aged samples shown in Figure 3b are from columns in a hundred-year-old building in Yangzhou City, Jiangsu Province, China (t = 100); as shown in Figure 3a, the aged columns come from the exterior of the house. They were taken down in a refurbishment program, due to localized decay or cracking. Decay is caused by fungi that invade and multiply in the wood. Cracks are a detachment of wood fibers caused by external forces or changes in temperature and humidity. As the climate change over the last hundred years is unknown, and the effect of temperature and humidity on building components is cumulative, we have assumed that the rate of decay in wood is uniform and that the extent of decay caused by these factors will increase linearly with time. The new samples (t = 0) shown in Figure 3c are from the timber market in Yangzhou City, Jiangsu Province, China.
The dimensions of the log samples are shown in Table 1. Each log sample was cut into five equal segments labelled as #1 to #5, as noted in Figure 4a. The segments were prepared before sampling without discrimination based on natural defects in the wood, such as the rough surface of aged logs, dark coloring from carbonization, and cracks on the surface spanning the whole length of the log. The state of natural decay of the wood at the log ends could not be quantified due to the increased width and deep cracks in the aged logs, as shown in Figure 4b.
Segments #2 and 4 in Figure 4c were reserved for log tests, and they were 12R in length (R is the mean radius of the segment). The parallel-to-grain compressive strength was obtained according to standard [31], with a loading rate of 1.0 mm/min. Segments #1, 3, and 5 were blank-sampled, arch-shape-cut, and finish-cut, according to standard [31] for the standard specimen tests. The number of prepared specimens and their dimensions are listed in Table 2. Specimens could only be obtained from locations S1 and S2, as shown in Figure 4d, due to constraining damages and cracks in the cross-section extending from the surfaces of the timber logs. Specimens type S1 are from the HW in the dark area, near the center of the section. Specimens type S2 are from the SW in the light area, close to the outer edge of the section. Specimens S1 and S2 have no radial sampling gradient, limited by the size of the log, and are referred to as being sampled at regions λ = 0.00 and λ = 1.00, respectively, as shown.
The numbers of S1 and S2 specimens were approximately the same and were taken from the same locations of both the aged CL and new CL log samples. These specimens are representative without differentiation of the decaying timber at the end of log sample and the well-preserved timber in the middle. This study focuses on a heritage wooden building where the history of the timber and the effect of material defects and decay are equally important. The standard specimens prepared from the aged timber log were not clear standard samples. They were samples with natural defects. All the standard specimens carry some natural defects. Therefore, the differences in their statistical strengths may mainly be due to age. The standard specimens and log segments were first placed in an environment-controlled room in Beijing Jiaotong University with a 20 ± 2 °C ambient temperature and relative humidity of 65 ± 5% before testing, until the equilibrium MC (12%) of timber was reached [32].

3. Results and Discussion

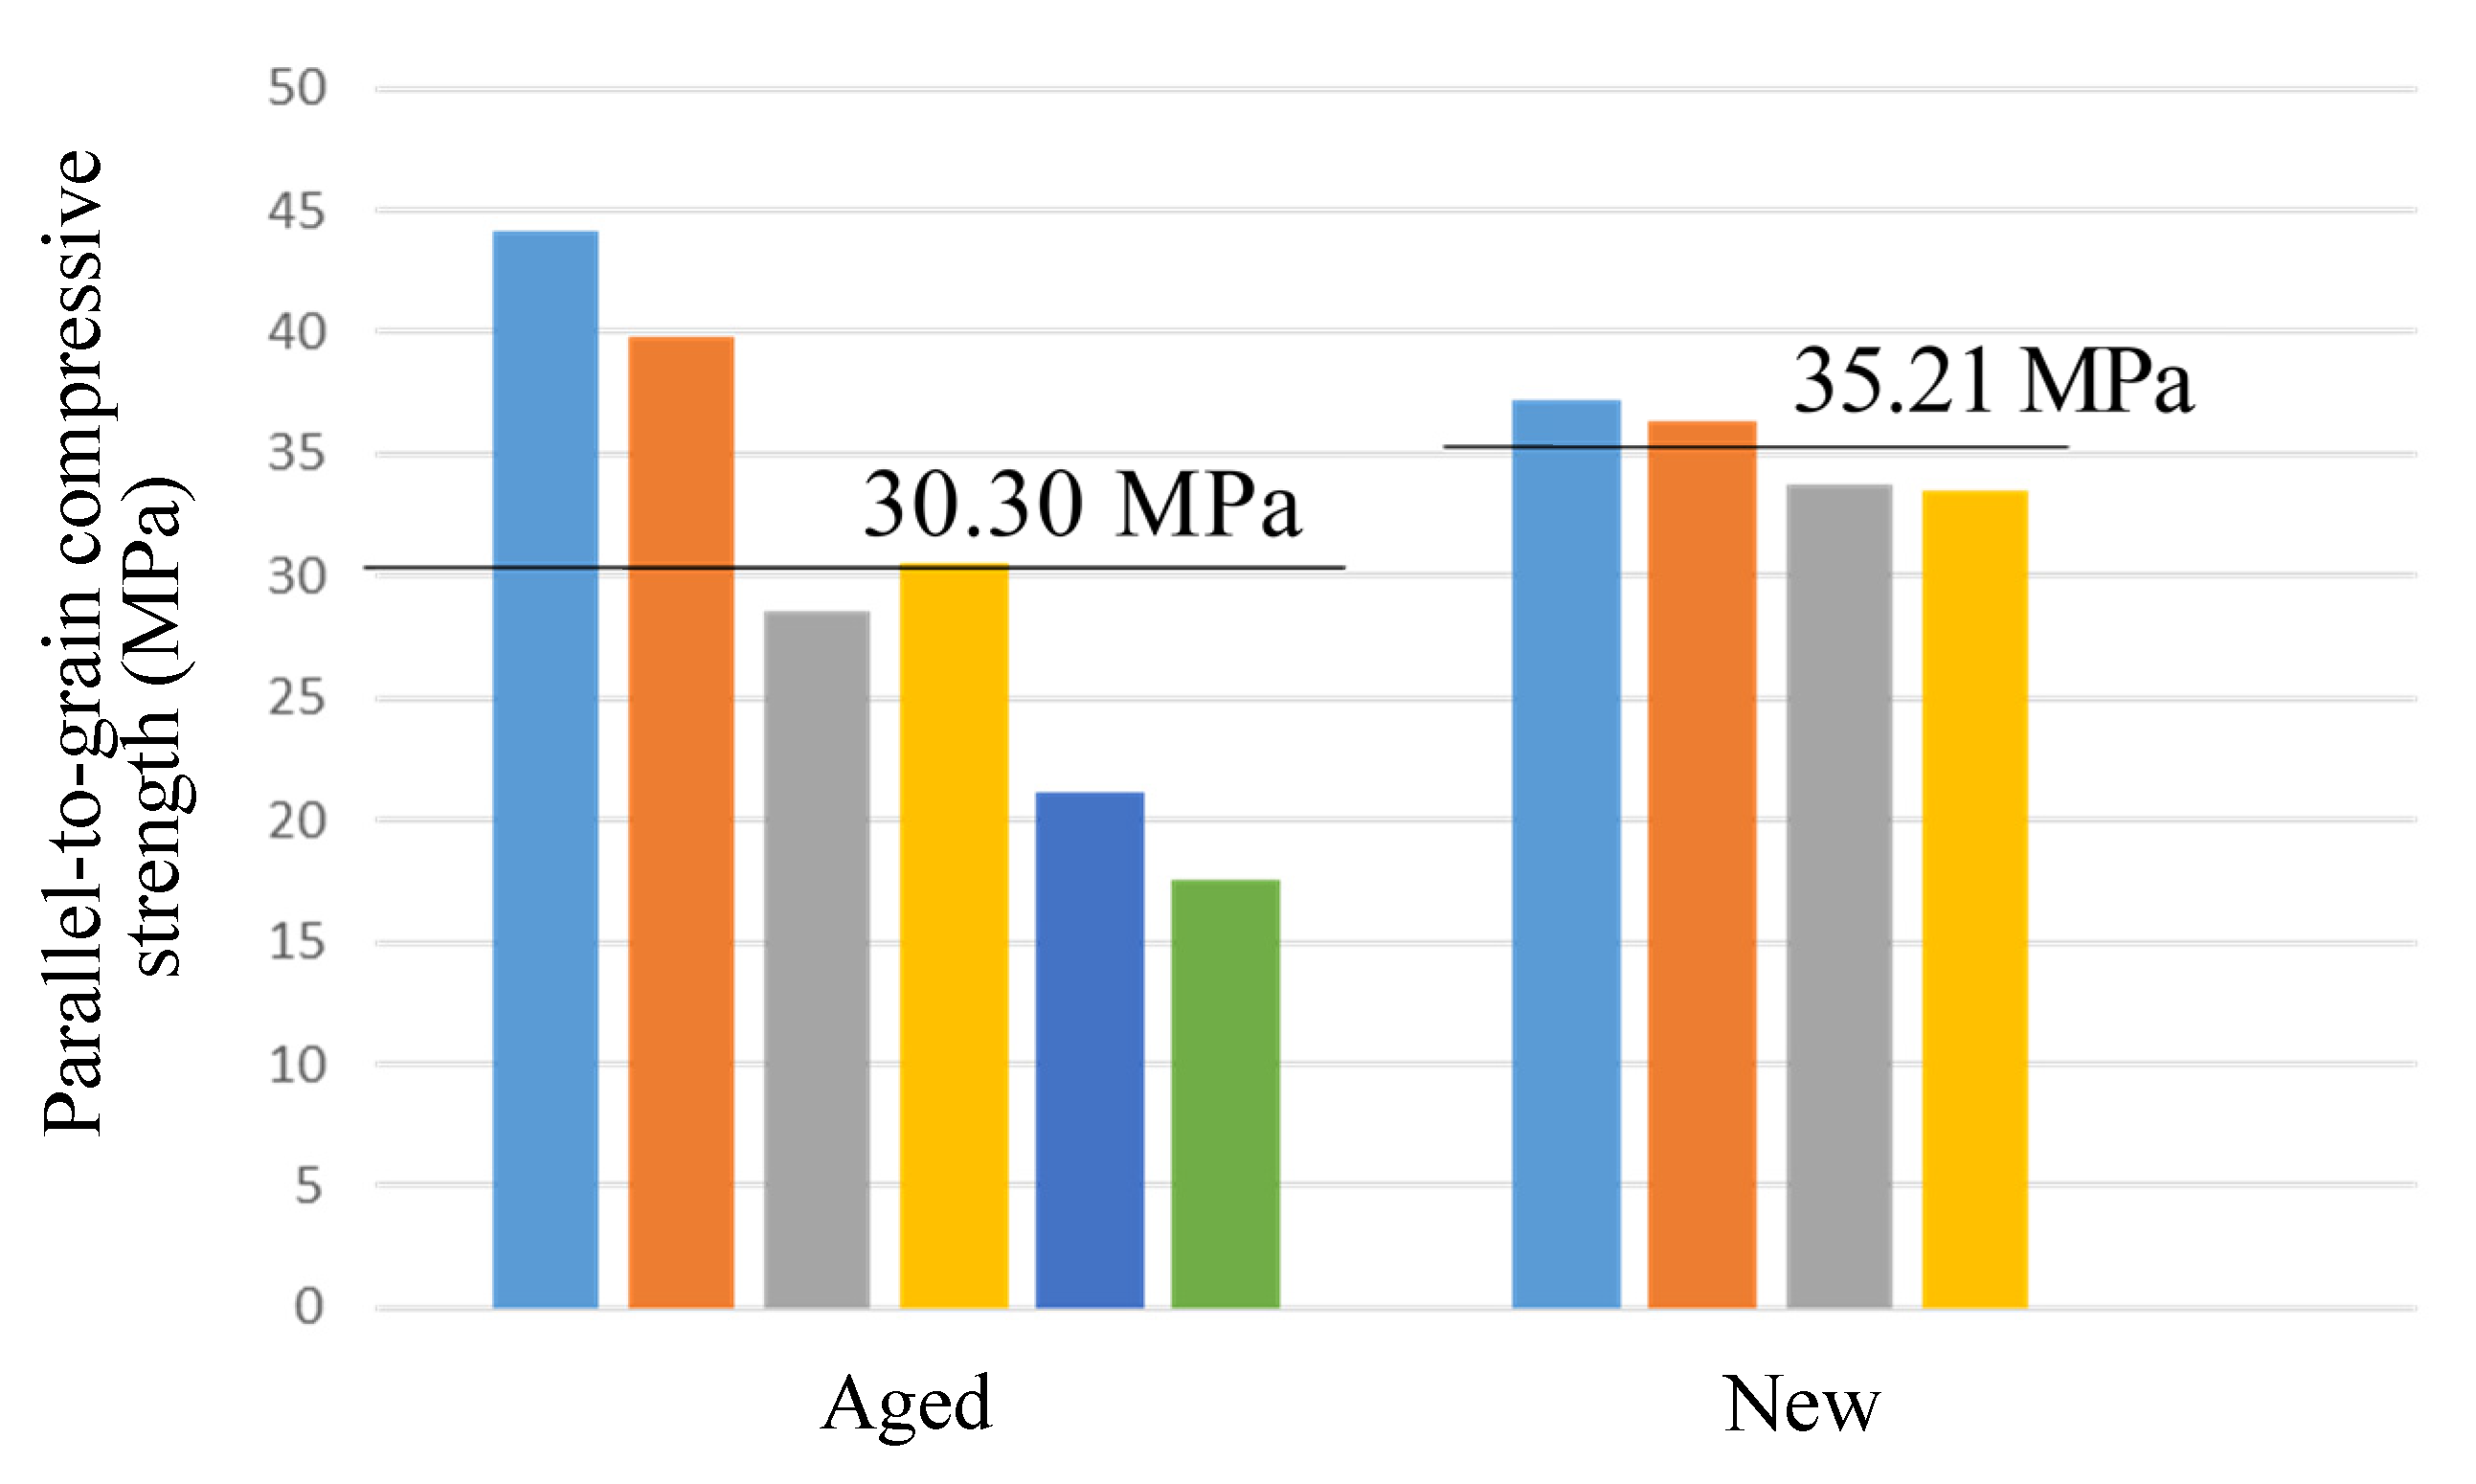
3.1. Test Data Analysis

The sample mean (denoted by an overhead bar) and standard deviation (SD) of parallel-to-grain compressive strength (fc,0) and material density (ρ) of standard specimens and the parallel-to-grain compressive strength of the logs (fc,0,log) are listed in Table 3 and Table 4, respectively, and fc,0,mean is the average value of fc,0,log. The percentage difference δ D in Table 3 is defined as:
δ D = ( x ¯ H x ¯ S ) / x ¯ S %
where x ¯ H and x ¯ S denote the respective sample means from the HW and SW. The differences in sample means for the HW and SW, respectively denoted δ H and δ S , between the aged CL and new CL are:
δ H = ( x ¯ HA x ¯ HN ) / x ¯ HN %
δ S = ( x ¯ SA x ¯ SN ) / x ¯ SN %
where x ¯ HA and x ¯ SA are the sample means for the HW and SW of the aged CL, respectively, and x ¯ HN and x ¯ SN are the sample means for the HW and SW of the new CL, respectively.
The percentage difference, δ L , in Table 4, is defined as
δ L = ( x ¯ A x ¯ N ) / x ¯ N %
where x ¯ A and x ¯ N are the sample means for the aged and new CL log segments, respectively.
The variations in the parallel-to-grain compressive strengths of the aged CL in Figure 4b was noted as small, not exceeding 2.0%, and was significantly less than that of the new CL. The strength of the HW of the aged CL was nearly 20.0% larger than that of the new CL. There was almost no difference (less than 1.0%) in the strengths of SW in the aged versus new CL.
Aged timber has experienced long durations of permanent axial load with residual compressive parallel-to-grain deformation [2,3]. The deformation induced by the axial load was assumed to be uniform across the whole cross-section, and the density of the HW and SW had a difference less than 2.0%. The variation in density along the radial direction of the new CL was noted to be opposite to that of the aged CL, with the density of the HW being 10.70% less than that of SW. The parallel-to-grain compressive strength of the HW in the new CL was approximately 15.09% smaller than that of the SW. However, the parallel-to-grain compressive strength of the aged log segments was less than that of the new log segments, as listed in Table 4, with δ L = 13.94 % < 0 , δ H = 19.47 % > 0 , and δ S = 0.45 % < 0 for the standard specimens listed in Table 3. This is due to the higher density of the SW compared with that of the HW, in new CL [33]. The aged and new logs in Table 4 are from a limited number of samples with natural defects according to their age, and the standard deviations of aged and new CL are 9.40 and 1.58, respectively. Significant differences of dispersion between the aged and new CL can be noted from Figure 5.

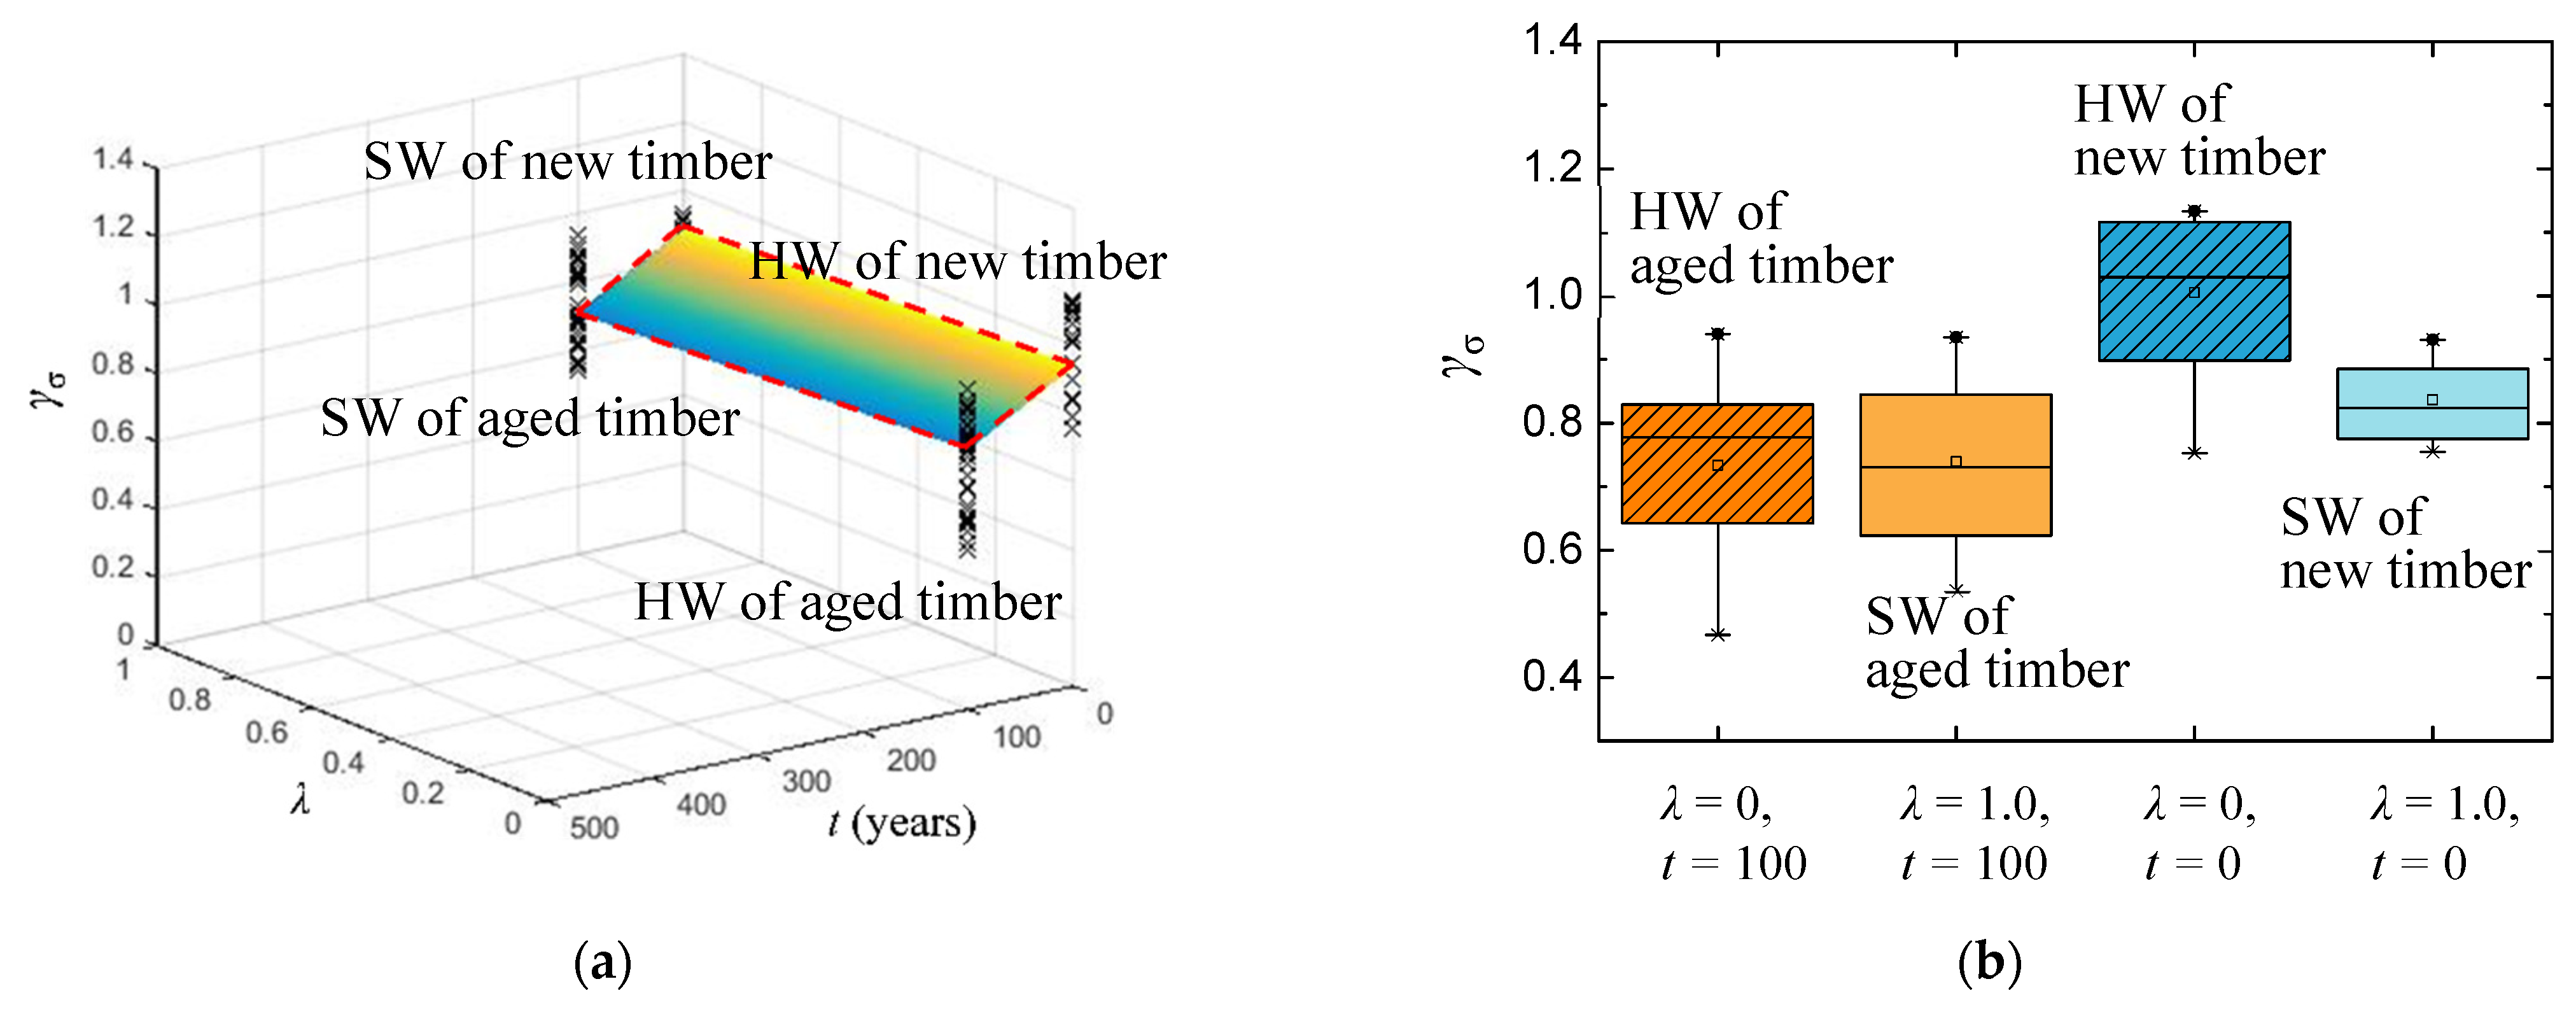
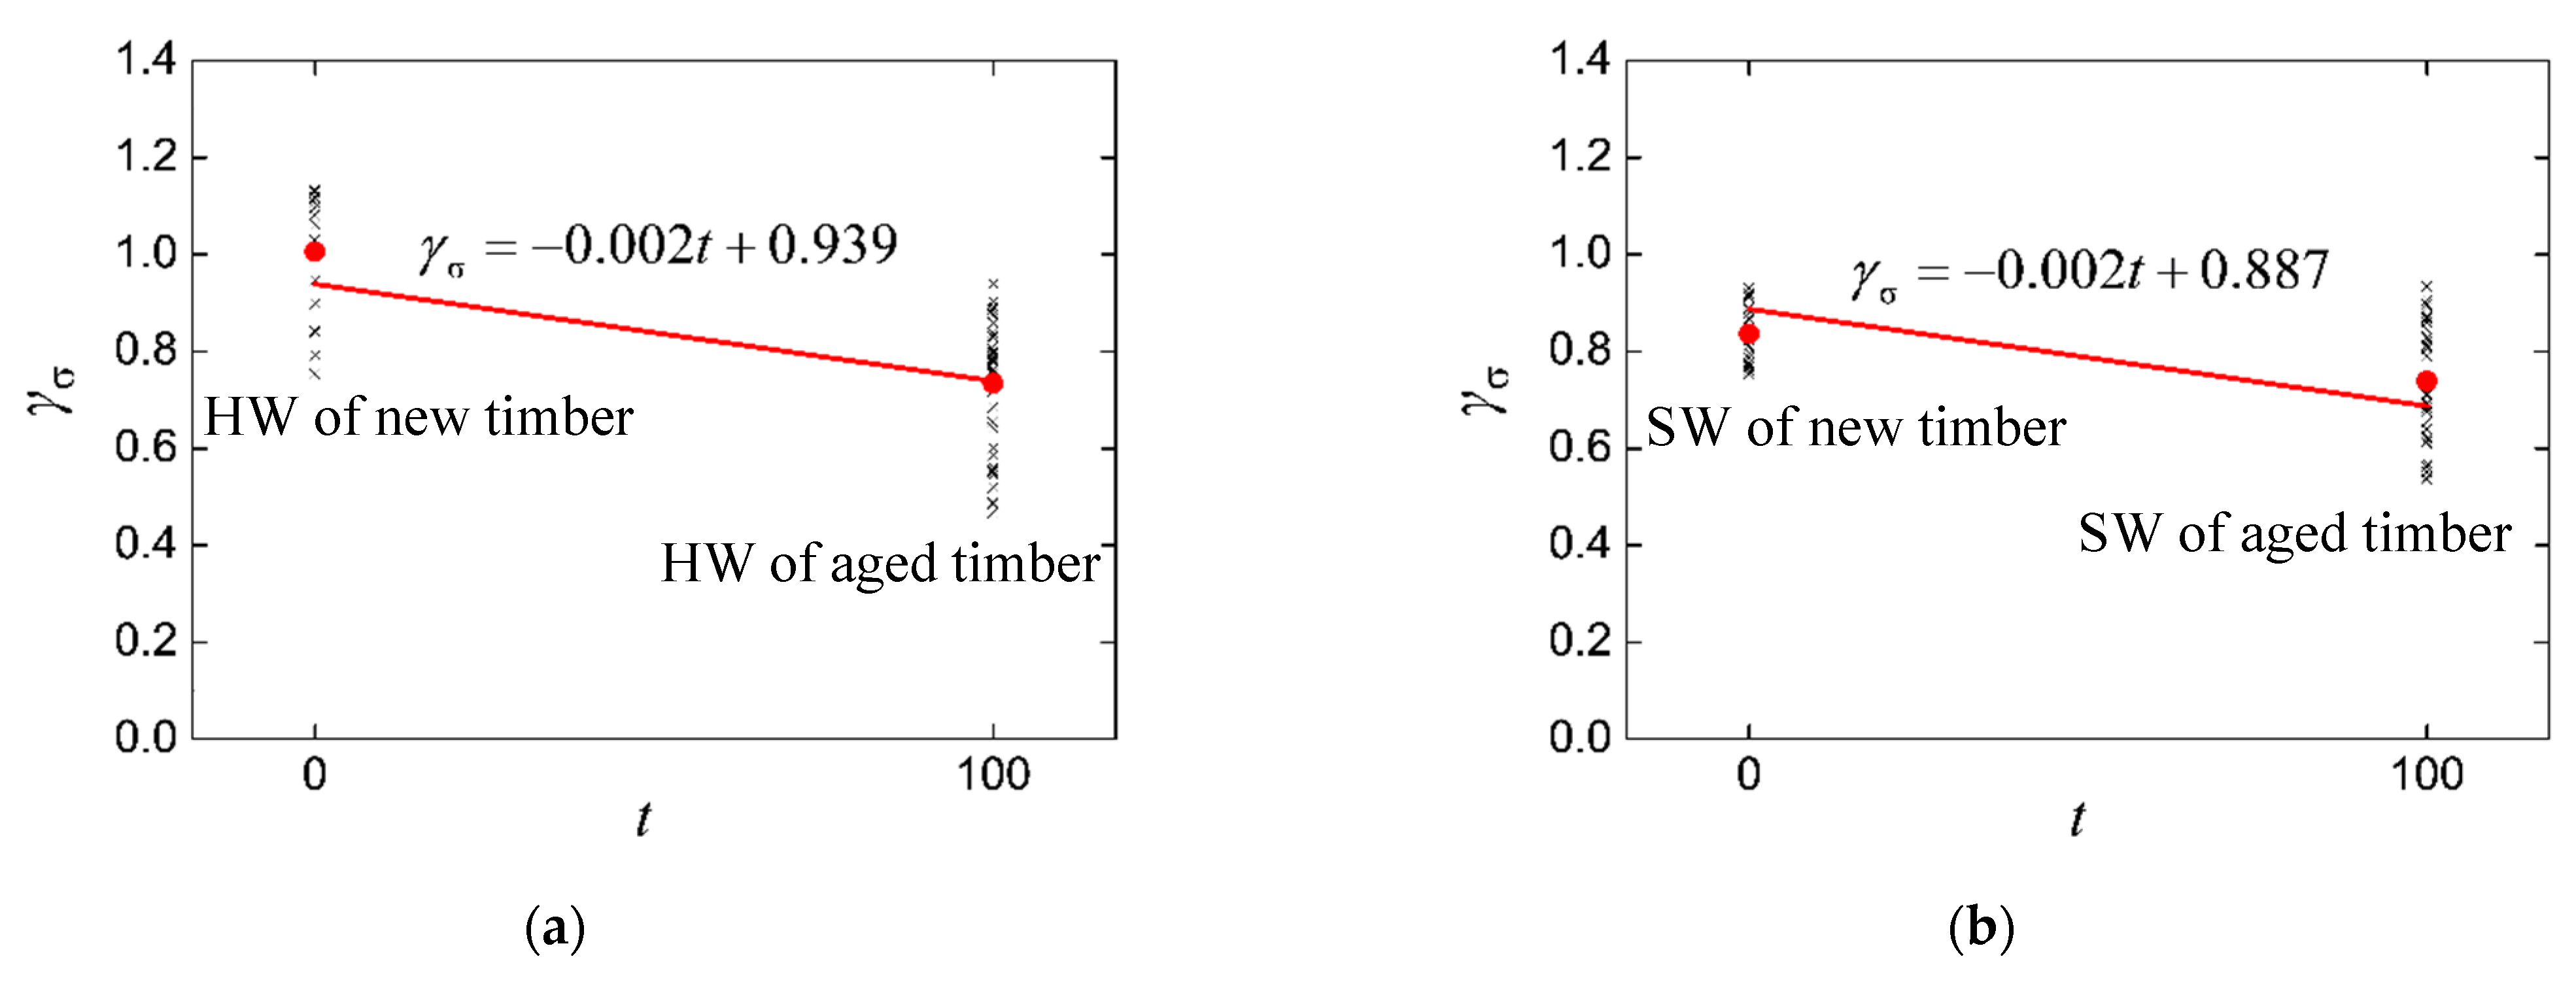
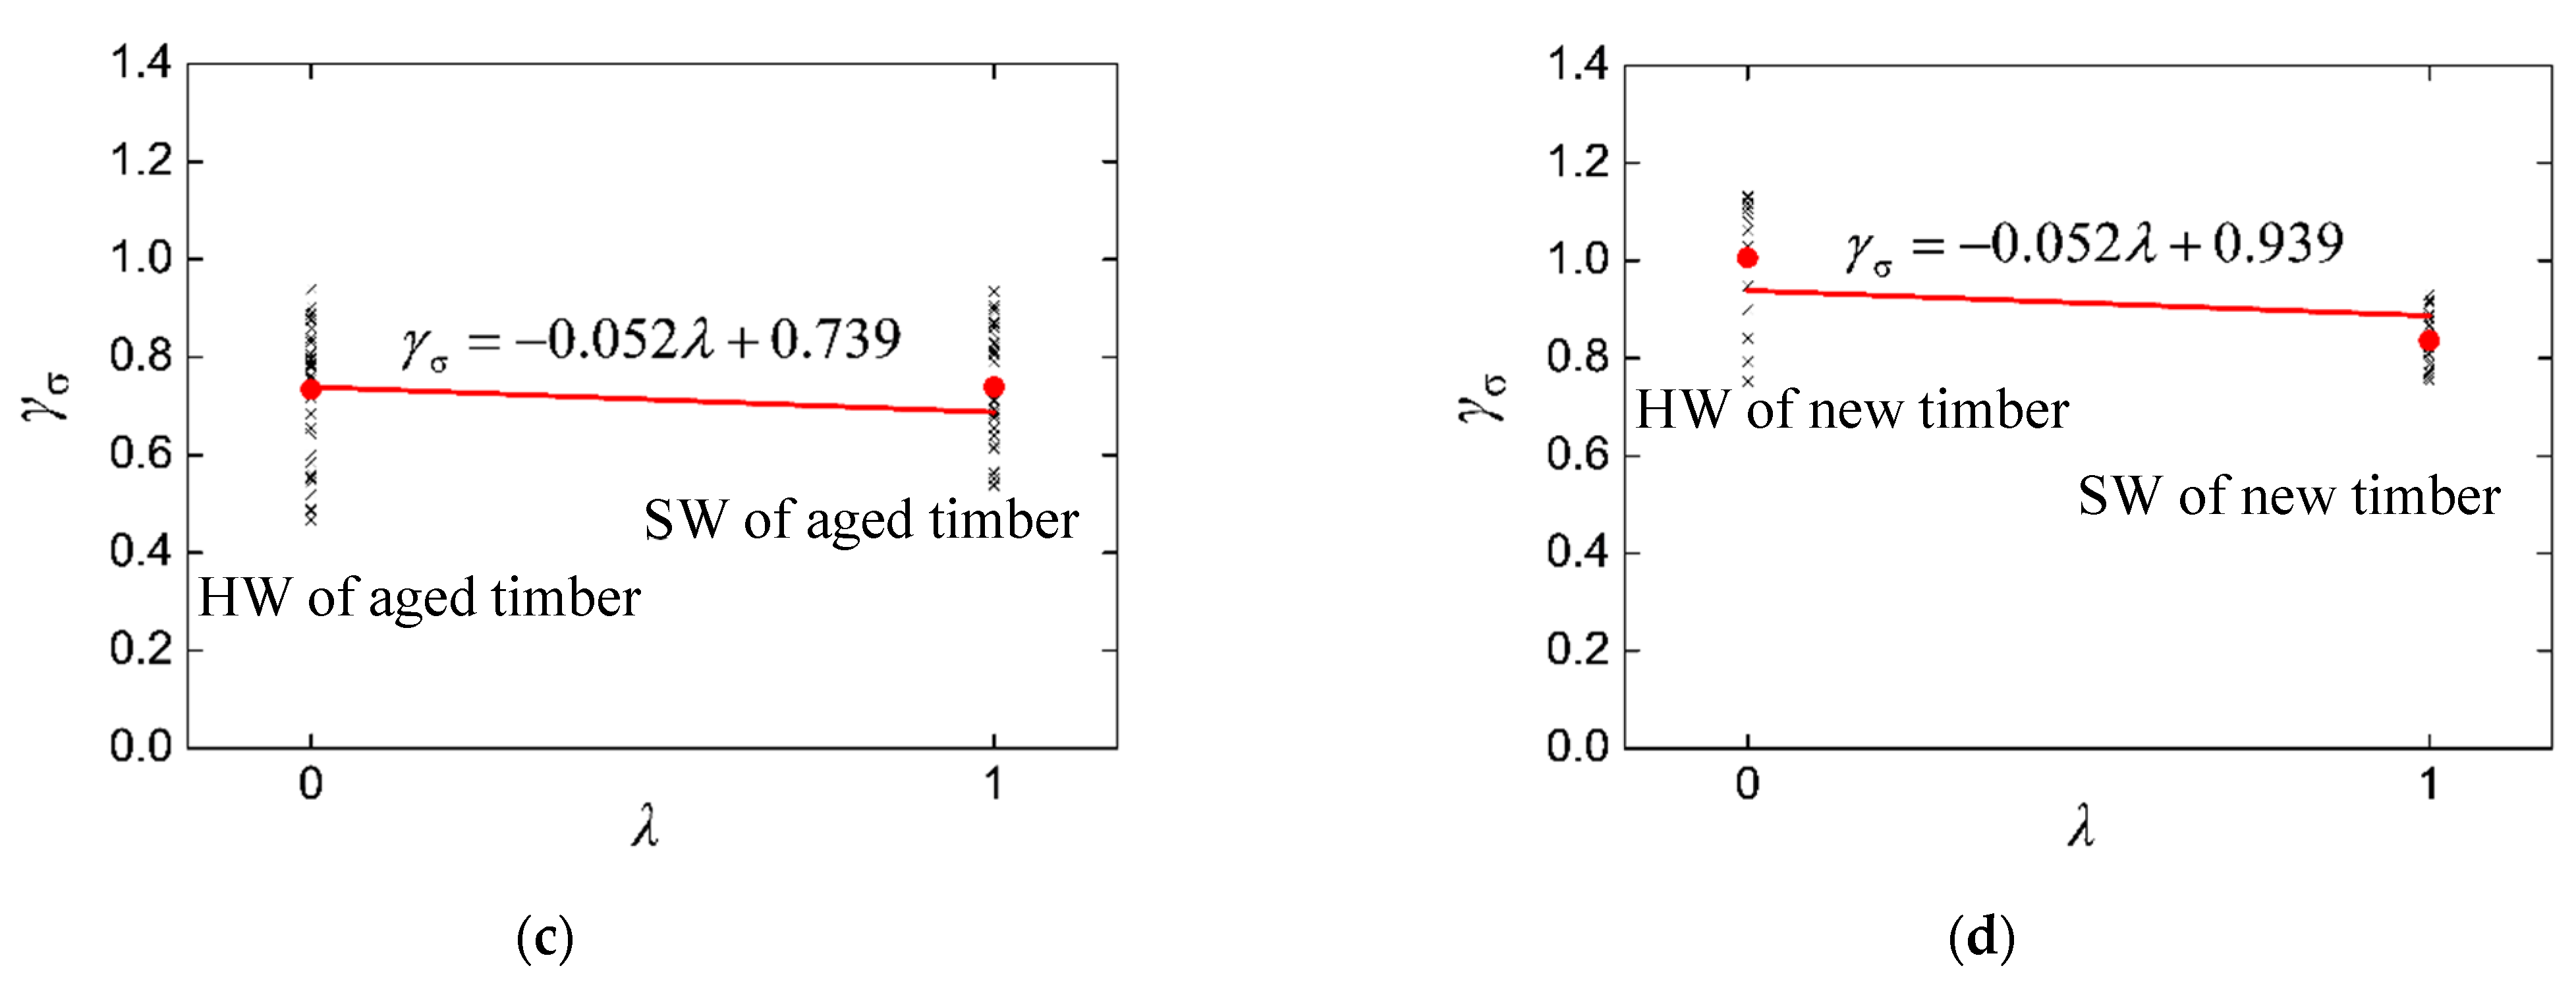
3.2. Relationship of Compressive Strength

The mechanical properties of a log are often extrapolated from those of the standard specimens. The compressive strength ratio, γσ, is calculated for each log sample in Table 1 using:
γ σ = f m / f c
where f m is the parallel-to-grain compressive strength of segments of the log sample. The calculated γσ is separated into four groups, according to age of samples (t = 0 for the new CL and t = 100 years for the aged CL) and sampling position (λ = 0 for HW and λ = 1.0 for SW) of the standard specimens. The 3D plot and boxplot of γσ are shown in Figure 6. In the boxplot, symbols ‘•’ and ‘×’ outside the box represent the maxima and minima, respectively; the symbol ‘▫’ within the box represents the sample mean of the data; the upper and lower edges of the box represent the upper and lower quartiles of the data, respectively; the solid line within the box represents the median. Our results show that the distributions of γσ of the HW and SW in the aged CL are similar. The maxima and range of data of the HW in the new CL are significantly higher than those of the other three groups, which is shown in Figure 6b. The distribution of γσ of the SW in the new CL is relatively centralized.
The scattered points of γσ in Figure 6a can be fitted to a linear plane distribution using the least-squares method:
γ σ = 0.052 λ 0.002 t + 0.939
where λ denotes the relative distance between the sampling location of the standard specimen and the centroid of the timber cross-section. The equations defining the four edges of the plane (dashed lines in Figure 6a) are shown in Figure 7. The solid dots in the plots represent the sample means of the data groups. Each sample mean is close to one end of the straight line, indicating a good representation of the fitted plane.
The fitted distribution can be used to estimate the parallel-to-grain compressive strength of the log samples in this study. The estimated results using Equations (5) and (6) are listed in Table 5. The average difference between the estimated and experimental compressive strengths of the HW and SW were 12.70 and 11.40%, respectively, and this was considered satisfactory given the large variability in the properties of the aged CL [34].
The relationship between the parallel-to-grain compressive strengths of the clear specimens and timber logs, recommended by the standard [35], is
f m - CABP = K   f ¯ c
where f m - CABP is the estimated compressive strength of the log sample; f ¯ c is the sample mean strength of clear specimens obtained from the same log sample; K is the influence coefficient defined as
K = K P K A K Q
where K P is the equation accuracy affecting coefficient that is recommended in the design code. K P = 1.0, as recommended in the design code. K A is the ratio of the actual geometric quantity to the standard value of the same quantity. K Q is the reduction factor of material strength, defined as the product of influence coefficient of natural defect, K Q 1 ; drying defect, K Q 2 ; size, K Q 3 ; and a reduction factor due to long-term load, K Q 4 :
K Q = K Q 1 K Q 2 K Q 3 K Q 4
The recommended values for the above coefficients are shown in Table 6 [35]. It is noted that the specimens have defects in this study; therefore, the coefficient of natural defect, K Q 1 , has the recommended value of 1.00 instead of 0.66 [35]. As the strengths obtained have already included the influence of load duration on aged timber members, the influence of long-term load, K Q 4 , was not considered for aged CL, with K Q 4 = 1.00 .
The calculated f m - CABP and the test results of the log samples are compared in Table 7. The mean of the difference δ M is 28.50%, which suggests that the test results were significantly larger than the estimated values. A larger difference denotes a larger safety margin and more conservative estimate for the log samples, compared with that from [35].

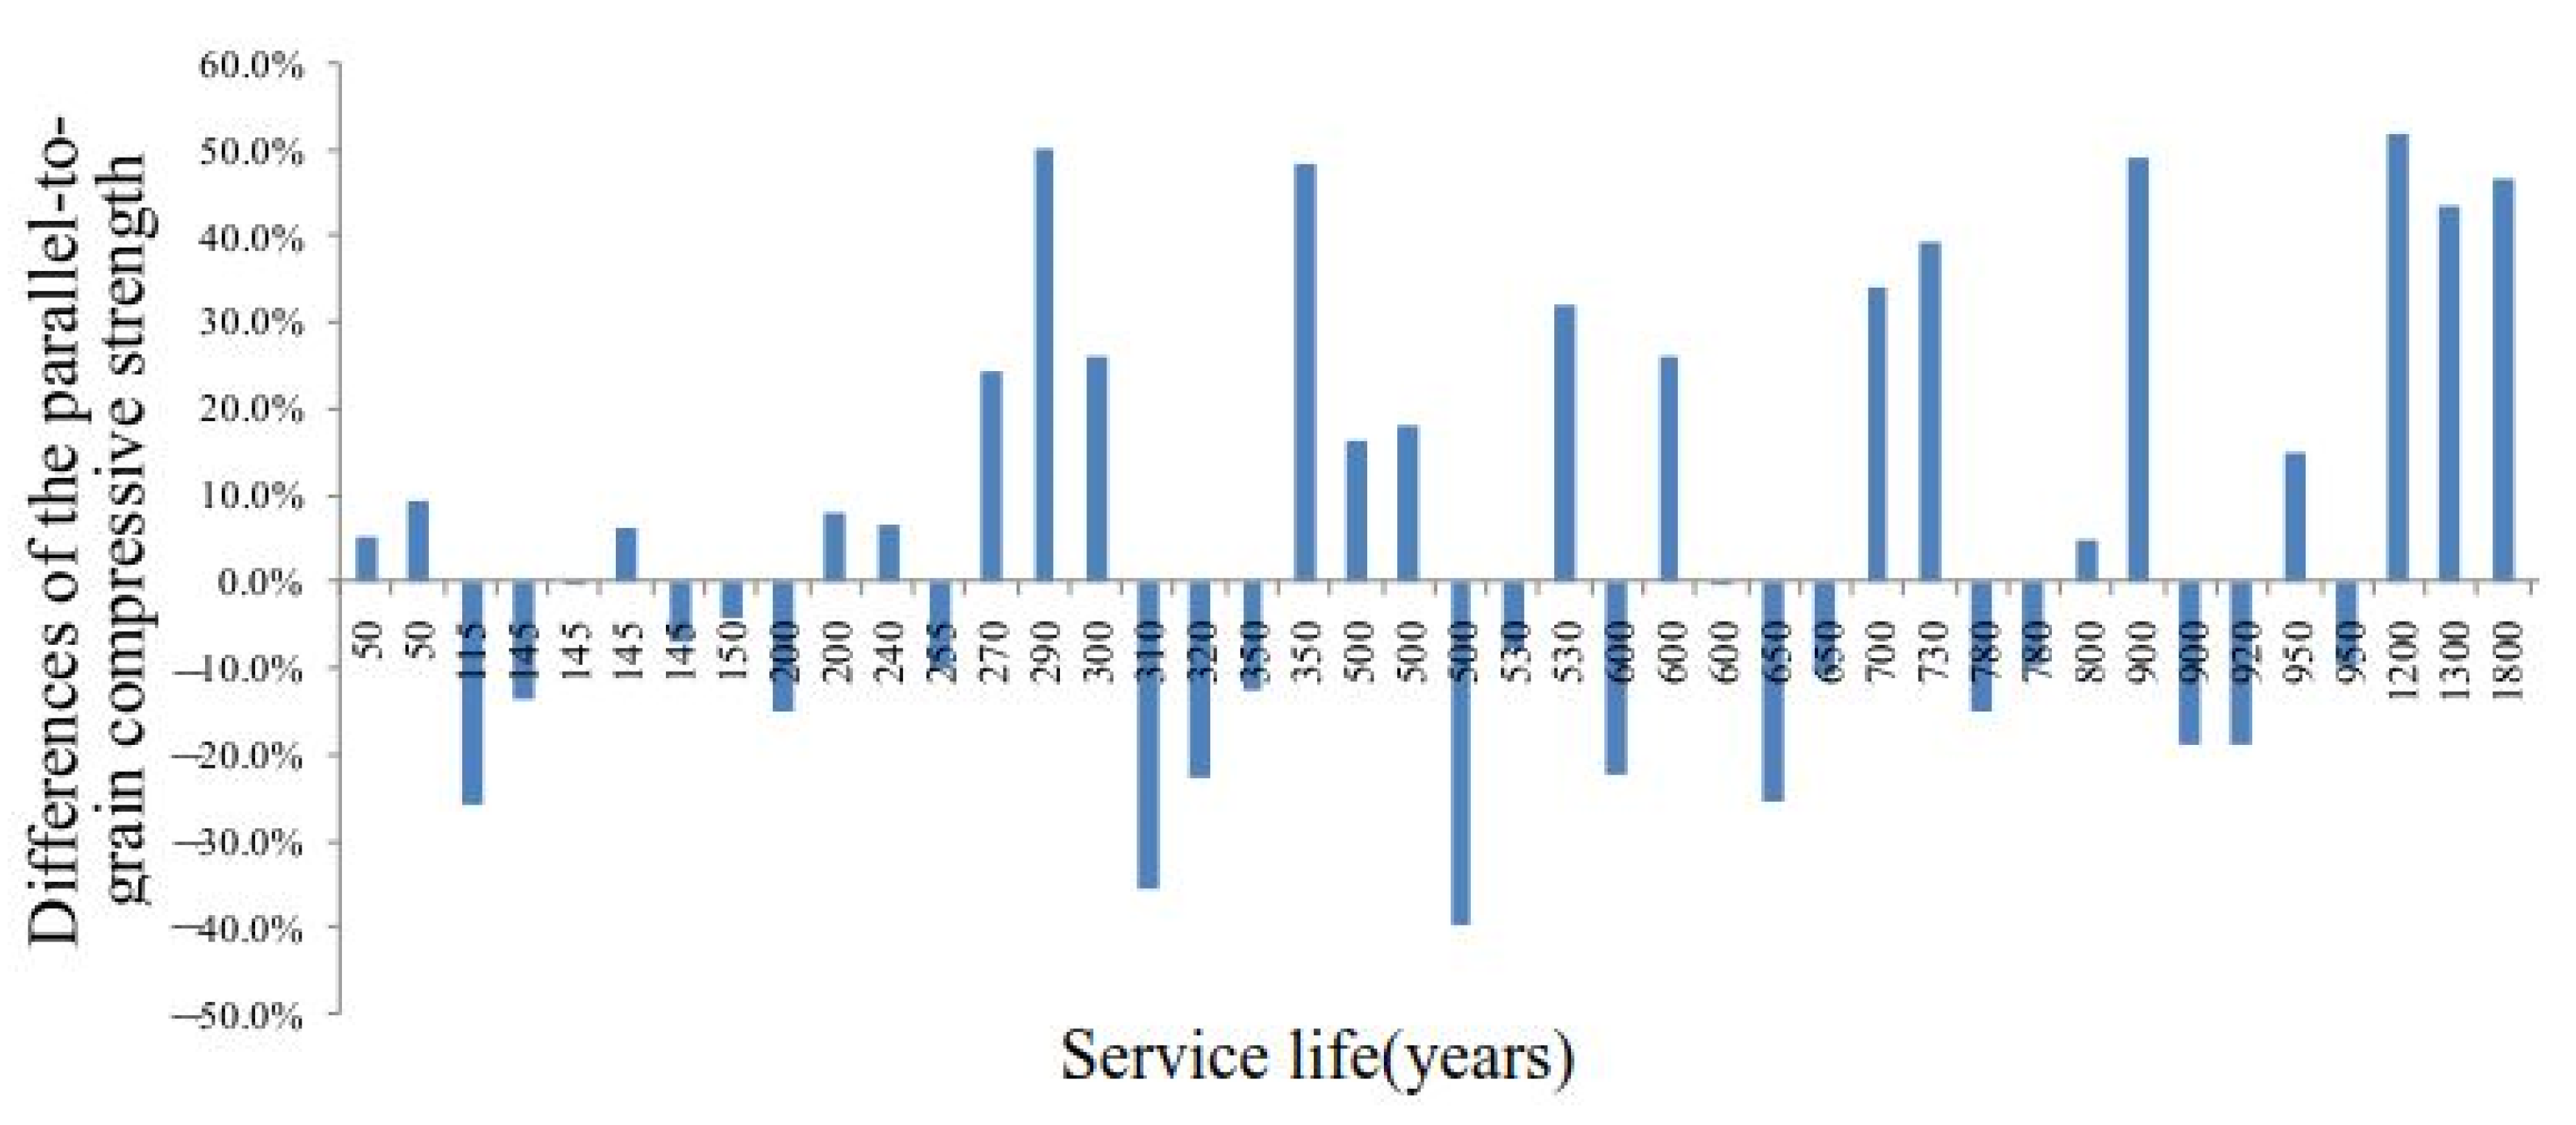
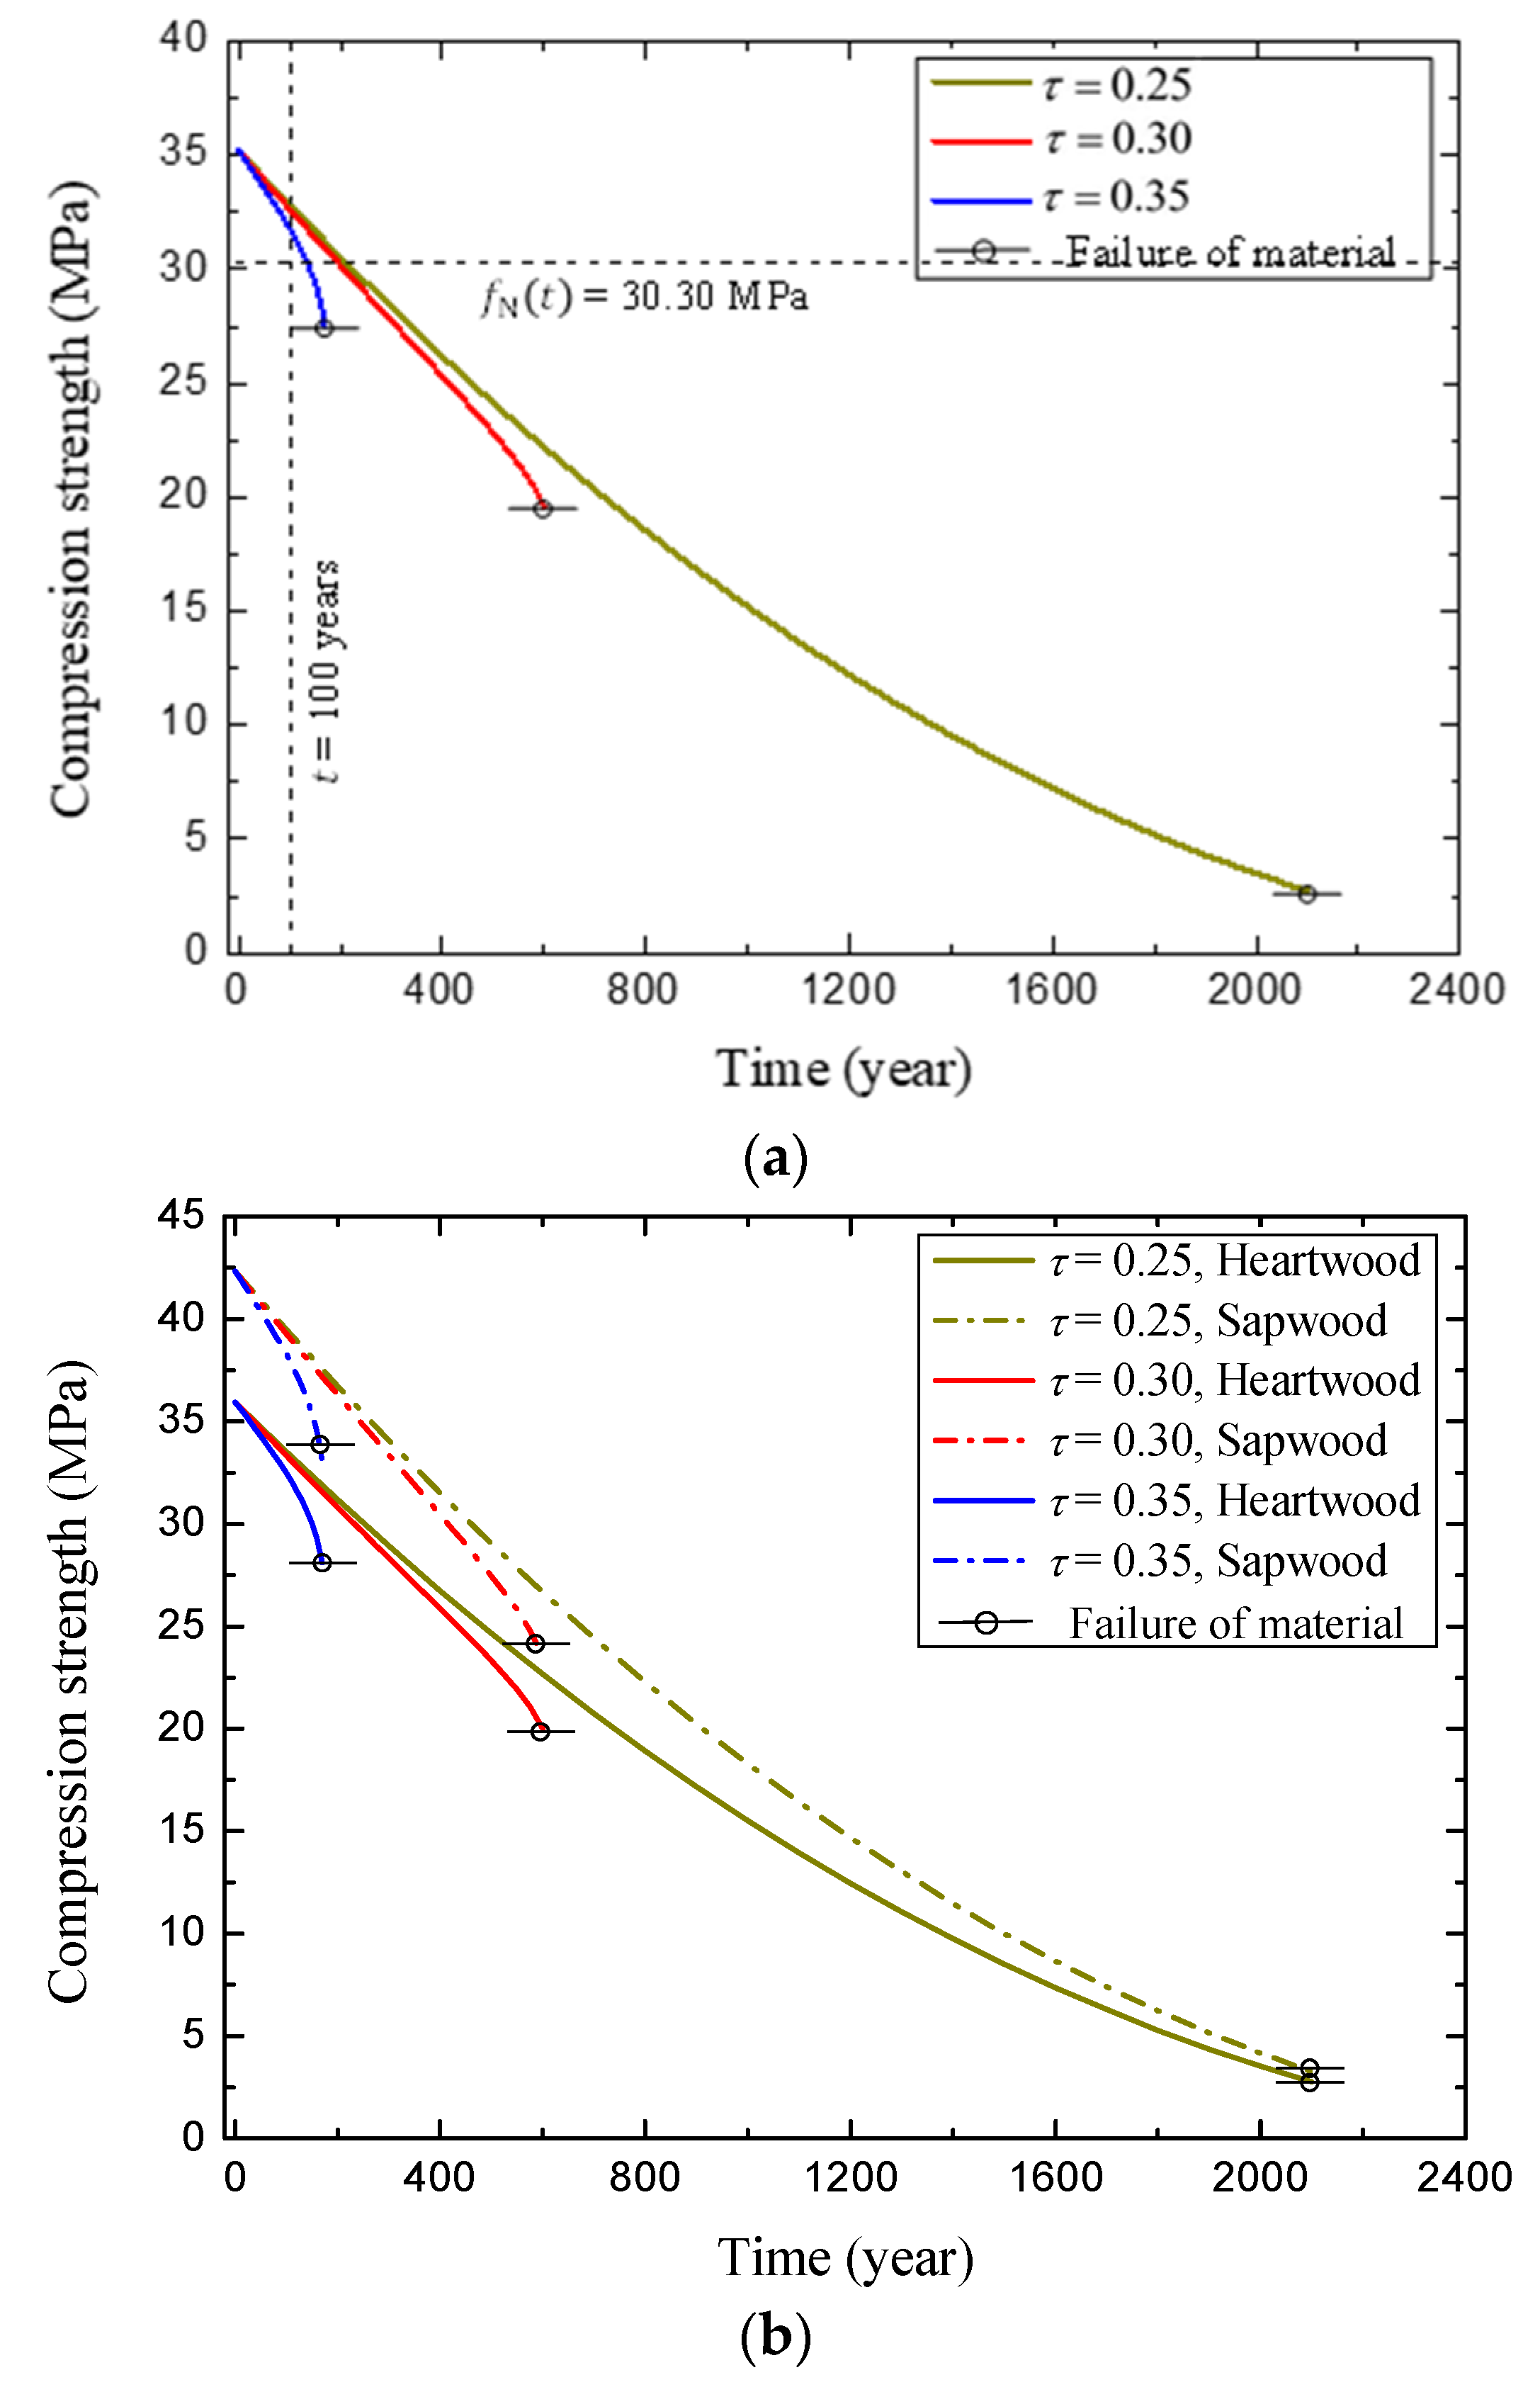
4. Degradation of Compressive Strength with Time

The resistance of timber structures is mainly dependent on the effects of temperature, relative humidity, loading, and the compressive strength of the material. When these factors are assumed to be independent, a multivariate time-dependent model on the bearing capacity of compression timber member can be formulated, considering the load duration and the degree of timber decay, as [36]
f N ( t ) = f 0 φ f ( τ , t ) φ A ( δ ( t ) )
where f N ( t ) is the compressive strength at time, t; f 0 is the initial compressive strength of timber; φ f ( τ , t ) is the time-dependent model of the design strength, including the load duration effect and stress level, τ , defined as the ratio of actual stress to compressive strength; φ A ( δ ) is the time-dependent function of the geometric parameter of component sections with decay [4]; and δ ( t ) is the time-dependent function of the thickness of the decay layer of timber, as shown in Equation (13).
A model of the cumulative damage of timber, considering effects of temperature and humidity, can also be derived based on a large number of experiments and Gerhards’ cumulative damage model, as [36,37]
φ f ( τ , t ) = 1 B ln { 1 + [ 1 t exp ( A + τ B ) ] ( exp B 1 ) }
where parameters A = 13.9526 and B = 25.0498 , with the stress level, τ , usually not exceeding 0.35 in a traditional timber structure [36].
The time-dependent function of the geometric characteristics of a component section under a long-term load can be obtained from [36] as
φ A ( δ ) = ( 1 2 δ D ) 2
where D is the diameter of the compressed timber member.
The time-dependent function of the thickness of the decay layer of timber may be taken as [38]
δ ( t ) = δ 0 2 ( 1 + t T 0 ) α
where δ 0 is the existing thickness, T 0 is the age of the compression component up to the present, and α is a parameter of the rate of degeneration of the thickness of the metamorphic layer [4].
The time-dependent model for a log of the new CL, as of today, is discussed below. Table 4 shows that f 0 = 35.21   MPa for the new CL. D = 149.5   mm is the mean value of the new CL logs from Table 1. Other parameters and coefficients are assumed to be the same as those in [36], with T0 assumed to be one year without any decay layers, δ 0 = 0.05   mm , and power index α = 1.0 . Substituting all of the above parameters into Equations (11)–(13), the time-dependent model for parallel-to-grain compressive strength can be obtained, as shown in Figure 8a. The curves show that the rate of degradation of parallel-to-grain compressive strength becomes larger with the stress levels τ with larger residual strength.
The residual strength ratio, γ , is defined as the ratio of failure strength to initial strength, f o = 35.21   MPa , and the calculated values of γ are listed in Table 8. It is noted that γ is sensitive to the stress level, with a positive correlation. Figure 8a shows that the estimated reduced strength for t = 100 years is larger than the experimental strength obtained from the log segment of aged CL (30.30 MPa in Table 4). This may be because the effects of temperature and humidity have not been taken into account in the cumulative damage model [39].
The compressive strengths of the SW and HW of the new CL are considered separately, i.e., the initial strength of timber is taken as the compressive strength of the HW and SW in Table 3 ( f 0 H = 35.96   MPa and f 0 S = 42.35   MPa , respectively), whereas the other parameters are the same as those used previously. The time-dependent models are plotted in Figure 8b. The degradation law of compressive strength and stress level is found to be consistent with Figure 8a. Although the initial stresses of the HW and SW are different, both degradation curves gradually converge to the same value over time. The smaller the stress level, the closer the failure strength of the HW to that of the SW. Both the HW and SW may fail under the same stress level if it is low enough.

5. Conclusions

The parallel-to-grain compressive strengths of the HW and SW of timber was experimentally studied using test specimens sampled from appropriate locations on hundred-year-old log segments. We estimated the ratio between the compressive strength of standard specimens and that of the log samples, as a function of time and sampling location. The time-dependent models of the compressive strength of both the SW and HW were also studied. Based on our findings, we made the following conclusions:
(1)
The variation of compressive strength of the aged CL in the radial direction was small, not exceeding 2.0%, which was significantly less than that of the new CL.
(2)
The compressive strength of the HW of the aged CL was nearly 20.0% larger than that of the new CL. The compressive strength of the SW of the aged and new CL were similar, with less than a 1.0% difference.
(3)
After the long-term (100 years) action of axial load and environmental effects on the aged CL, the compressive strength of the aged log segments was nearly 14.0% lower than that of the new log segments.
(4)
The fitted model for the estimation of parallel-to-grain compressive strength of the log segments gave estimates with less than 13.0% error, which was better than the estimates calculated based on the Chinese National Standard.
(5)
A lower stress level is associated with similar failure strengths of both the HW and SW. The HW and SW may fail at the same load when the stress level is low enough.

Author Contributions

Q.Y. conceived of and designed the experiments and instructed the paper writing; Y.Z. performed the experiments; C.G. wrote the preliminary paper; K.L. rewrote the paper; J.W. participated in writing the paper. All authors have read and agreed to the published version of the manuscript.

Funding

The work was supported the 111 project of the Ministry of Education and the Bureau of Foreign Experts of China (No. B18062), National Natural Science Foundation of China (51720105005) and Chongqing Science and Technology Bureau (cstc2020yszx-jcyjX0007).

Data Availability Statement

We declare that the materials described in the manuscript, including all relevant raw data, will be freely available to any scientist wishing to use them for non-commercial purposes, without breaching participant confidentiality.

Acknowledgments

The comments from Siu-seong Law and his help in improving the English of this paper are gratefully acknowledged.

Conflicts of Interest

The authors declare that the research was conducted in the absence of any commercial or financial relationships that could be construed as a potential conflict of interest.

Appendix A

Table A1. Summary of published test results on the parallel-to-grain compressive strength of aged timber.
StudyWood SpeciesService Life (years)Parallel-to-Grain Compressive Strength (MPa)
AgedNew
[7,11,40]Zelkova schneideriana65048.064.5
53059.6
35056.4
32049.9
31041.5
24068.7
[6,9,11,40]Platycladus orientalis130045.431.6
120048.0
90047.1
73044.0
70042.4
53041.7
35046.9
[41,42]Tectona grandis180081.555.5
Pterocarpus indicus50079.368.2
[43]Picea abies.30063.0#50.0#
[40]Picea asperata60029.938.6
Cupressus funebris20046.254.3
Larix gmelinii92046.857.6
[44]Larix gmelinii90046.857.6
Pterocarya stenopter60053.942.7
[16,17,18]Zelkova schneideriana25542.847.6
Pinus densiflora11535.327.9
27034.7
29041.9
[45]Larix gmelinii14544.1851.28 *
Pinus sp.14532.7332.75 *
5034.50
Picea asperata14544.1841.57 *
Cunninghamia lanceolata14529.2031.37 *
Pinus sp.5045.4941.60 *
[46]Cunninghamia lanceolata15032.3033.70
[4]Pterocarya stenopter**26.9040.20
[26]Pinus sp.95015%↑
65011% ↓
50018% ↑ #
2008% ↑ #
Pterocarya stenopter95010% ↓ #
78015% ↓ #
78010% ↓ #
600#
Ulmus rubra8005% ↑ #
Note: # denotes the value estimated from figures in the literature; * denotes the value listed in “China Wood Record” [47]; ↑ denotes an increase in strength of the aged timber; ↓ denotes a decrease in strength of the aged timber; ** denotes relevant information is not provided in the literature.

References

  1. Li, T.; Qin, H. Structural analysis and repair of Yingxian wooden tower. Eng. Mech. 2005, 22 (Suppl. S1), 199–212. [Google Scholar]
  2. Becker, P.; Rautenstrauch, K. Time-dependent material behavior applied to timber columns under combined loading. Part I: Creep deformation. Holz Roh-Werkst. 2001, 59, 380–386. [Google Scholar] [CrossRef]
  3. Navi, P.; Pittet, V.; Plummer, C.J.G. Transient moisture effects on wood creep. Wood Sci. Technol. 2002, 36, 447–462. [Google Scholar] [CrossRef]
  4. Yang, N.; Li, P.; Law, S.S.; Yang, Q. Experimental research on mechanical properties of timber in ancient Tibetan building. J. Mater. Civ. Eng. 2012, 24, 635–643. [Google Scholar] [CrossRef]
  5. Li, J.; Wu, Y.; Ma, Y. Functional Wood; Science Press: Beijing, China, 2011. [Google Scholar]
  6. Kohara, J. Studies on the durability of wood I: Mechanical properties of aged timbers. Sci. Rep. Saikyo Univ. Agric. 1952, 2, 116–131. [Google Scholar]
  7. Kohara, J. Studies on the durability of wood III: Mechanical properties of aged timbers. Sci. Rep. Saikyo Univ. Agric. 1953, 4, 98–109. [Google Scholar]
  8. Kohara, J. Studies on the permanence of wood V, shrinkage and swelling of old timbers about 300–1300 years ago. Bull. Kyoto Prefect. Univ. 1953, 5, 81–88. (In Japanese) [Google Scholar]
  9. Kohara, J. Studies on the permanence of wood VI: The changes of mechanical properties of aged timbers. Sci. Rep. Saikyo Univ. Agric. 1954, 6, 164–174. [Google Scholar]
  10. Kohara, J. Studies on the permanence of wood IX: The influence of age on the elasticity of wood. J. Jpn. For. Soc. 1954, 36, 364–368. [Google Scholar]
  11. Kohara, J.; Okamoto, H. Studies of Japanese aged timbers. Sci. Rep. Saikyo Univ. Agric. 1961, 10, 894–899. [Google Scholar]
  12. Kuipers, J. Effect of age and/or load on timber strength. In Proceedings of the 19th CIB-W18/19-6-1, Florence, Italy, 20 September 1986. [Google Scholar]
  13. Rug, W.; Seemann, A. Strength of aged timber. Build. Res. Inf. 1991, 19, 31–37. [Google Scholar] [CrossRef]
  14. Deppe, H.J.; Ruhl, H. Evaluation of historical construction timber. Density and compression. Holz Roh-Werkst. 1993, 51, 379–383. [Google Scholar] [CrossRef]
  15. Fridley, K.J.; Mitchell, J.B.; Hunt, M.O.; Senft, J.F. Effect of 85 years of service on mechanical properties of timber roof members. Part 1. Experimental observations. For. Prod. J. 1996, 46, 72–78. [Google Scholar]
  16. Hirashima, Y.; Sugihara, M.; Sasaki, Y.; Ando, K.; Yamasaki, M. Strength properties of aged wood I: Tensile strength properties of aged Keyaki and Akamatsu woods. J. Jpn. Wood Res. Soc. 2004, 50, 301–309. [Google Scholar]
  17. Hirashima, Y.; Sugihara, M.; Sasaki, Y.; Ando, K.; Yamasaki, M. Strength properties of aged wood II: Compressive strength properties, shearing strength and hardness of aged keyaki and akamatsu woods. J. Jpn. Wood Res. Soc. 2004, 50, 368–375. [Google Scholar]
  18. Hirashima, Y.; Sugihara, M.; Sasaki, Y.; Ando, K.; Yamasaki, M. Strength properties of aged wood III: Static and impact bending strength properties of aged keyaki and akamatsu woods. J. Jpn. Wood Res. Soc. 2005, 51, 146–152. [Google Scholar] [CrossRef]
  19. Yokoyama, M.; Gril, J.; Matsuo, M.; Yano, H.; Sugiyama, J.; Clair, B.; Kubodera, S.; Mistutani, T.; Sakamoto, M.; Ozaki, H. Mechanical characteristics of aged Hinoki wood from Japanese historical buildings. Comptes Rendus Phys. 2009, 10, 601–611. [Google Scholar] [CrossRef] [Green Version]
  20. Noguchi, T.; Obataya, E.; Ando, K. Effects of aging on the vibrational properties of wood. J. Cult. Herit. 2012, 13, S21–S25. [Google Scholar] [CrossRef]
  21. Gerhards, C.C. Time-related effects of loading on wood strength: A linear cumulative damage theory. Wood Sci. 1979, 11, 139–144. [Google Scholar]
  22. Gerhards, C.C.; Link, C.L. A cumulative damage model to predict load duration characteristics of lumber. Wood Fiber Sci. 1987, 19, 147–164. [Google Scholar]
  23. Foschi, R.O.; Folz, B.R.; Yao, F.Z. Reliability-Based Design of Wood Structures; First Folio Printing Corp. Ltd.: Vancouver, BC, Canada, 1989. [Google Scholar]
  24. Zhuang, X. Reliability Study of North American Chinese Timber Structures Design Code. Master’s Thesis, The University of British Columbia, Vancouver, BC, Canada, 2004; pp. 1–102. [Google Scholar]
  25. Ranta Maunus, A.; Fonselius, M.; Kurkela, J.; Toratti, T. Reliability analysis of timber structures. In VTT Research Notes 2109; VTT Technical Research Centre of Finland: Espoo, Finland, 2001; pp. 1–102. [Google Scholar]
  26. Wang, S.; Chen, J.; Tsai, M.; Lin, C.; Yang, T. Grading of softwood lumber using non-destructive techniques. J. Mater. Processing Technol. 2008, 208, 149–158. [Google Scholar] [CrossRef]
  27. ASTM D 6570-00; Standard Practice for Assigning Allowable Properties for Mechanically-Graded Lumber. American Society for Testing and Materials: Philadelphia, PA, USA, 2003.
  28. BS EN 14081-2; 2005 Timber Structures-Strength Graded Structural Timber with Rectangular Cross Section-Part 2: Machine grading; Additional Requirements for Initial Type Testing. European Committee for Standardization: Brussels, Belgium, 2005.
  29. Fridley, K.J.; Tang, R.C.; Soltis, L.A. Hygrothermal effects on load-duration behavior of structural lumber. J. Struct. Eng. 1992, 118, 1023–1038. [Google Scholar] [CrossRef]
  30. Hanhijarvi, A. Advances in the knowledge of the influence of moisture changes on the long-term mechanical performance of timber structures. Mater. Struct. 2000, 33, 43–49. [Google Scholar] [CrossRef]
  31. GB 1927-1943-91; Testing Methods for Physical and Mechanical Properties of Wood. Research Institute of Wood Industry, Chinese Academy of Forestry: Beijing, China, 1992.
  32. GB/T 2009; China National Standardization Management Committee. General Requirements for Physical and Mechanical Tests of Wood. China Standard Press: Beijing, China, 2009.
  33. Xu, B.; Liu, K.; Bouchar, A. Mechanical properties and set recovery of compressed poplar with glycerin pretreatment. Wood Res. 2020, 65, 293–302. [Google Scholar] [CrossRef]
  34. Zhu, X.; Yi, S.; Gao, Y.; Zhang, J.R.; Ni Ch Luo, X. Influence of welded depth and CuCl2 pretreated dowels on wood dowel welding. J. Wood Sci. 2017, 63, 445–454. [Google Scholar] [CrossRef]
  35. Handbook of Timber Structure Design; China Architecture and Building Press: Beijing, China, 2005.
  36. Wang, X. Research on Evaluation Method of Reliability-Based Residual Life of Historic Timber Structure. Ph.D. Thesis, Wuhan University of Technology, Wuhan, China, 2008. [Google Scholar]
  37. Sørensen, J.; Staffan, S.; Stang, B. Reliability-based calibration of load duration factors for timber structures. Struct. Saf. 2005, 27, 153–169. [Google Scholar] [CrossRef] [Green Version]
  38. Li, T. The Main Structural Damages and Damage Mechanism Analysis on Yingxian Wooden Tower. Ph.D. Thesis, Taiyuan University of Technology, Taiyuan, China, 2004. [Google Scholar]
  39. Qin, S.; Yang, N. Strength degradation and service life prediction of timber in ancient Tibetan building. Eur. J. Wood Wood Prod. 2018, 76, 731–747. [Google Scholar] [CrossRef]
  40. Ni, S.; Li, Y. Survey of tree species for wood materials used in historical buildings and analysis of their mechanical properties. Sichuan Build. Sci. 1994, 1, 11–14. [Google Scholar]
  41. Narayanamurti, D.; Ghosh, S.S.; Prasad, B.N.; George, J. Note on examination of an aged timber specimen. Eur. J. Wood Wood Prod. 1958, 16, 245–247. [Google Scholar] [CrossRef]
  42. Narayanamurti, D.; Prasad, B.N.; Verma, G.M. Examination of aged timbers–Part III: Aged Pterocarpus specimen from tirupathi. Eur. J. Wood Wood Prod. 1961, 19, 47–50. [Google Scholar] [CrossRef]
  43. Schulz, H.; Aufseß, H.V.; Verron, T. Properties of a spruce beam after 300 years in roof construction. Eur. J. Wood Wood Prod. 1984, 42, 109. [Google Scholar]
  44. Chen, G. Researches on timber material changing which affect buildings form in ancient architecture construction. Tradit. Chin. Archit. Gard. 2003, 3, 49–52. [Google Scholar]
  45. Huang, R.; Jin, H.; Shi, Z.; Xia, R.; Li, H.; Liu, X. Study on physico-mechanical properties of ancient architecture of the palace museum. In Proceedings of the First National Symposium on Biomass Materials Science and Technology, Beijing, China, 19 August 2007; pp. 502–507. [Google Scholar]
  46. Xu, M.; Wiu, H. New method of aging for historic timber structure buildings. Earthq. Resist. Eng. Retrofit. 2009, 31, 96–98. [Google Scholar]
  47. Cheng, J.; Yang, J.; Liu, P. China Wood Record; China Forestry Press: Beijing, China, 1992. [Google Scholar]
Figure 1. The parallel-to-grain compressive strengths of aged timber.
Applsci 12 07719 g001
Figure 2. Schematic diagram of the relationship between the compressive strength ratio, sampling position, and age of the timber member: (a) definition of parameter λ; (b) a 3D schematic diagram of the relationship.
Applsci 12 07719 g002
Figure 3. Log samples of aged CL and new CL: (a) hundred-year-old building, (b) aged CL samples, and (c) new CL samples.
Applsci 12 07719 g003
Figure 4. Segments of the timber log and the prepared test specimens: (a) segmenting of the timber members, (b) log segments, (c) log test, and (d) standard specimens.
Applsci 12 07719 g004
Figure 5. Parallel-to-grain compressive strength of aged and new logs.
Applsci 12 07719 g005
Figure 6. Distribution of the compressive strength ratio: (a) γσ in 3D space; (b) boxplot of γσ.
Applsci 12 07719 g006
Figure 7. Outer contour lines of the plane: (a) λ = 0, (b) λ = 1, (c) t = 100, and (d) t = 0.
Applsci 12 07719 g007aApplsci 12 07719 g007b
Figure 8. (a) Time-dependent model on the parallel-to-grain compressive strength. (b) Time-dependent model of the parallel-to-grain compressive strength of HW and SW.
Applsci 12 07719 g008
Table 1. Dimensions of the log samples.
Serial NumberSize (mm)
DiameterLength
One EndOther End
AgedCL-1120/128140/1452910
CL-2150/150150/1553470
CL-395/130125/1502680
NewCL-4138/138150/1604000
CL-5127/128165/1904000
Table 2. Number of samples and their dimensions for each type of test.
SamplesTest IndexSpecimensNumber of
Samples/Test
Dimensions (mm)
Aged CL
(t = 100)
New CL
(t = 0)
LengthWidthHeight
Standard specimens Compressive strength (fc,0)S1 (λ = 0.00)4224202030
S2 (λ = 1.00)4224
Air-dried density (ρ)S1 (λ = 0.00)2312202020
S2 (λ = 1.00)2312
LogsCompressive strength (fc,0,log)-6412R--
Table 3. Parallel-to-grain compressive strength (fc,0) and density (ρ) of standard specimens.
TestsAged CLNew CLDifferences
HWSW δ D
(%)
HWSW δ D
(%)
δ H   ( % ) δ S   ( % )
x ¯ H SD x ¯ S SD x ¯ H   SD x ¯ S   SD
fc,0 (MPa)42.968.0042.167.741.9035.963.6742.354.03−15.0919.47−0.45
ρ (g/cm3)0.4070.0650.4010.0571.660.3490.0220.3910.025−10.7016.602.43
Note: “—” denotes that the strength of HW is smaller than that of SW in the new timber.
Table 4. Parallel-to-grain compressive strength of the logs fc,0,log.
Aged CLNew CLDifference
x ¯ A   ( MPa ) SD x ¯ N   ( MPa ) SD δ L   ( % )
30.309.4035.211.58−13.94
Note: “—” denotes that the parallel-to-grain compressive strength of aged logs is smaller than that of the new logs.
Table 5. Estimation of compressive strength of the log samples using Equation (6).
Serial Number f c , 0 , mean
(MPa)
HW (λ = 0)SW (λ = 1)
γσ f ¯ c - H
(MPa)
f m - cal
(MPa)
δ M
(%)
γσ f ¯ c - S
(MPa)
f m - cal
(MPa)
δ M
(%)
Aged CL-1
(t = 100)
41.980.73950.5637.3712.350.68749.9634.3222.32
Aged CL-2
(t = 100)
29.560.73939.7529.370.640.68740.0727.537.38
Aged CL-3
(t = 100)
19.370.73934.7925.7124.650.68733.2122.8215.11
New CL-4 (t = 0)36.760.93933.9231.8515.400.88745.3040.188.51
New CL-5 (t = 0)33.660.93940.0437.6010.470.88739.3934.943.67
Note: f ¯ c - H and f ¯ c - S are the mean compressive strengths of standard specimens of HW and SW, respectively; f m - cal is the calculated compressive strength of the timber log using Equation (5); the difference δ M is calculated from δ M = | f m f m - cal | / f m % .
Table 6. Coefficients for calculating the parallel-to-grain compressive strength [35].
Sample Type K P K A K Q K
K Q 1 K Q 2 K Q 3 K Q 4
Aged CL1.000.961.000.900.751.000.65
New CL1.000.961.000.900.750.720.47
Table 7. Estimation of the compressive strength of the log samples, according to [35].
Serial Number f c , 0 , mean
(MPa)
K f ¯ c
(MPa)
f m - CABP
(MPa)
δ M
(%)
Aged CL-1
(t = 100)
41.980.6550.2732.6822.15
Aged CL-2
(t = 100)
29.560.6539.9125.9412.25
Aged CL-3
(t = 100)
19.370.6534.0022.1014.09
New CL-4
(t = 0)
36.760.4739.6118.6249.35
New CL-5
(t = 0)
33.660.4739.6118.6244.68
Note: The difference δ M is calculated by δ M = | f m f m - CABP | / f m % .
Table 8. Residual strength ratio of new CL under different stress levels.
Stress level τ (MPa)0.250.300.35
Residual strength ratio γ 0.0770.5560.781
Publisher’s Note: MDPI stays neutral with regard to jurisdictional claims in published maps and institutional affiliations.

