
Model Test Study on a Shield Tunnel Adjacent to Pile in the Sub-Clay of a Coastal Area

Abstract
1. Introduction
2. Design of Model Test System Crossing Existing Piles by Shielding
2.1. Model Test System of Crossing Existing Piles by Shielding
2.2. Design of Test Materials
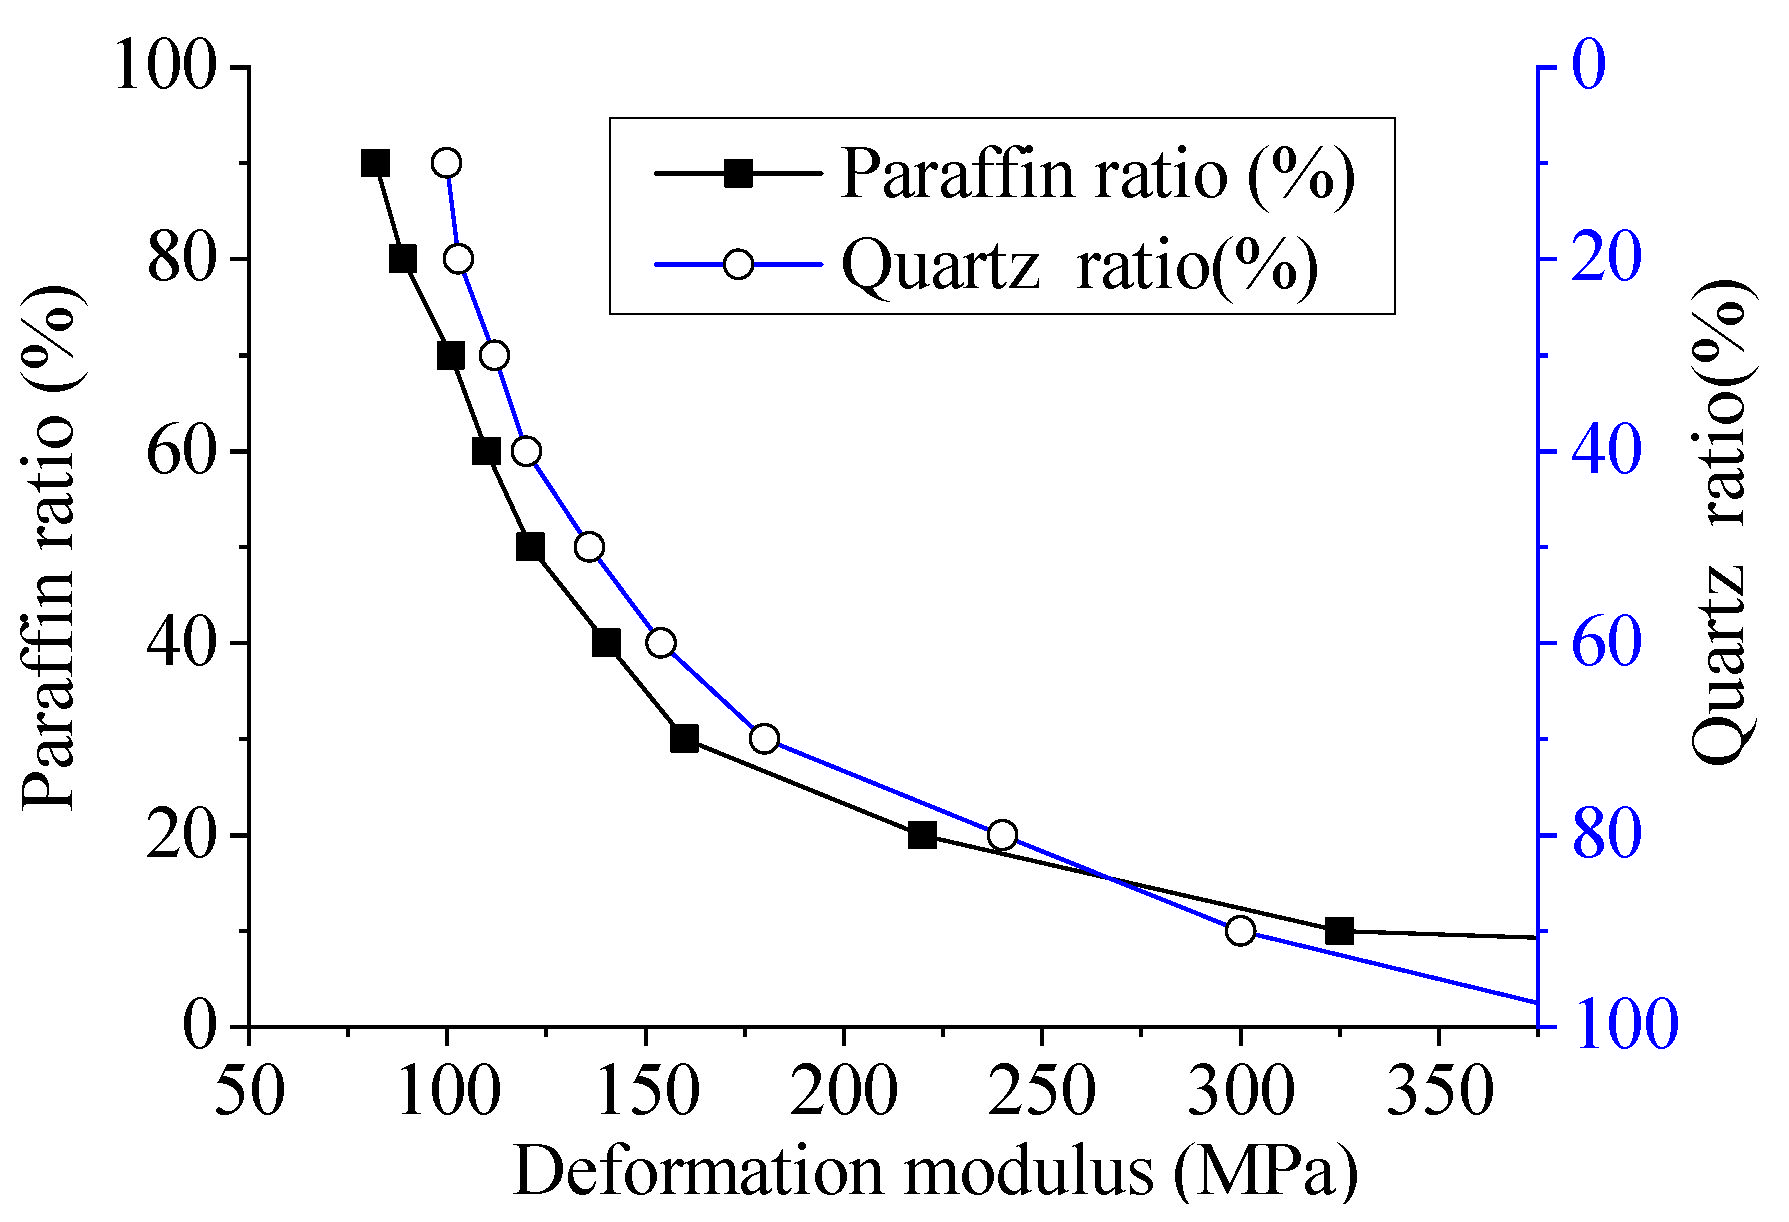
2.2.1. Equivalent Materials
2.2.2. Equivalent Lining
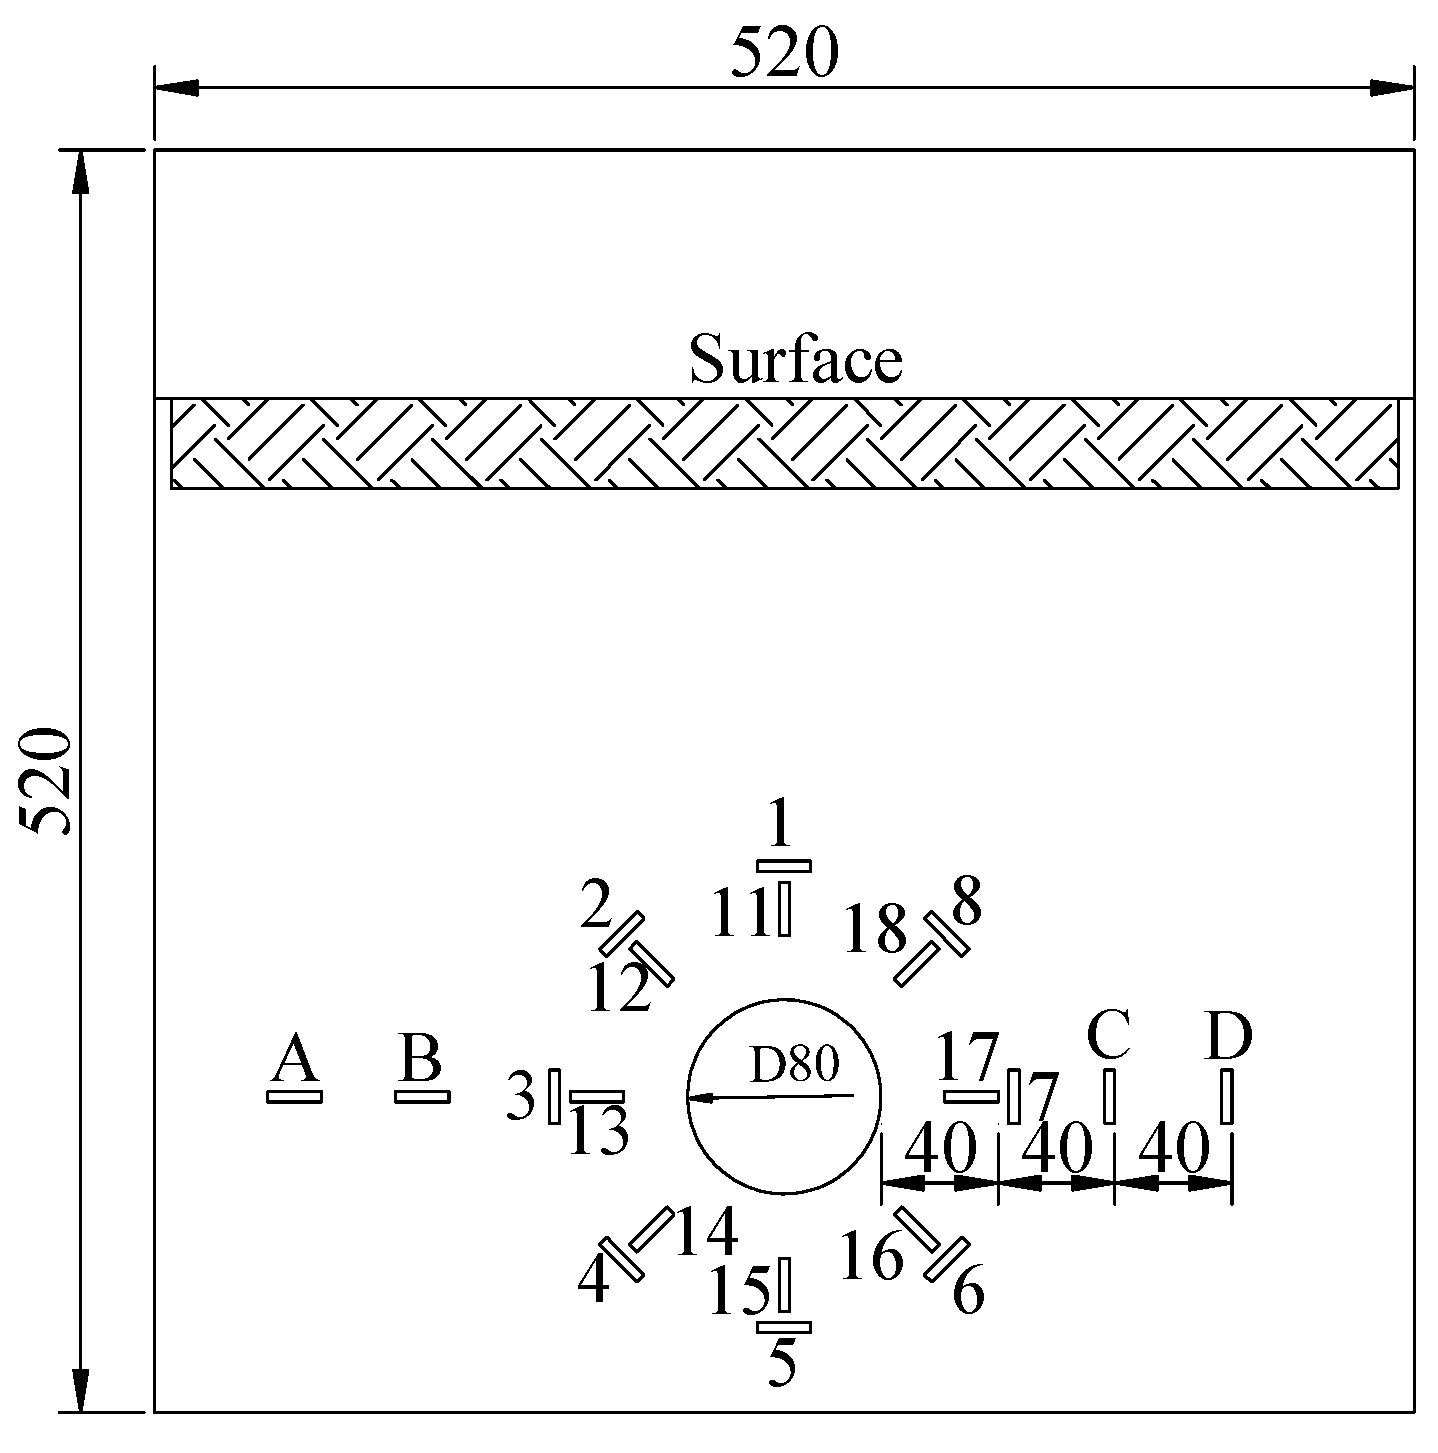
2.2.3. Pile Model
- Ep—Elastic modulus of prototype pile
- Ip—Inertia moment of prototype pile
- EM—Elastic modulus of model pile
- IM—Inertia moment of model pile
3. Experiment Plan
4. Test Results
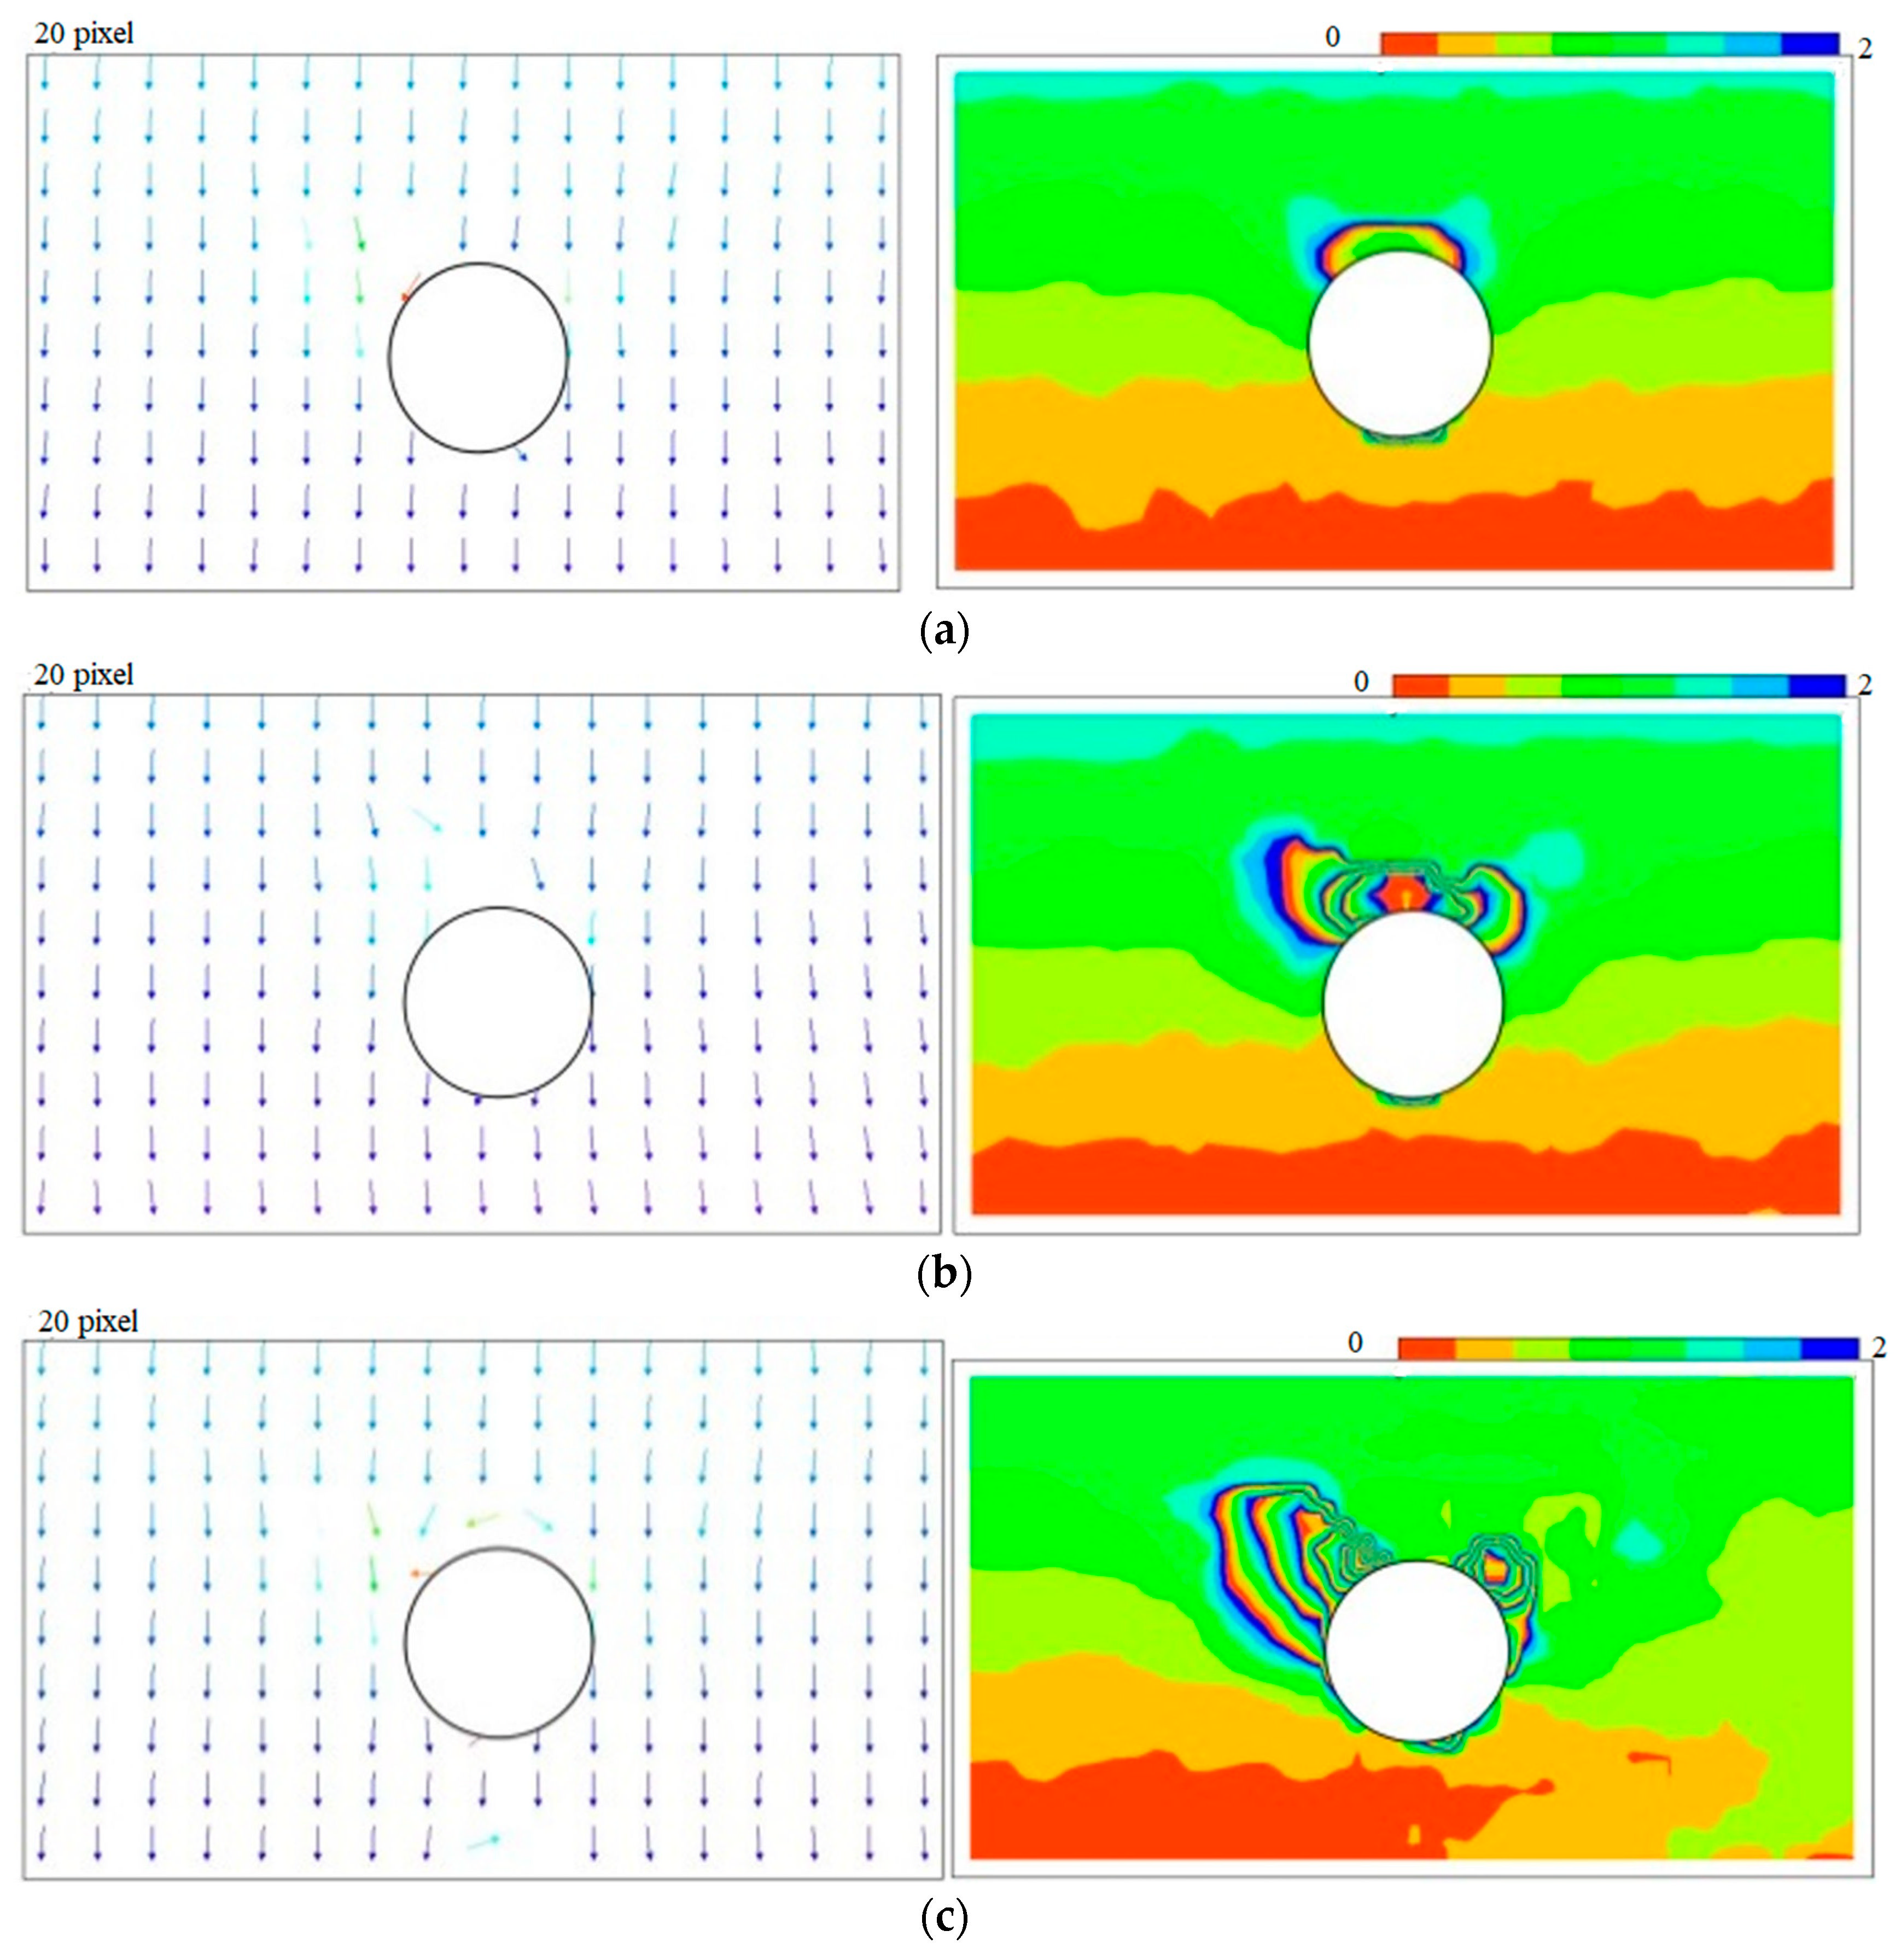
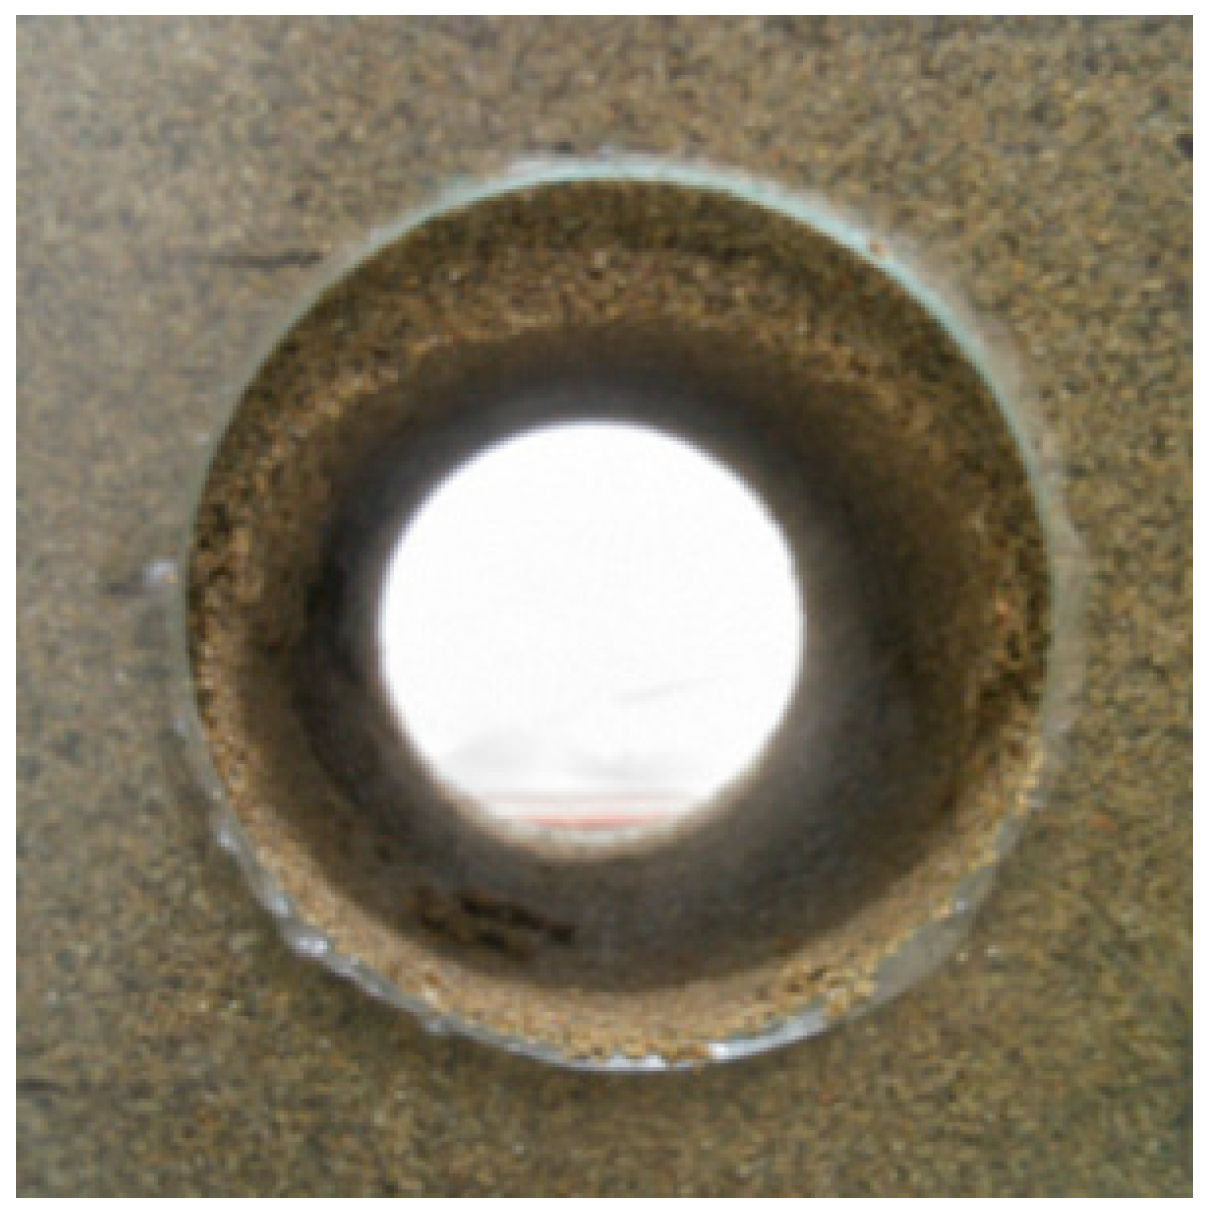
4.1. Excavation Failure
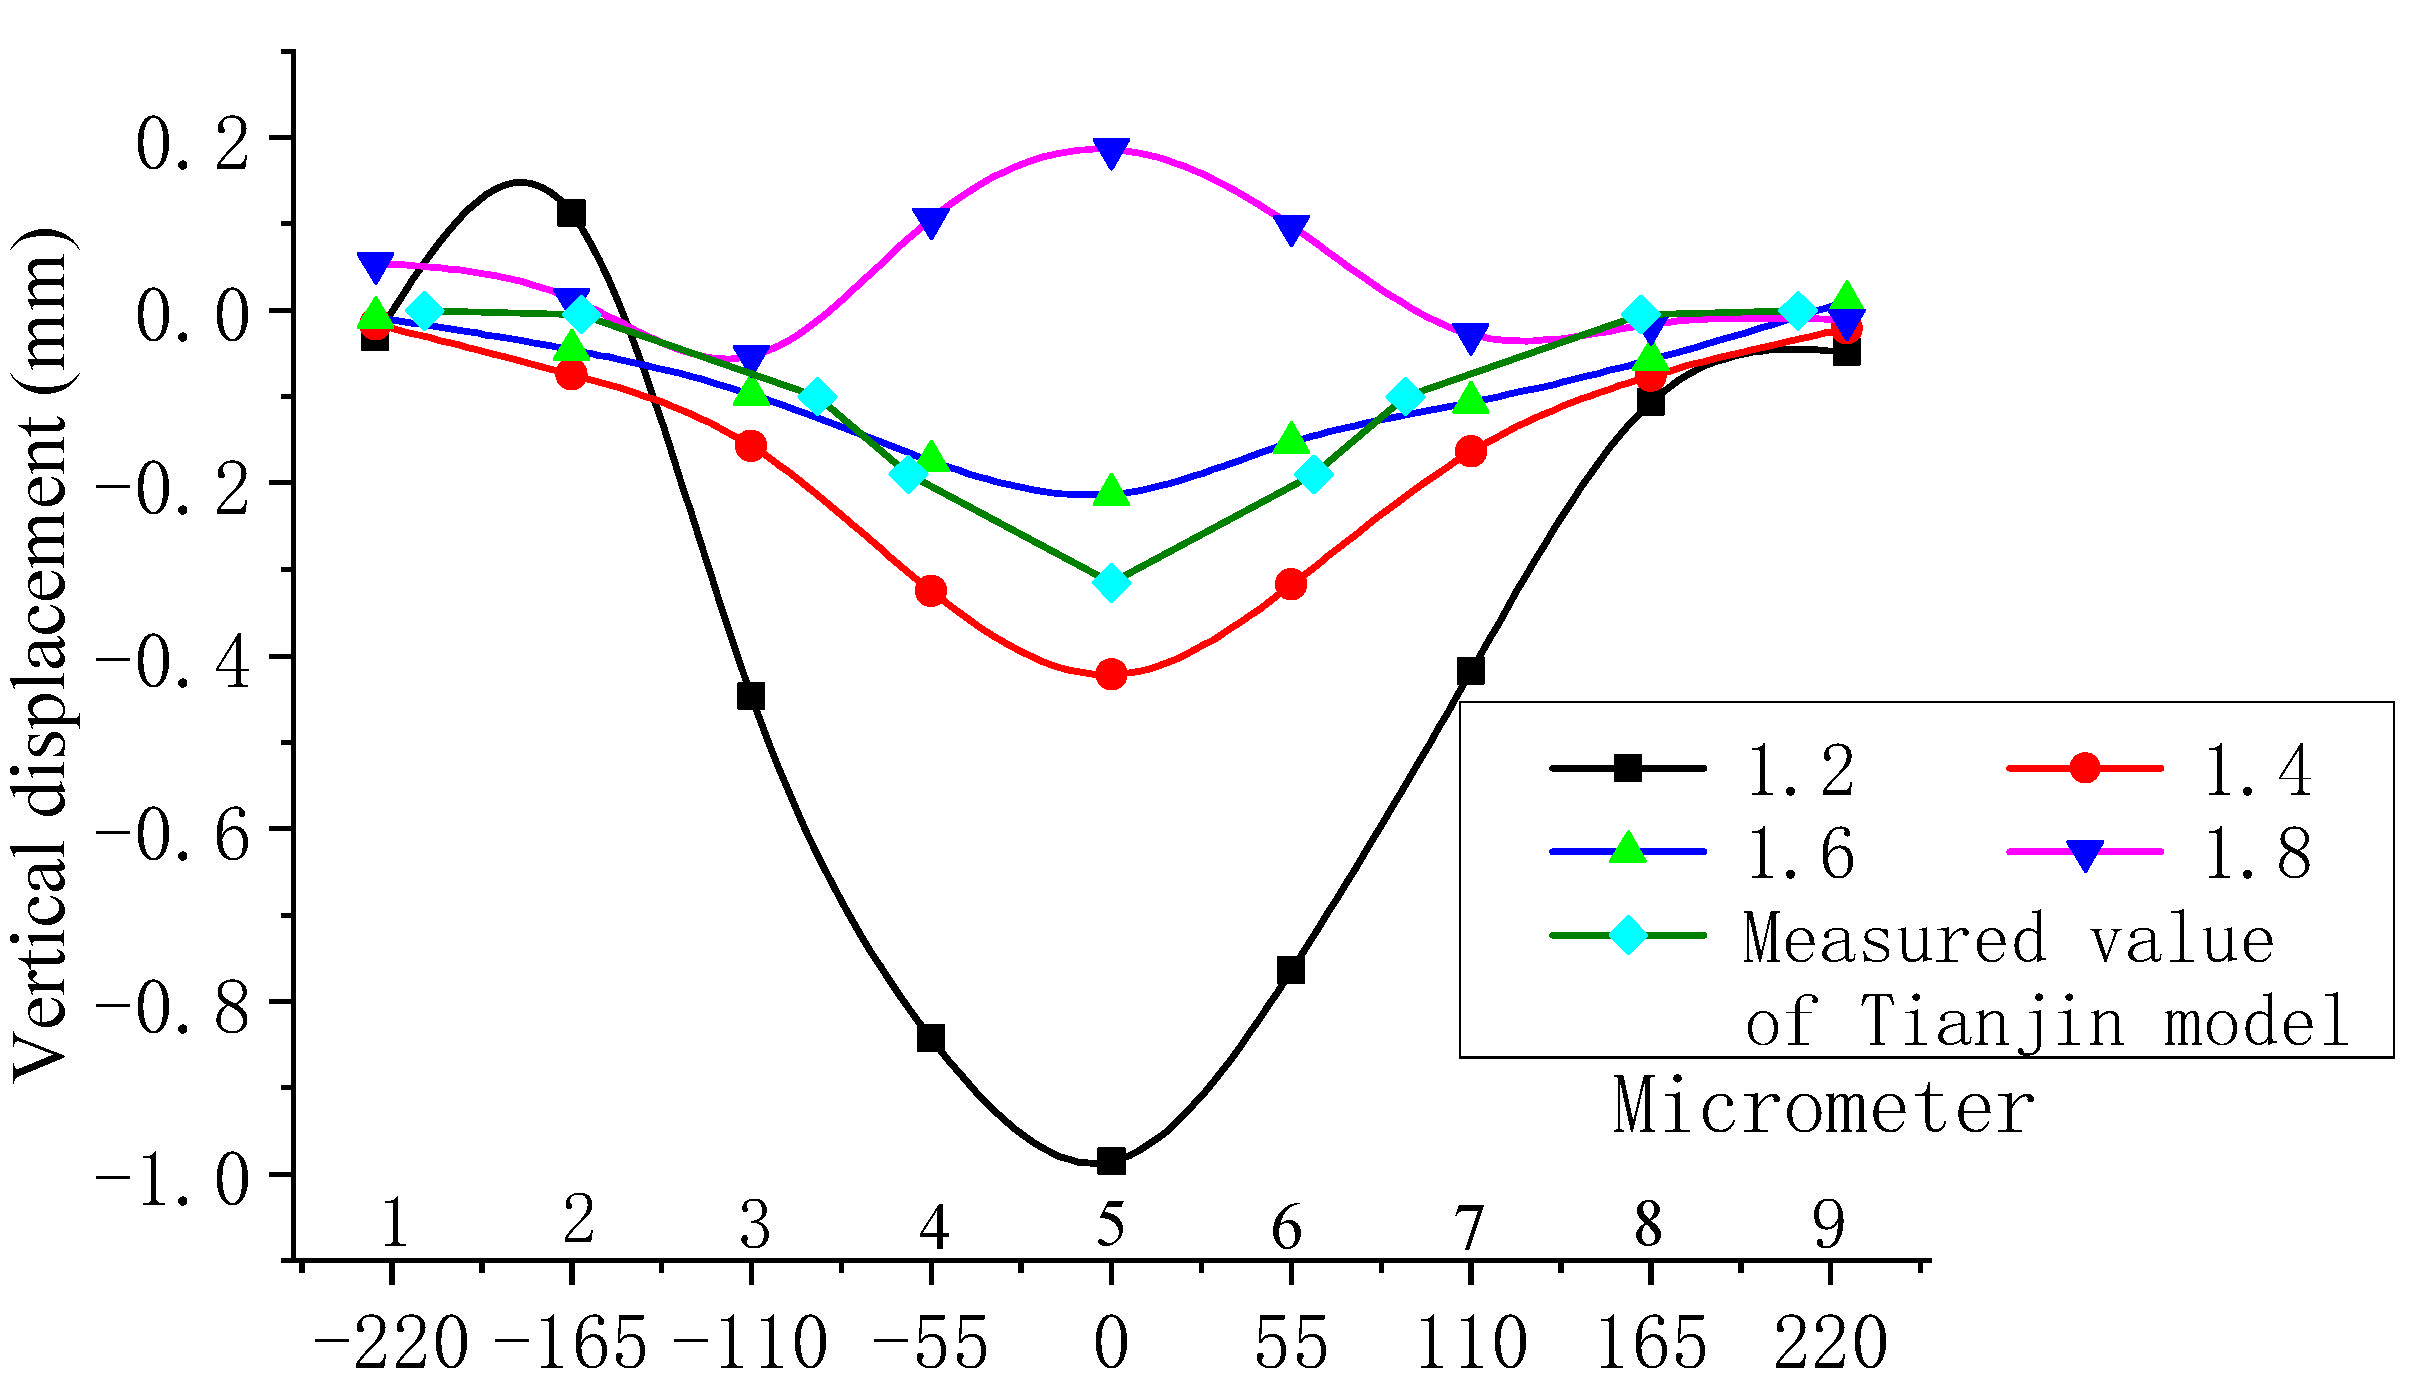
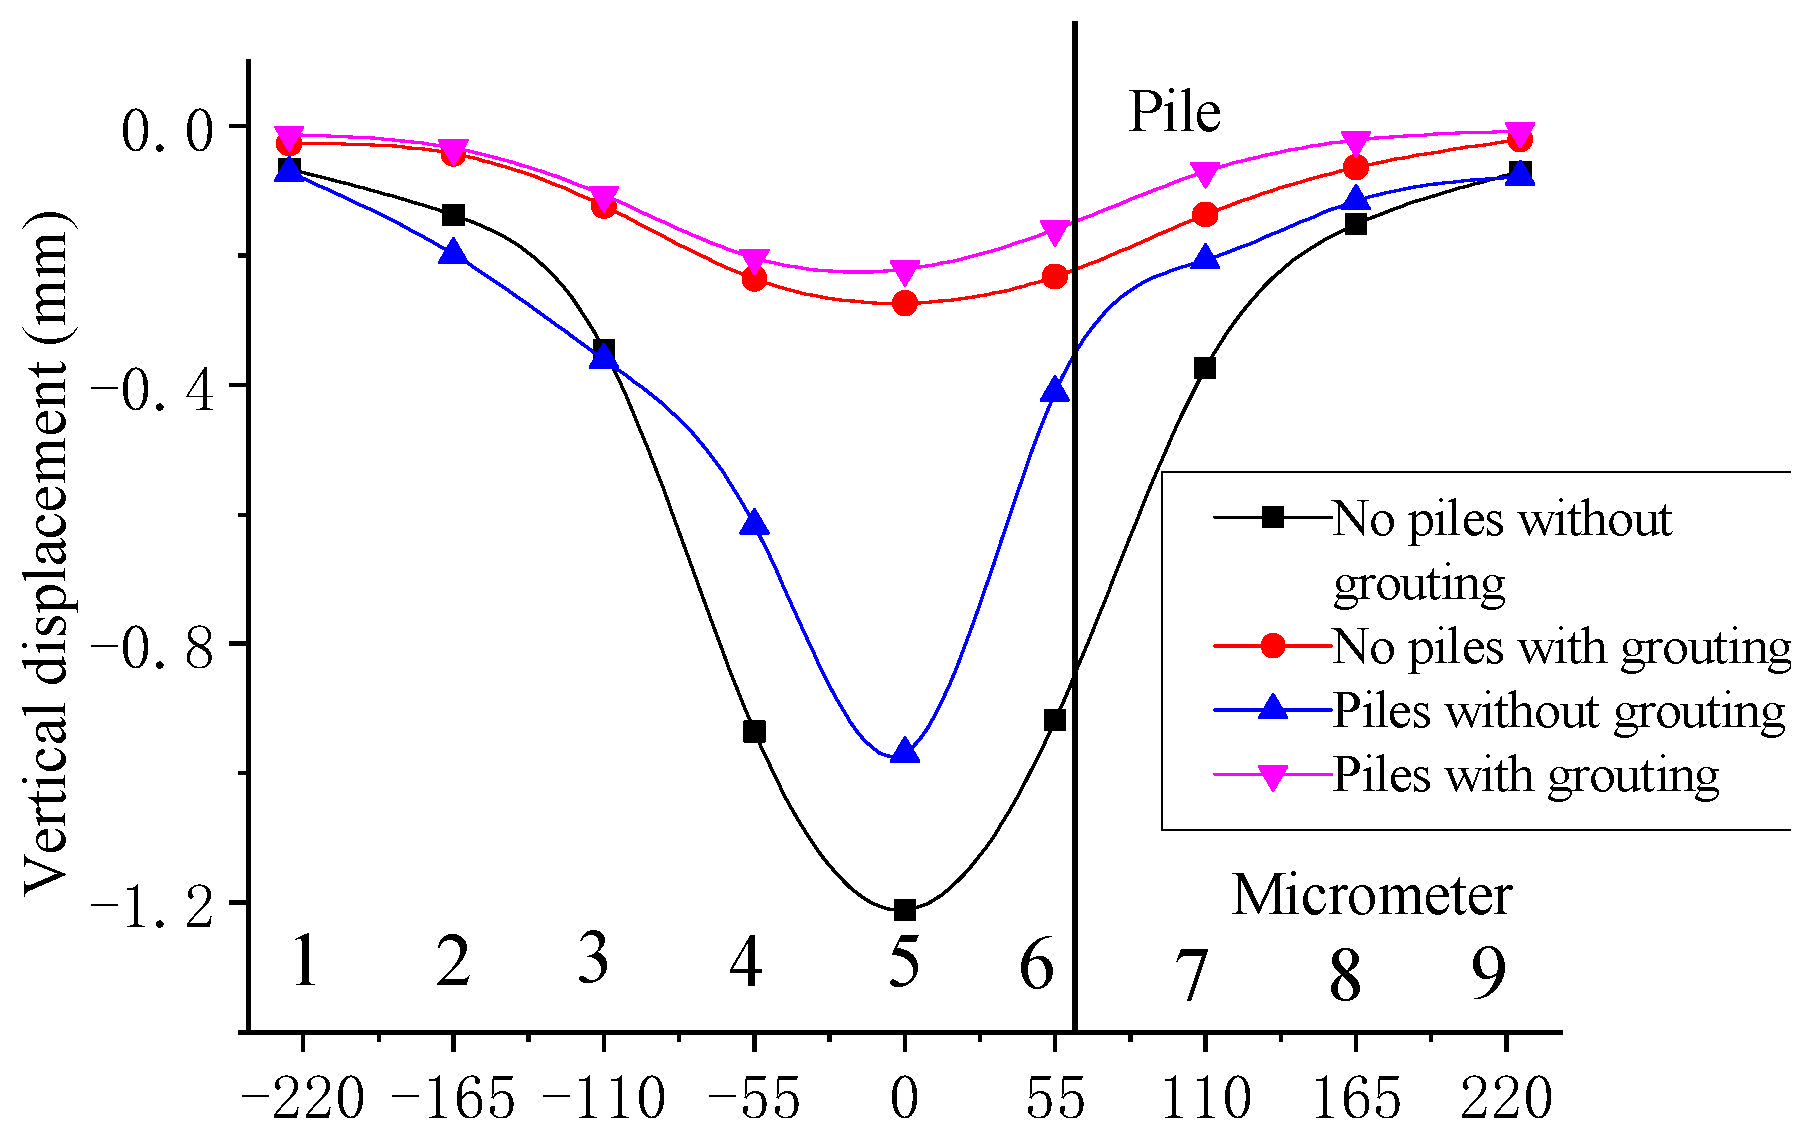
4.2. Surface Deformation
4.3. Earth Pressure
- (1)
- With the increase in H/D, the earth pressure increases, and the earth pressure around the tunnel tends to be uniform. When the pile exists, the earth pressure around the tunnel present an asymmetric distribution;
- (2)
- The existence of the pile increases the radial pressure of the nearby soil mass. When the transverse distance of the pile-tunnel was 3D, the influence on the earth pressure cell was small. The vertical influence range of the pile was 1 time the diameter of the pile from the bottom of the pile. When the pile bottom was located at the horizontal plane of the tunnel arch bottom, the influence on the earth pressure of the surrounding rock on the side of the pile was larger than the side of no-pile.
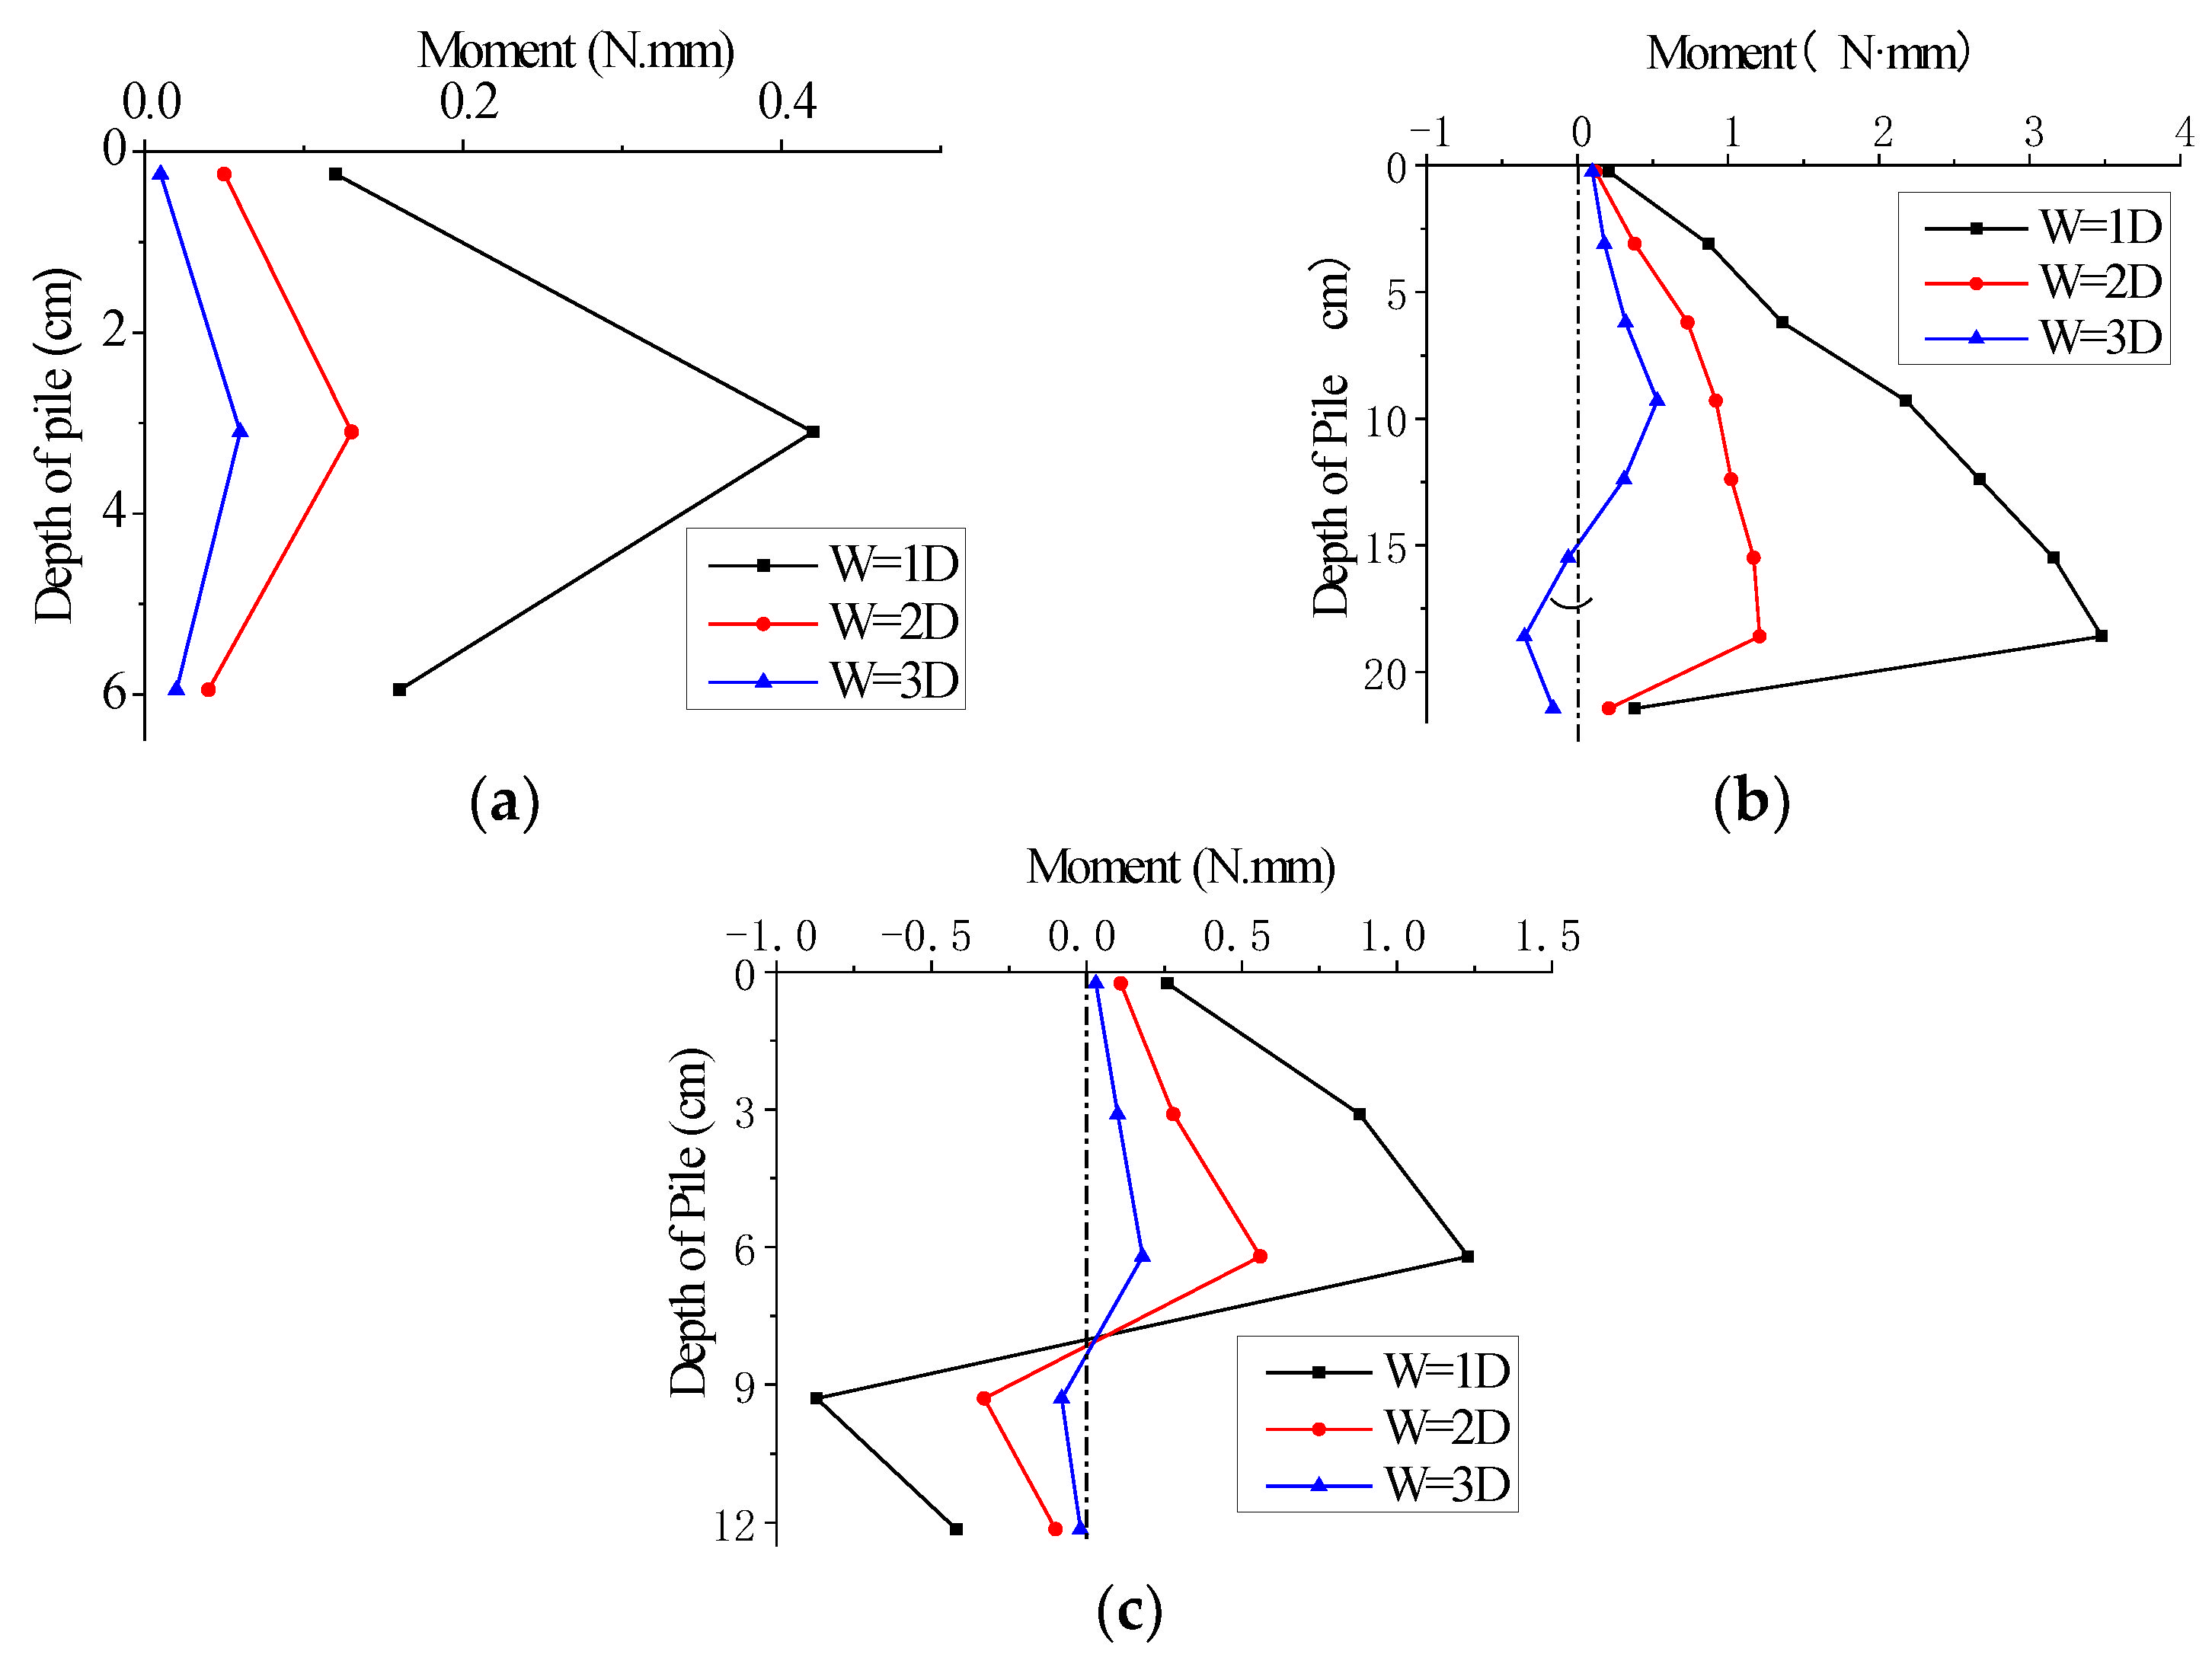
4.4. Pile Response
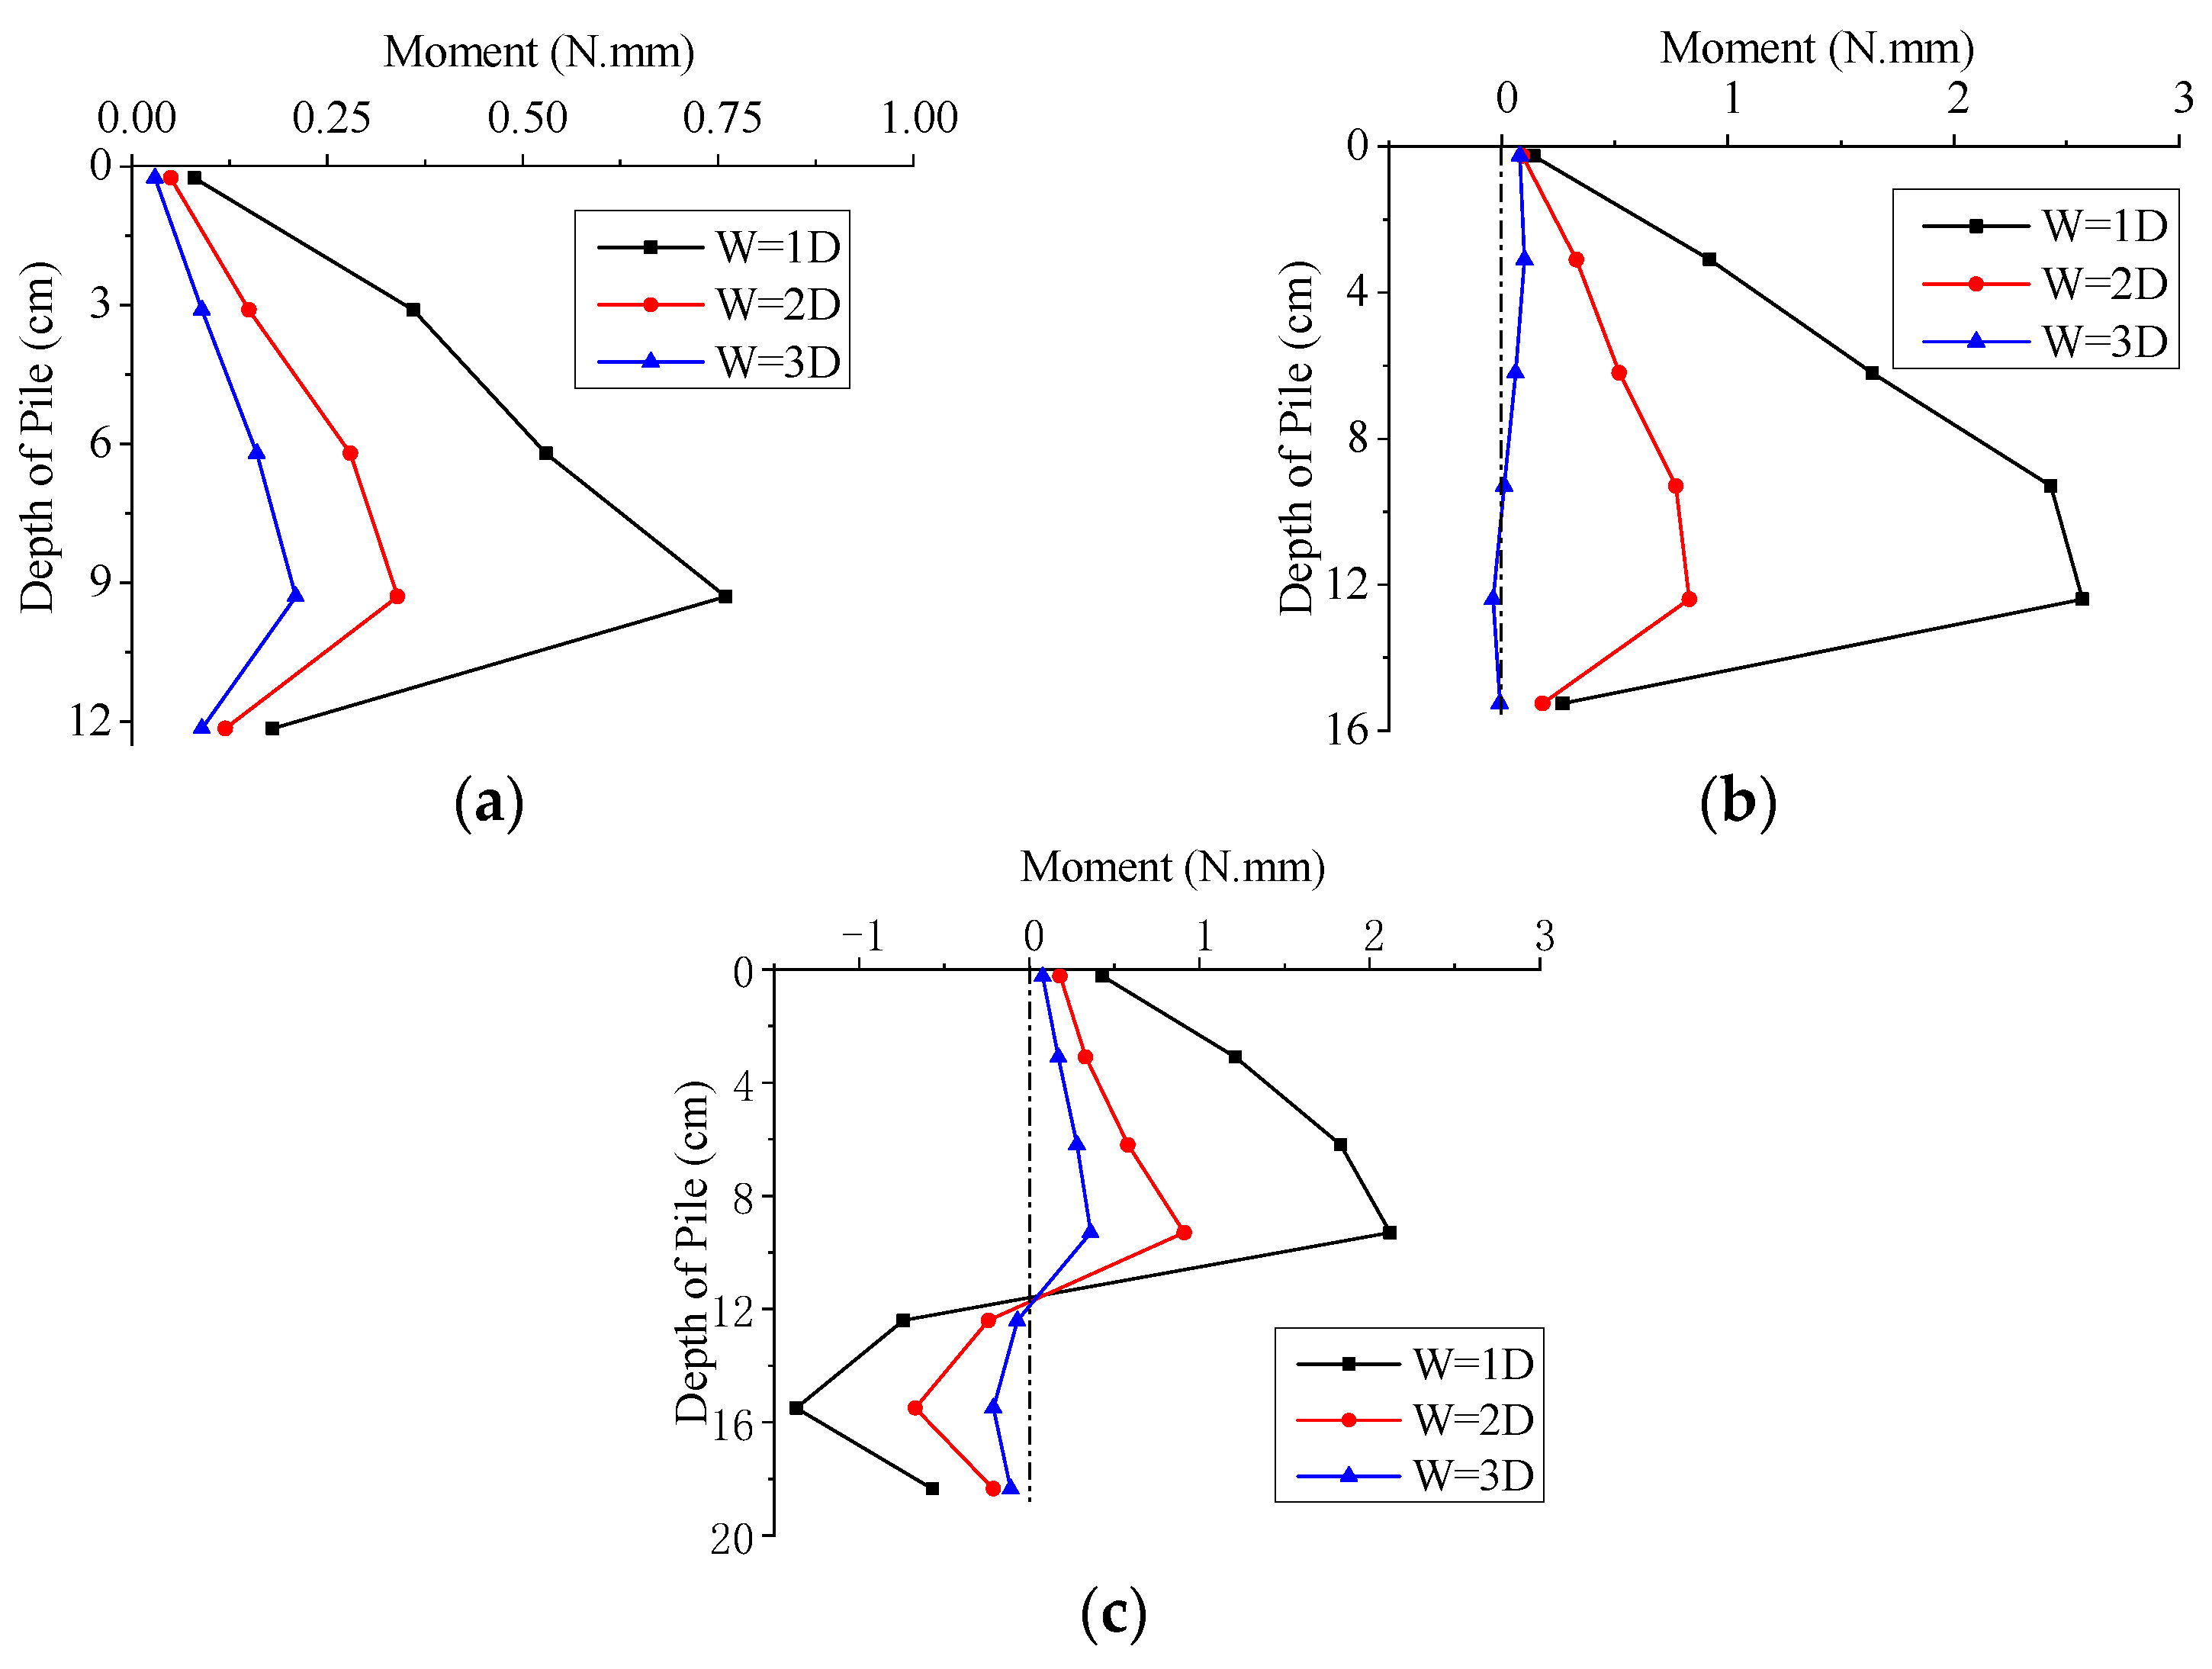
- (1)
- The greater the coverage span ratio was, the bending moment of the pile at the same level was larger; when the pile bottom was located at or above the tunnel chamber line, the maximum bending moment was generally located at the middle or lower part of the pile. When the pile bottom was located below the tunnel chamber line, the pile appeared at the negative bending moment, and the maximum negative bending moment was located at the arch waist.
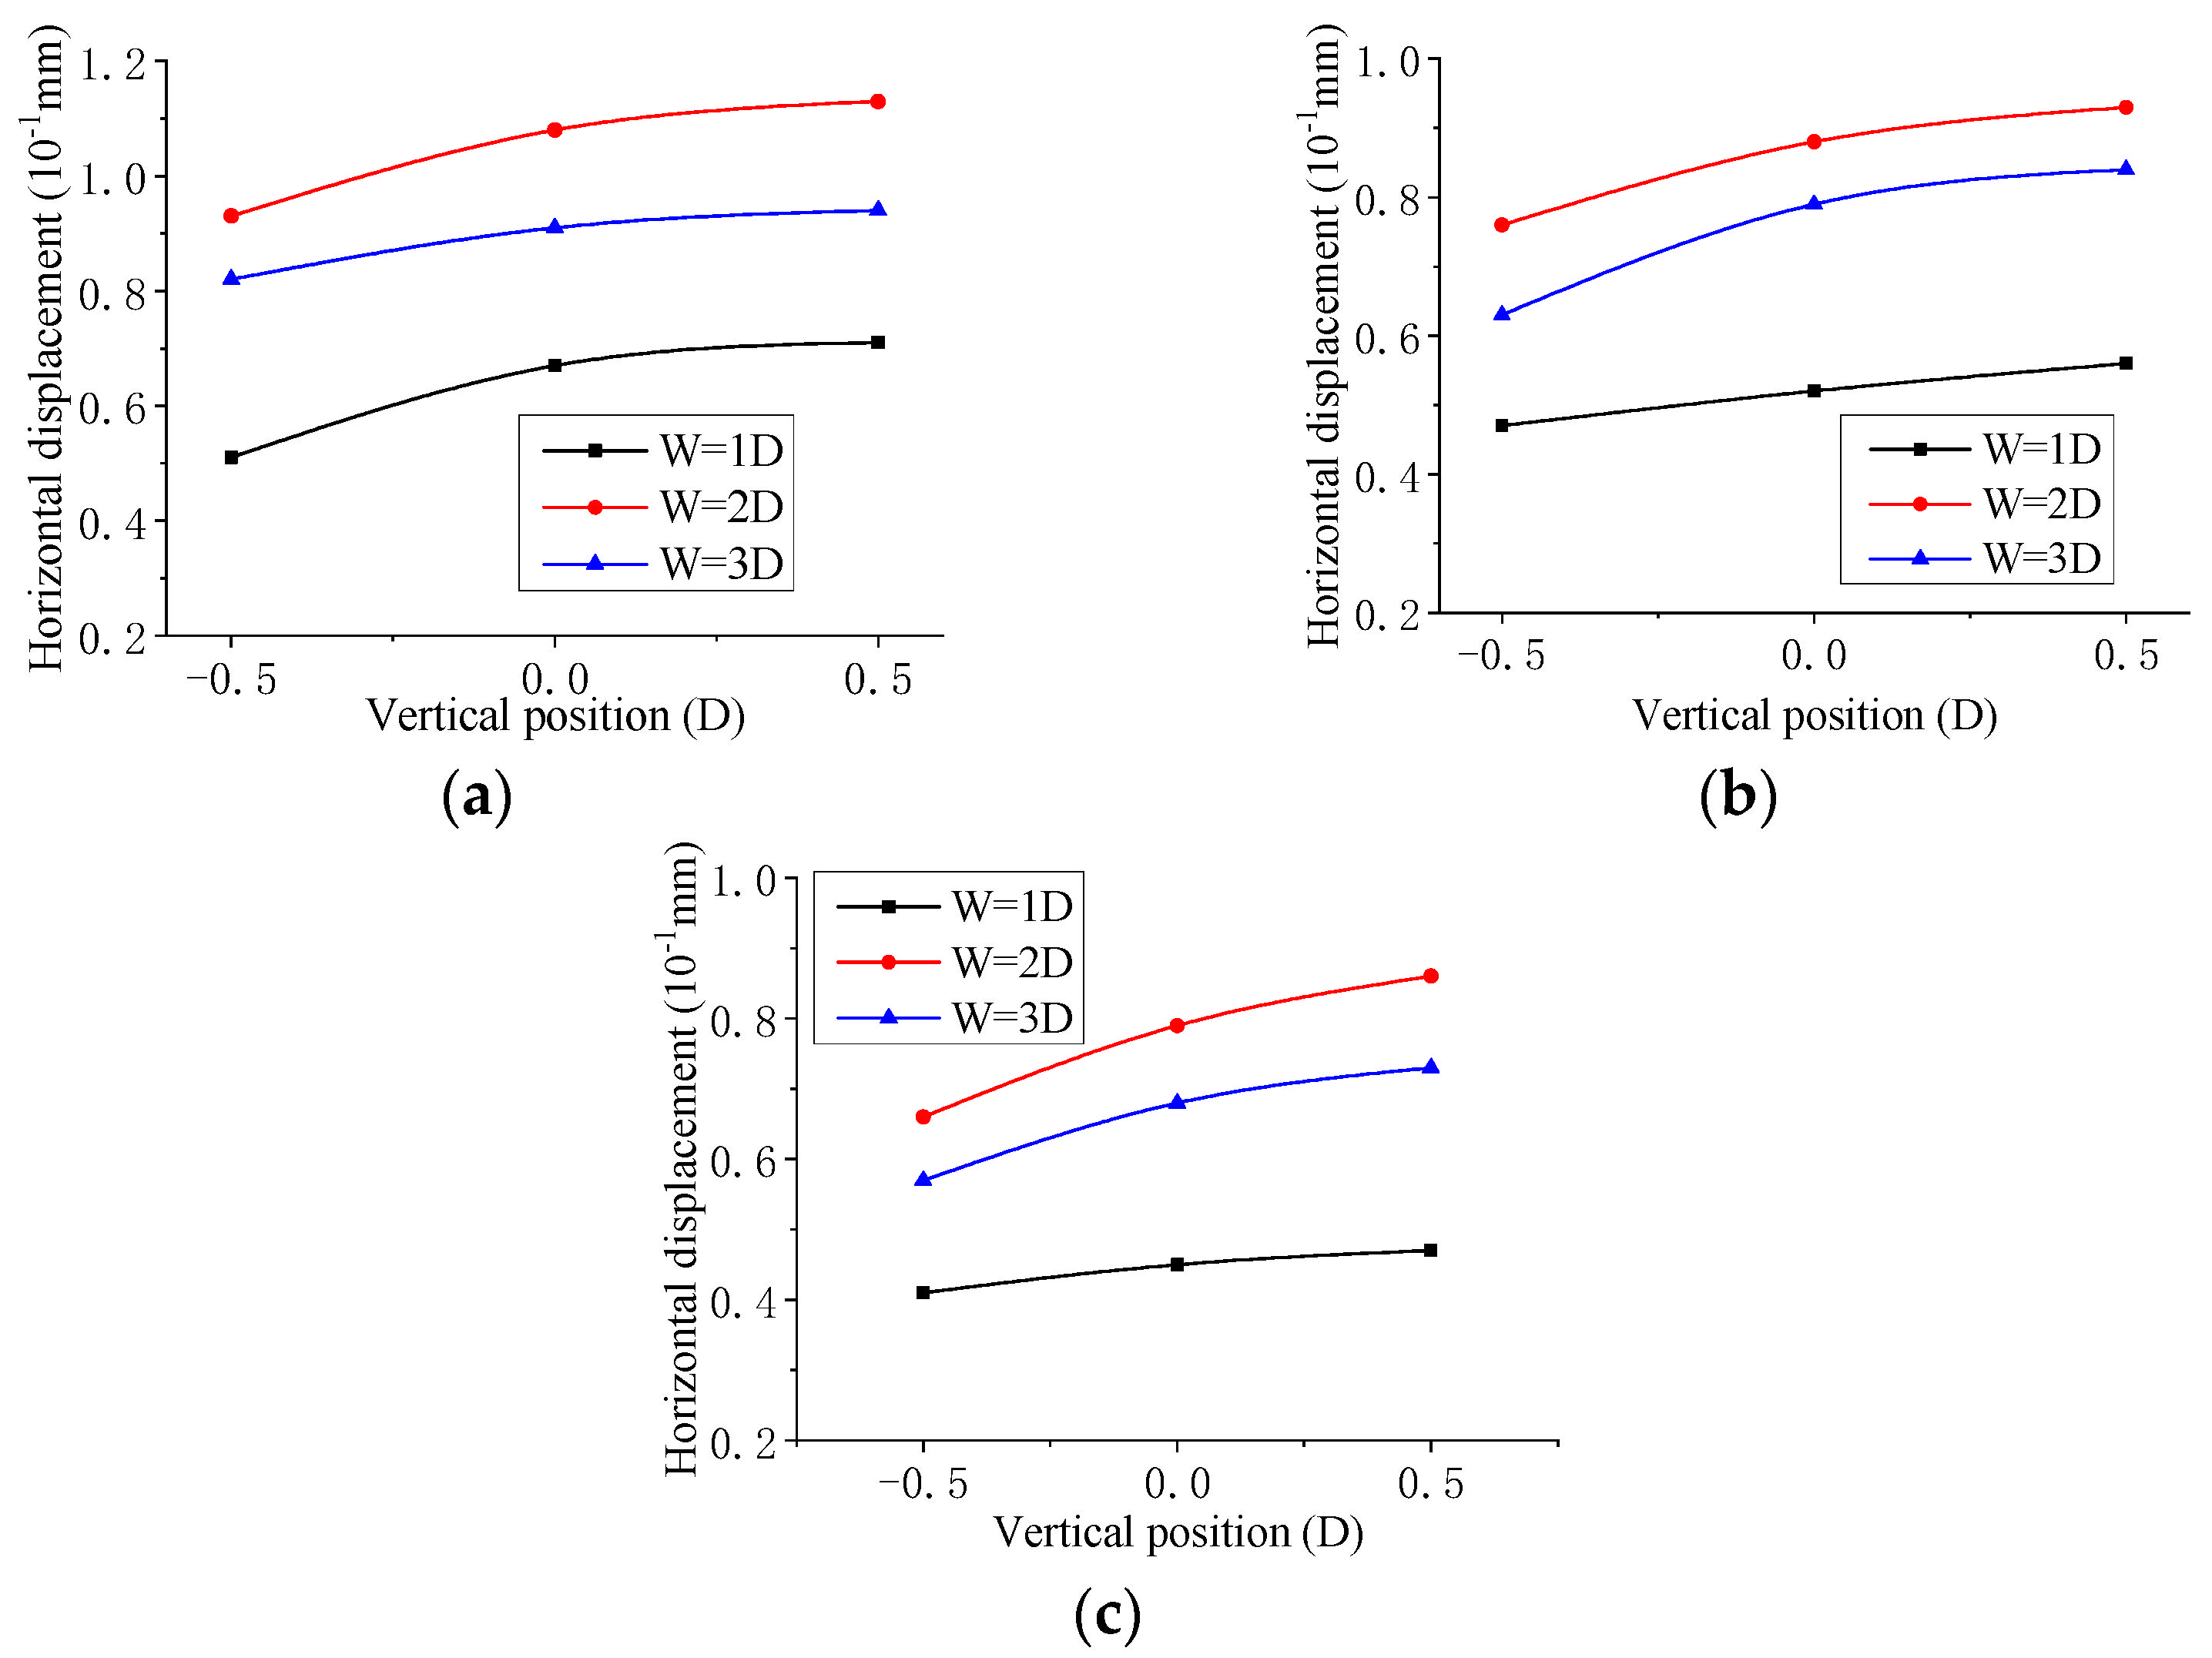
- (2)
- The bending moment value change was obvious due to the influence of the lateral position change for the pile-tunnel system. The maximum influence area was 1D→2D, and the influence degree outside 2D was significantly weakened. The change in vertical position has a great influence on the direction of the bending moment. The maximum influence range was that the pile bottom located in the range from the arch waist (v = 0d) to the arch bottom (v = −0.5d), and the bending moment from the arch waist (v = 0d) to the arch crown (v = 0.5d) was similar and affected much by the buried depth. The larger the cover-span ratio H/D was, the weaker the influence of tunnel excavation on piles would be.
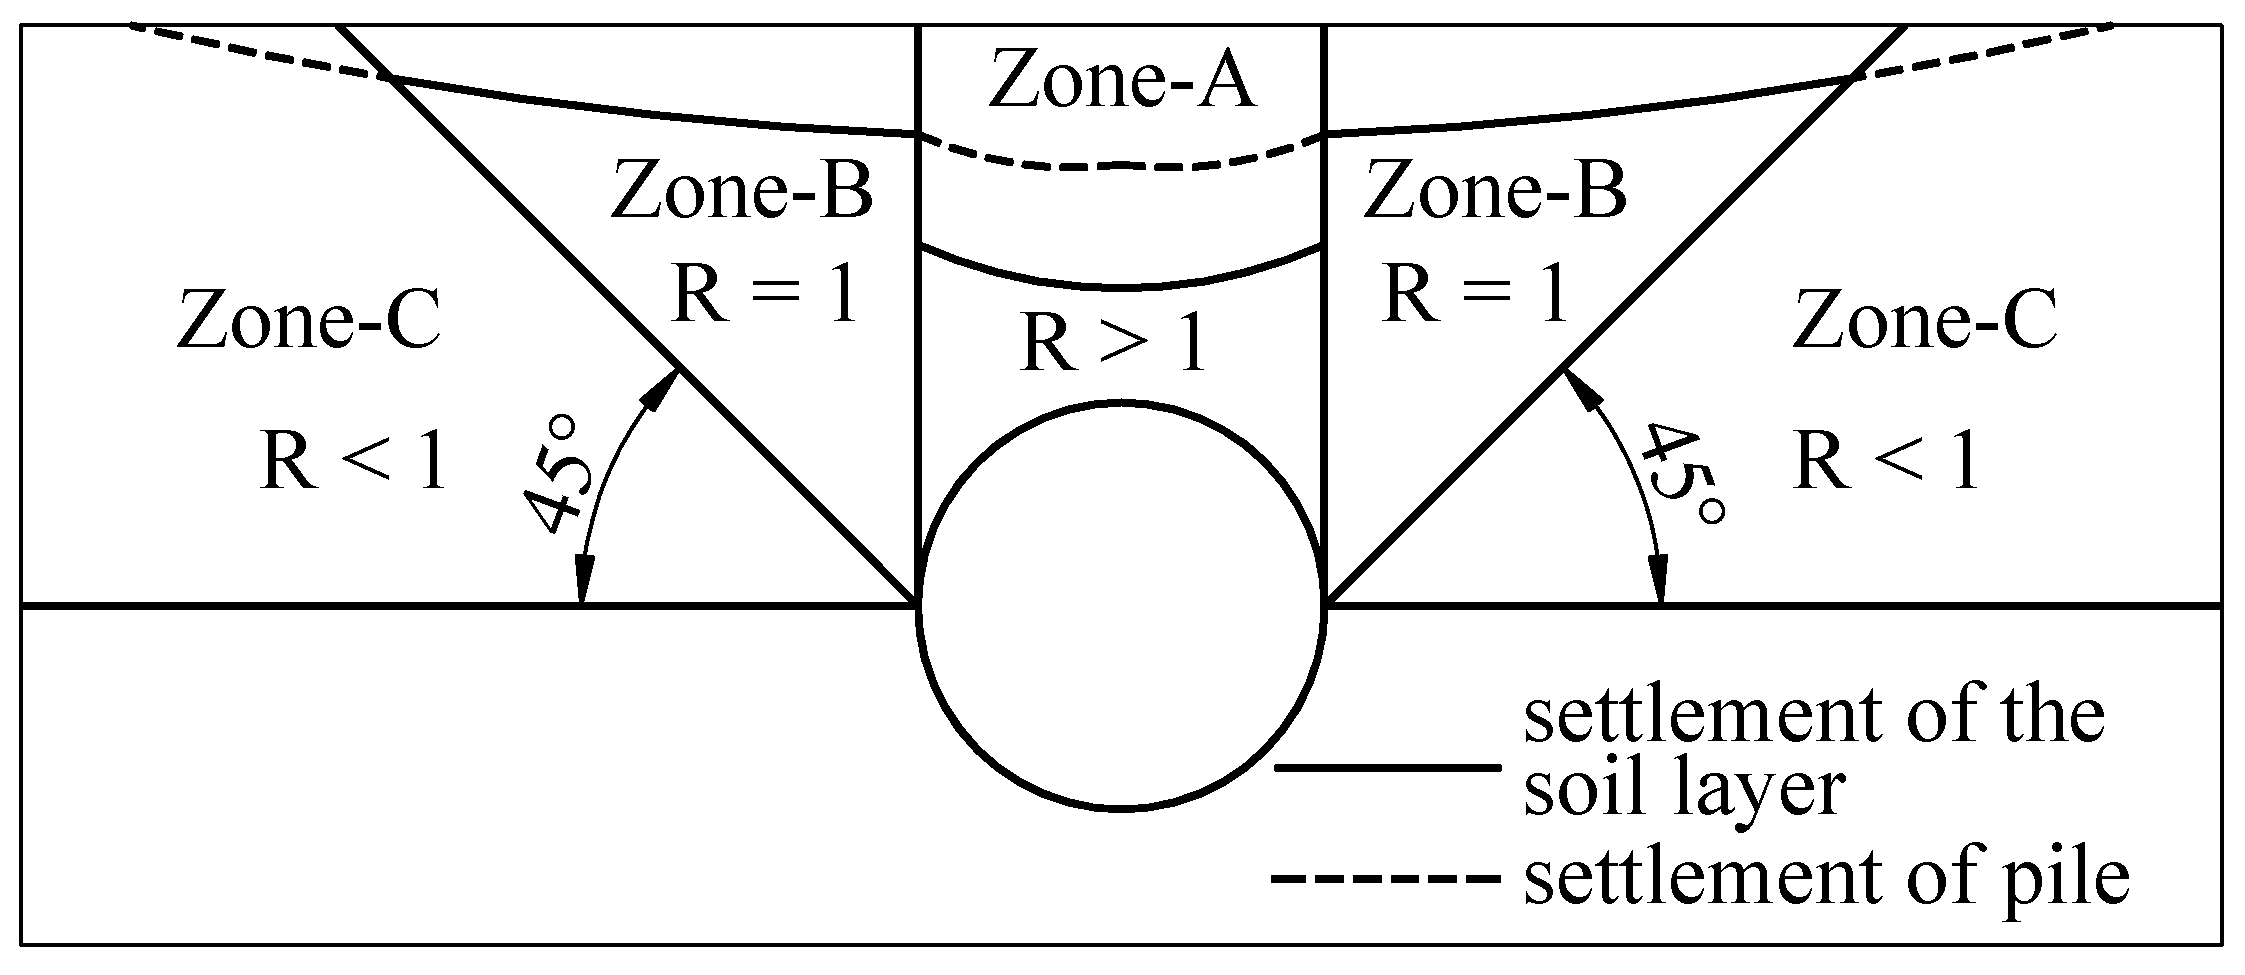
4.5. Model of the Zonal Blockization of Surrounding Rock
5. Conclusions
- (1)
- The best grouting filling coefficient for the shielding case was 1.4~1.6;
- (2)
- The suggested range of settlement trough width parameters were obtained by fitting the experimental data. The K value of pile-surrounding layers with piles was reduced by 0.075, on average, compared with that of the no-piles case. The K value increased with the increase in pile-tunnel distance and decreased with the increase in pile burial depth in the research example.
- (3)
- A model of the zonal blockization of surrounding rock was given. They were divided into five reasonable zones according to the displacement, pressure change and pile response of the weak surrounding layers in the pile-tunnel system, and the characteristics of its key construction control methods were given.
Author Contributions
Funding
Institutional Review Board Statement
Informed Consent Statement
Data Availability Statement
Acknowledgments
Conflicts of Interest
References
- Hu, X.Y.; Yan, Q.X.; He, C.; Yang, X.Y. Model test and 3D dem analysis on the failure feature of excavation face and disturbance of granular mixtures stratum due to epb shield tunneling. Chin. J. Rock Mech. Eng. 2016, 35, 1–10. (In Chinese) [Google Scholar]
- Hergarden, H.J.A.M.; Vander Poel, J.T.; Vander Schrier, J.S. Ground movements due to tunneling: Influence on pile foundation. In Proceedings of the International Symposium on Geotechnical Aspects of Underground Construction in Soft Ground, Tokyo, Japan, 19–21 July 1996; Balkema: Rotterdam, The Netherlands, 1996; pp. 519–524. [Google Scholar]
- Ghahremannejad, B.; Surjadinata, J.; Poon, B.; Carter, J.P. Effects of tunneling on model pile foundations. In Proceedings of the 6th International Conference on Physical Modelling in Geotechnics, Hong Kong, China, 4–6 August 2006; pp. 1157–1162. [Google Scholar]
- Selemetas, D.; Standing, J.R.; Mair, R.J. Response of full scale piles to tunneling. In Proceedings of the 5th International Symposium on Geotechnical Aspects of Underground Construction in Soft Ground, Amsterdam, The Netherlands, 5–17 June 2005; Taylor & Francis: London, UK, 2005; pp. 763–769. [Google Scholar]
- Bai, B.; Yang, G.C.; Li, T.; Yang, G.S. A thermodynamic constitutive model with temperature effect based on particle rearrangement for geomaterials. Mech. Mater. 2019, 139, 103180. [Google Scholar] [CrossRef]
- Bai, B.; Xu, T.; Nie, Q.K.; Li, P. Temperature-driven migration of heavy metal Pb 2 + along with moisture movement in unsaturated soils. Int. J. Heat Mass Transf. 2020, 153, 119573. [Google Scholar] [CrossRef]
- Yu, L.; Zhang, D.L.; Fang, Q.; Li, Y.; Wang, G.; Cao, L. Analytical Prediction of Strip Foundation Building Response to Shallow Tunneling Considering the Tunneling Process. Appl. Sci. 2022, 12, 4656. [Google Scholar] [CrossRef]
- The Second Survey and Design Institute of China Railway. TB10003-2005, Code for Design of Railway Tunnel; China Railway Publishing House: Beijing, China, 2005. (In Chinese) [Google Scholar]
- Wang, S.P. Model Test Study on the Tunnel within Cracked Surrounding Rocks. Ph.D. Thesis, Zhejiang University, Hangzhou, China, 2004. (In Chinese). [Google Scholar]
- Yu, C.R. Research on Grouting Influence and Mechanism of Shield Tunneling in the Sand-Gravel Stratum. Ph.D. Thesis, Shanghai Jiao Tong University, Shanghai, China, 2011. (In Chinese). [Google Scholar]
- Pan, K.; Li, M.Y.; Yuan, D.K. Analysis of the DOT tunneling construction parameters in special formation. Strut. Eng. 2010, 26, 125–129. (In Chinese) [Google Scholar]
- O’Reilly, M.P.; Newb, M. Settlement above Tunnels in the United Kingdom-Their Magnitude and Prediction; The National Academies of Sciences, Engineering, and Medicine: Washington, DC, USA, 1982; pp. 173–181. [Google Scholar]
- Yoshikoshi, W.; Watanabe, O.; Takagi, N. Prediction of ground settlements associated with shield tunneling. Soils Found. 1978, 18, 47–59. [Google Scholar] [CrossRef][Green Version]
- Wang, T.; Liu, W.N.; Zhang, C.M.; He, H.; Li, X. Study on ground settlement induced by shallow metro station construction. Chin. J. Rock Mech. Eng. 2007, 26, 1855–1861. (In Chinese) [Google Scholar]
- Zhang, Y.; Su, G.S.; Li, Y.; Wei, M.D.; Liu, B.C. Displacement back-analysis of rock mass parameters for underground caverns using a novel intelligent optimization method. Int. J. Geomech. 2020, 20, 04020035. [Google Scholar] [CrossRef]
- Li, Z.W.; Tao, M.; Du, K.; Cao, W.Z.; Wu, C.Q. Dynamic stress state around shallow-buried cavity under transient P wave loads in different conditions. Tunn. Undergr. Space Tech. 2020, 97, 103228. [Google Scholar] [CrossRef]
- Li, W.; Zhang, C.P. Face stability analysis for a shield tunnel in anisotropic sands. Int. J. Geomech. 2020, 20, 04020043. [Google Scholar] [CrossRef]
- Chen, G.H.; Zou, J.F.; Qian, Z.H. An improved collapse analysis mechanism for the face stability of shield tunnel in layered soils. Geomech. Eng. 2019, 17, 97–107. [Google Scholar]


| Grade | Bulk Density γ/(kN/m3) | Deformation Modulus E/MPa | Cohesion c/kPa | Internal Friction Angle φ/° |
|---|---|---|---|---|
| V | 17~20 | 1000~2000 | 50~200 | 40~50 |
| VI | 15~17 | <1000 | <100 | 30~40 |
| Similar material | 20.6 | 13.1 | 0.375 | 31.35 |
| Test Group | Paraffin Wax (g) | Quartz Sand (g) | Steel Fiber (g) | Scale |
|---|---|---|---|---|
| 1 | 150 | 0 | 0 | 1:-:- |
| 2 | 80 | 160 | 0 | 1:2:- |
| 3 | 60 | 240 | 0 | 1:4:- |
| 4 | 50 | 300 | 0 | 1:6:- |
| 5 | 40 | 360 | 0 | 1:8:- |
| 6 (steel-1) | 60 | 240 | 4 | 15:60:1 |
| 7 (steel-2) | 45 | 270 | 3 | 15:90:1 |
| 8 (steel-3) | 30 | 240 | 2 | 15:120:1 |
| Serial Number | 1 | 2 | 3 | 4 | 5 | 6 | 7 | 8 |
|---|---|---|---|---|---|---|---|---|
| weight (g) | 105.3 | 145.6 | 168.7 | 189.1 | 206.6 | 232.9 | 242.7 | 254.1 |
| bulk density (kN/m3) | 10.4 | 14.5 | 16.8 | 18.8 | 20.6 | 23.2 | 24.2 | 25.3 |
| Poisson ratio | 0.45 | 0.35 | 0.35 | 0.34 | 0.34 | 0.33 | 0.33 | 0.32 |
| E (MPa) | 79.4 | 105.4 | 190.3 | 250.3 | 275.8 | 262.3 | 303.6 | 330.2 |
| Rupture angle (°) | — | — | 32 | 36 | 40 | 39 | 42 | 46 |
| Lining | Bulk Density γ/kN/m3 | Deformation Modulus E/GPa | Poisson Ratio μ |
|---|---|---|---|
| Prototype material | 24–27 | 20–35 | 0.2–0.35 |
| modeling material | 24.2 | 0.295 | 0.33 |
| Pile | Bulk Density γ/kN/m3 | Deformation Modulus E/GPa | Poisson Ratio μ |
|---|---|---|---|
| Prototype material | 25 | 30 | 0.2 |
| modeling material | 13.5–14 | 0.2–0.4 | 0.33 |
| Test Group | Cover Span Ratio (H/D) | Vertical Position of Pile Bottom | Lateral Distance between Pile and Tunnel |
|---|---|---|---|
| 1 | 0.5D | 1D | |
| 1–27 | 2 | 0D | 2D |
| 3 | −0.5D | 3D |
| Cover Span Ratio | Lining Grouting Support | Horizontal Position | Vertical Position | |||
|---|---|---|---|---|---|---|
| NO | Yes | V = 0.5D | V = 0D | V = −0.5D | ||
| H/D = 1 | / | 0.274 | W = 1D | 0.271 | 0.262 | 0.221 |
| W = 2D | 0.267 | 0.243 | 0.218 | |||
| W = 3D | 0.272 | 0.273 | 0.27 | |||
| H/D = 2 | 5.08 | 0.18 | W = 1D | 0.178 | 0.164 | 0.144 |
| W = 2D | 0.162 | 0.154 | 0.139 | |||
| W = 3D | 0.172 | 0.167 | 0.166 | |||
| H/D = 3 | 4.55 | 0.12 | W = 1D | 0.112 | 0.103 | 0.097 |
| W = 2D | 0.114 | 0.104 | 0.101 | |||
| W = 3D | 0.119 | 0.118 | 0.118 | |||
| Cover Span Ratio | Horizontal Position | Vertical Position | ||
|---|---|---|---|---|
| V = 0.5D | V = 0D | V = −0.5D | ||
| H/D = 1 | W = 1D | 1.09 | 4.38 | 19.34 |
| W = 2D | 2.55 | 11.31 | 20.44 | |
| W = 3D | 0.71 | 0.36 | 1.46 | |
| H/D = 2 | W = 1D | 1.11 | 8.89 | 20.00 |
| W = 2D | 10.00 | 14.44 | 22.78 | |
| W = 3D | 4.44 | 7.22 | 7.78 | |
| H/D = 3 | W = 1D | 6.67 | 14.17 | 19.17 |
| W = 2D | 5.00 | 13.33 | 15.83 | |
| W = 3D | 0.83 | 1.67 | 1.67 | |
| Cover Span Ratio | Lining Grouting Support | Horizontal Position | Vertical Position | |||
|---|---|---|---|---|---|---|
| NO | Yes | V = 0.5D | V = 0D | V = −0.5D | ||
| H/D = 1 | / | 1.006 | W = 1D | 0.951 | 0.928 | 0.878 |
| W = 2D | 0.946 | 0.930 | 0.898 | |||
| W = 3D | 0.990 | 0.954 | 0.888 | |||
| H/D = 2 | 0.766 | 0.785 | W = 1D | 0.670 | 0.640 | 0.589 |
| W = 2D | 0.665 | 0.618 | 0.583 | |||
| W = 3D | 0.709 | 0.692 | 0.654 | |||
| H/D = 3 | 0.482 | 0.602 | W = 1D | 0.611 | 0.598 | 0.562 |
| W = 2D | 0.653 | 0.634 | 0.616 | |||
| W = 3D | 0.573 | 0.559 | 0.531 | |||
| H/D | Horizontal | Vertical | ||
|---|---|---|---|---|
| 1D→2D | 1D→3D | −0.5D→0D | −0.5D→0.5D | |
| 1 | 65.68 | 90.54 | 57.09 | 80.61 |
| 2 | 59.23 | 84.11 | 60.28 | 53.29 |
| 3 | 60.01 | 83.94 | 39.49 | 67.54 |
| H/D | Horizontal | Vertical | ||
|---|---|---|---|---|
| 1D→2D | 1D→3D | 0.5D→0D | −0.5D→0.5D | |
| 1 | 41.44 | 63.63 | 8.33 | 19.54 |
| 2 | 56.11 | 65.69 | 9.27 | 19.28 |
| 3 | 61.41 | 72.56 | 7.42 | 13.69 |
| H/D | Horizontal | Vertical | ||
|---|---|---|---|---|
| 2D→1D | 2D→3D | 0.5D→0D | −0.5D→0.5D | |
| 1 | 40.10 | 14.79 | 4.41 | 19.55 |
| 2 | 39.62 | 12.34 | 6.16 | 19.78 |
| 3 | 42.09 | 14.23 | 6.42 | 19.32 |
Publisher’s Note: MDPI stays neutral with regard to jurisdictional claims in published maps and institutional affiliations. |
© 2022 by the authors. Licensee MDPI, Basel, Switzerland. This article is an open access article distributed under the terms and conditions of the Creative Commons Attribution (CC BY) license (https://creativecommons.org/licenses/by/4.0/).
Share and Cite
Guo, X.; Li, Z.; Zhang, X.; Pu, M. Model Test Study on a Shield Tunnel Adjacent to Pile in the Sub-Clay of a Coastal Area. Appl. Sci. 2022, 12, 7718. https://doi.org/10.3390/app12157718
Guo X, Li Z, Zhang X, Pu M. Model Test Study on a Shield Tunnel Adjacent to Pile in the Sub-Clay of a Coastal Area. Applied Sciences. 2022; 12(15):7718. https://doi.org/10.3390/app12157718
Chicago/Turabian StyleGuo, Xuan, Zhitong Li, Xiaoli Zhang, and Mengjun Pu. 2022. "Model Test Study on a Shield Tunnel Adjacent to Pile in the Sub-Clay of a Coastal Area" Applied Sciences 12, no. 15: 7718. https://doi.org/10.3390/app12157718
APA StyleGuo, X., Li, Z., Zhang, X., & Pu, M. (2022). Model Test Study on a Shield Tunnel Adjacent to Pile in the Sub-Clay of a Coastal Area. Applied Sciences, 12(15), 7718. https://doi.org/10.3390/app12157718