
Chicken Swarm-Based Feature Subset Selection with Optimal Machine Learning Enabled Data Mining Approach

 ,
, 
Abstract
:1. Introduction
- We propose a model comprising data preprocessing, CSO-FS, ELM classification, and AHB parameter;
- We designed a new CSO-FS technique to reduce the curse of the dimensionality problem and enhanced the classification performance;
- We employed the ELM classification model with the AHB-based parameter optimization technique for the EDM process;
- We validated the performance of the FSSML-EDM model using the benchmark dataset from the UCI repository.
2. Literature Review
3. The Proposed Model
3.1. Process Involved in CSO-FS Technique
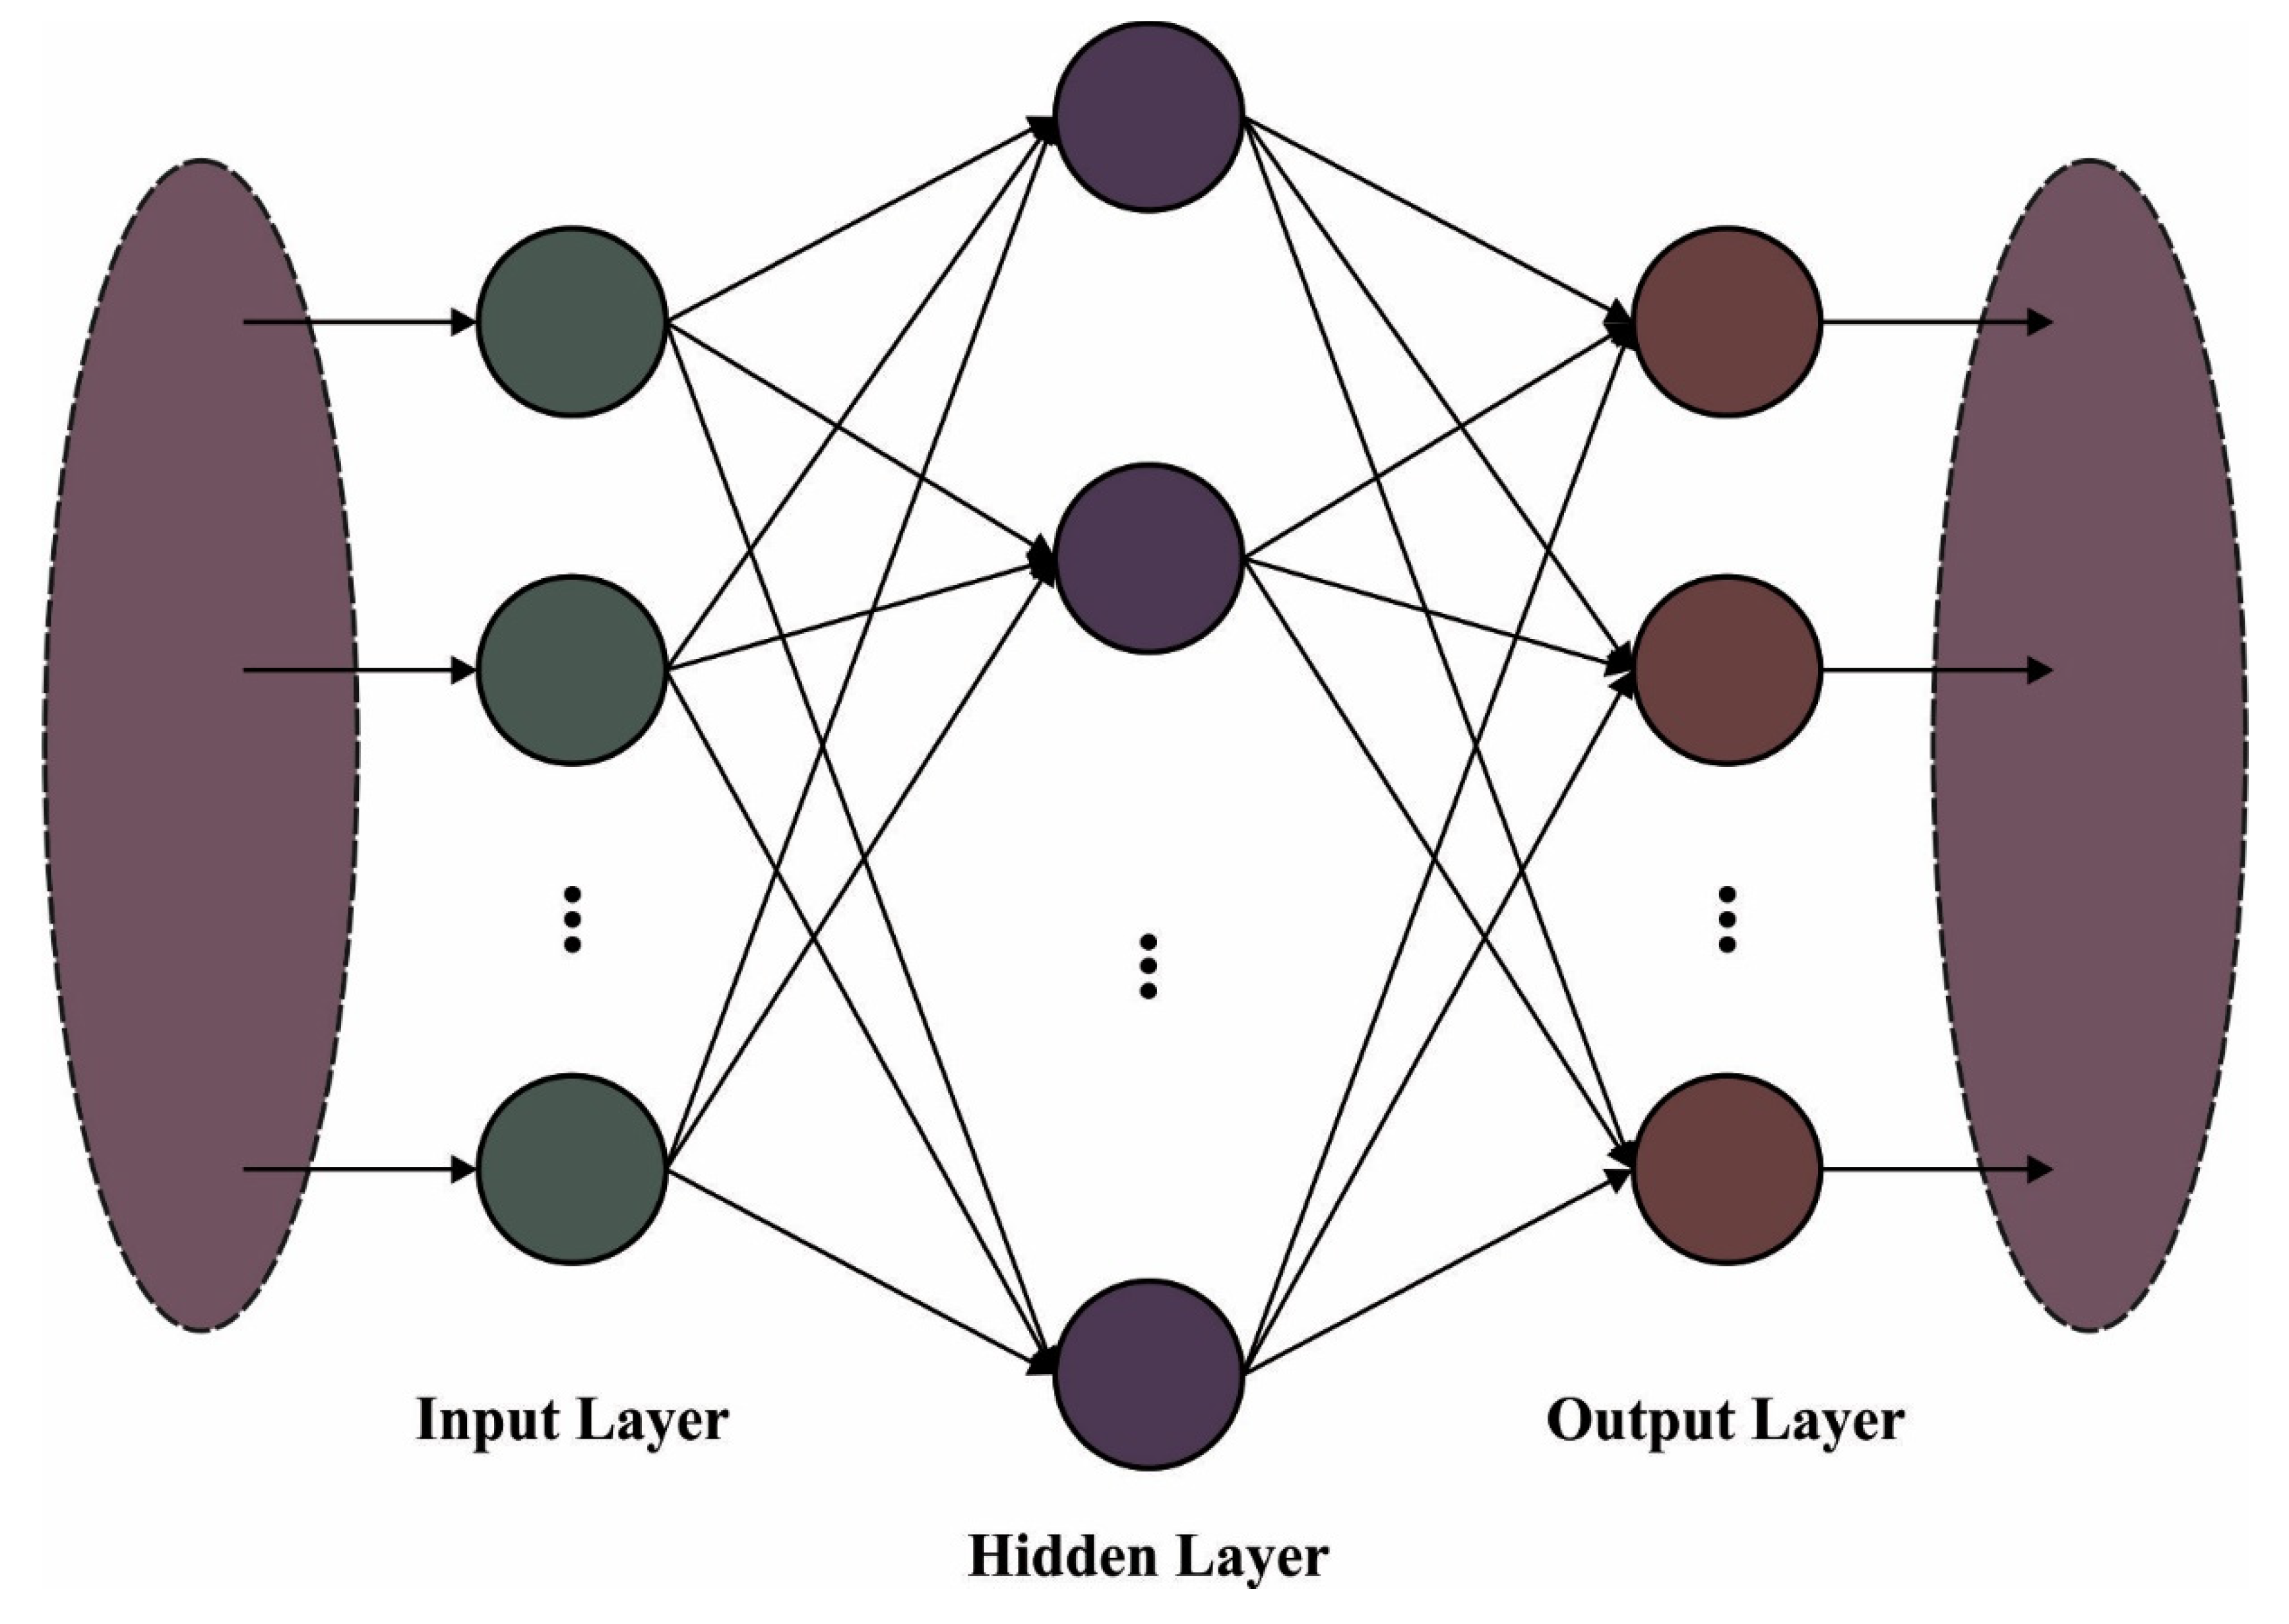
3.2. ELM Based Classification
3.3. AHB Based Parameter Optimization
4. Experimental Validation
5. Conclusions
Author Contributions
Funding
Data Availability Statement
Conflicts of Interest
References
- Prakash, B.A.; Ramakrishnan, N. Leveraging Propagation for Data Mining: Models, Algorithms and Applications. In Proceedings of the 22nd ACM SIGKDD International Conference on Knowledge Discovery and Data Mining, San Francisco, CA, USA, 13–17 August 2016; pp. 2133–2134. [Google Scholar]
- Jalota, C.; Agrawal, R. Analysis of Educational Data Mining Using Classification. In Proceedings of the 2019 International Conference on Machine Learning, Big Data, Cloud and Parallel Computing (COMITCon), Faridabad, India, 14–16 February 2019; pp. 243–247. [Google Scholar] [CrossRef]
- Kenthapadi, K.; Mironov, I.; Thakurta, A.G. Privacy-preserving data mining in industry. In Proceedings of the Twelfth ACM International Conference on Web Search and Data Mining, WSDM’19: The Twelfth ACM International Conference on Web Search and Data Mining, Melbourne, VIC, Australia, 11–15 February 2019; pp. 840–841. [Google Scholar]
- Yan, D.; Qin, S.; Bhattacharya, D.; Chen, J.; Zaki, M.J. 20th International Workshop on Data Mining in Bioinformatics (BIOKDD 2021). In Proceedings of the 27th ACM SIGKDD Conference on Knowledge Discovery & Data Mining, Singapore, 14–18 August 2021; pp. 4175–4176. [Google Scholar]
- Aldowah, H.; Al-Samarraie, H.; Fauzy, W.M. Educational data mining and learning analytics for 21st century higher education: A review and synthesis. Telemat. Inform. 2019, 37, 13–49. [Google Scholar] [CrossRef]
- Fernandes, E.; Holanda, M.; Victorino, M.; Borges, V.R.P.; Carvalho, R.; Van Erven, G. Educational data mining: Predictive analysis of academic performance of public school students in the capital of Brazil. J. Bus. Res. 2019, 94, 335–343. [Google Scholar] [CrossRef]
- De Andrade, T.L.; Rigo, S.J.; Barbosa, J.L.V. Active Methodology, Educational Data Mining and Learning Analytics: A Systematic Mapping Study. Inform. Educ. 2021, 20, 171–204. [Google Scholar] [CrossRef]
- Sáiz-Manzanares, M.; Rodríguez-Díez, J.; Díez-Pastor, J.; Rodríguez-Arribas, S.; Marticorena-Sánchez, R.; Ji, Y. Monitoring of Student Learning in Learning Management Systems: An Application of Educational Data Mining Techniques. Appl. Sci. 2021, 11, 2677. [Google Scholar] [CrossRef]
- Anand, N.; Sehgal, R.; Anand, S.; Kaushik, A. Feature selection on educational data using Boruta algorithm. Int. J. Comput. Intell. Stud. 2021, 10, 27. [Google Scholar] [CrossRef]
- Shrestha, S.; Pokharel, M. Educational data mining in moodle data. Int. J. Inform. Commun. Technol. (IJ-ICT) 2021, 10, 9. [Google Scholar] [CrossRef]
- Injadat, M.; Moubayed, A.; Nassif, A.B.; Shami, A. Systematic ensemble model selection approach for educational data mining. Knowl.-Based Syst. 2020, 200, 105992. [Google Scholar] [CrossRef]
- Ashraf, M.; Zaman, M.; Ahmed, M. An Intelligent Prediction System for Educational Data Mining Based on Ensemble and Filtering approaches. Procedia Comput. Sci. 2020, 167, 1471–1483. [Google Scholar] [CrossRef]
- Dabhade, P.; Agarwal, R.; Alameen, K.; Fathima, A.; Sridharan, R.; Gopakumar, G. Educational data mining for predicting students’ academic performance using machine learning algorithms. Mater. Today Proc. 2021, 47, 5260–5267. [Google Scholar] [CrossRef]
- Nahar, K.; Shova, B.I.; Ria, T.; Rashid, H.B.; Islam, A. Mining educational data to predict students performance. Educ. Inf. Technol. 2021, 26, 6051–6067. [Google Scholar] [CrossRef]
- Deb, S.; Gao, X.-Z.; Tammi, K.; Kalita, K.; Mahanta, P. Recent Studies on Chicken Swarm Optimization algorithm: A review (2014–2018). Artif. Intell. Rev. 2019, 53, 1737–1765. [Google Scholar] [CrossRef]
- Zhang, L.; Yang, H.; Jiang, Z. Imbalanced biomedical data classification using self-adaptive multilayer ELM combined with dynamic GAN. Biomed. Eng. Online 2018, 17, 181. [Google Scholar] [CrossRef] [PubMed] [Green Version]
- Roozbeh, M.; Arashi, M.; Hamzah, N.A. Generalized Cross-Validation for Simultaneous Optimization of Tuning. Iran. J. Sci. Technol. Trans. A Sci. 2020, 44, 473–485. [Google Scholar] [CrossRef]
- Amini, M.; Roozbeh, M. Optimal partial ridge estimation in restricted semiparametric regression models. J. Multivar. Anal. 2015, 136, 26–40. [Google Scholar] [CrossRef]
- Roozbeh, M. Optimal QR-based estimation in partially linear regression models with correlated errors using GCV criterion. Comput. Stat. Data Anal. 2018, 117, 45–61. [Google Scholar] [CrossRef]
- Roozbeh, M.; Babaie-Kafaki, S.; Aminifard, Z. Improved high-dimensional regression models with matrix approximations applied to the comparative case studies with support vector machines. Optim. Methods Softw. 2022, 1–18. [Google Scholar] [CrossRef]
- Zhang, Z.; Huang, C.; Huang, H.; Tang, S.; Dong, K. An optimization method: Hummingbirds optimization algorithm. J. Syst. Eng. Electron. 2018, 29, 386–404. [Google Scholar] [CrossRef]
- Duhayyim, M.A.; Marzouk, R.; Al-Wesabi, F.N.; Alrajhi, M.; Hamza, M.A.; Zamani, A.S. An Improved Evolutionary Algorithm for Data Mining and Knowledge Discovery. CMC-Comput. Mater. Contin. 2022, 71, 1233–1247. [Google Scholar]


| Details | Values |
|---|---|
| Number of samples | 649 |
| Feature count | 32 |
| Class count | 2 |
| Source | https://archive.ics.uci.edu/ml/datasets/student+performance (accessed on 30 January 2022) |
| Class Labels | Accuracy | Precision | Recall | F-Score | MCC | Kappa Score |
|---|---|---|---|---|---|---|
| Entire Dataset | ||||||
| Pass | 97.23 | 97.50 | 99.27 | 98.38 | 89.08 | - |
| Fail | 97.23 | 95.56 | 86.00 | 90.53 | 89.08 | - |
| Average | 97.23 | 96.53 | 92.64 | 94.45 | 89.08 | 88.91 |
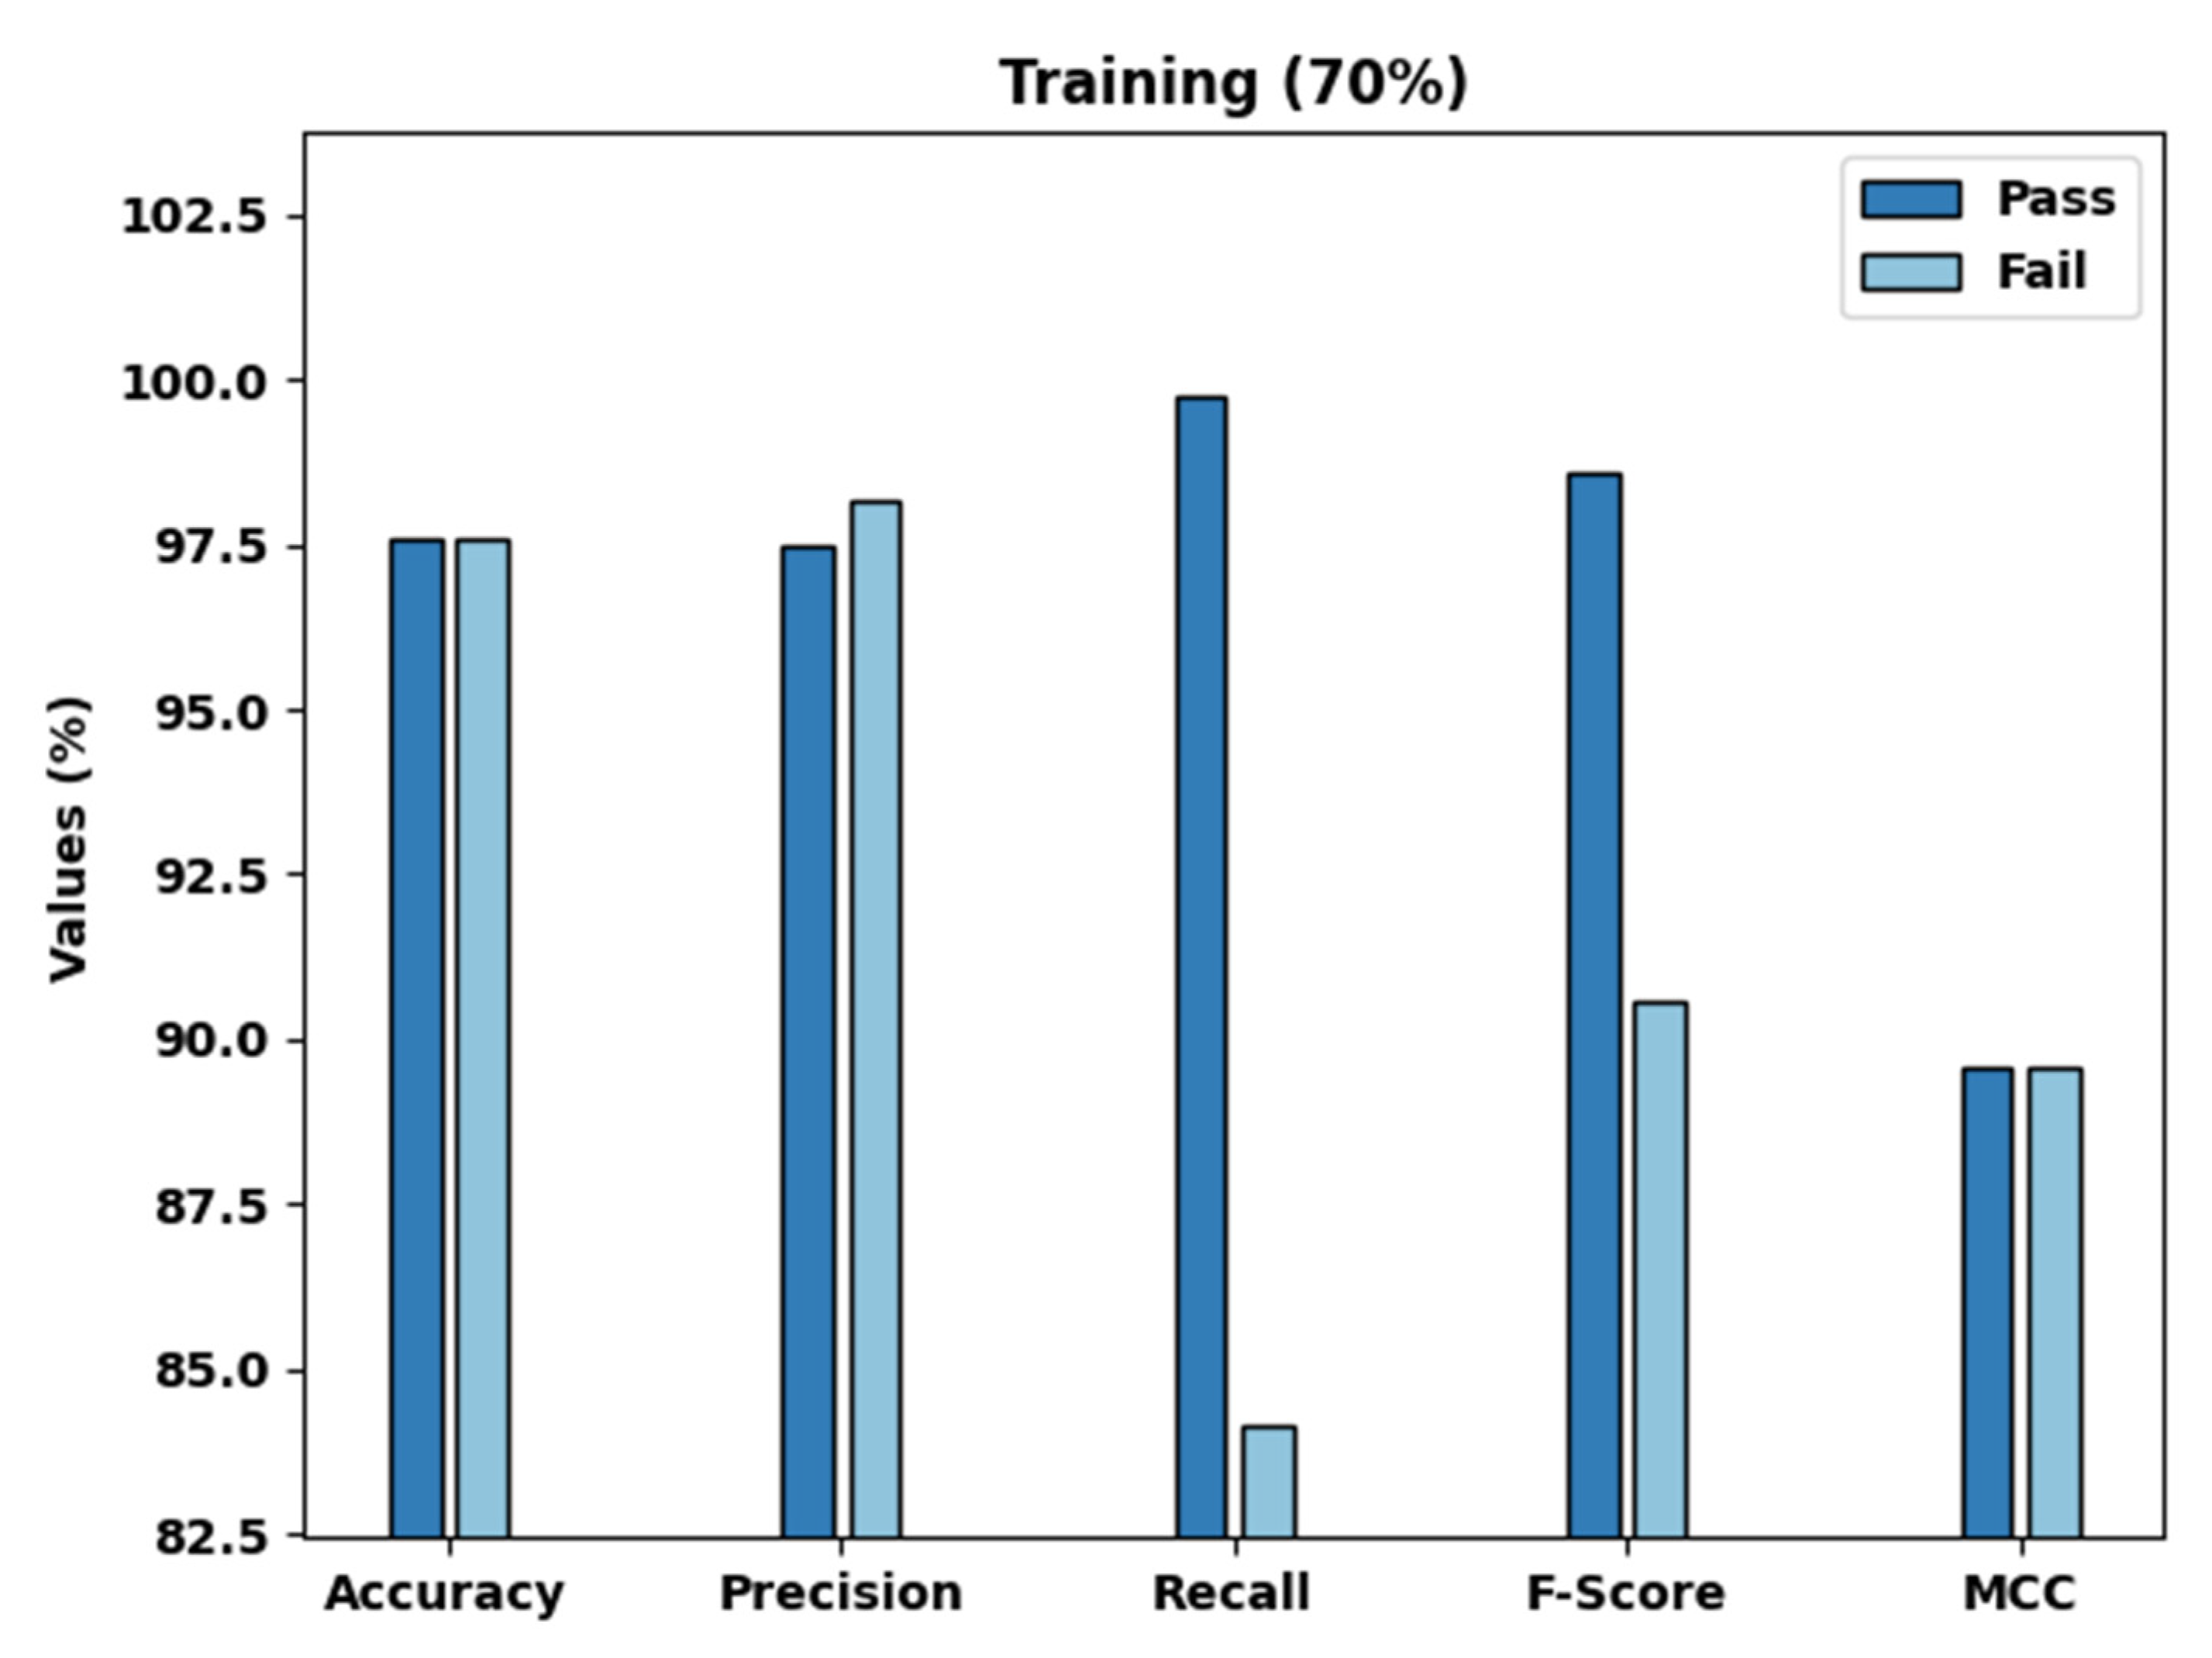
| Training Set (70%) | ||||||
| Pass | 97.58 | 97.50 | 99.74 | 98.61 | 89.57 | - |
| Fail | 97.58 | 98.15 | 84.13 | 90.60 | 89.57 | - |
| Average | 97.58 | 97.82 | 91.94 | 94.60 | 89.57 | 89.22 |
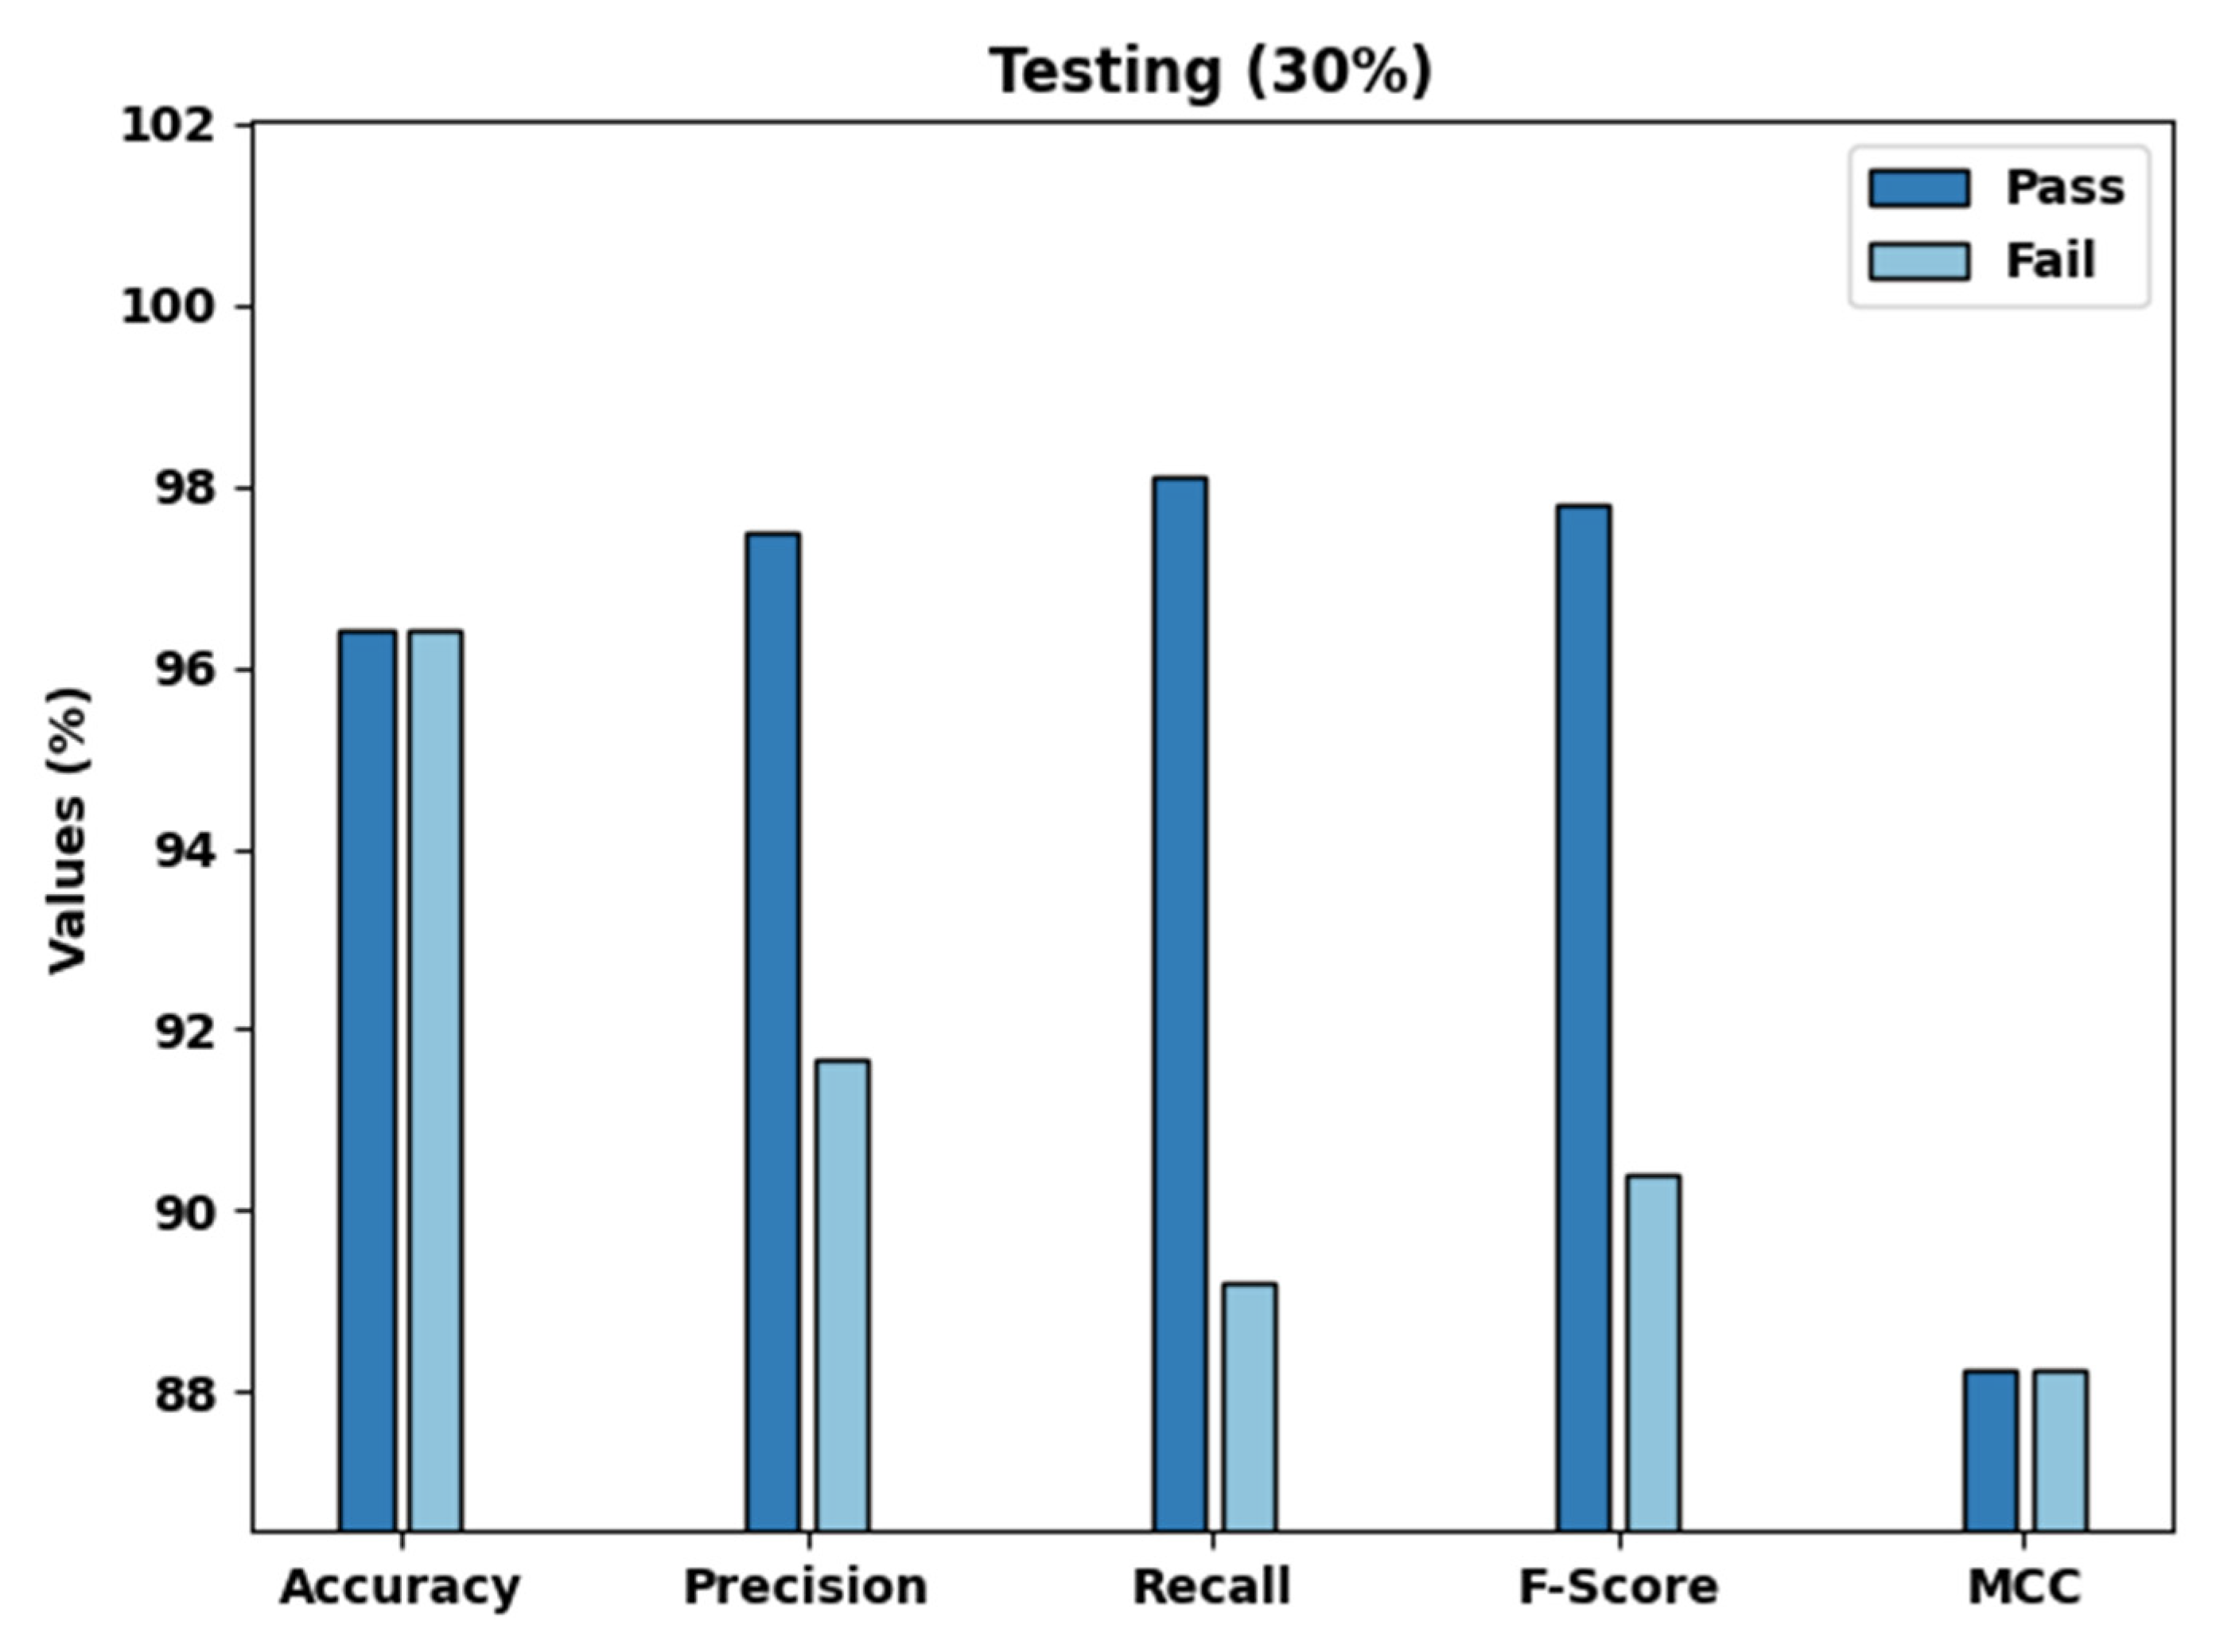
| Testing Set (30%) | ||||||
| Pass | 96.41 | 97.48 | 98.1 | 97.79 | 88.22 | - |
| Fail | 96.41 | 91.67 | 89.19 | 90.41 | 88.22 | - |
| Average | 96.41 | 94.58 | 93.65 | 94.1 | 88.22 | 88.2 |
| Methods | Precision | Recall | Accuracy | F-Score | MCC | Kappa |
|---|---|---|---|---|---|---|
| FSSML-EDM | 94.58 | 93.65 | 96.41 | 94.10 | 88.22 | 88.20 |
| IEAFSSNFC | 93.81 | 92.39 | 90.33 | 93.01 | 73.78 | 73.37 |
| NFC Algorithm | 81.76 | 91.41 | 81.66 | 86.99 | 56.21 | 50.10 |
| NN Algorithm | 67.58 | 85.76 | 64.30 | 76.03 | 57.52 | 67.82 |
| SVM Algorithm | 68.83 | 86.77 | 66.36 | 76.63 | 66.27 | 66.17 |
| DT Algorithm | 78.22 | 93.40 | 77.81 | 83.02 | 52.87 | 59.80 |
| RF Algorithm | 74.95 | 91.90 | 75.40 | 83.39 | 62.68 | 58.34 |
Publisher’s Note: MDPI stays neutral with regard to jurisdictional claims in published maps and institutional affiliations. |
© 2022 by the authors. Licensee MDPI, Basel, Switzerland. This article is an open access article distributed under the terms and conditions of the Creative Commons Attribution (CC BY) license (https://creativecommons.org/licenses/by/4.0/).
Share and Cite
Hamdi, M.; Hilali-Jaghdam, I.; Khayyat, M.M.; Elnaim, B.M.E.; Abdel-Khalek, S.; Mansour, R.F. Chicken Swarm-Based Feature Subset Selection with Optimal Machine Learning Enabled Data Mining Approach. Appl. Sci. 2022, 12, 6787. https://doi.org/10.3390/app12136787
Hamdi M, Hilali-Jaghdam I, Khayyat MM, Elnaim BME, Abdel-Khalek S, Mansour RF. Chicken Swarm-Based Feature Subset Selection with Optimal Machine Learning Enabled Data Mining Approach. Applied Sciences. 2022; 12(13):6787. https://doi.org/10.3390/app12136787
Chicago/Turabian StyleHamdi, Monia, Inès Hilali-Jaghdam, Manal M. Khayyat, Bushra M. E. Elnaim, Sayed Abdel-Khalek, and Romany F. Mansour. 2022. "Chicken Swarm-Based Feature Subset Selection with Optimal Machine Learning Enabled Data Mining Approach" Applied Sciences 12, no. 13: 6787. https://doi.org/10.3390/app12136787
APA StyleHamdi, M., Hilali-Jaghdam, I., Khayyat, M. M., Elnaim, B. M. E., Abdel-Khalek, S., & Mansour, R. F. (2022). Chicken Swarm-Based Feature Subset Selection with Optimal Machine Learning Enabled Data Mining Approach. Applied Sciences, 12(13), 6787. https://doi.org/10.3390/app12136787