Article

Simulation Study of Thermal–Mechanical Coupling Fretting Wear of Ti-6Al-4V Alloy

School of Mechanical and Electrical Engineering, Xi’an University of Architecture and Technology, Xi’an 710055, China
*
Author to whom correspondence should be addressed.
Appl. Sci. 2022, 12(15), 7400; https://doi.org/10.3390/app12157400
Submission received: 27 June 2022 / Revised: 17 July 2022 / Accepted: 21 July 2022 / Published: 23 July 2022
(This article belongs to the Section Applied Thermal Engineering)

Abstract

:
Fretting wear phenomenon has a non-negligible impact on the reliability of the contact parts of mechanical power systems. The impact of temperature increases in actual working conditions is taken into consideration in order to increase the accuracy of fretting wear prediction. Temperature-dependent wear coefficients were added to the energy dissipation wear model, and the UMESHMOTION subroutine was created. A temperature-displacement-coupled finite element model of fretting wear is established based on a cylinder/plane fretting test of Ti-6Al-4V alloy materials. The model takes into account the interaction between temperature, stress, and wear. The effects of the plastic deformation of materials, temperature, number of cycles, fretting velocity, and variable normal load on wear and temperature rise are explored. The results show that the wear amount is small when the temperature rises, and the plastic deformation of materials is not considered. The wear profile is no longer a smooth Hertzian shape when the plastic deformation of materials is considered. The amount of wear increases with the fretting speed and the number of cycles. Meanwhile, the temperature of the contact area and the surface near the contact area increases with the increase in fretting speed. Peak temperature rise of the contact surface increases with the number of cycles, and its horizontal position moves with the cylinder specimen. Furthermore, the wear profile is less smooth under the variable normal load, but the two variable normal loads in the same phase have similar wear profiles and temperature rise distributions. The theoretical resources provided by the research work can be used to design control strategies and optimize mechanical power systems.

1. Introduction

Fretting is the vibratory motion of two contacting objects under the action of a small relative displacement. Frictional behavior accompanying fretting can lead to material damage, including fretting wear and fretting fatigue [1,2,3]. Friction and plastic deformation during fretting wear generate energy and dissipate it in the contact area, leading to temperature rise [4,5]. Temperature affects the mechanical and thermal properties of a material, including its Young’s modulus, yield limit, density, specific heat, and thermal conductivity among others. These material characteristics significantly affect fretting wear, seriously jeopardizing the dependability of the mechanical power system’s contact parts [6]. Therefore, the influence of the temperature rise of the contact surface needs to be considered in the fretting wear simulation study.
For wear problems, the most common wear models include the Archard wear model [7] and the energy dissipation wear model [8]. The Archard wear model is a simplified model related to normal stress, relative slip, and material hardness. It is frequently employed in finite element simulation analysis [9,10]. The Archard model, however, is unable to account for the impact of debris and rough surface microtopography. The Archard wear model is consequently updated and improved on a regular basis. A finite element model considering the effect of a third body (wear debris) on fretting wear in partial slip states was developed by Ahmadi et al. [11]. It demonstrates that the presence of the third body can tremendously affect the fretting wear rate. Two-dimensional models of adhesive wear and abrasive wear on rough surfaces were established by Gong et al. [12] based on fractal theory. They studied the wear of the steel spool valve and discussed the significant effect of the three-body layer on surface damage. Wang et al. [6] extended the 2D model to 3D to analyze the fretting wear process on rough surfaces, and the accuracy of the model is progressed by the neural network algorithm. However, the Archard wear model is only applicable when the friction coefficient is constant [13,14]. The energy dissipation wear model has also been widely used in recent years because it is not affected by the friction coefficient. Electrical contact durability under fretting wear was studied by Jiang et al. [15] using an energy dissipation model. The failure of electromagnetic induction is then examined. A spherical/spherical lateral contact model involving the contact angle was developed by Li et al. [16] based on the energy dissipation model. The influence of contact angle and different load conditions on fretting wear is obtained through this model.
There is a strong interaction between fretting wear behavior and temperature [17], but none of the above studies consider temperature. Numerical methods are widely used in the prediction of temperature distribution due to the difficulty in measuring the temperature in the contact zone under fretting. The finite element model of the fractal rough contact surface was established by Qin et al. [18] to study the temperature rise distribution in the fretting contact. The variation of the wear profile was considered by Jin et al. [5] to study the effect of wear on the temperature field of the fretting contact. Shen et al. [19] studied the thermal response of Ti-6Al-4V alloy fretting sliding by integrating the factors of wear, roughness, and plastic dissipation and obtained the influence law of surface roughness and plastic dissipation on temperature rise. Although wear effects were taken into account, the study of the temperature rise distribution on the contact surfaces was the main objective of these works. Meanwhile, the Archard wear model, which cannot be used in situations where the friction coefficient varies, was employed in these studies. The Archard wear model is not appropriate for wear studies that take temperature into account because temperature changes affect the friction coefficient [20,21].
Moreover, all the preceding studies were conducted under constant normal load, and the effect of normal cyclic load was not considered. In practical engineering, the loads in vibration environments are complex and variable. Normal cyclic loading has a non-negligible effect on wear, fatigue, and temperature rise between contact surfaces [22,23,24]. Bhatti et al. [25] studied crack sprouting under nonlinear (normal cyclic loading) loading and analyzed the damage problem under fretting fatigue conditions. Li et al. [26] investigated the temperature rise distribution between fretting contact surfaces under normal cyclic loading. It was observed that the amplitude of surface temperature rise under normal cyclic loading was lower than that under constant normal loading. Regrettably, there are few studies on fretting wear under normal cyclic loading.
In response to the problems of the above study, a numerical method is adopted to simulate wear evolution considering the effect of temperature in this paper. The variable wear coefficient was used to consider the effect of temperature based on the energy dissipation model, and the UMESHMOTION subroutine was created. Then, a coupled temperature–displacement finite element model for calculating fretting wear was developed based on the Ti-6Al-4V alloy fretting test. As most Ti-alloys [27,28,29], Ti-6Al-4V alloy possesses good high-temperature properties and a high Young’s modulus, they were selected for this study. The correctness of the model was verified by comparing its results with the Archard model. The interactions between temperature, stress, and wear are revealed using the model. Finally, the effects of temperature, plastic, number of cycles, and fretting speed and normal cyclic load on wear and temperature rise are explored.

2. Numerical Calculation Method

2.1. Energy Dissipation Wear Model

Temperature variations in the contact zone alter the coefficient of friction between the surfaces in contact. Energy dissipation models in existing theoretical wear models are not affected by the coefficient of friction. Therefore, the energy wear model is used as the theoretical model for the study. According to the energy model [26], the amount of wear is proportional to the energy consumed between surfaces, which is expressed as
V = K E E d
E d = Q d S
where V is the wear volume, KE is the energy wear model wear coefficient, Ed is the energy consumed by wear, Q is the frictional shear force, and S is the specimen displacement amplitude.
Differential transformation of Equations (1) and (2) is carried out to obtain the local wear depth at position x, which is expressed as
d h ( x ) = K E q ( x ) d s ( x )
where q(x) is the local shear stress at position x and ds(x) is the increment of the local relative slip distance.
During fretting, shear stress varies. Therefore, the integral form of the model is utilized. For a two-dimensional contact surface, the wear depth at moment t and at position x can be expressed as
h ( x , t ) = K E 0 t q ( x , t ) d s ( x , t )
where q(x, t) is the corresponding shear stress at moment t and ds(x, t) is the increment of the relative slip distance at moment t.

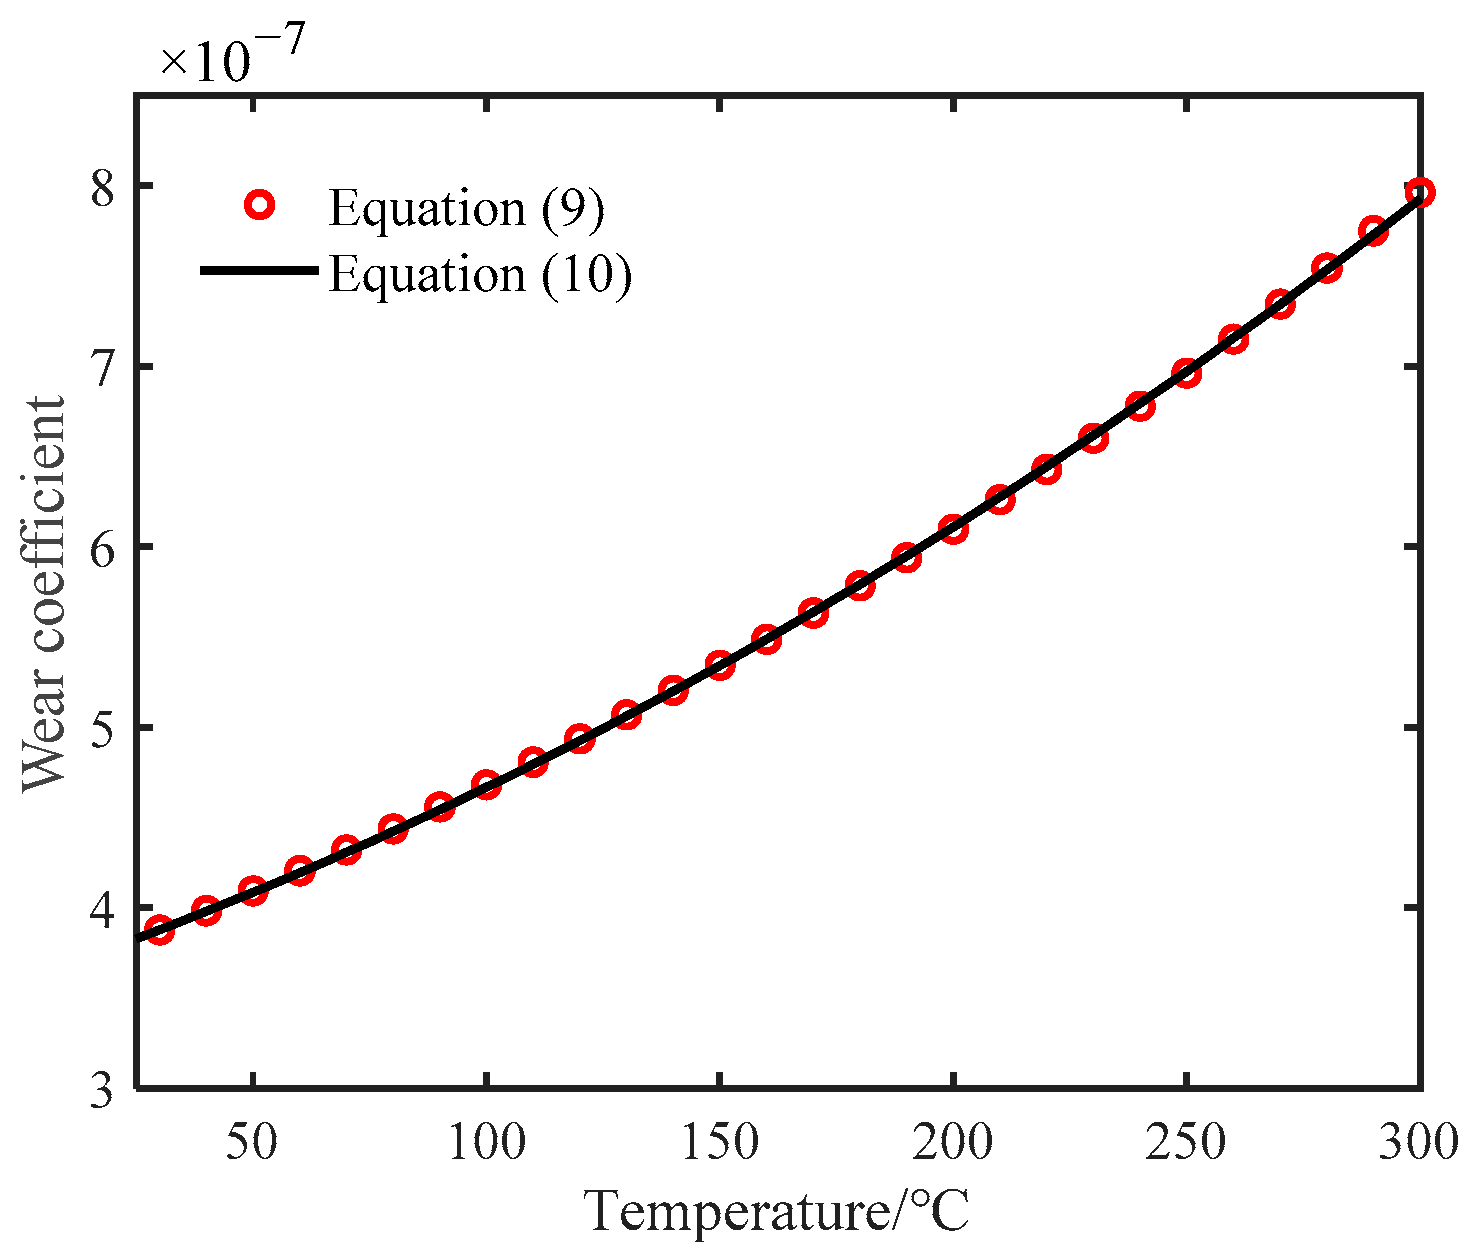
2.2. Modified Energy Wear Model

The conventional energy model does not include temperature effects. In order to consider the effect of temperature on wear, a wear coefficient dependent on temperature T is used. The modified wear depth expression is
h ( x , t , T ) = K E ( T ) 0 t q ( x , t ) d s ( x , t )
where KE(T) is the energy wear coefficient dependent on temperature.
The energy wear coefficient KE(T) is an unknown parameter. Based on the equations of the energy wear model and the Archard wear model [9], it can be deduced that the following relationship exists between the wear coefficients corresponding to the two models [14]
K A = μ K E
where KA is the wear coefficient of the Archard wear model and μ is the friction coefficient between the two contact surfaces.
As mentioned earlier, temperature affects the friction coefficient, and lower temperatures lead to larger friction coefficients. According to the results of the fretting wear experiments on Ti-6Al-4V [20,21], it is known that the friction coefficient is linearly related to the temperature below 300 °C, which is expressed as
μ ( T ) = 0.8 8.84 × 10 4 ( T 25 )
where μ(T) is the coefficient of friction dependent on temperature.
Similarly, temperature-dependent wear coefficients for the Archard model can be obtained from the Ti-6Al-4V wear tests performed by Wang et al. [30]. Below the critical transition temperature (around 350 °C), the Archard wear coefficient increases linearly with temperature, which is expressed as
K A ( T ) = 3.06 × 10 7 + 5 × 10 10 ( T 25 )
where KA(T) is the Archard wear coefficient dependent on temperature.
Combining Equations (6)–(8) to obtain the energy wear coefficient dependent on temperature gives
K E ( T ) = K A ( T ) μ ( T ) = 3.06 × 10 7 + 5 × 10 10 ( T 25 ) 0.8 8.84 × 10 4 ( T 25 )
In order to write the wear subroutine more conveniently, Equation (9) is fitted using the least squares method, and the fitted expression is
K E ( T ) = 1.95 × 10 12 T 2 + 8.51 × 10 10 T + 3.62 × 1 0 7
The fitting effect is shown in Figure 1.

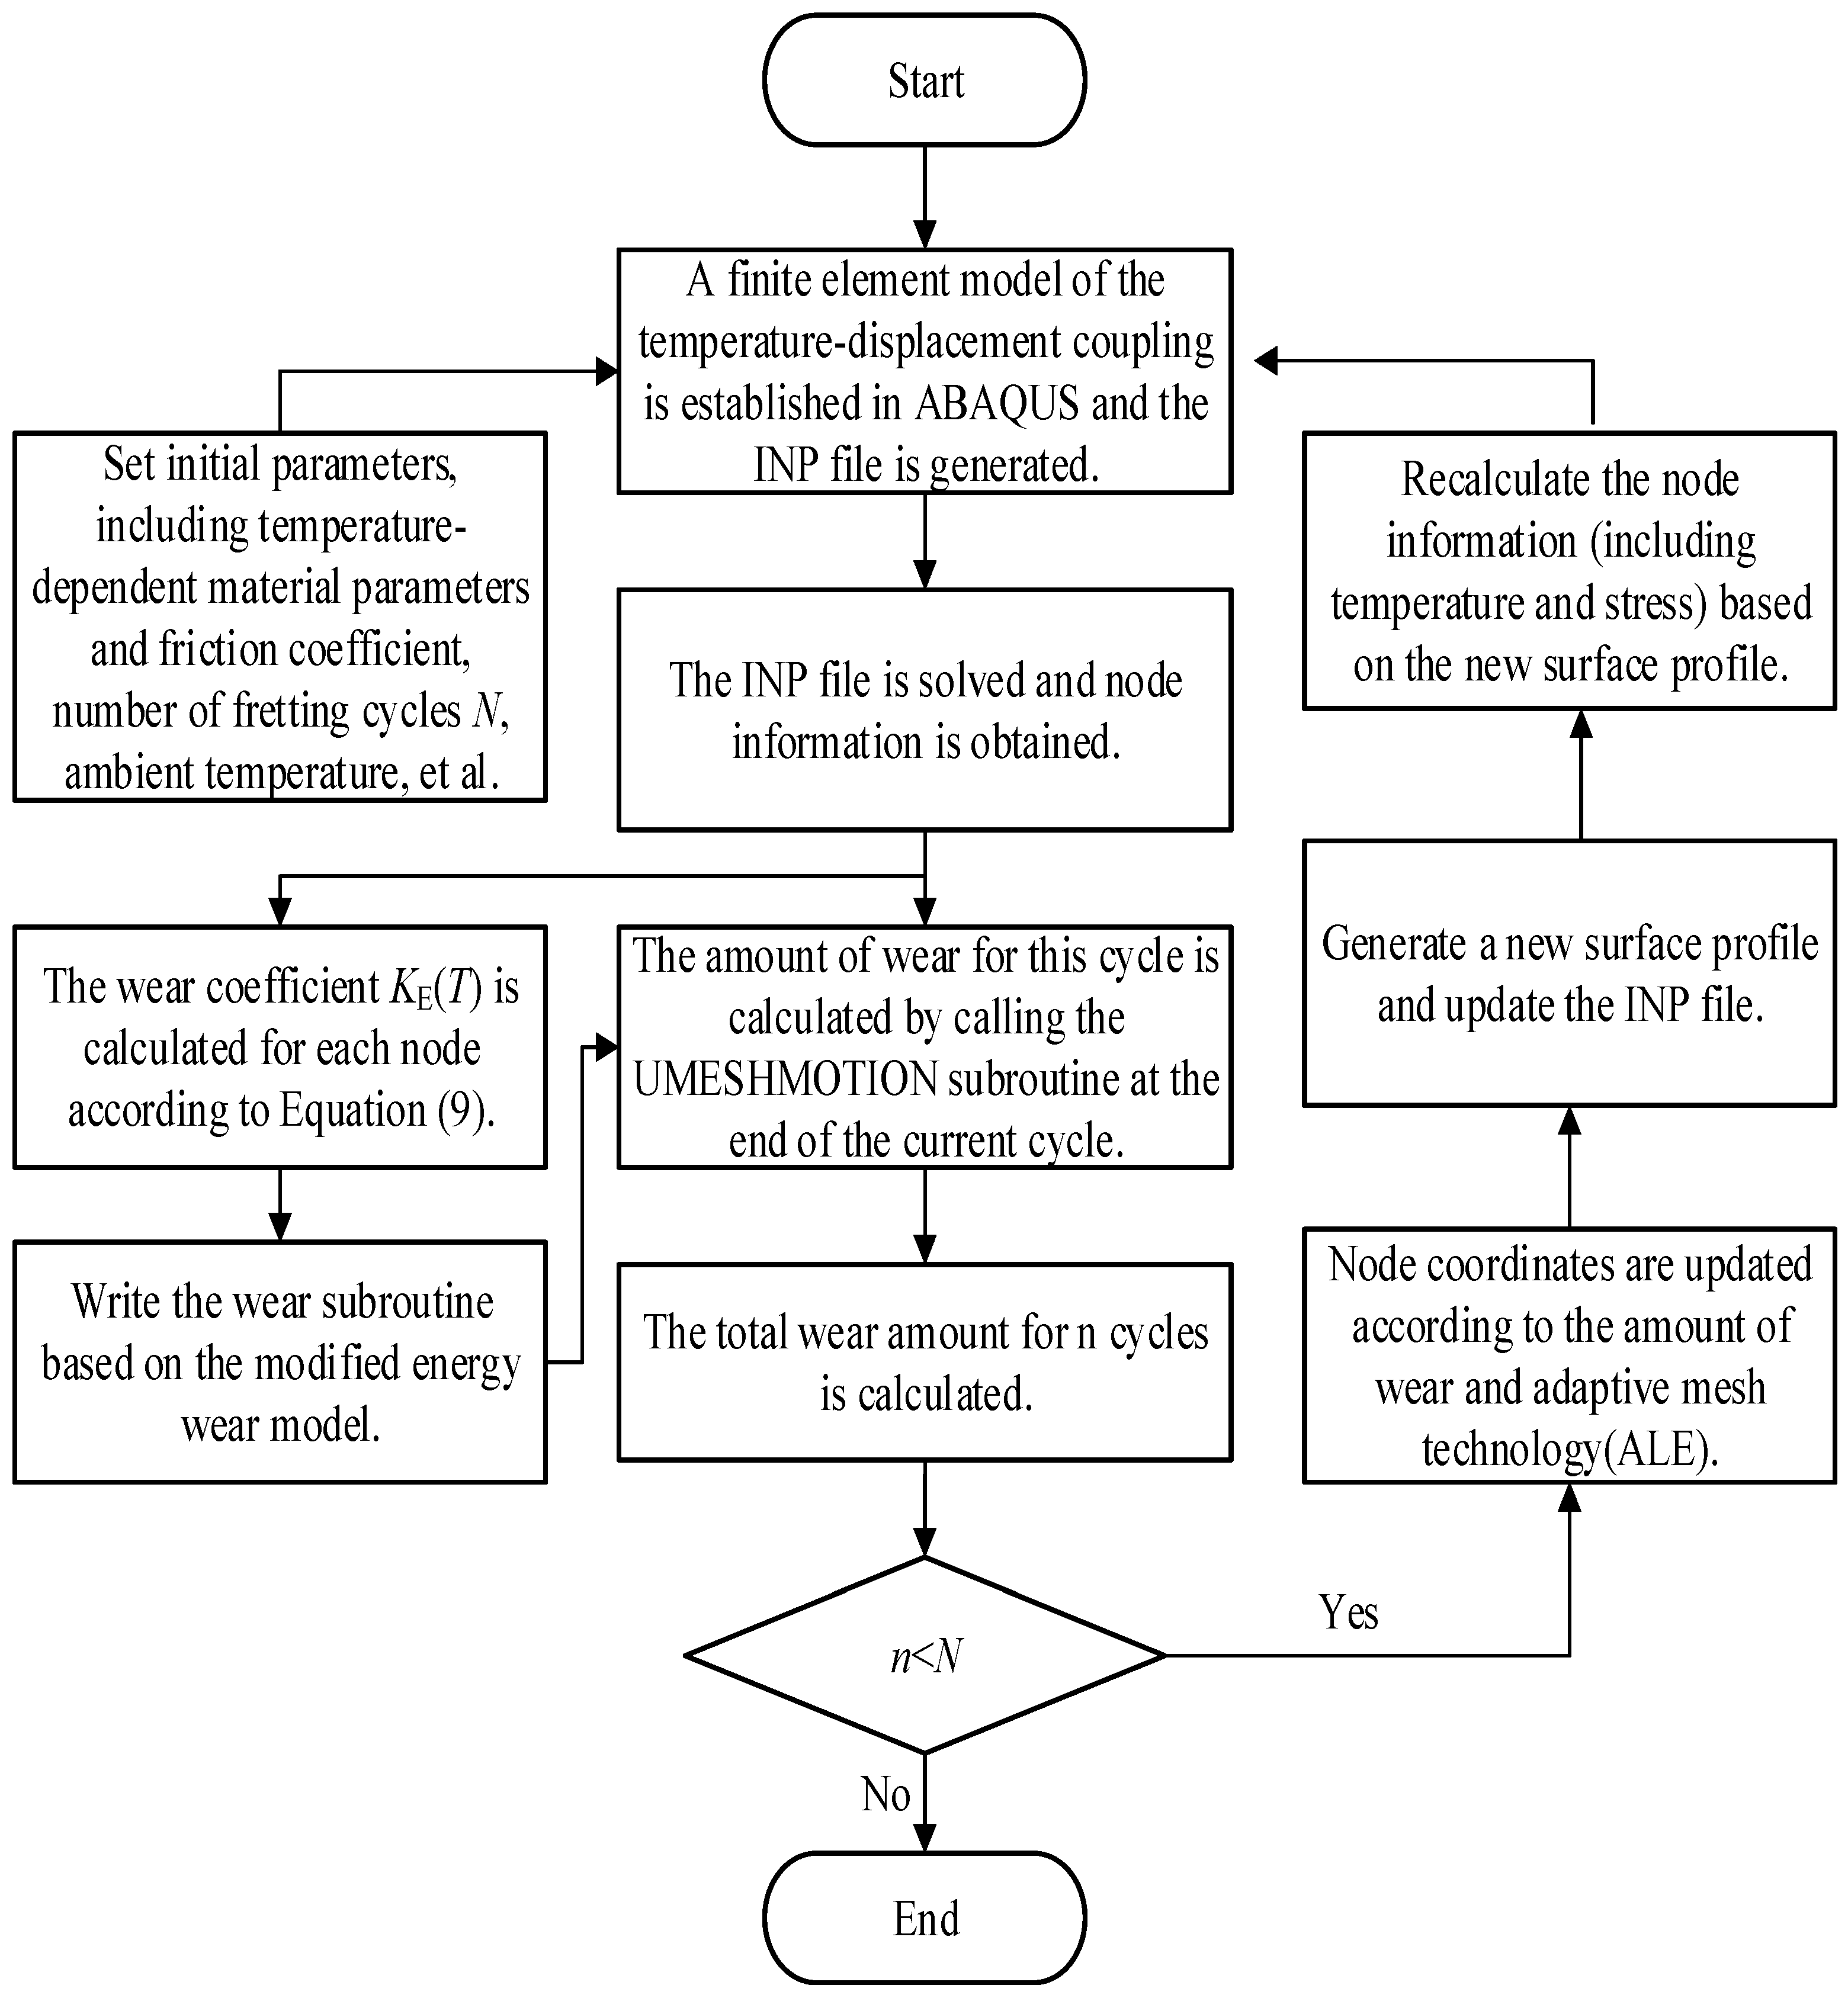
2.3. Model Solving Process

Throughout the fretting wear process, there is always a sophisticated coupling relationship between heat, stress, and wear. In ABAQUS finite element software, a temperature–displacement coupled finite element model of fretting slip is established. The modified energy wear model is then introduced into the temperature–displacement coupled finite element analysis through the user subroutine UMESHMOTION to perform the coupling analysis of heat, stress, and wear. The numerical simulation flow of the coupled heat–force–wear fretting wear is shown in Figure 2, and the specific steps are as described in the following.
(1)
In ABAQUS software, the finite element model of temperature–displacement coupling is established, and related parameters are set. The parameters include the friction coefficient and material parameters that vary with temperature, as well as the load, the number of fretting cycles, and the ambient temperature, etc. An INP file containing the model information is generated.
(2)
Solving the INP file to obtain information about the nodes in the contact area, including node temperature, node coordinates, contact stress, and relative slip distance.
(3)
Writing the UMESHMOTION wear subroutine based on the modified energy wear model; first calculate or update the energy wear coefficient KE(T) at the corresponding node using Equation (9) and the obtained node temperature T, and then calculate the wear amount according to Equation (4).
(4)
Calling the wear subroutine at the end of the current fretting cycle to calculate the amount of wear for that fretting cycle.
(5)
Updating the node coordinates according to the wear amount of that cycle combined with the adaptive mesh technique (ALE) to generate the surface profile after wear and update the INP file.
(6)
Information such as temperature and stress of the node is recalculated based on the new surface profile, and then the energy wear coefficient KE(T) is updated.
(7)
Counting the number of fretting cycles n, accumulate the total wear for n cycles and record.
(8)
Determine whether the number of fretting cycles n reaches the target number of cycles N. If it does not, the judgment result is yes, and the cycle proceeds to steps (2)–(6). If it does, the judgment result is no, and the simulation ends.

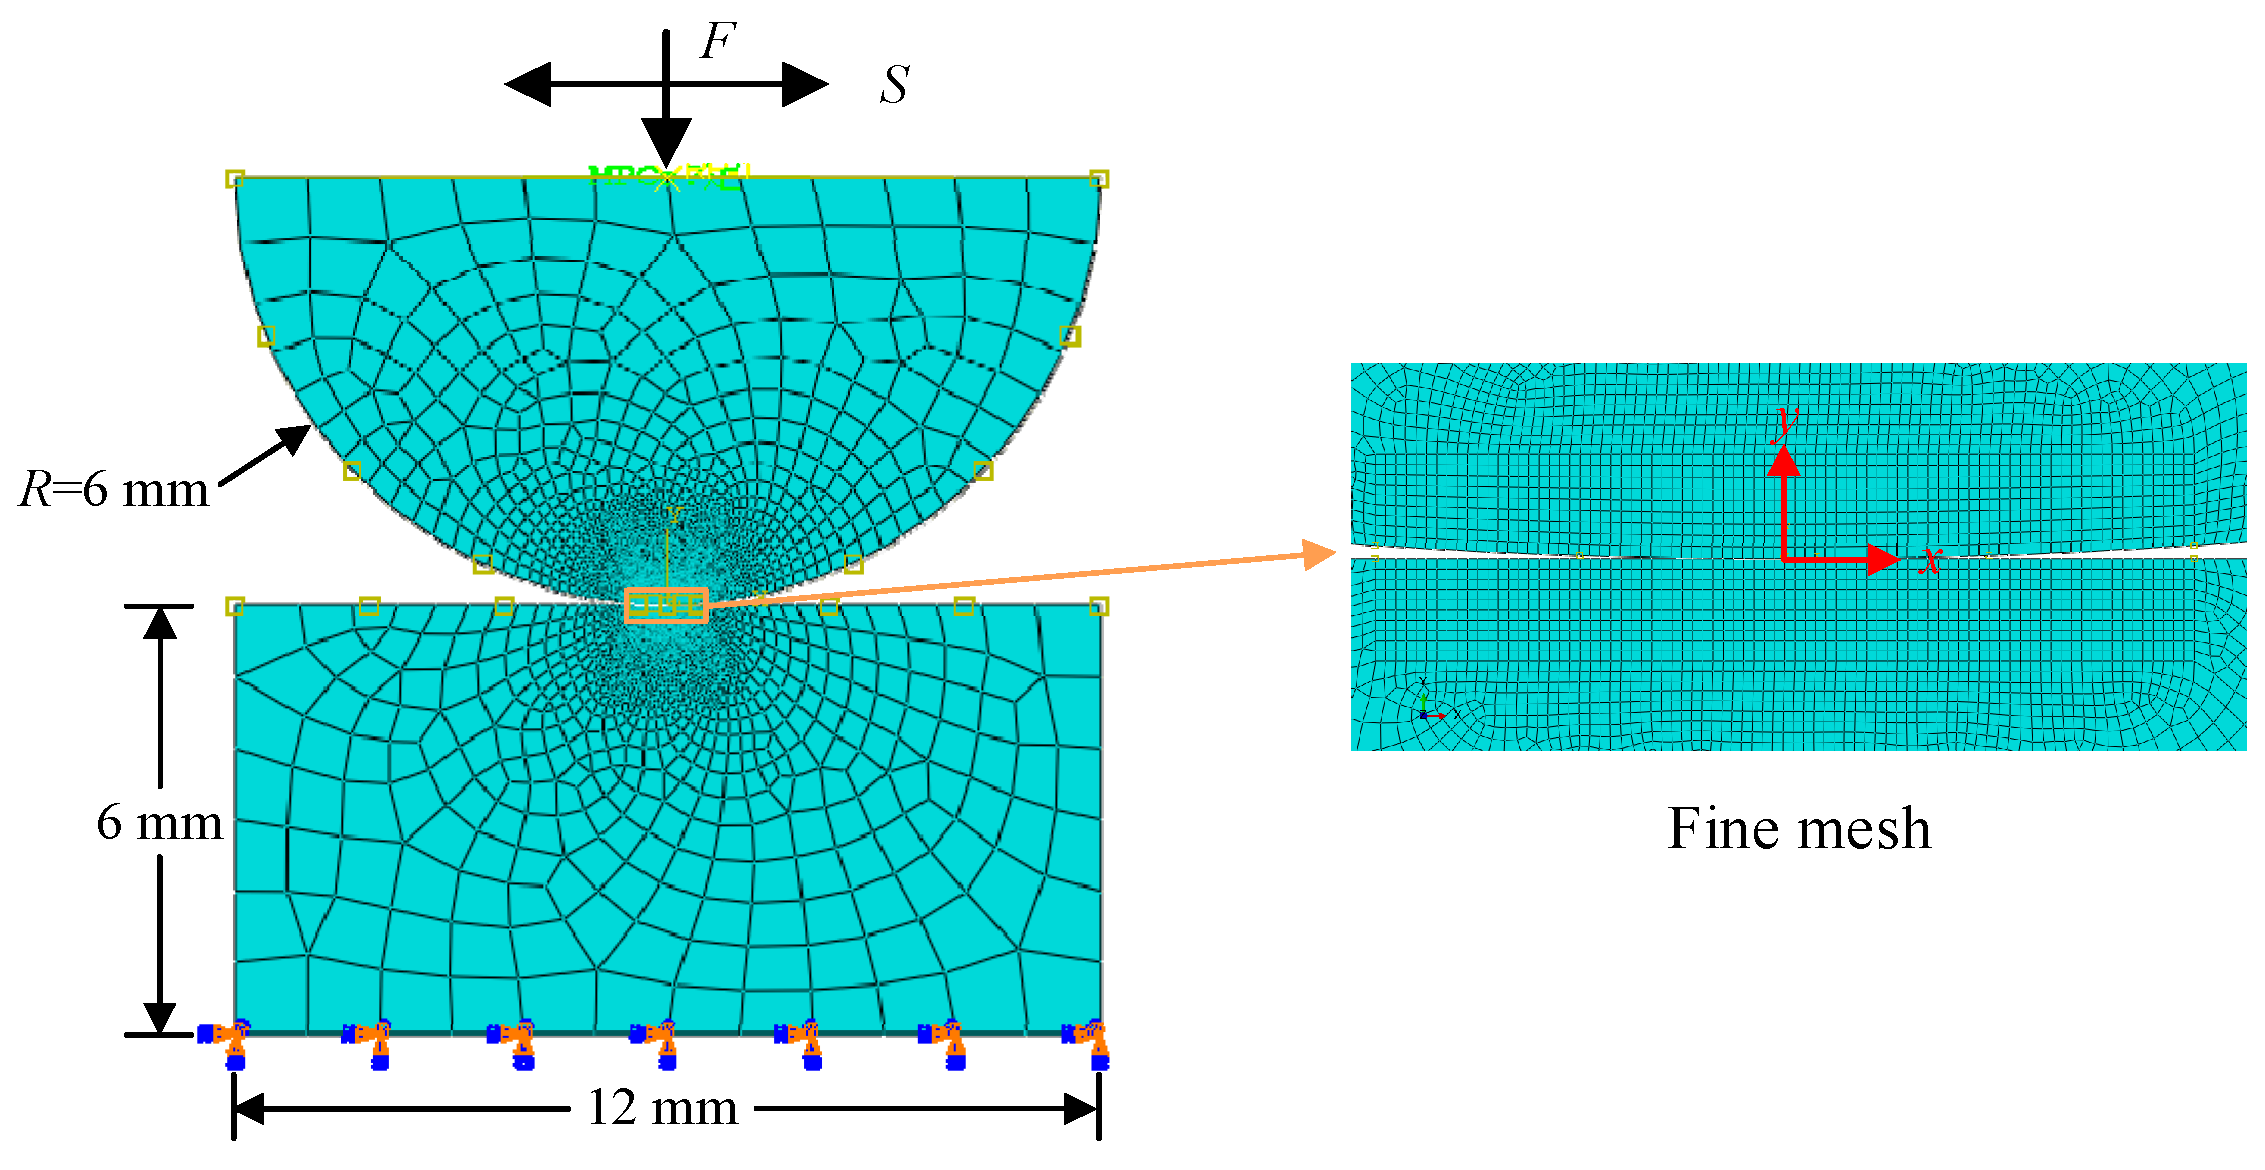
3. Finite Element Model

Based on the cylinder-on-flat contact structure for the fretting test [9,31], a finite element model [32,33] was developed as shown in Figure 3. The upper specimen of the model is cylindrical, and the lower specimen is flat. The radius of the cylindrical upper specimen is R = 6 mm, and the length and width of the flat lower specimen are 12 mm and 6 mm, respectively. In terms of mesh details, the 4-node temperature–displacement coupled plane strain cell (CPE4T) is used. To capture severe stress concentrations, a fine mesh of size 10 µm was generated in the contact region. The mesh away from the contact region is gradually increased with distance to reduce computational time.
The origin of the coordinate system was set at the center of the top surface of the flat specimen. The bottom surface of the flat specimen was completely fixed (with restricted movement in the x and y directions and had restricted rotation, that is, Ux = Uy = 0 and Rxy = 0). The contact between the cylinder and the flat is defined using a master–slave algorithm. The top surface of the flat is defined as the slave surface, and the surface of the circular part of the cylinder is defined as the master surface. Coulomb friction was used to calculate the frictional stress. The friction coefficient in Equation (6) is used to simulate the frictional behavior of the fretting slip. The initial ambient temperature was set to 25 °C. A heat convection boundary condition with a coefficient of 5 W/(m2 °C) was applied to the two contact surfaces [34].

3.1. Material Properties

Temperature changes also influence the properties of metallic materials—the phenomenon of thermal-induced softening. Therefore, the elastic–plastic behavior of the material and the thermal-induced softening must be considered. In the elastic deformation phase, the thermal-induced softening properties are considered to be related to Young’s modulus and Poisson’s ratio. For metallic materials, without considering the effect of temperature on Poisson’s ratio, Young’s modulus E(T) versus temperature T can be expressed as [19]
E ( T ) = E s ( T T 0 ) + E 0
where E0 is the Young’s modulus at the moment of temperature T0 and Es is the rate of change of Young’s modulus with temperature change.
Similarly, in the plastic deformation phase, the thermal-induced softening properties are related to the yield limit of the material. The yield limit σy(T) of a metallic material at temperature T is [19]
σ y ( T ) = σ y s ( T T 0 ) + σ y 0
where σy0 is the yield limit at the temperature T0 and σys is the rate of change of the yield limit with temperature change.
The material parameters for the Ti-6Al-4V alloy used for the cylindrical and flat specimens are listed in Table 1. The physical quantities of Ti-6Al-4V, such as thermal conductivity, specific heat capacity, and density with temperature, are shown in Table 2.

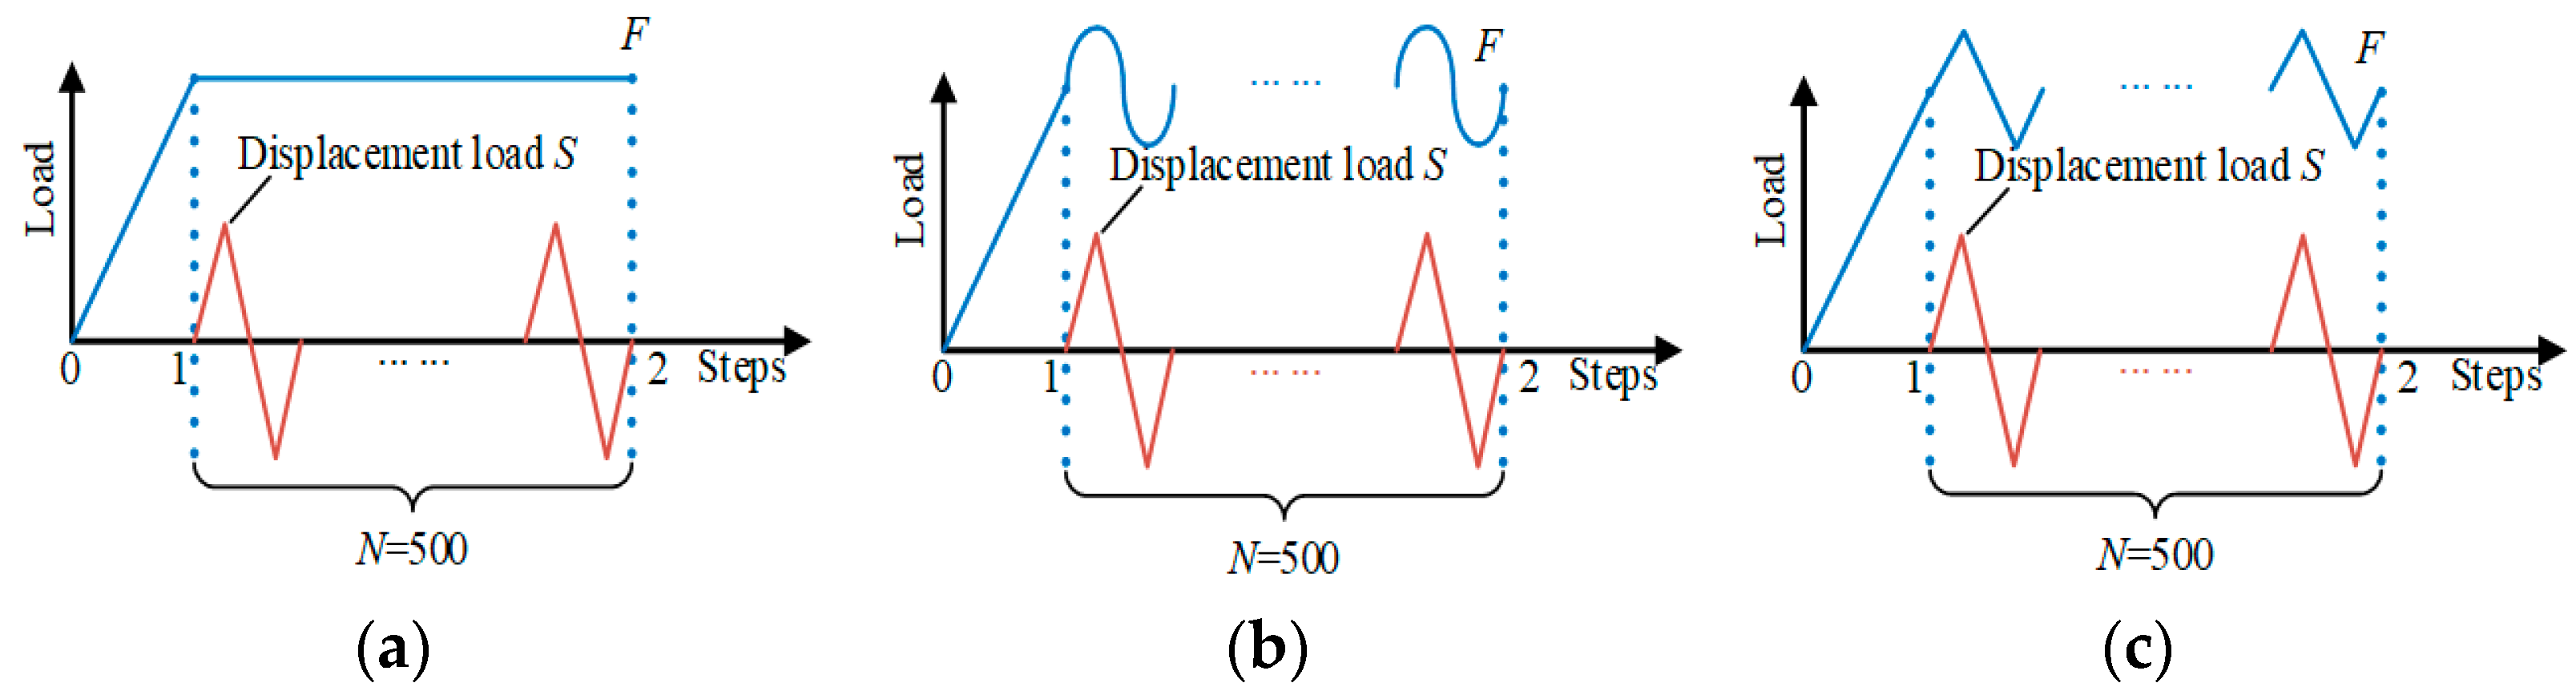
3.2. Loading History

The loading procedure for the simulation test is broken down into two phases. The first analysis step type is a static analysis step, and the second analysis step type is a coupled temperature–displacement analysis step. The load is applied to the top surface of the cylinder specimen, so the multipoint constraint (MPC) is used to apply the load. The MPC constrains the degrees of freedom of the slave surface (upper surface) to the degrees of freedom of the master point (the reference point set in the middle of the upper surface). The loading process of the finite element model is shown in Figure 4.
In Figure 4, the horizontal coordinates are the steps, and the vertical coordinates are the loads. Step 1 is the static analysis step, and Step 2 is the transient temperature–displacement coupling analysis step; the time step length of both steps is 1. Figure 4a shows the loading process with the constant normal load. In Step 1, the normal concentrated load F is applied to the top central reference point of the cylinder specimen to establish contact. The load F reached a maximum value of 185 N at the end of Step 1 and was kept constant in Step 2. In Step 2, the cyclic tangential displacement load S in the form of a triangle was also applied to the reference point to create slip. The magnitude of S was 25 μm and was cycled 500 times in Step 2.
Figure 4b,c shows the loading process of the normal load acting in sine and triangle forms, respectively. The initial value is the value of load F at the end of analysis Step 1, and the sine and triangle amplitudes are applied in analysis during Step 2. When the normal load is in a triangle or sine form, there is no phase difference between the normal load F and the tangential displacement load S.

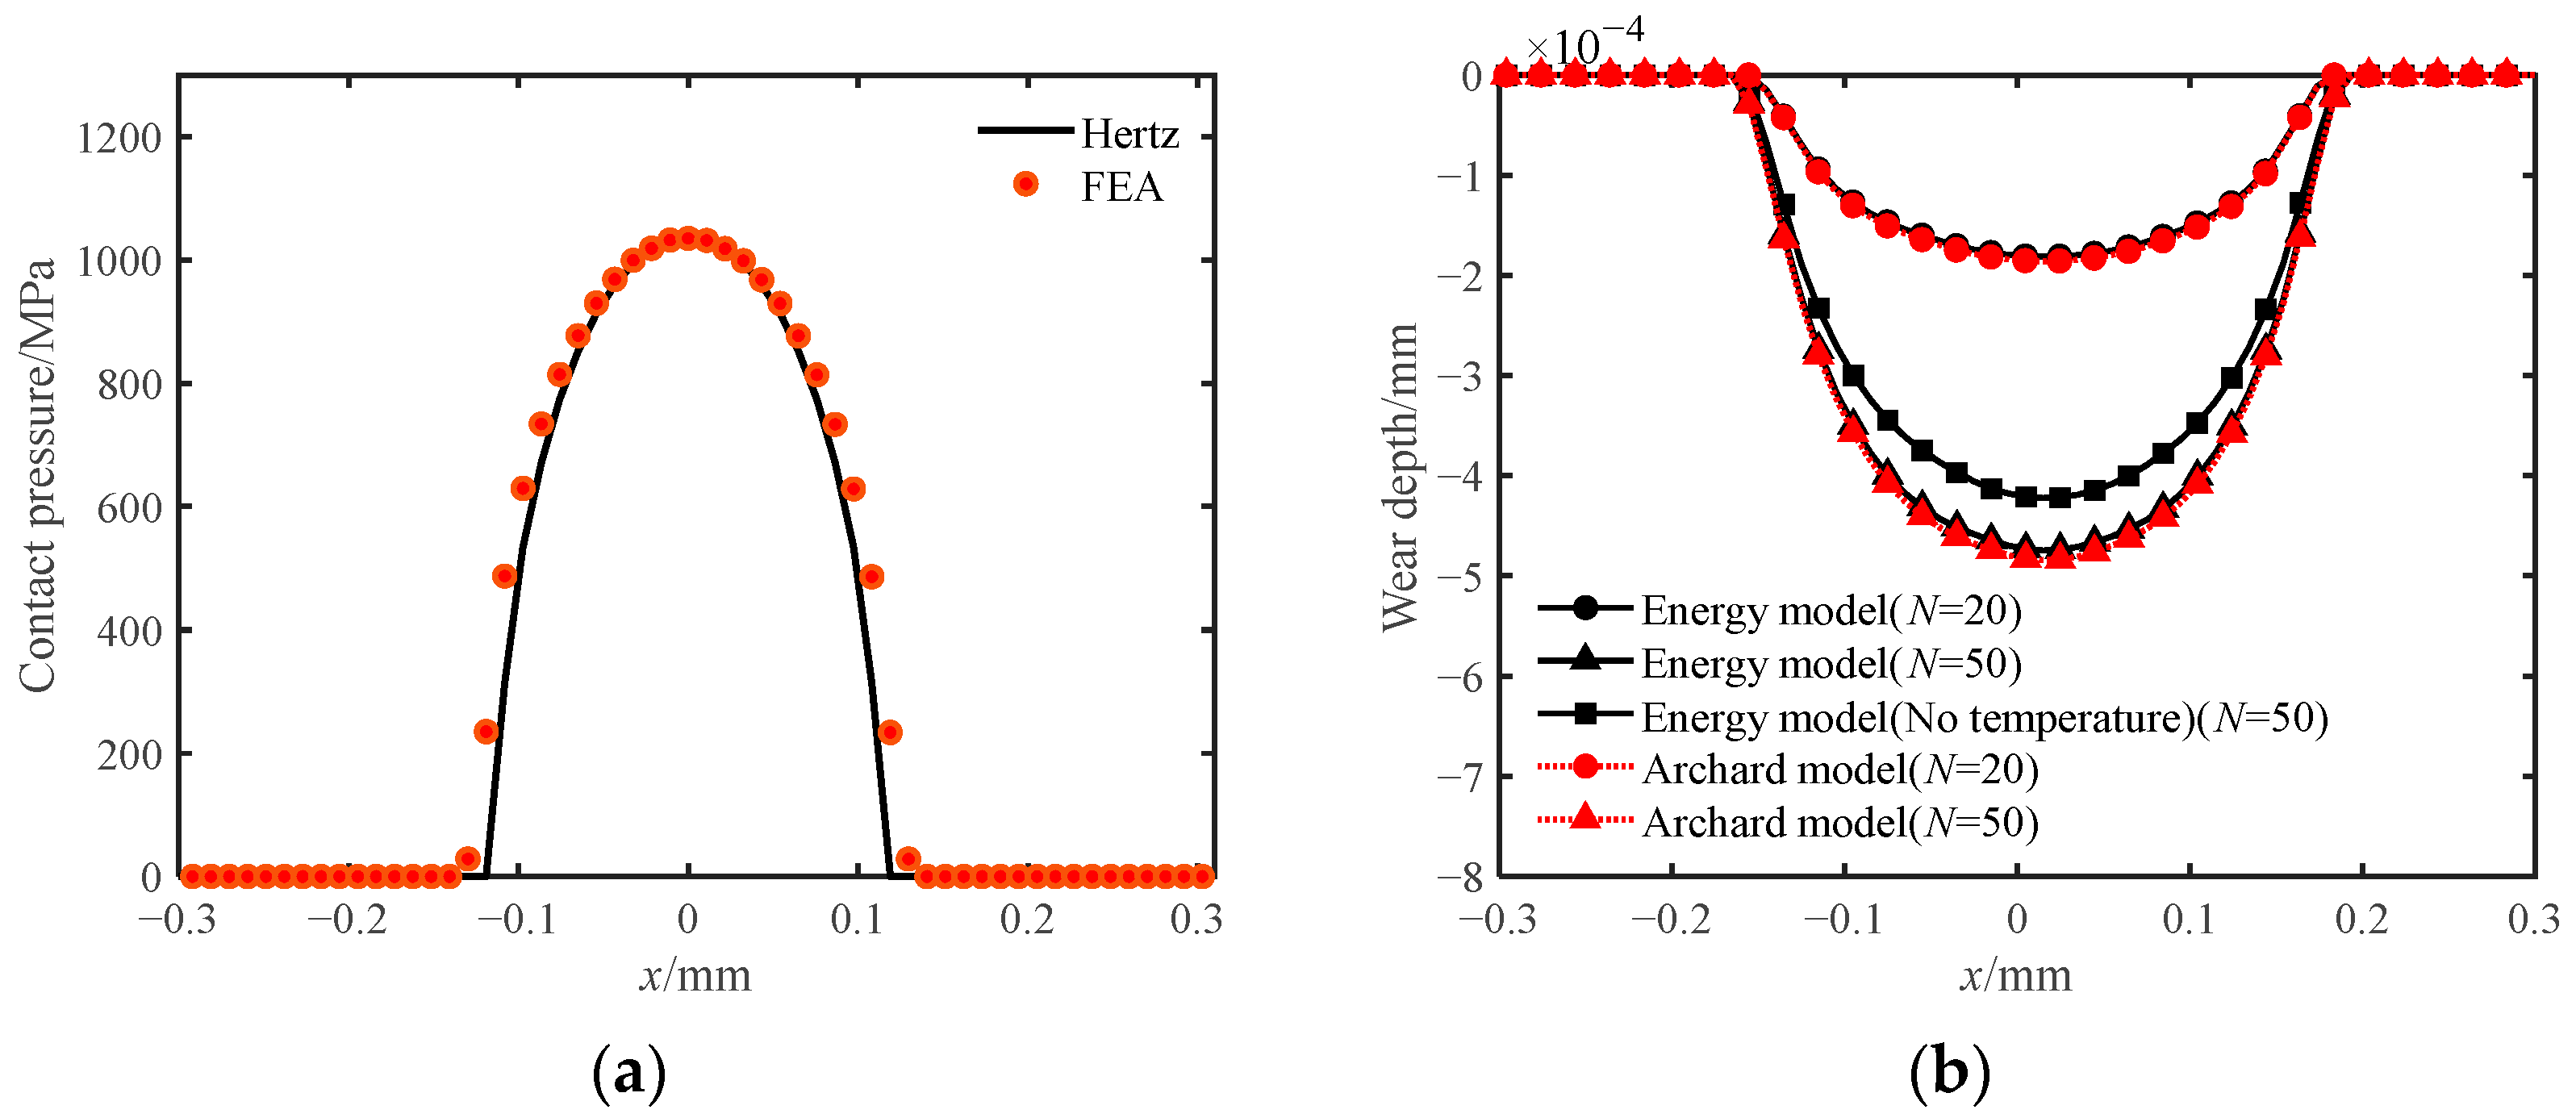
3.3. Validation of the Model

In order to validate the finite element model, the finite element model is compared to the contact pressure of the analytical solution of Hertzian theory [15], as depicted in Figure 5a. It can be found that the finite element results and the theoretical calculations basically agree when the normal load F is 185N. There is a small deviation between the finite element results and Hertzian theory at the edge of the contact region, which is caused by the mesh size. Then, the energy model and Archard model [19] were applied to the established finite element model to illustrate the correctness of the wear model by comparing the results of the two models, as shown in Figure 5b. As can be seen in Figure 5b, the wear depth of the energy model is almost the same as that of the Archard model when temperature is considered. However, the wear depth of the energy model is somewhat smaller because the friction coefficient decreases when the temperature increases. The Archard model cannot take into account the change in the coefficient of friction, so the energy model has a smaller depth of wear. Temperature increases as the wear progresses, causing the difference between the two models to increase with the amount of fretting. For the energy model, the depth of wear is greater when temperature is considered. This is because the wear rate rises as temperature rises.

4. Results and Discussion

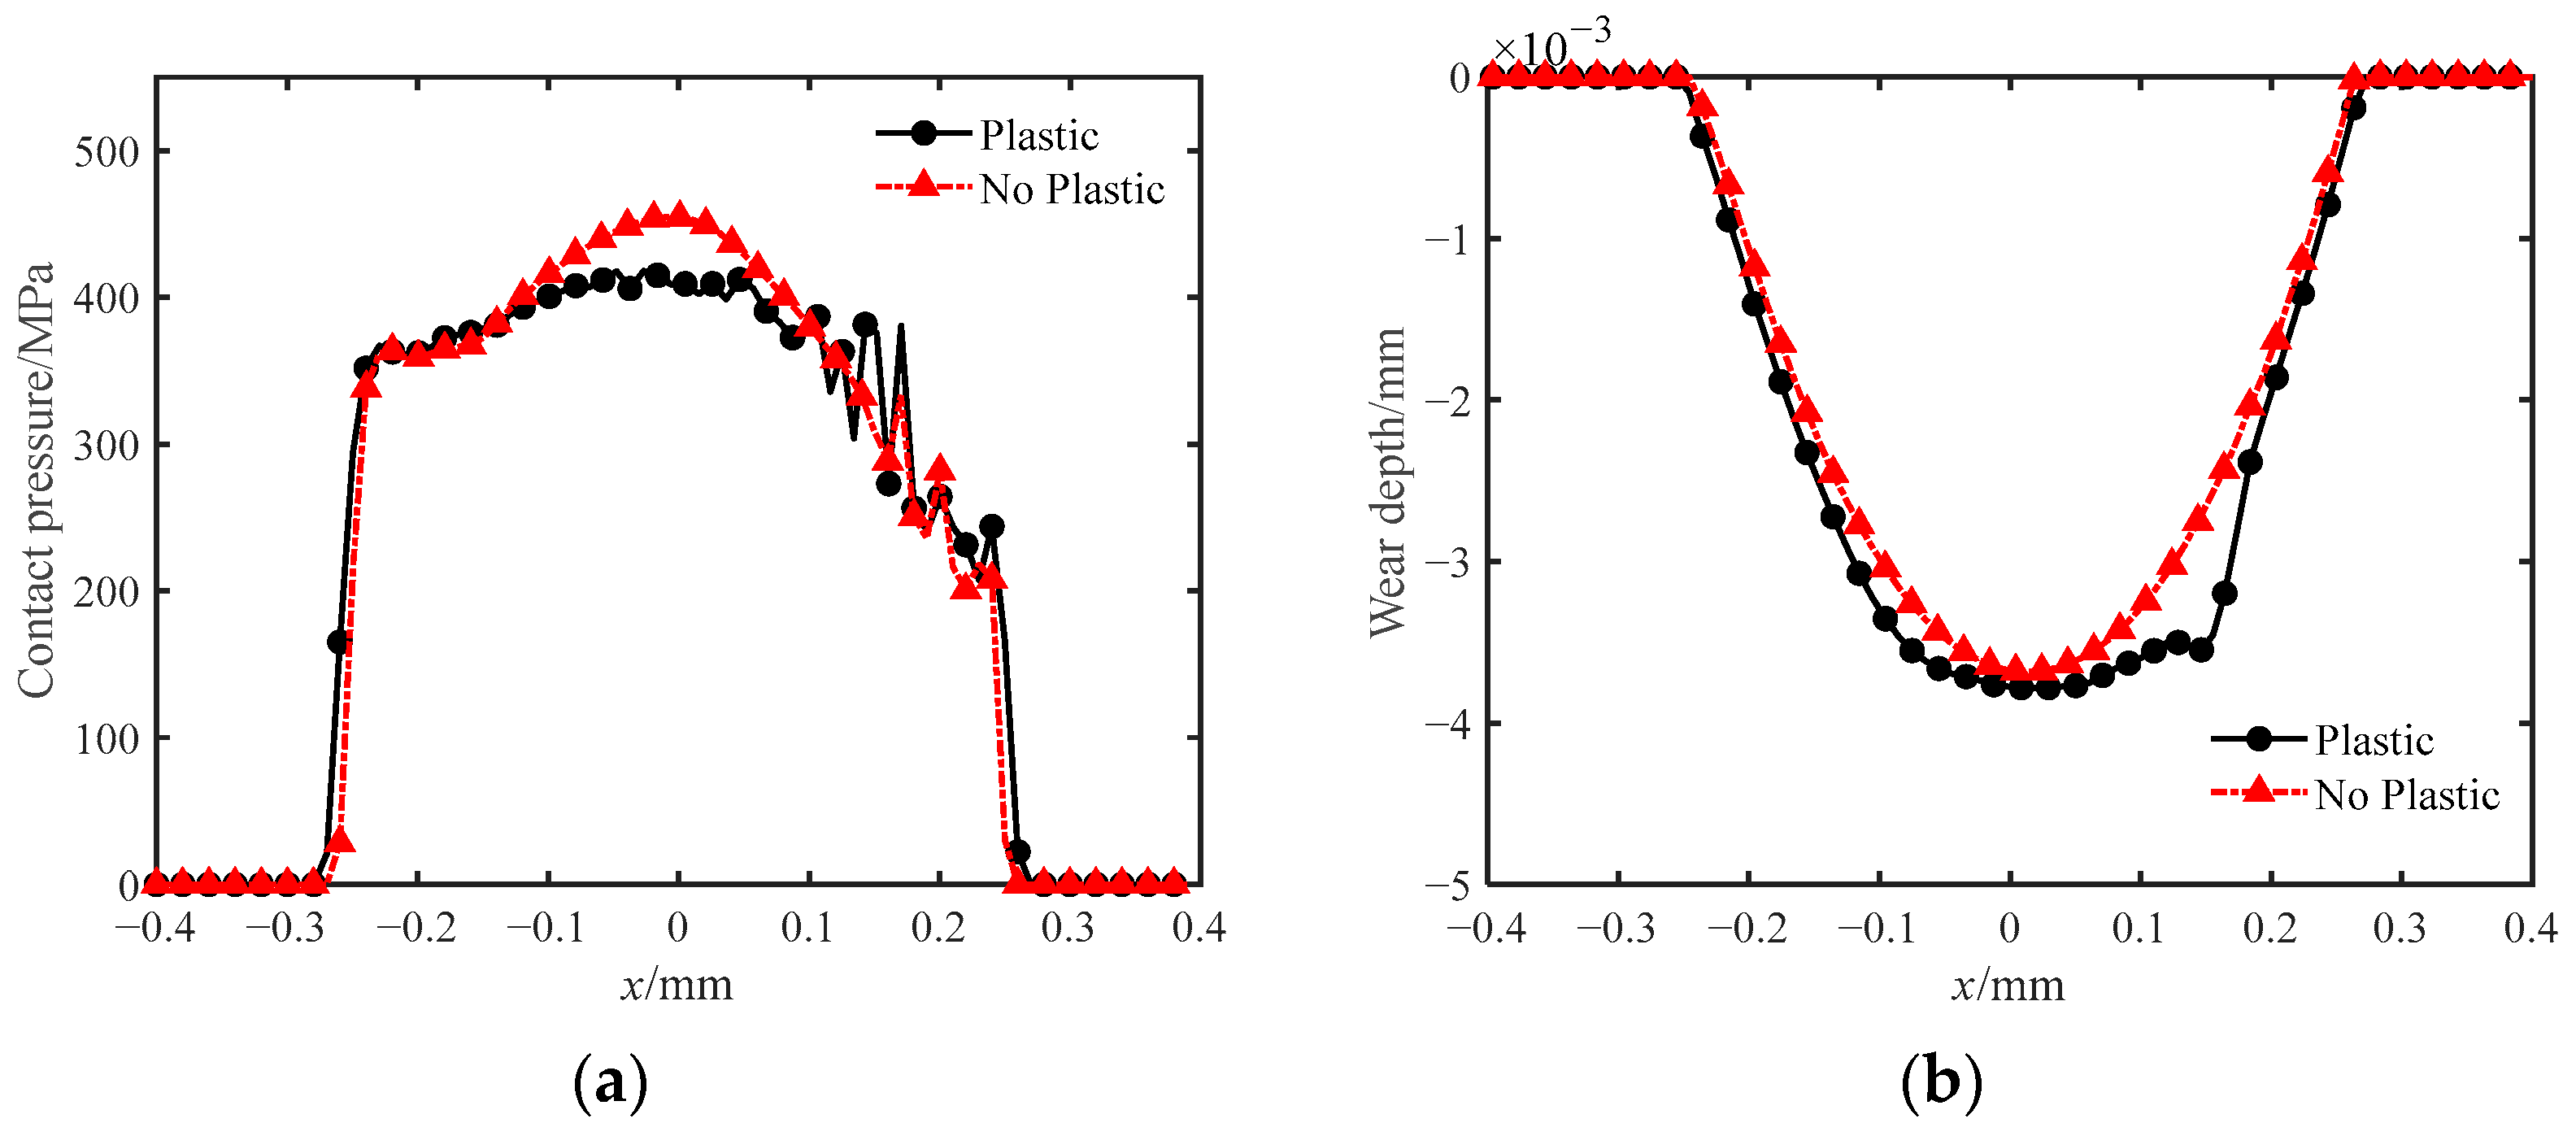
4.1. Effect of Plastic Deformation of Materials on Wear and Temperature Rise

The contact pressure, wear profile, temperature distribution, and temperature variation at the contact center were obtained using the established finite element model and numerical methods. The finite element model takes into account both plastic deformation of the Ti-6Al-4V alloy materials and temperature. The effect of the plastic deformation of materials on wear and temperature rise was investigated under constant normal load. Figure 6a illustrates the contact pressure distribution with and without plastic after 500 cycles at an ambient temperature of 25 °C. It can be seen that the contact pressure distribution after fretting wear no longer shows a Hertzian shape [37]. The values of the contact pressure are larger near the center of the contact, and there is a large fluctuation in the contact pressure around x = 0.15, especially considering the plastic results. On one hand, the plastic deformation of the material leads to more severe stress concentrations. On the other hand, the wear of the material causes a change in the contact surface profile. In addition, the contact pressure considering plasticity has a small value in the contact center region but has a wider distribution. The yielding of the material when plasticity is considered leads to a larger contact area, so the contact pressure decreases for the same normal load.
The geometry of the contact surface is changed due to the material wear on the contact surface. Figure 6b shows the wear depth distribution of the contact surface considering and not considering plasticity. It can be seen from the figure that the wear profile without considering plastic deformation of materials is smooth Hertzian shape. The wear profile with plasticity considered has a large depression near x = 0.15. This is due to the plastic deformation around x = 0.15 in the cylinder specimen that slides first along the positive direction of x. The sudden change in stress caused by plastic deformation makes the wear profile unsmooth. When plasticity is taken into account, the wear is deeper and wider. This is due to the plastic deformation making the contact area larger. The reduction in contact pressure promotes fretting wear. More intense wear increases the amount of wear.
Figure 7a shows the temperature distribution of the contact surface at the end of Step 2. It can be found that the temperature without considering plasticity is higher near the center of the contact due to the plastic deformation consuming a certain amount of heat. From the figure, it can also be found that the higher temperatures are to the left of the contact center. The reason is that the displacement load in the initial direction to the right is applied to the cylinder specimen. The cylinder specimen moves from the leftmost side to the right and back to the contact center before the end of the last cycle. That is, the heat generated by the friction in the left side region before the end of the fretting leads to a higher temperature due to the short heat transfer time.
Figure 7b shows the temperature rise history at the central node of the contact. The temperature of the central node gradually increases with the increase in the amount of fretting. The temperature rise variation is similar for both cases. Continuous frictional heat generation occurs during the fretting wear process, causing the temperature to rise. There are also significant fluctuations in the temperature change at the central node of the contact. This phenomenon is similar to the results in References [5,8,26]. The reason for this is that the temperature of the central node increases with the contact friction of the cylinder specimen during the fretting. Afterwards, it decreases with heat transfer or heat exchange after the passage of the cylinder specimen.

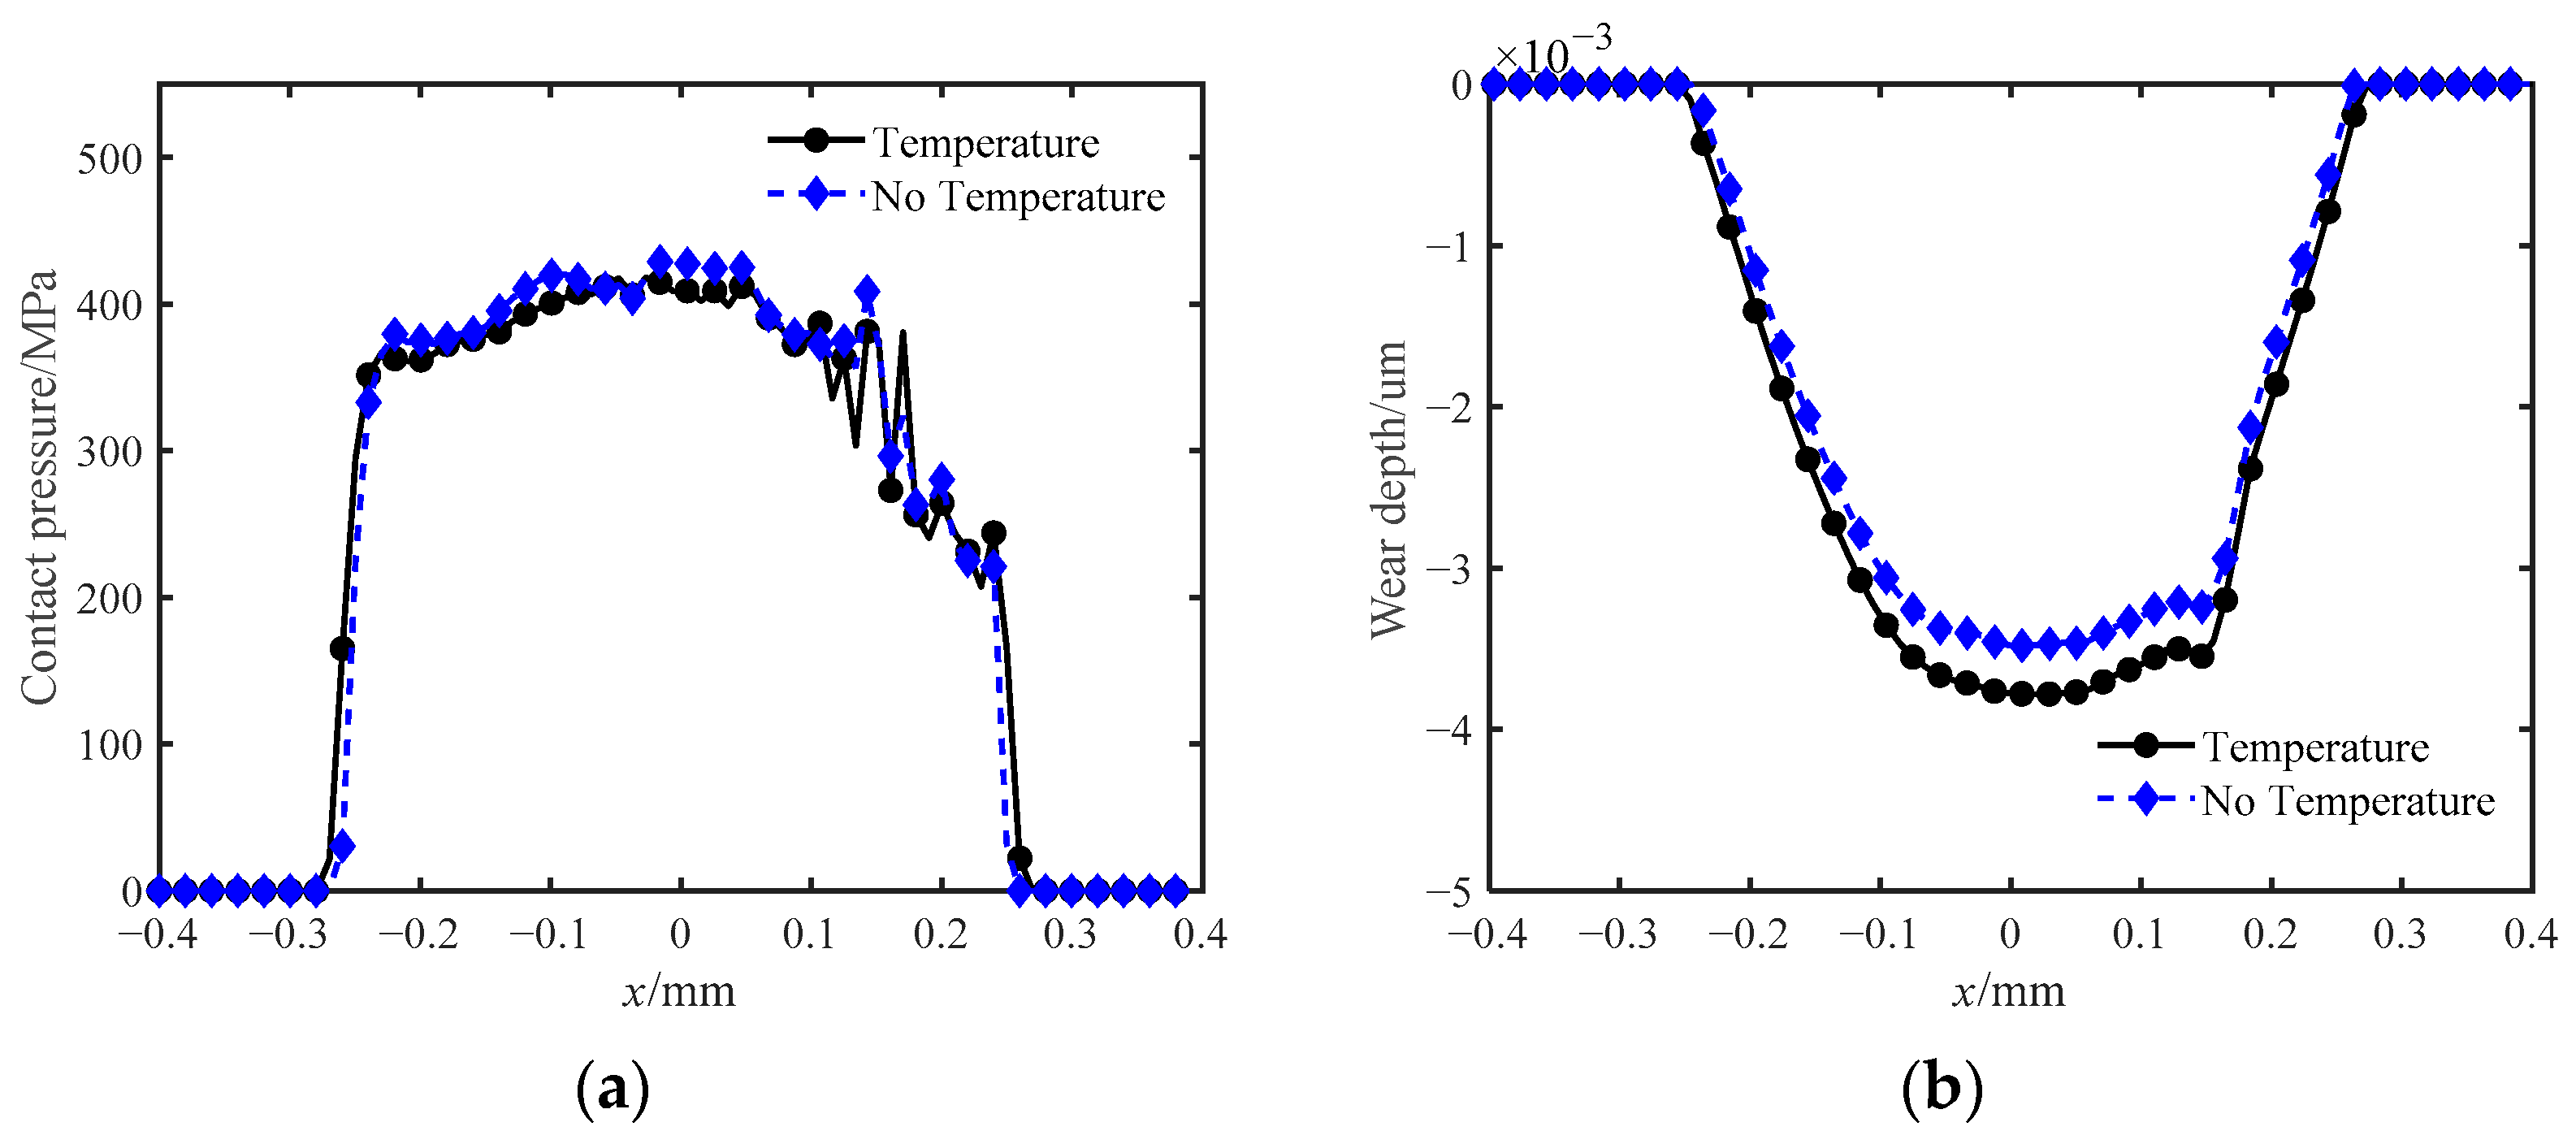
4.2. Effect of Temperature on Wear

The results with and without temperature are compared to analyze the effect of temperature on wear. Figure 8a shows the contact pressure distribution for the two cases with plasticity considered. The position of the contact pressure change is the same for both cases. The distribution of the contact pressure is similar, which means that their wear profiles are similar. A closer look reveals that the contact pressure value without considering the temperature is slightly larger and its distribution range is slightly smaller. The reason for this phenomenon lies in the fact that temperature affects frictional and wear characteristics. Due to the difference in the degree of wear, temperature is more affected by wear.
Figure 8b shows the wear depth distribution of the contact surface in both cases. The two wear profiles are similar, which is consistent with the analysis of the contact pressure. Wear depth and wear width are greater when temperature is considered. The friction caused by the wear process increases the temperature of the contact surfaces. The coefficient of friction decreases with increasing temperature, but the coefficient of wear increases with increasing temperature, which leads to more intense wear. It can be concluded that an increase in temperature has a catalytic effect on wear for such thermal-induced softening materials. Therefore, the wear resistance of such materials in practical engineering can be improved by reducing the working or ambient temperature.

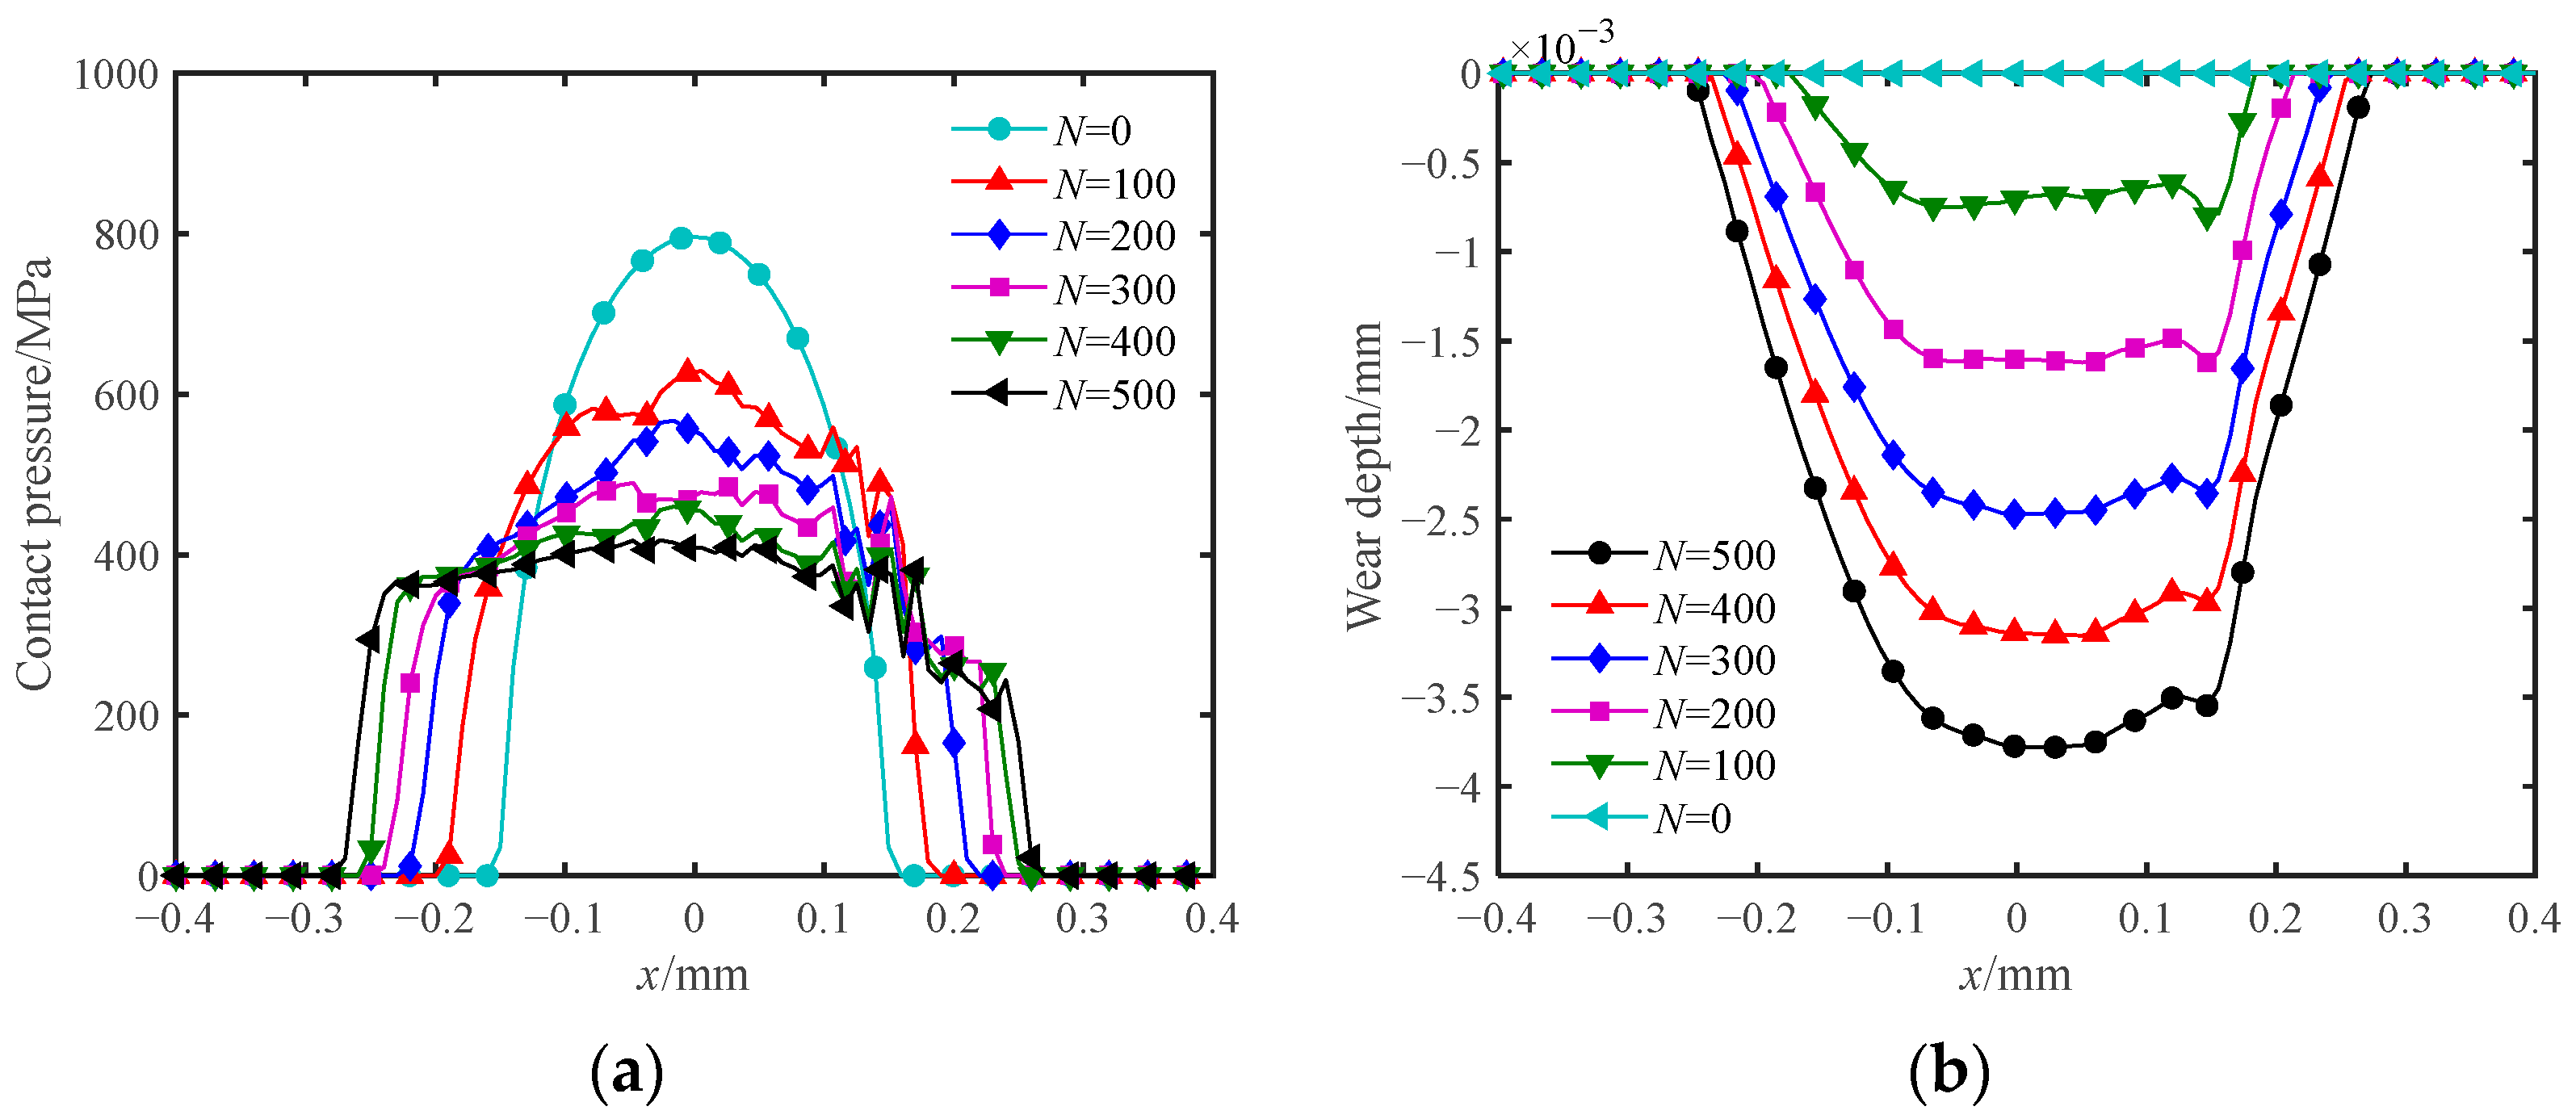
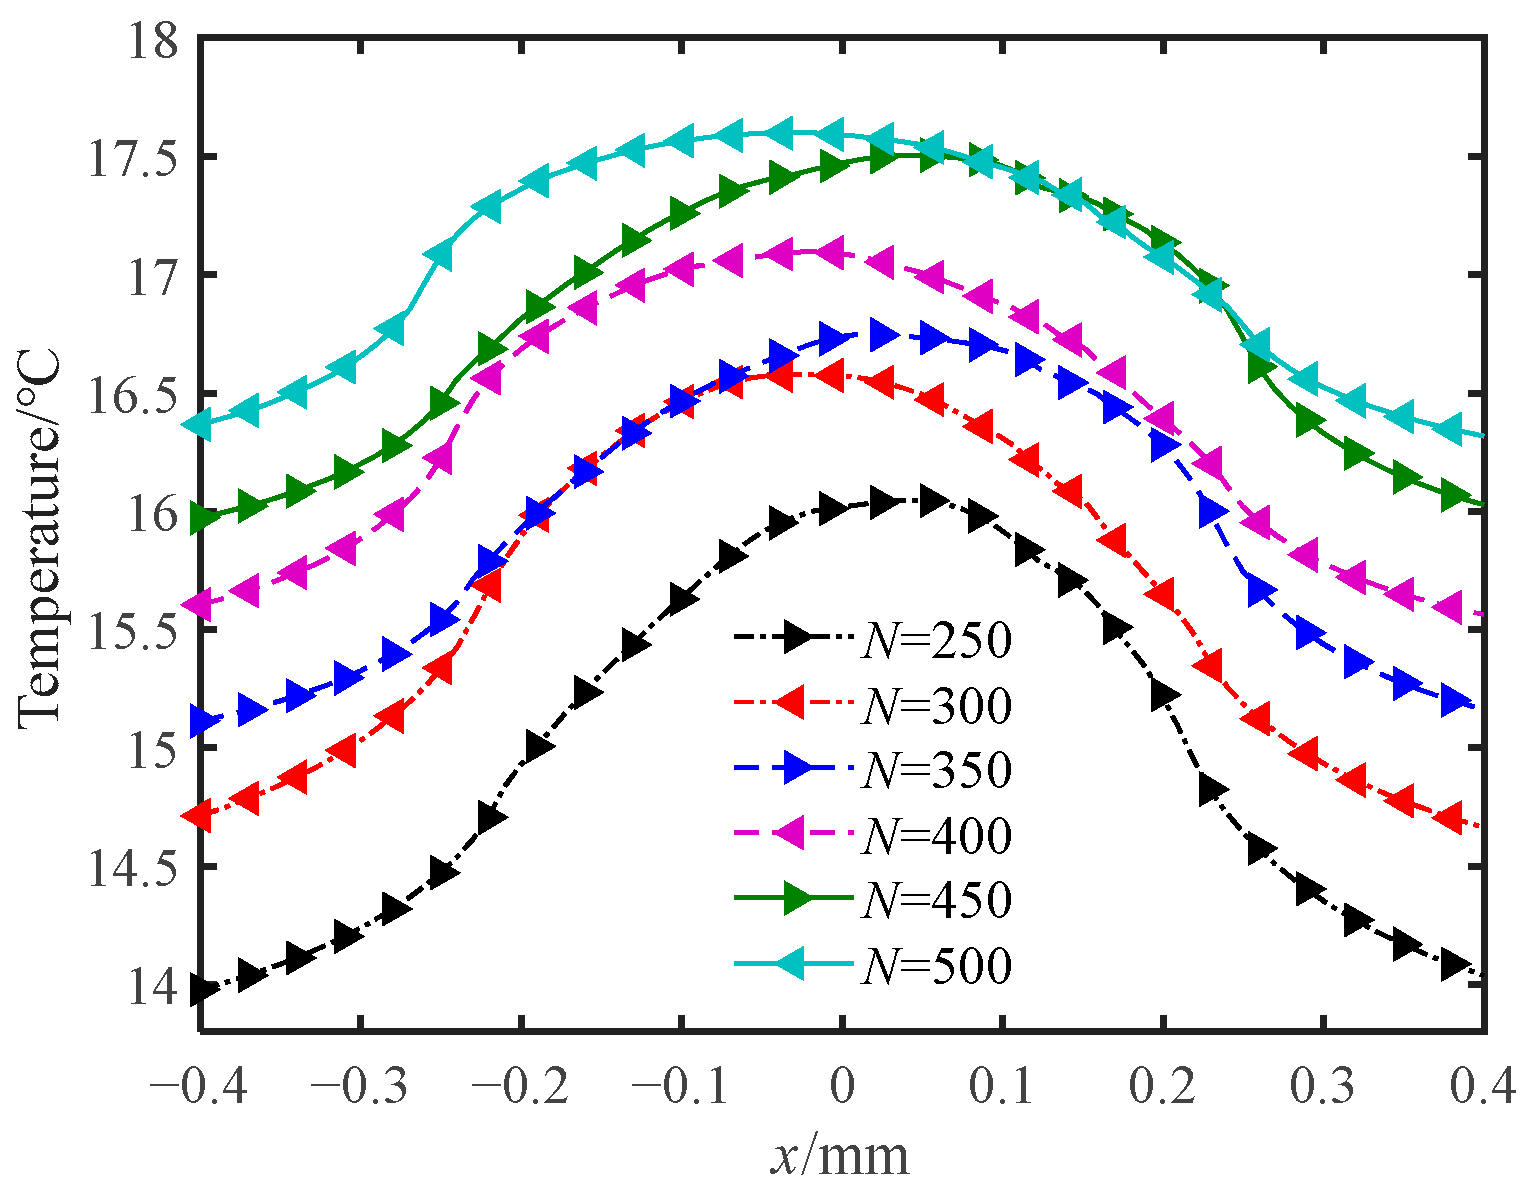
4.3. Effect of Number of Cycles on Wear and Temperature Rise

Simulation results at different cycle counts were extracted to further investigate the wear problem under thermal–mechanical coupling. Figure 9 depicts the contact pressure and wear distribution for different numbers of cycles. As can be seen in Figure 9a, the contact pressure distribution without fretting slip (N = 0) is Hertzian in shape. The distribution of contact pressure becomes wider with the increase in the number of cycles. The difference between the contact pressure at the contact center and contact edge decreases. As the contact before the fretting is cylinder–flat contact, the contact after the wear becomes flat–flat contact. The contact pressure decreases due to the increased contact area as the amount of wear increases. The evolution of wear depth with the number of cycles is depicted in Figure 9b. Wear depth and width increase with the number of cycles. There is a large depression in the wear profile near x = 0.15 (mutation point). It is observed that the difference of the mutation point is weakened with an increase in the number of cycles. That is, the difference in depth between the mutation point and the wear center becomes smaller. This is the result of the stress concentration at the mutation point being reduced and the normal pressure being shared due to the increase in wear area. Additionally, the gap between adjacent wear curves decreases with the number of cycles, which means that the growth rate of the wear depth decreases. The reason for this is that the coefficient of friction between the surfaces continues to decrease due to the increase in temperature. The decrease in the friction coefficient leads to a reduction in the shear stress, which results in a reduction in the growth rate of the wear depth.
Figure 10 shows the pattern of temperature distribution of the contact surface with the number of cycles. From the figure, it can be found that the larger temperature values are distributed to the left or right of the contact center. It is because the applied tangential load is a cyclic displacement. In one complete cycle, the cylinder specimen moves from the contact center to the right and then returns to the center position. After that, it returns to the center position again after moving from the contact center to the left. Furthermore, due to the ongoing buildup of heat caused by frictional wear, the surface temperature rises with the number of cycles. The temperature difference between the contact area and the non-contact area decreases. As the heat generated in the contact area is transferred to the non-contact area, the temperature of the non-contact area increases. Consequently, the temperature also spreads continuously to the non-contact area.

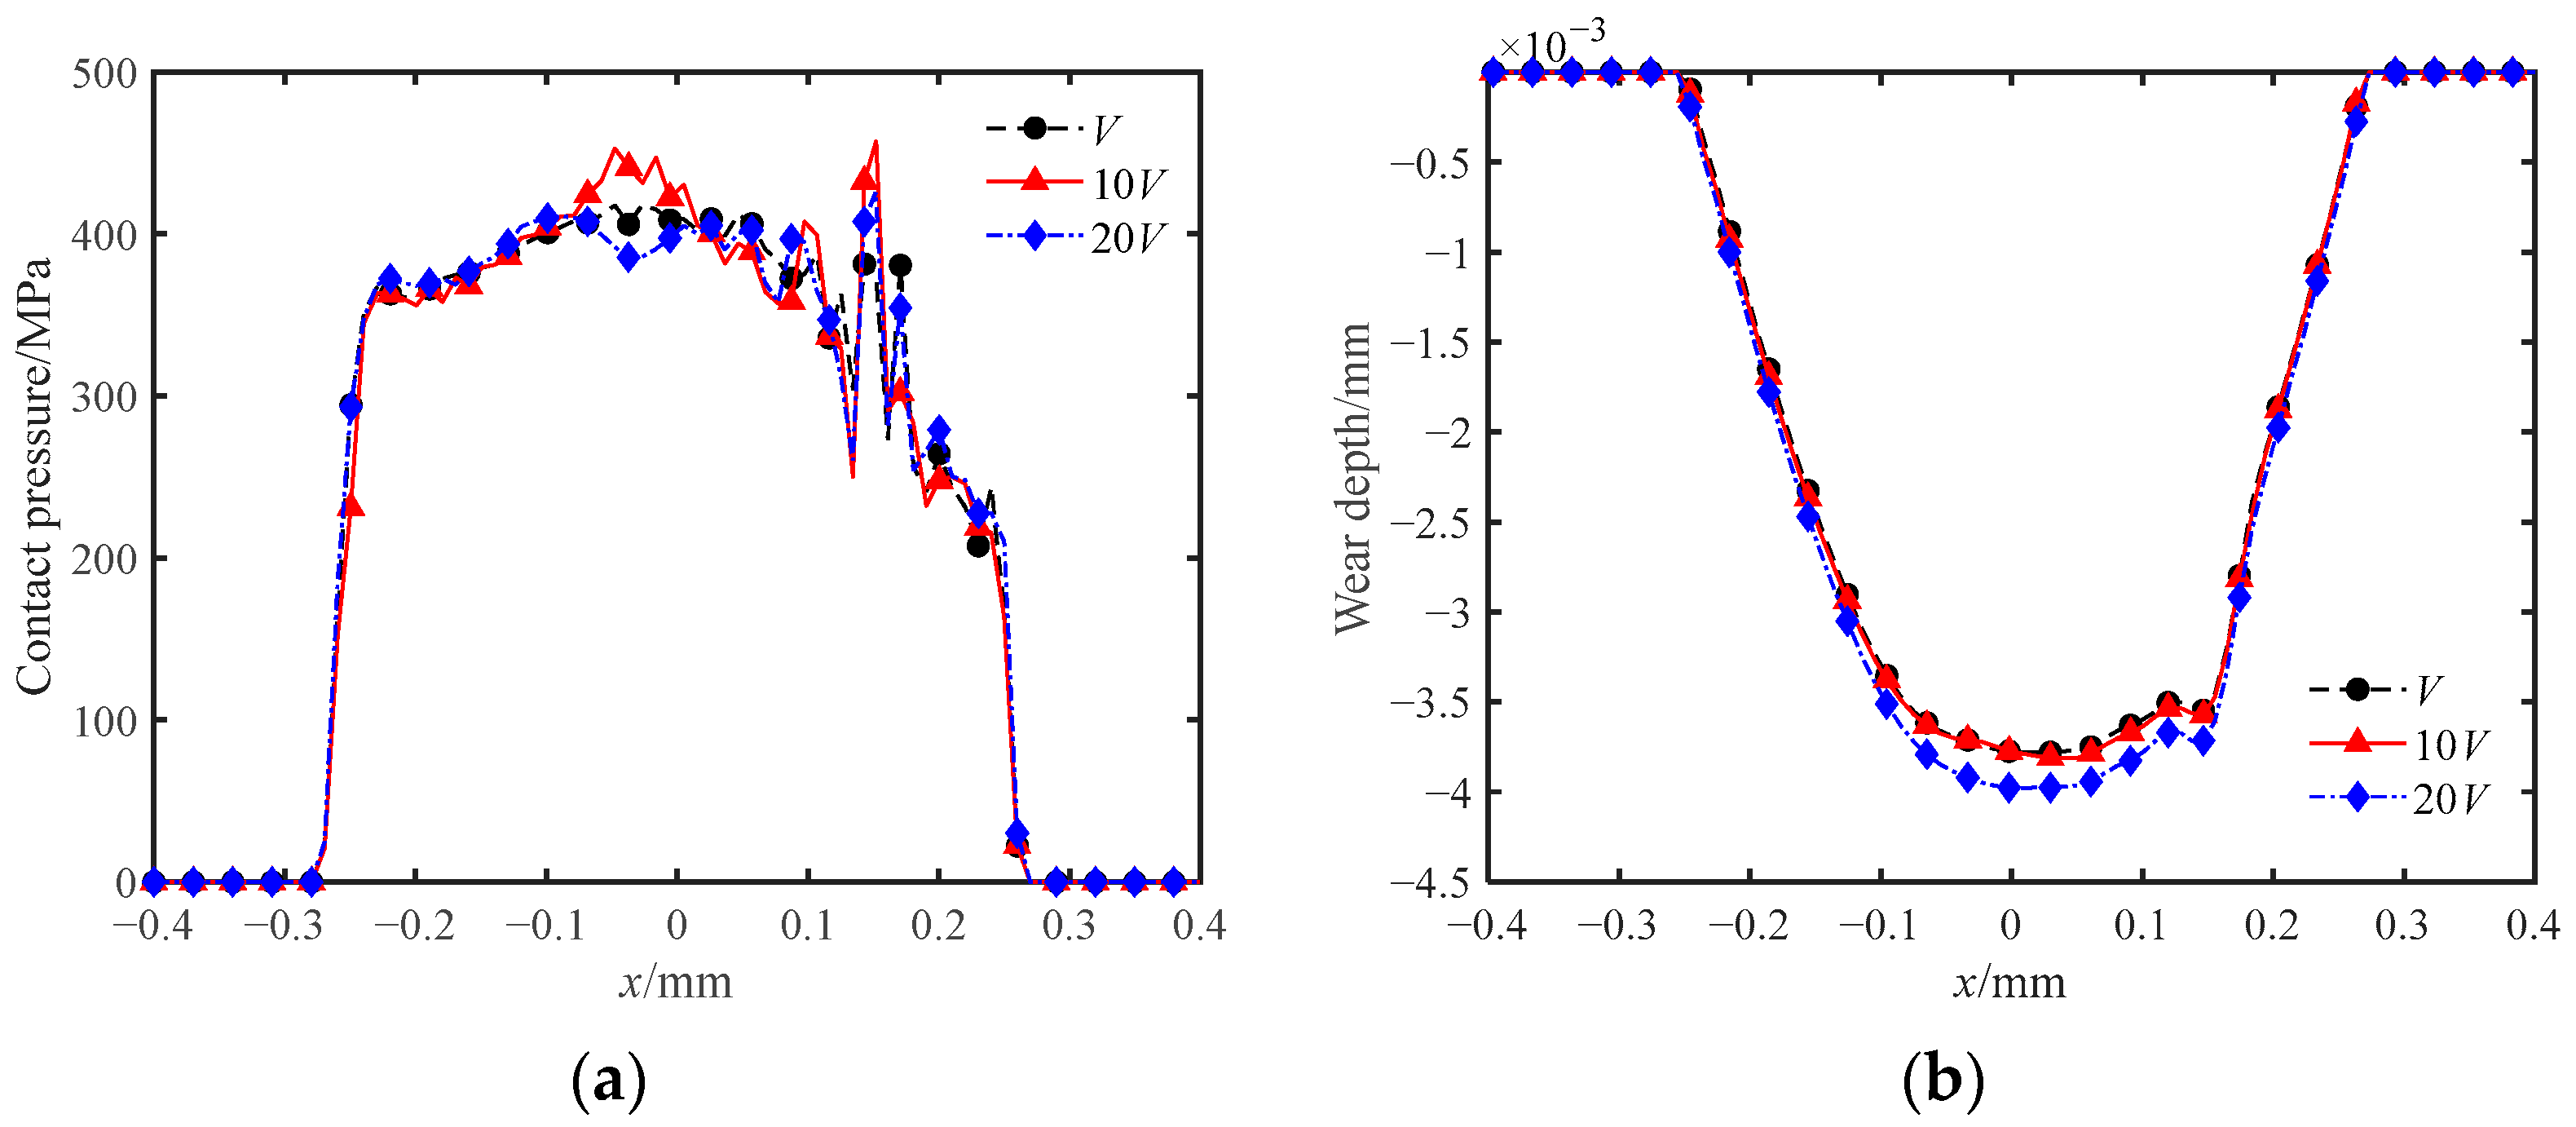
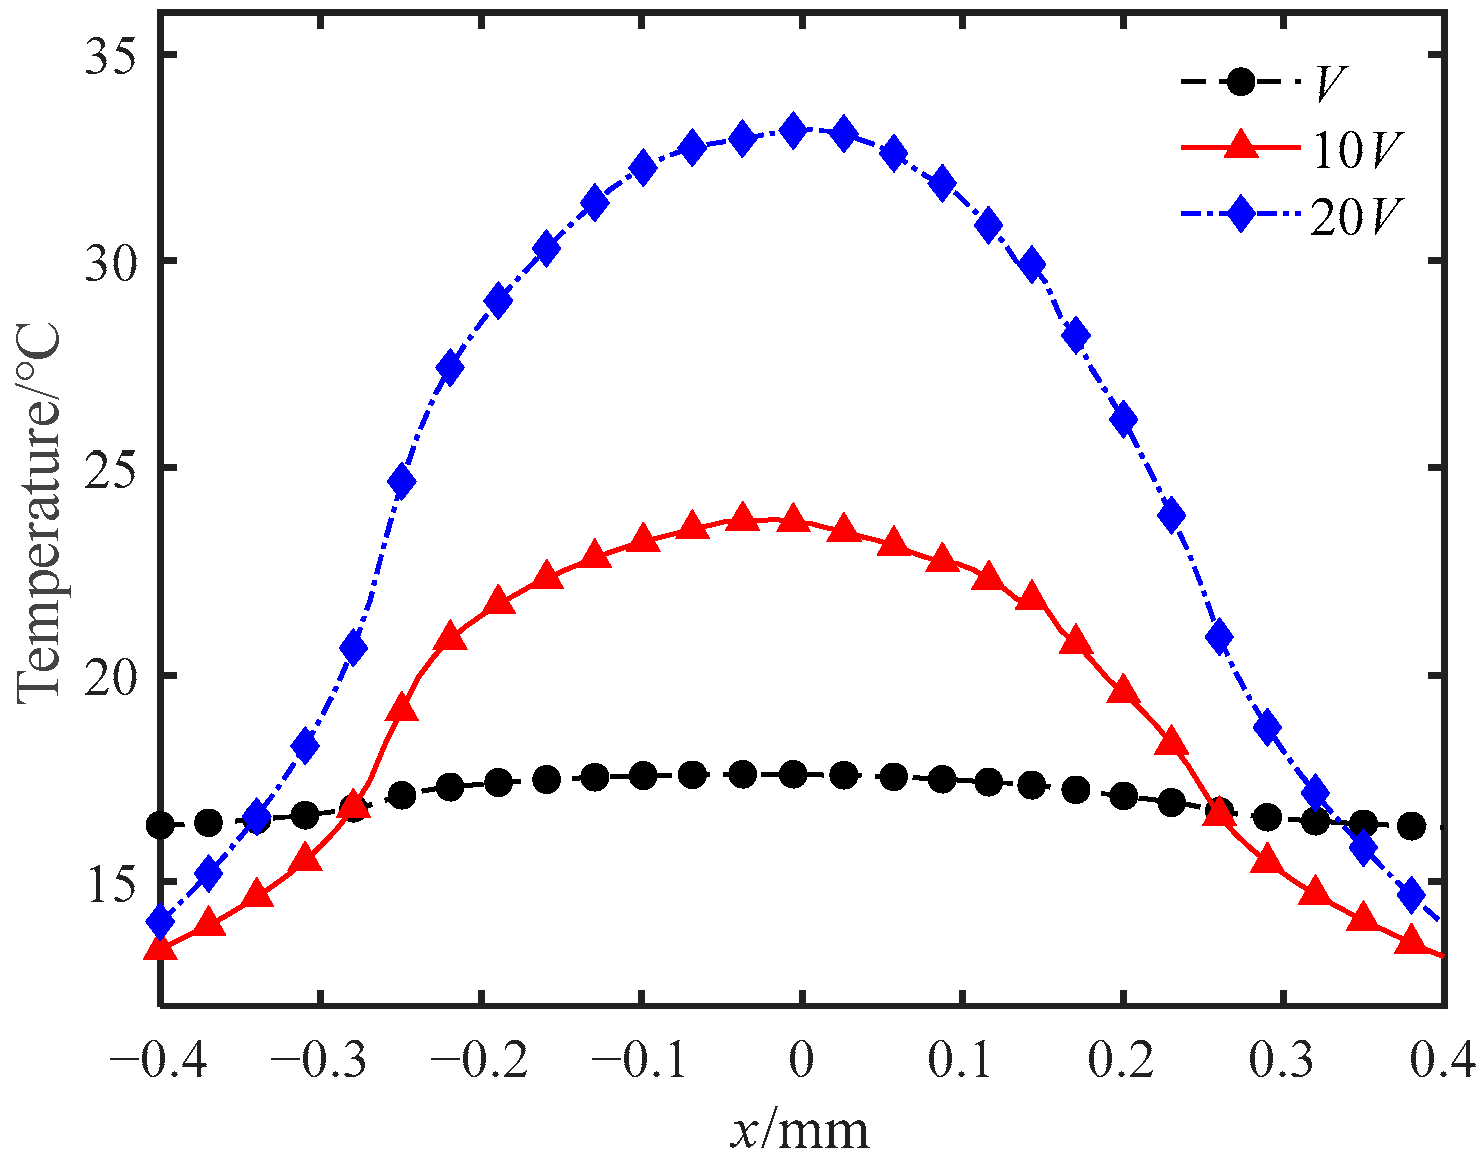
4.4. Effect of Fretting Speed on Wear and Temperature Rise

Fretting speed is also an important factor affecting wear characteristics, especially when there is a temperature effect. For that purpose, the effect of fretting speed on wear and temperature rise was explored. Three different fretting speeds of V, 10 V, and 20 V were applied in the model. Figure 11 shows the results of contact pressure and wear for different fretting speeds. The contact pressure is not identical for the three fretting speeds in Figure 11a, implying that fretting speed influences wear profile. However, it is difficult to obtain a clear relation between fretting speed and contact pressure because a small change in the wear profile results in a large change in contact pressure. Figure 11b describes the law between the wear depth and the fretting speed. The increase in the fretting speed increases the temperature of the contact surface, which results in an increase in wear depth with the increase in fretting speed. The increase in wear depth is less when the fretting speed changes from V to 10 V, but the increase in wear depth becomes greater when the fretting speed changes from 10 V to 20 V. The reason for this is that as velocity increases, so does the temperature. As shown in Figure 12, the surface temperature at a fretting speed of 20 V is considerably higher than the surface temperatures at the other two speeds.
Figure 12 shows the temperature distribution of the contact surface at different fretting speeds. It can be found that the temperature of the contact area increases with the increase in the fretting speed, but the temperature away from the contact area is higher at the fretting speed of V. The temperature of the contact surface comes from frictional heat generation and heat conduction. For the area far from the contact center, the temperature comes only from heat conduction. When the total number of cycles is the same, the fretting time is inversely proportional to the fretting speed. Correspondingly, the fretting speed V has the most time for heat conduction, resulting in a higher temperature in that region.

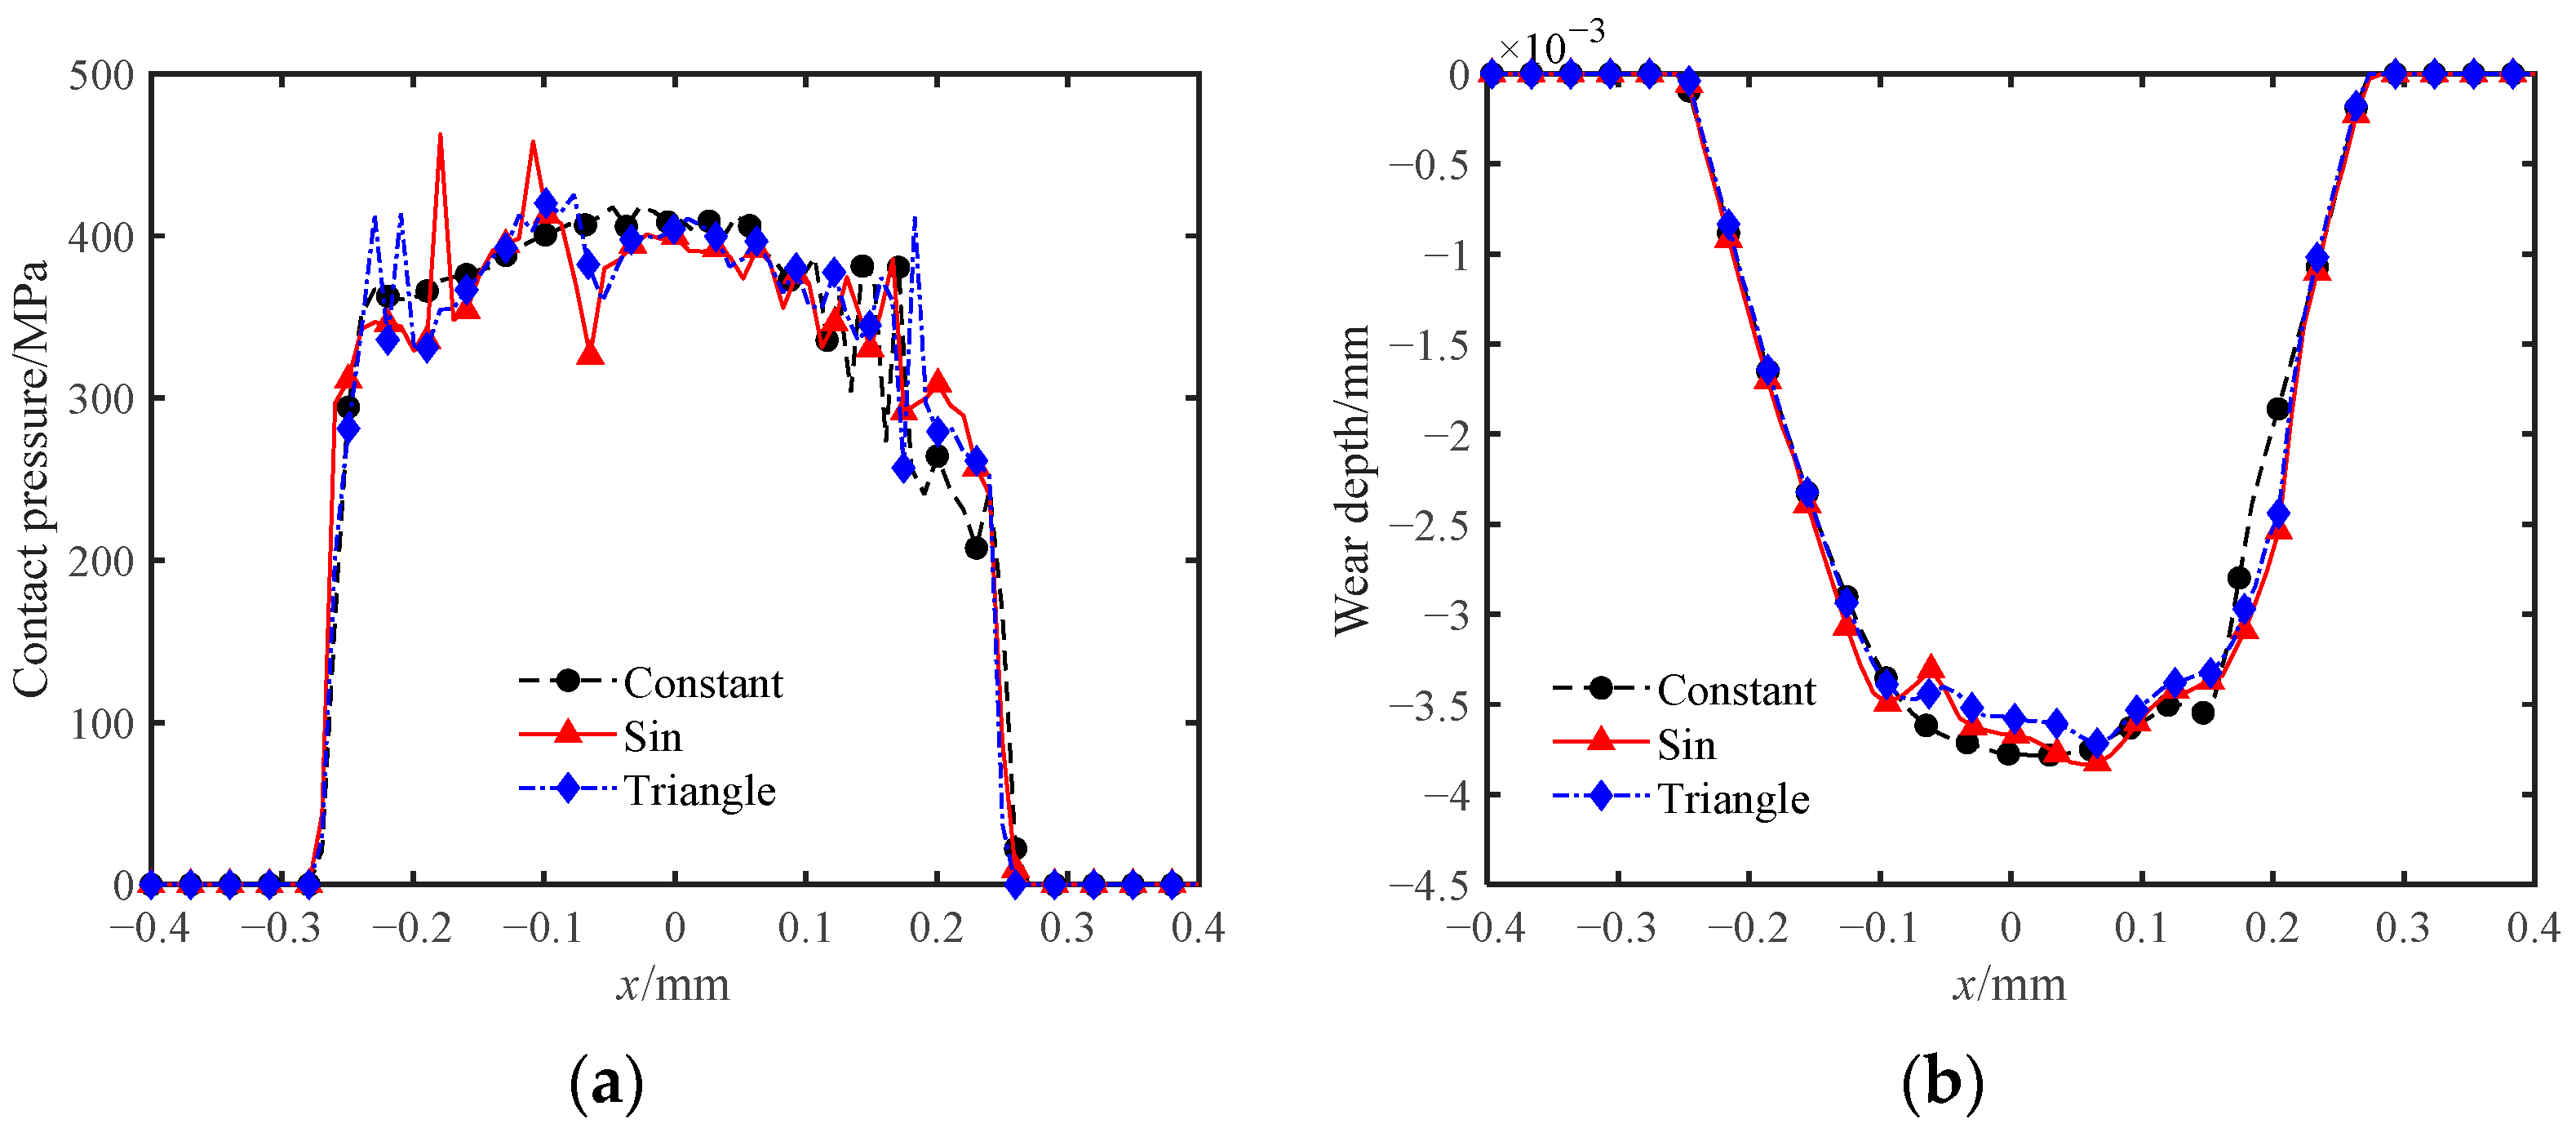
4.5. Effect of Cyclic Normal Load on Wear and Temperature Rise

Fretting damage involves loads in several different directions, and the normal load affects the contact stress distribution. In order to demonstrate the effect of normal load on fretting wear, three different forms of normal load are applied in the model. Namely, the constant normal load, the sin normal load, and the triangle normal load in Figure 4.
Figure 13a shows the contact pressure distribution under different normal loads. At the edge of the contact area, the contact pressure for variable normal loads (sin and triangle normal loads) is almost the same as that for constant normal loads. Near the contact center, the contact pressure for variable normal load varies more. If the peak of the curve is removed, the contact pressure value of the variable normal load is smaller in the left area and just the opposite in the right area. The reason for the above phenomenon is that the variable normal load has the same phase as the tangential displacement. The amplitude of the variable normal load increases when the upper specimen slides to the right (positive direction). On the contrary, the amplitude of the variable normal load decreases when the upper specimen slides to the left (negative direction). The amplitude of the variable normal load is close to the constant normal load when the upper specimen is close to both edges. Moreover, there is a difference between the two curves of the variable normal load, but the location of the contact pressure change is the same. This is because despite having different rates of change (loading forms), the two variable normal loads have the same maximum amplitude and phase values.
The wear depth distributions under the three loads are shown in Figure 13b. From the analysis of the contact pressure, it can be seen that the variable normal load has a small value of contact pressure to the left of the contact center. It can be inferred that the shear stress of the variable normal load is also smaller on the left side of the contact center. Thus, the wear depth of the variable normal load to the left of the contact center is necessarily less than the wear depth of the constant normal load. Similarly, the wear depth of the variable normal load is greater to the right of the contact center than the wear depth of the constant normal load. The figure also exemplifies that the wear depth curve for a constant normal load has only one abrupt change, while the wear depth curve for a variable normal load has multiple abrupt change points. This is also the reason for the large variation in contact pressure for variable normal load.
The temperature distribution on the contact surface under different normal loads is shown in Figure 14. The temperature of the variable normal load is higher than the temperature of the constant normal load throughout the contact surface. When the normal load is variable, the contact surface is depressed due to wear. In this case, frictional heat generation exists not only in the horizontal direction, but also in the vertical direction. Therefore, the temperature of variable normal load is higher. However, the increase in heat is small due to the smaller amount of wear and the small variation in the variable normal load. For the temperature distribution of the variable normal load, near the center of the contact, the temperature of the triangle normal load is slightly greater than the sin normal load. On both sides of the contact area and in the non-contact area, the temperature of the sin normal load is higher since the rate of change of the triangle normal load is constant and the rate of change of the sin normal load is variable. The rate of change of sin normal load is large at the beginning, middle, and end of the cycle. Cases where the rate of change is small (approximately constant) or less than the rate of change of the triangle normal load exist in other time periods. Near the center of the contact, the temperature of the triangular normal load is somewhat larger due to the short action time of the large rate of change.

5. Conclusions

(1)
Utilizing the UMESHMOTION subroutine, a conventional energy dissipation model was modified to account for the interaction between temperature and wear. The plastic deformation of Ti-6Al-4V alloy materials is considered in the development of numerical simulation methods and finite element models of thermal–mechanical–wear coupling. It is possible to obtain the evolution of the contact surface’s temperature rise, contact pressure, and wear volume.
(2)
Wear is reduced when the temperature and plastic deformation of materials are not considered. When the plastic deformation of materials is considered, the temperature of the contact surface is lower and the wear profile is no longer a smooth Hertzian shape.
(3)
The amount of wear increases with an increase in fretting speed. The temperature in the contact area and near the contact area increases with increasing fretting speed. The temperature of the surface near the non-contact area is the highest at a fretting speed of V.
(4)
The amount of wear increases with the number of cycles, whereas the rate of increase in wear decreases. The peak contact pressure decreases with the increase in the number of cycles. The peak temperature rise on the contact surface increases with the number of cycles, and its horizontal position moves with the cylindrical specimen.
(5)
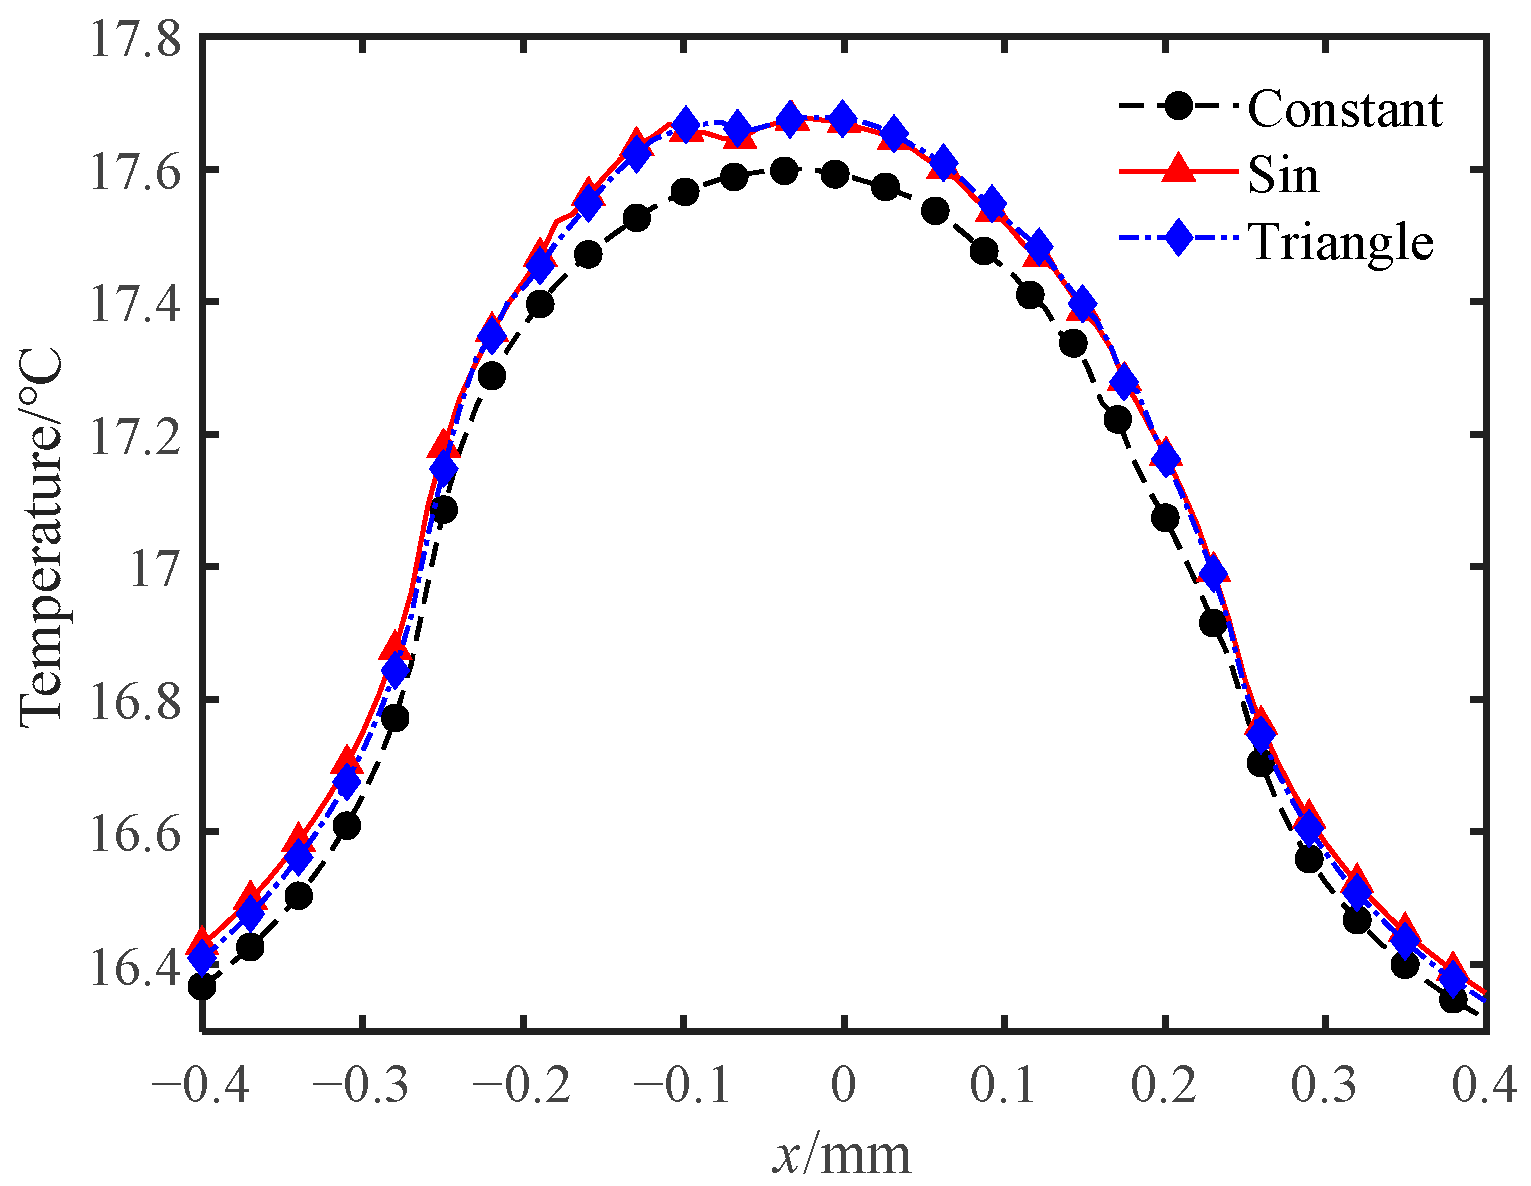
The normal load has an influence on the temperature rise, the contact pressure, and the amount of wear. The wear profile is much less smooth under variable normal loading. Two variable normal loads with the same phase have similar wear profiles and temperature rise distributions.

Author Contributions

Conceptualization, methodology, resources, formal analysis and funding acquisition, L.L. (Ling Li); validation and writing—original draft preparation, W.Z.; software and data curation, G.L.; visualization and editing, J.W.; investigation and funding acquisition, L.L. (Lixia Li); methodology and project administration, M.X. All authors have read and agreed to the published version of the manuscript.

Funding

This work was supported by the National Natural Science Foundation of China (Grant Number 51975449) and the Key Research and Development Program of Shaanxi (Grant Number 2021GY-309). The authors are grateful to other participants of the project for their cooperation.

Institutional Review Board Statement

Not applicable.

Informed Consent Statement

Not applicable.

Data Availability Statement

Not applicable.

Conflicts of Interest

The authors declare no conflict of interest.

References

  1. Waterhouse, R. Fretting wear. Wear 1984, 100, 107–118. [Google Scholar] [CrossRef]
  2. Hills, D.A.; Nowell, D. Mechanics of fretting fatigue—Oxford’s contribution. Tribol. Int. 2014, 76, 1–5. [Google Scholar] [CrossRef]
  3. Pinto, A.L.; Araújo, J.A.; Talemi, R. Effects of fretting wear process on fatigue crack propagation and life assessment. Tribol. Int. 2021, 156, 106787. [Google Scholar] [CrossRef]
  4. Jin, X.; Shipway, P.H.; Sun, W. The role of frictional power dissipation (as a function of frequency) and test temperature on contact temperature and the subsequent wear behaviour in a stainless steel contact in fretting. Wear 2015, 330, 103–111. [Google Scholar] [CrossRef]
  5. Jin, X.; Sun, W.; Shipway, P.H. The role of geometry changes and debris formation associated with wear on the temperature field in fretting contacts. Tribol. Int. 2016, 102, 392–406. [Google Scholar] [CrossRef]
  6. Wang, Y.; Liang, G.; Liu, S.; Cui, Y. Coupling Fractal Model for Fretting Wear on Rough Contact Surfaces. J. Tribol. 2020, 143, 1–32. [Google Scholar] [CrossRef]
  7. Archard, J.F. Contact and Rubbing of Flat Surfaces. J. Appl. Phys. 1953, 24, 981–988. [Google Scholar] [CrossRef]
  8. Fouvry, S.; Kapsa, P.; Vincent, L. Quantification of fretting damage. Wear 1996, 200, 186–205. [Google Scholar] [CrossRef]
  9. Mccoll, I.R.; Ding, J.; Leen, S.B. Finite element simulation and experimental validation of fretting wear. Wear 2004, 256, 1114–1127. [Google Scholar] [CrossRef]
  10. Madge, J.J.; Leen, S.B.; Mccoll, I.R.; Shipway, P.H. Contact-evolution based prediction of fretting fatigue life: Effect of slip amplitude. Wear 2007, 262, 1159–1170. [Google Scholar] [CrossRef]
  11. Ahmadi, A.; Sadeghi, F. A Novel Three-Dimensional Finite Element Model to Simulate Third Body Effects on Fretting Wear of Hertzian Point Contact in Partial Slip. J. Tribol. 2021, 143, 041502. [Google Scholar] [CrossRef]
  12. Gong, W.; Chen, Y.; Li, M.; Kang, R. Coupling fractal model for adhesive and three-body abrasive wear of AISI 1045 carbon steel spool valves. Wear 2019, 418–419, 75–85. [Google Scholar] [CrossRef]
  13. Arnaud, P.; Fouvry, S. A dynamical FEA fretting wear modeling taking into account the evolution of debris layer. Wear 2018, 412–413, 92–108. [Google Scholar] [CrossRef]
  14. Ning, P.; Li, Y.; Feng, Z.Q. A Newton-like algorithm to solve contact and wear problems with pressure-dependent friction coefficients. Commun. Nonlinear Sci. Numer. Simul. 2020, 85, 105216. [Google Scholar] [CrossRef]
  15. Jiang, X.; Pan, F.; Shao, G.; Huang, J.; Hong, J.; Zhou, A. Prediction of electrical contact endurance subject to micro-slip wear using friction energy dissipation approach. Friction 2019, 7, 537–550. [Google Scholar] [CrossRef] [Green Version]
  16. Li, L.; Wei, Z.; Ma, S.; Li, L.; Xie, M. Numerical analysis of fretting wear in lateral contact of sphere/sphere. Proc. Inst. Mech. Eng. Part J J. Eng. Tribol. 2021, 235, 2073–2085. [Google Scholar] [CrossRef]
  17. Pearson, S.R.; Shipway, P.H.; Abere, J.O.; Hewitt, R.A.A. The effect of temperature on wear and friction of a high strength steel in fretting. Wear 2013, 303, 622–631. [Google Scholar] [CrossRef]
  18. Qin, W.; Jin, X.; Kirk, A.; Shipway, P.; Sun, W. Effects of surface roughness on local friction and temperature distributions in a steel-on-steel fretting contact. Tribol. Int. 2018, 120, 350–357. [Google Scholar] [CrossRef]
  19. Shen, F.; Zhou, K. Investigation on thermal response in fretting sliding with the consideration of plastic dissipation, surface roughness and wear. Int. J. Mech. Sci. 2018, 148, 94–102. [Google Scholar] [CrossRef]
  20. Jr, C.; Sanders, J.; Sharma, S.; Voevodin, A.; Segall, A. The effect of temperature on gross slip fretting wear of cold-sprayed nickel coatings on Ti6Al4V interfaces. Tribol. Int. 2009, 42, 491–502. [Google Scholar]
  21. Hager, C.H.; Sanders, J.H.; Sharma, S. Unlubricated gross slip fretting wear of metallic plasma-sprayed coatings for Ti6Al4V surfaces. Wear 2008, 265, 439–451. [Google Scholar] [CrossRef]
  22. Fouvry, S.; Arnaud, P.; Mignot, A.; Neubauer, P. Contact size, frequency and cyclic normal force effects on Ti-6Al-4V fretting wear processes: An approach combining friction power and contact oxygenation. Tribol. Int. 2017, 113, 460–473. [Google Scholar] [CrossRef]
  23. Majzoobi, G.H.; Abbasi, F. On the effect of shot-peening on fretting fatigue of Al7075-T6 under cyclic normal contact loading. Surf. Coat. Technol. 2017, 238, 292–303. [Google Scholar] [CrossRef]
  24. Abbasi, F.; Majzoobi, G.H. An investigation into the effect of elevated temperatures on fretting fatigue response under cyclic normal contact loading. Theor. Appl. Fract. Mech. 2018, 93, 144–154. [Google Scholar] [CrossRef]
  25. Bhatti, N.A.; Wahab, M.A. Fretting fatigue damage nucleation under out of phase loading using a continuum damage model for non-proportional loading. Tribol. Int. 2018, 121, 204–213. [Google Scholar] [CrossRef]
  26. Li, L.; Tian, H.; Yun, Q.; Chu, W. Study on temperature rise distribution of contact surface under cyclic load. Proc. Inst. Mech. Eng. Part J J. Eng. Tribol. 2020, 235, 135065012091987. [Google Scholar] [CrossRef]
  27. Cam, G.; Flower, H.M.; West, D.R.F. Constitution of Ti-Al-C alloys in temperature range 1250–750 °C. Mater. Sci. Technol. 1991, 7, 505–511. [Google Scholar] [CrossRef]
  28. Nguyen, H.D.; Pramanik, A.; Basak, A.K.; Dong, Y.; Prakash, C.; Debnath, S.; Shankar, S.; Jawahir, I.S.; Dixit, S.; Buddhi, D. A critical review on additive manufacturing of Ti-6Al-4V alloy: Microstructure and mechanical properties. J. Mater. Res. Technol. 2022, 18, 4641–4661. [Google Scholar] [CrossRef]
  29. Çam, G.; Koçak, M.; Dos Santos, J.F. Developments in laser welding of metallic materials and characterization of the joints. Weld. World 1999, 43, 13–26. [Google Scholar]
  30. Wang, L.; Zhang, Q.Y.; Li, X.X.; Cui, X.; Wang, S. Severe-to-Mild Wear Transition of Titanium Alloys as a Function of Temperature. Tribol. Lett. 2014, 53, 511–520. [Google Scholar] [CrossRef]
  31. Pereira, K.; Yue, T.; Wahab, M.A. Multiscale analysis of the effect of roughness on fretting wear. Tribol. Int. 2017, 110, 222–231. [Google Scholar] [CrossRef] [Green Version]
  32. Yue, T.; Wahab, M.A. Finite element analysis of fretting wear under variable coefficient of friction and different contact regimes. Tribol. Int. 2017, 107, 274–282. [Google Scholar] [CrossRef]
  33. Basseville, S.; Missoum-Benziane, D.; Cailletaud, G. 3D finite element study of the fatigue damage of Ti-6Al-4V in presence of fretting wear. Comput. Mech. 2019, 64, 663–683. [Google Scholar] [CrossRef]
  34. Holman, J.P. Heat Transfer; Mechanical Industry Press: Beijing, China, 2005. [Google Scholar]
  35. Handbook, M. MIL-HDBK-5H: Metallic Materials and Elements for Aerospace Vehicle Structures; US Department of Defense: Fort Lee, VA, USA, 1998. [Google Scholar]
  36. Yang, J.; Sun, S.; Brandt, M.; Yan, W. Experimental investigation and 3D finite element prediction of the heat affected zone during laser assisted machining of Ti6Al4V alloy. J. Mater. Process. Technol. 2010, 210, 2215–2222. [Google Scholar] [CrossRef]
  37. Shen, F.; Hu, W.; Meng, Q. A damage mechanics approach to fretting fatigue life prediction with consideration of elastic–plastic damage model and wear. Tribol. Int. 2015, 82, 176–190. [Google Scholar] [CrossRef]
Figure 1. Fitting effect of energy wear coefficient.
Applsci 12 07400 g001
Figure 2. Numerical simulation flow sketch.
Applsci 12 07400 g002
Figure 3. Finite element model of cylinder-on-flat contact.
Applsci 12 07400 g003
Figure 4. Loading history. (a) Constant normal load; (b) sine normal load; (c) triangular normal load.
Applsci 12 07400 g004
Figure 5. Verification of finite element model. (a) Comparison of contact pressure; (b) comparison of wear depths.
Applsci 12 07400 g005
Figure 6. Effect of plastic deformation of materials on contact pressure and wear depth. (a) Contact pressure; (b) wear depth.
Applsci 12 07400 g006
Figure 7. Temperature distribution when considering plasticity. (a) Temperature distribution; (b) variation pattern of temperature.
Applsci 12 07400 g007
Figure 8. Effect of temperature on contact pressure and wear depth. (a) Contact pressure; (b) wear depth.
Applsci 12 07400 g008
Figure 9. Variation of contact pressure and wear depth with the number of cycles. (a) Contact pressure; (b) wear depth.
Applsci 12 07400 g009
Figure 10. Variation pattern of temperature distribution with the number of cycles.
Applsci 12 07400 g010
Figure 11. Variation pattern of contact pressure and wear depth with fretting speed. (a) Contact pressure; (b) Wear depth.
Applsci 12 07400 g011
Figure 12. Variation pattern of temperature distribution with fretting speed.
Applsci 12 07400 g012
Figure 13. Variation of contact pressure and wear depth with normal load. (a) Contact pressure; (b) wear depth.
Applsci 12 07400 g013
Figure 14. Variation law of temperature distribution with normal load.
Applsci 12 07400 g014
Table 1. Ti-6Al-4V material parameters [35].
ParameterValue
E0 (MPa)114,582
Es (MPa/°C)−97.6
σy0 (MPa)927.3
σys (MPa/°C)−0.908
v0.34
Coefficient of thermal expansion αT8.7 × 10−6
T025
Table 2. Physical properties of Ti-6Al-4V with temperature [36].
Temperature (°C)Thermal Conductivity (W/(m °C))Specific Heat (J/kg °C)Density (kg/m3)
2575464420
1007.455624406
2008.755844395
30010.156064381
Publisher’s Note: MDPI stays neutral with regard to jurisdictional claims in published maps and institutional affiliations.

